
Technical Analysis
BTC/USDT
As tensions continue between the White House and court rulings on US trade policy, the latest judicial ruling on tariffs is expected to be overturned on appeal. White House officials say the Trump administration continues to prepare for new trade deals. In addition to these developments, the $11.7 billion Bitcoin and Ethereum options expiring on Deribit on May 30 indicate that volatility may increase in crypto markets. On the macro side, US unemployment claims were slightly above expectations in the data set. The third day of the Bitcoin 2025 conference will be followed later in the day.
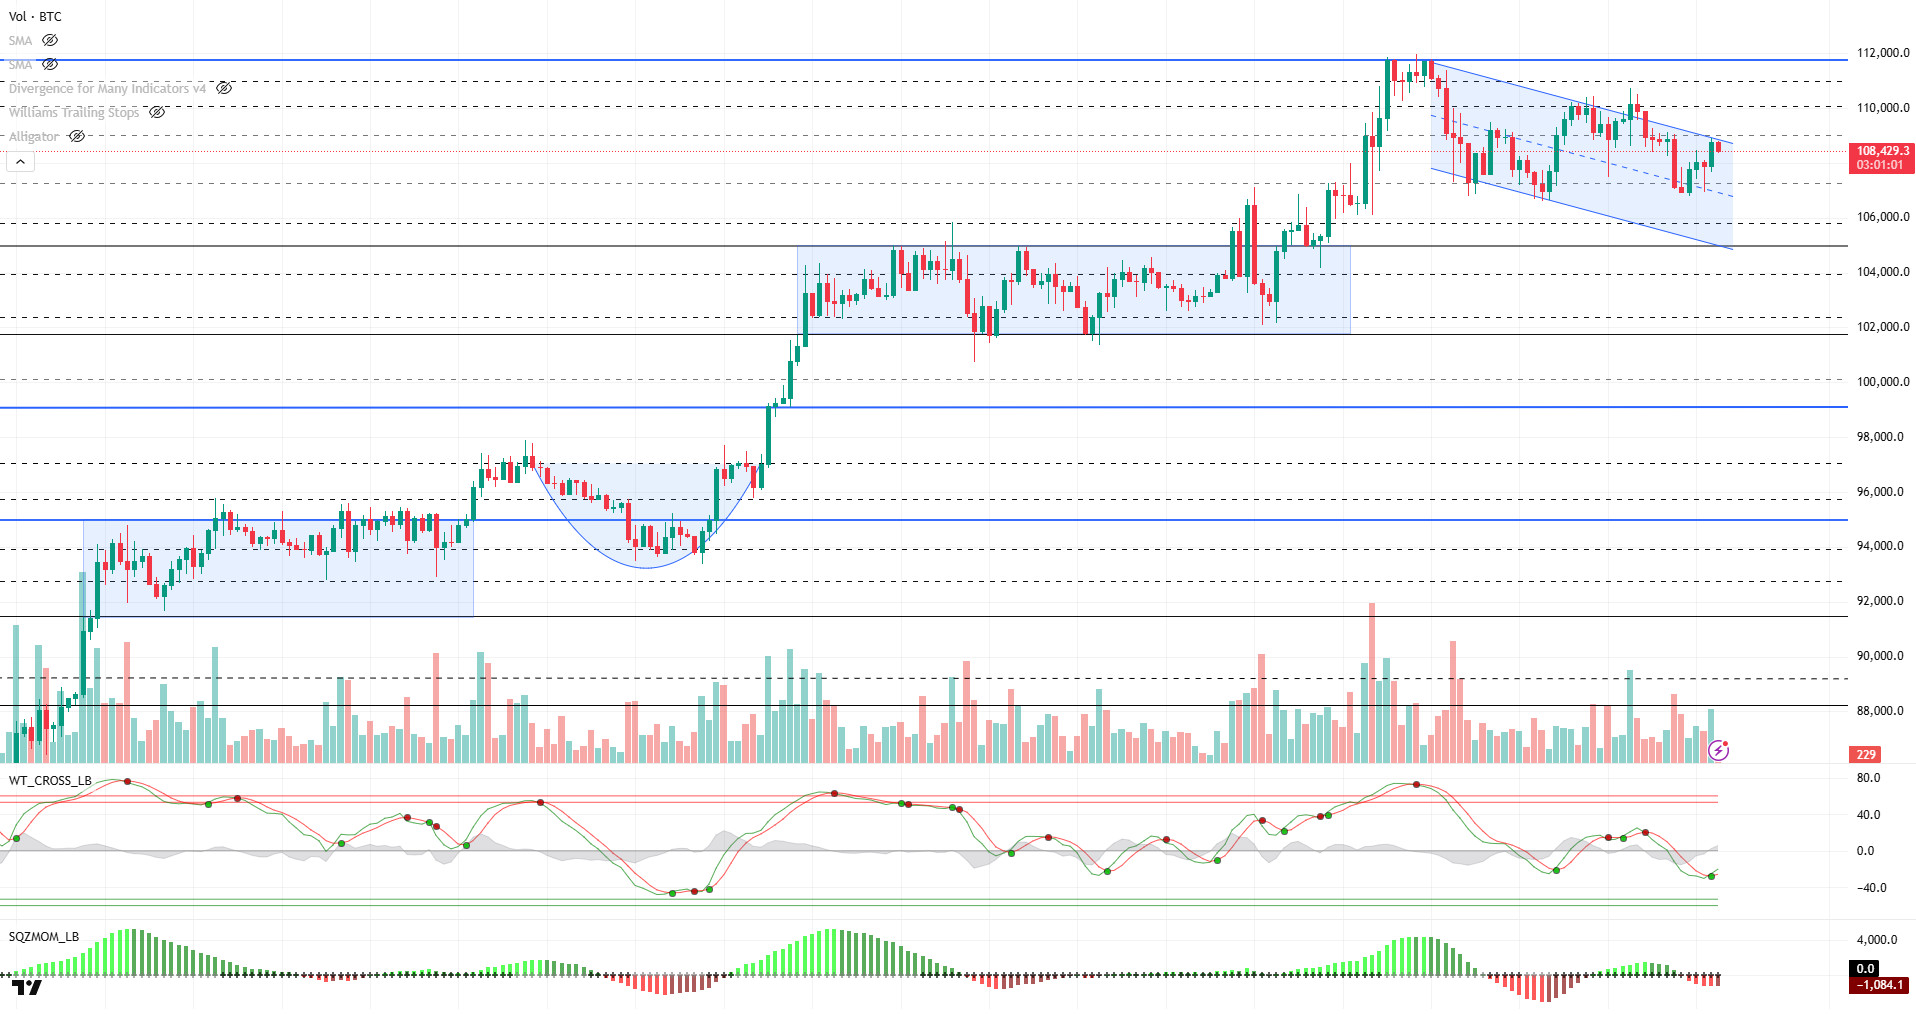
When we look at the technical outlook with the latest developments, it is seen that the BTC price has recovered somewhat by reacting from the 107,300 support level, but continues its movement within the falling trend structure. The price, which touched the upper line of the trend, has turned its direction down again by failing to exceed this level. While it is noteworthy that the technical oscillator gives a buy signal before reaching the oversold zone, momentum indicators remain indecisive by not giving a clear direction and show that price movements are sensitive to fundamental developments. The rise without liquidity cleaning, which we emphasized in previous analyzes, does not support a permanent break in the technical structure for the moment. This shows that it is too early to say that the bearish movement has ended. The fact that the technical structure has not yet been broken indicates that the rise may remain limited as long as the price remains below the falling trend line. In order to talk about an upward movement, the falling trend structure needs to be broken on volume and hourly closes above the 109,000 level. On the other hand, if the downward movement continues, the 107,300 level will be followed as a support point again. If this level is broken, the 105,800 level, which is the liquidity zone, may come to the agenda.
Supports 107,300 – 105,800 -105,000
Resistances 109,000 – 110,000 – 111,960
ETH/USDT
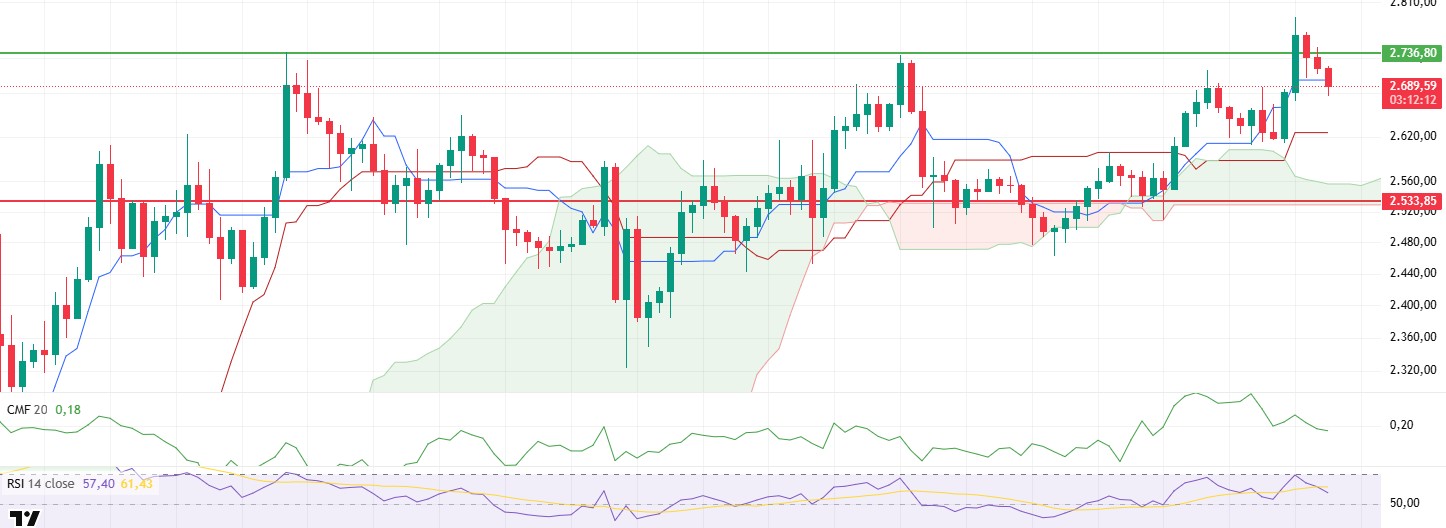
ETH retreated with the selling pressure it experienced during the day and fell below the Tenkan level, one of the important short-term indicators of the Ichimoku Cloud. The decline below the $2,736 level, which stood out as critical support in the analysis made in the morning hours, signaled that the technical weakness deepened. This decline coincides with the negative divergence observed especially in the Chaikin Money Flow (CMF) indicator. The continued decline in CMF indicates that the amount of liquidity entering the market has decreased and fund outflows continue. This indicates that the pressure on the price may continue. Technical indicators generally point to short-term weakness. Apart from CMF, the Relative Strength Index (RSI) indicator also continues its downward trend and approaches below the neutral zone, confirming the decline in momentum. This weakening in the RSI suggests that buyers are losing strength and the price may test lower levels. In addition, the price breaking below the Tenkan level can be considered as another technical confirmation that the short-term trend has turned negative.
In light of all these technical data, the market is likely to continue its downward movement in the short term. Especially if there is no recovery in the US markets later in the day, it is likely that the sales will deepen, and the price will test lower support levels. On the other hand, if the ETH price rallies back above the $2,736 level and closes above this region, this could signal the start of an uptrend despite technical weakness. Therefore, the $2,736 level is a critical threshold for both short-term direction and market perception.
Supports 2,533 – 2,254 – 2,029
Resistances 2,736 – 3,062- 3,246
XRP/USDT
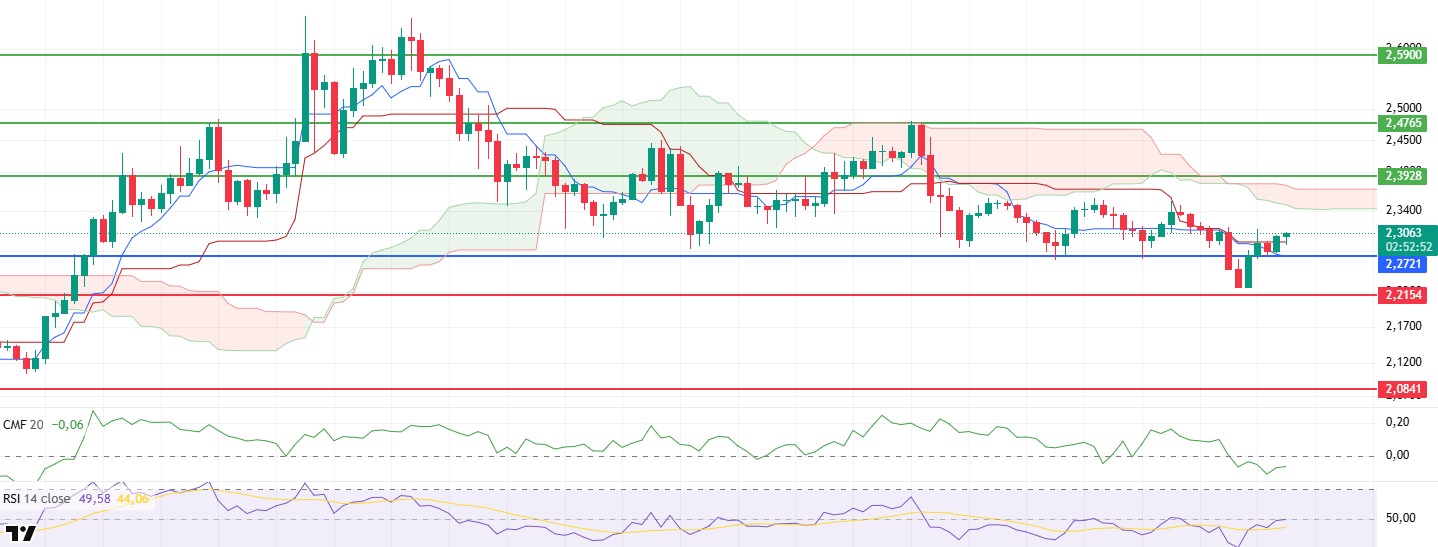
XRP managed to hold above the intermediate support at $2.27 during the day and followed a sideways positive trend and is currently pricing at $2.29. Technical indicators have started to signal a slight recovery to support the current price action.
In particular, the upward trend in the Chaikin Money Flow (CMF) indicator indicates some improvement in market liquidity. However, the fact that this indicator is still in negative territory suggests that the funds entering the market are not strong enough and the current improvement should be evaluated cautiously. On the Relative Strength Index (RSI) side, a clearer recovery signal is observed. The RSI’s rise above the based MA line indicates that bullish momentum has started to increase and buyers are gradually returning to the market. This development can be considered as a supportive factor in terms of short-term positive price movements. When the Ichimoku indicator is analyzed, the fact that the price has risen above both Tenkan and Kijun levels indicates a positive technical outlook. This situation reveals that the market has an upward trend in the short term and has started to gain strength in the trend direction. In particular, the persistence of the price above the Kijun level is critical for the continuation of the upward movement.
Considering the current technical data, if the XRP price continues to hold above the Kijun level, the uptrend is likely to gain momentum and continue towards the lower band of the Ichimoku cloud towards the $2.34 levels. However, on the other hand, if the intermediate support level of $2.27 is lost, the price may fall back to $2.21 support with the increase in selling pressure.
Supports 2.2154 – 2.0841 – 2.0402
Resistances 2.3928 – 2.4765 – 2.5900
SOL/USDT
SOL Strategies filed an initial prospectus to raise up to $1 billion in funding to expand its Solana investment. DeFi Development Corp. announced that it has integrated liquid staking token (LST) technology into its treasury operations using a specialized LST called dfdvSOL.
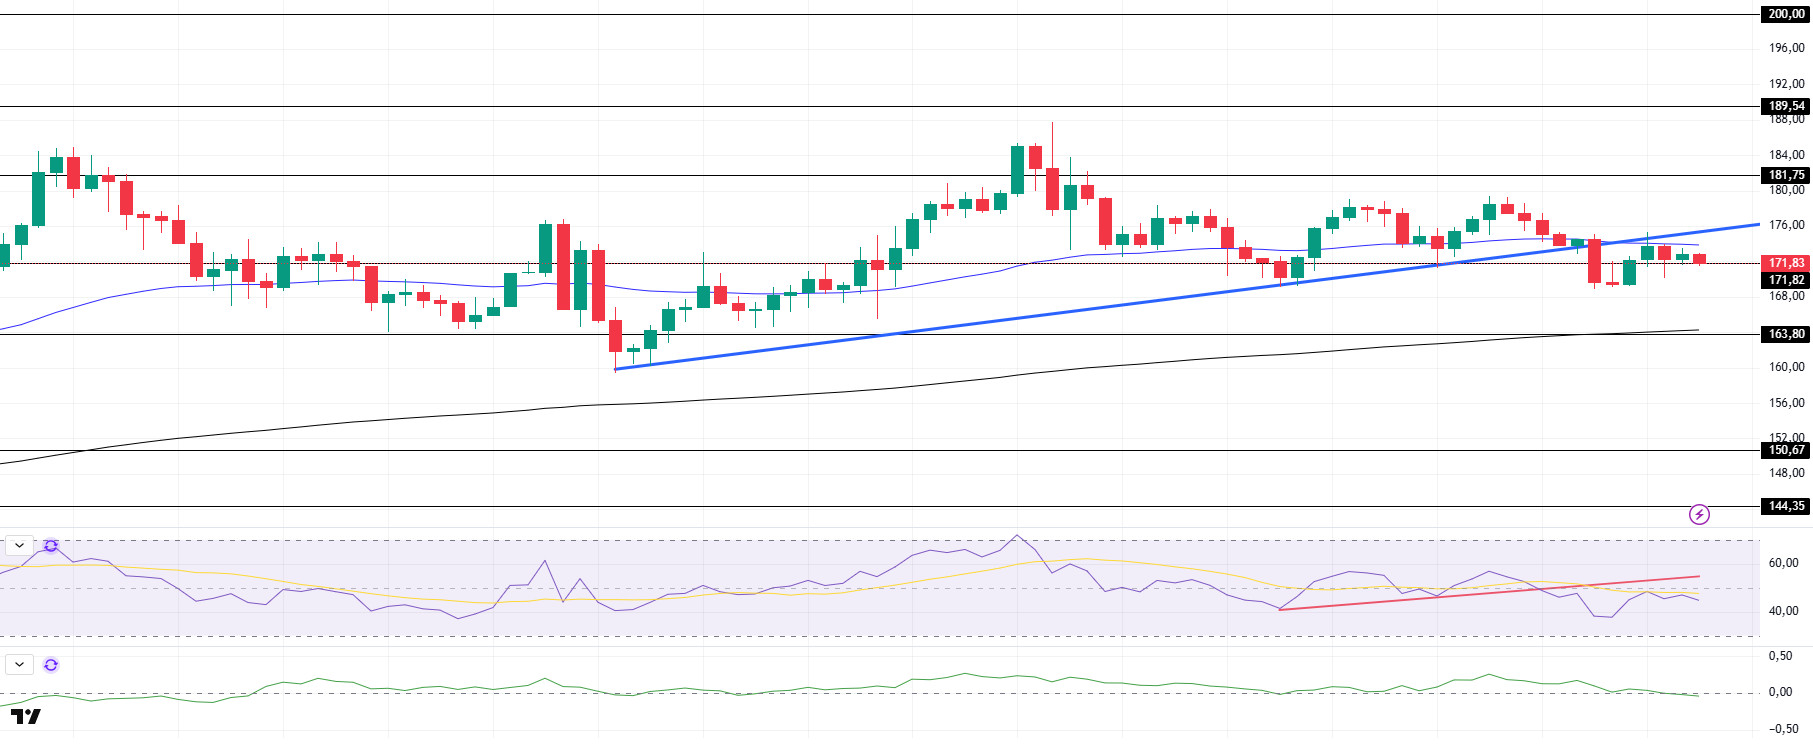
The SOL price depreciated during the day. The asset continues to accumulate in the range of $163.80 and $181.75. The price continues to hover below the uptrend that started on May 19 and is currently testing the 50 EMA (Blue Line) as resistance. If it fails to break it, the $163.80 level may be triggered. On the 4-hour chart, the 50 EMA (Blue Line) continued to hold above the 200 EMA (Black Line) . This suggests that the uptrend may continue in the medium term. However, the fact that the price is between both moving averages suggests that the market is currently in a decision-making phase. Chaikin Money Flow (CMF-20) is at a neutral level; in addition, a decline in daily inflows may move CMF into negative territory. Relative Strength Index (RSI-14) continued to be in negative territory again. It also remains below the uptrend that started on May 25. This indicates an increase in selling pressure. The $181.75 level stands out as a strong resistance point in the event of a rally on the back of macroeconomic data or positive news on the Solana ecosystem. If this level is broken upwards, the rise can be expected to continue. If there are pullbacks due to contrary developments or profit realizations, the $163.80 level may be retested. In case of a decline to these support levels, the increase in buying momentum may offer a potential bullish opportunity.
Supports 171.82 – 163.80 – 150.67
Resistances 181.75 – 189.54 – 200.00
DOGE/USDT
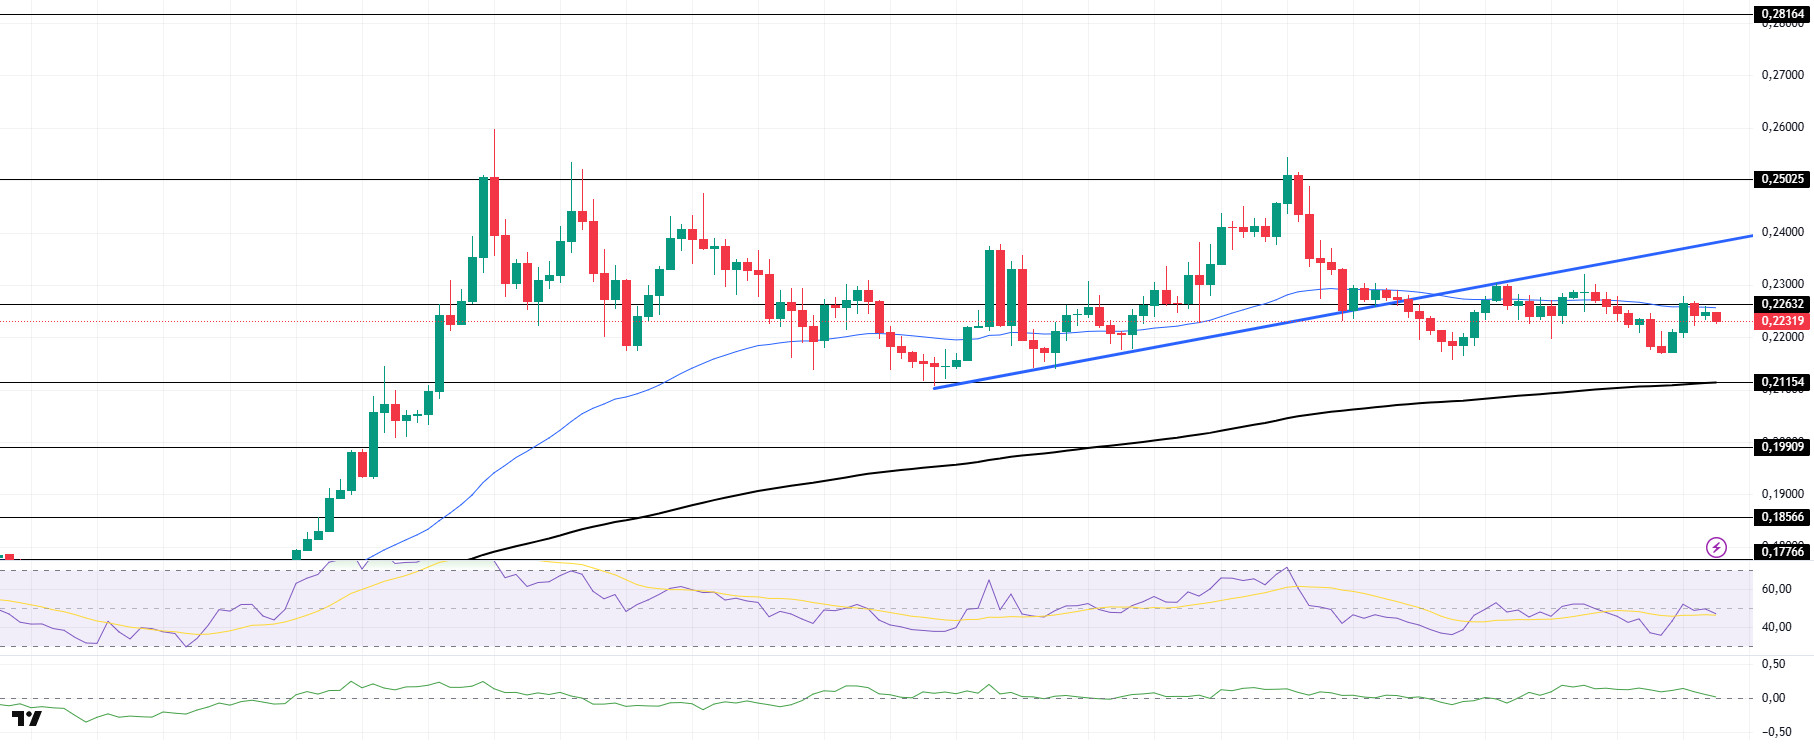
DOGE price followed a sideways trend during the day. The asset remained below the 50 EMA (Blue Line) and the uptrend that started on May 17. The price is currently testing the 50 EMA moving average as resistance. In case it fails to break it, the strong support at $0.21154 may be triggered. On the 4-hour chart, the 50 EMA (Blue Line) continued to be above the 200 EMA (Black Line). The fact that the price remains between the two moving averages suggests that it is in the decision phase in the short term. The Chaikin Money Flow (CMF-20) indicator is in positive territory. In addition, negative money inflows may move CMF into negative territory. Relative Strength Index (RSI-14), on the other hand, moved into negative territory and signaled increased selling pressure. The $0.25025 level stands out as a strong resistance zone in case of possible rises in line with political developments, macroeconomic data or positive news flow in the DOGE ecosystem. In the opposite case or possible negative news flow, the $0.21154 level may be triggered. In case of a decline to these levels, the increase in momentum may start a new bullish wave.
Supports 0.21154 – 0.19909 – 0.18566
Resistances 0.22632 – 0.25025 – 0.28164
Legal Notice
The investment information, comments and recommendations contained herein do not constitute investment advice. Investment advisory services are provided individually by authorized institutions taking into account the risk and return preferences of individuals. The comments and recommendations contained herein are of a general nature. These recommendations may not be suitable for your financial situation and risk and return preferences. Therefore, making an investment decision based solely on the information contained herein may not produce results in line with your expectations.


