
Technical Analysis
BTC/USDT
As tensions in the Middle East continue to escalate, Israel’s attacks against Iran have entered a new phase. While the killing of the Chief of Staff of the Iranian Armed Forces increased the tension in the region, US President Trump called the National Security Council for an emergency meeting. On the other hand, there is an important day for crypto markets in Washington; The final vote of the GENIUS Act in the Senate will be held today and if the bill is accepted, it is expected to be sent to the House of Representatives. Although there are no developments in the data set on the last day before the Fed rate meeting, the Genius Act and Trump’s council meeting will be followed today.
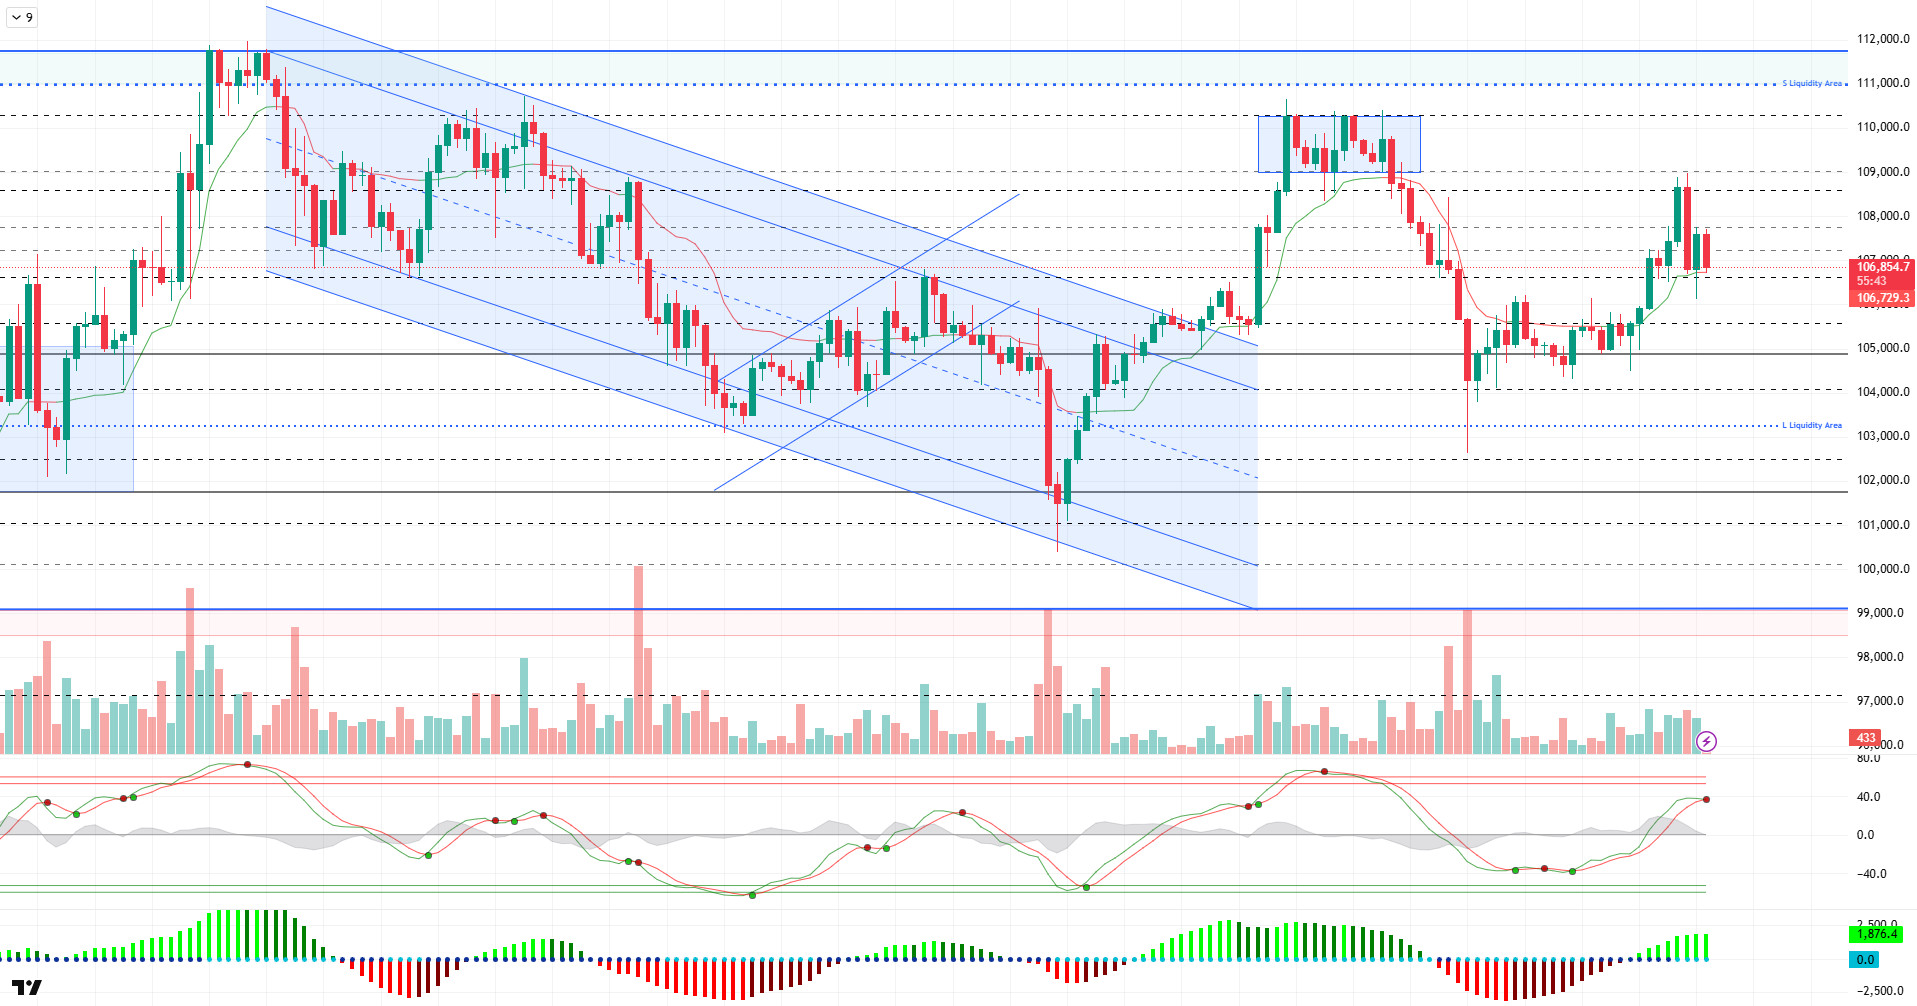
When we look at the technical outlook after the latest developments, BTC made a minor bullish move yesterday, pinning the 109,000 level. Then, BTC, which faced selling pressure with the increase in volatility, turned its direction sharply downwards. At the time of writing, it is trading at 106,800, just above the 106,600 support level.
Technical indicators suggest that yesterday’s bullish outlook has been replaced by a more cautious one today. Wave trend oscillator has started to generate a sell signal in the overbuy zone. The Squeeze momentum indicator is still in positive territory and exhibits a negative mismatch with the indicators. The Kaufman moving average is just below the price at 106,700, making this area a short-term support. The fact that the ER (Efficiency Ratio) value, which measures trend strength, has fallen to 0.0 is another technical sign supporting the downtrend.
Looking at the liquidity data, it is seen that there was no liquidation towards the ATH level during yesterday’s rally, but investors closed some of their positions. Currently, the largest liquidity accumulation is in buy positions in the 102,000 – 103,500 band. This suggests that these levels could be targeted in a possible sharp pullback.
In general, technical indicators put pressure on the price, while liquidity data also supports this scenario. However, a limited recovery may be seen later in the day due to the impact of the above-mentioned fundamental developments. In this case, the 106,600 – 107,300 band is important as a reference range for the price’s effort to stay in the positive zone. The bowl-and-handle pattern formed in terms of technical structure also indicates that the price may prepare for an upward acceleration. In the opposite scenario, the 105,850 – 105,000 band will be monitored as support, and if this level is broken, the price is likely to turn to deeper liquidity areas.
Supports 106,600 – 105,850 – 105,000
Resistances 107,300 – 108,600 – 110,000
ETH/USDT
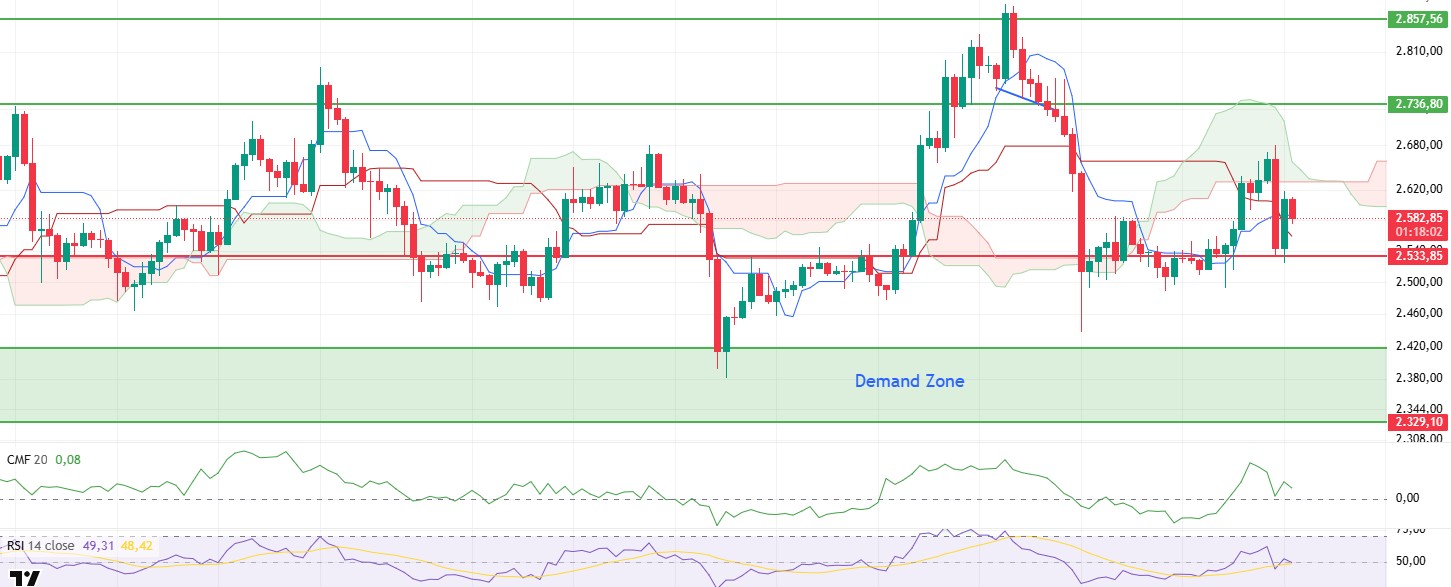
After rising as high as $2,681 yesterday evening, ETH suffered a sharp sell-off as tensions between Iran and Israel escalated, dropping as low as $2,533. With the purchases from this region, the price recovered again and rose to $2,618, but the increasing geopolitical risks caused a cautious mood in the markets again and ETH is currently trading around $2,580.
Analysing the technical indicators, the Cumulative Volume Delta (CVD) is close to the zero line with the recent decline. This indicates a meaningful liquidity outflow from the market. Since the CVD is still in the positive zone, there is no clear signal that the trend has changed in terms of the overall structure, but if it moves into the negative zone, selling pressure can be expected to deepen and the price may retreat to lower levels.
On the Ichimoku indicator, the rejection of the price from the lower boundary of the cloud indicates a weak short-term outlook. On the other hand, the tenkan line crossing the kijun line to the upside could be interpreted as a short-term recovery signal. This intersection may allow the price to move back into or above the cloud if geopolitical tensions ease. In this respect, it seems that news flow will be as decisive as price movements.
The Relative Strength Index (RSI), on the other hand, remains below the moving average line, suggesting that the market lacks momentum and that buyers have not yet stepped in strongly. This weak outlook on the RSI suggests that upside attempts may remain limited.
Overall, both RSI and CMF indicators suggest that downward pressure may continue in the short term. If the price fails to break above the $2.631 level permanently, a new pullback towards the $2.533 range may be on the agenda. However, if the short-term buy signal on the Ichimoku side remains valid and the price heads towards the cloud zone again, it may be possible for the upward movement to gain momentum and strengthen the positive trend. At this point, it is critical to closely monitor both technical developments and geopolitical news flow.
Top of Form
Below the Form
Supports 2,533 – 2,329 – 2,130
Resistances 2,736 – 2,857 – 3,062
XRP/USDT
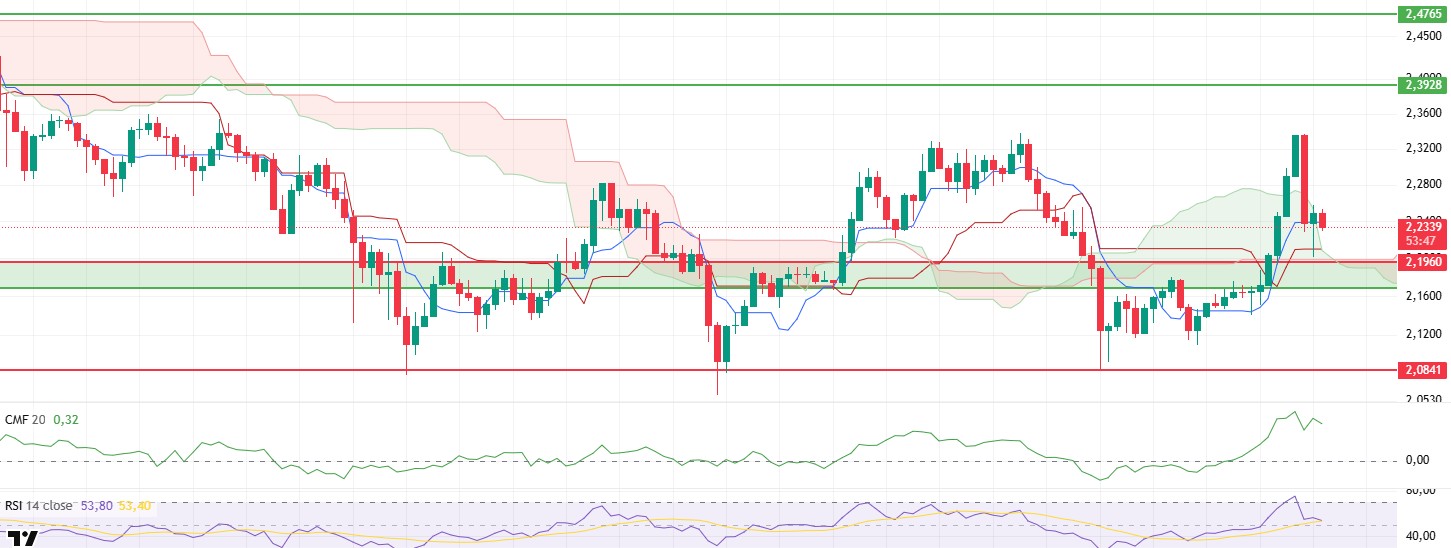
XRP moved in line with the scenario predicted in last night’s analysis and managed to break the upper band of the sand cloud and rose as high as $2.33. However, the escalation of geopolitical tensions between Iran and Israel in the same hours led to a general wave of selling in the cryptocurrency market. This also affected XRP, causing the price to retreat sharply and fall as low as $2.19. With the purchases coming from this support zone, XRP has recovered again and is currently trading at $2.23, rising above the kumo cloud again.
Technical indicators generally continue to paint a positive picture despite the price decline. The Chaikin Money Flow (CMF) indicator, in particular, remained in positive territory despite the sharp pullback, showing only a limited retracement. This outlook suggests that there was no significant liquidity outflow from the market during the downturn and investors largely held their positions. The fact that CMF remained in positive territory is a signal that the declines were met with reaction buying and that buyers are still in control of the market.
Looking at the Ichimoku indicator, the fact that the XRP price continues to be positioned above the kumo cloud offers a technically positive outlook. In addition, the price hovering above both tenkan and kijun levels indicates that the short and medium-term trend is in the direction of buying. This structure indicates that the technical basis for the upward movement is preserved and stands out as a supportive factor for the continuation of the potential rise.
In the general outlook, it can be said that we are going through a process where the impact of geopolitical risks on the price will be decisive. Unless there is a possible negative news flow during the day, XRP can be expected to continue its upward movement with the support offered by technical indicators. However, in the opposite case, that is, if there is a renewed increase in risk in the markets, the $2.19 level should be monitored as a strong support. Since this level is the region where previous reaction purchases came from, it can be considered as an important ground that can rebalance the price if selling pressure increases.
Supports 2.1960 – 2.0841 – 1.6309
Resistances 2.3928 – 2.4765- 2.5900
SOL/USDT
Coinshares moves to launch the Solana ETF.
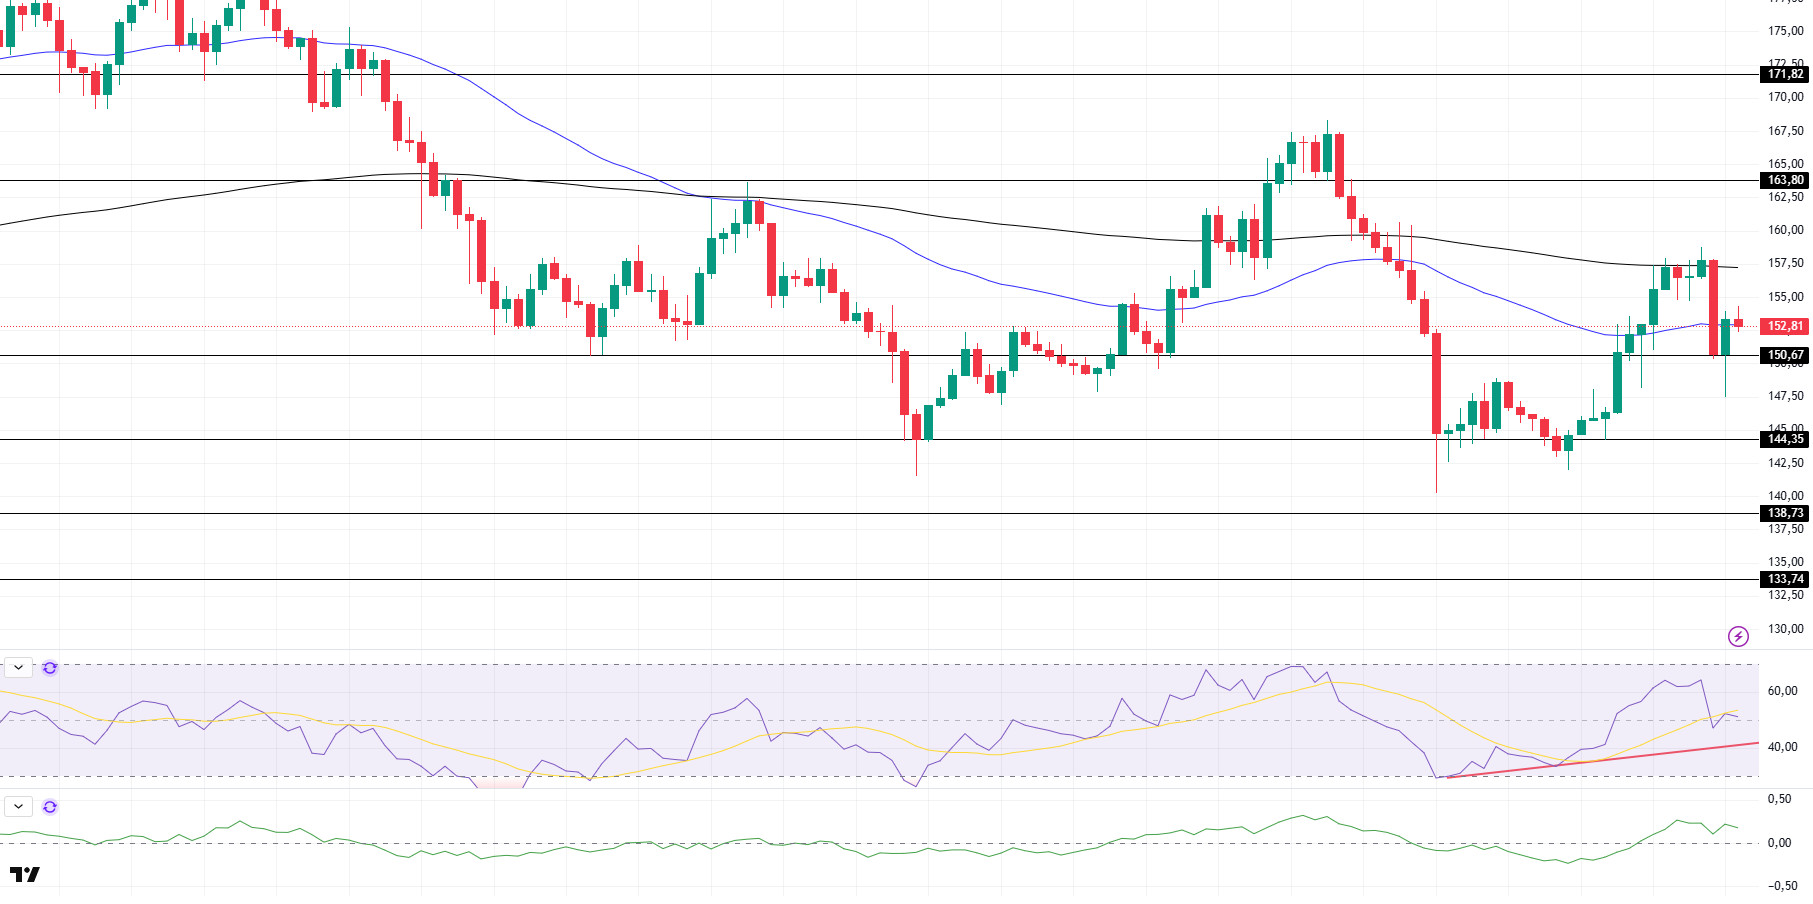
SOL price was bearish. The asset tested the 200 EMA moving average, a strong resistance, but failed to break it and retreated. The price found support at the $150.67 level and rose slightly from there, currently testing the 50 EMA moving average as support. On closes below this level, the $144.35 level can be followed. If the upward movement continues, the strong resistance level of $163.80 can be triggered.
On the 4-hour chart, the 50 EMA continued to be below the 200 EMA. This suggests that the bearish trend may continue in the medium term. At the same time, the fact that the price is between both moving averages suggests that the market is currently in a short-term decision-making phase. Chaikin Money Flow (CMF-20) crossed into positive territory; in addition, a decrease in daily inflows may move CMF into negative territory. Relative Strength Index (RSI-14) is at a neutral level. On the other hand, it continues to be above the uptrend that started on June 13. It may continue this uptrend. In case of an uptrend due to macroeconomic data or positive news on the Solana ecosystem, the $ 163.80 level stands out as a strong resistance point. If this level is broken upwards, the rise can be expected to continue. If there are pullbacks due to contrary developments or profit realizations, the $150.67 level may be retested. In case of a decline to these support levels, the increase in buying momentum may offer a potential bullish opportunity.
Supports 150.67 – 144.35 – 138.73
Resistances 163.80 – 171.82 – 181.75
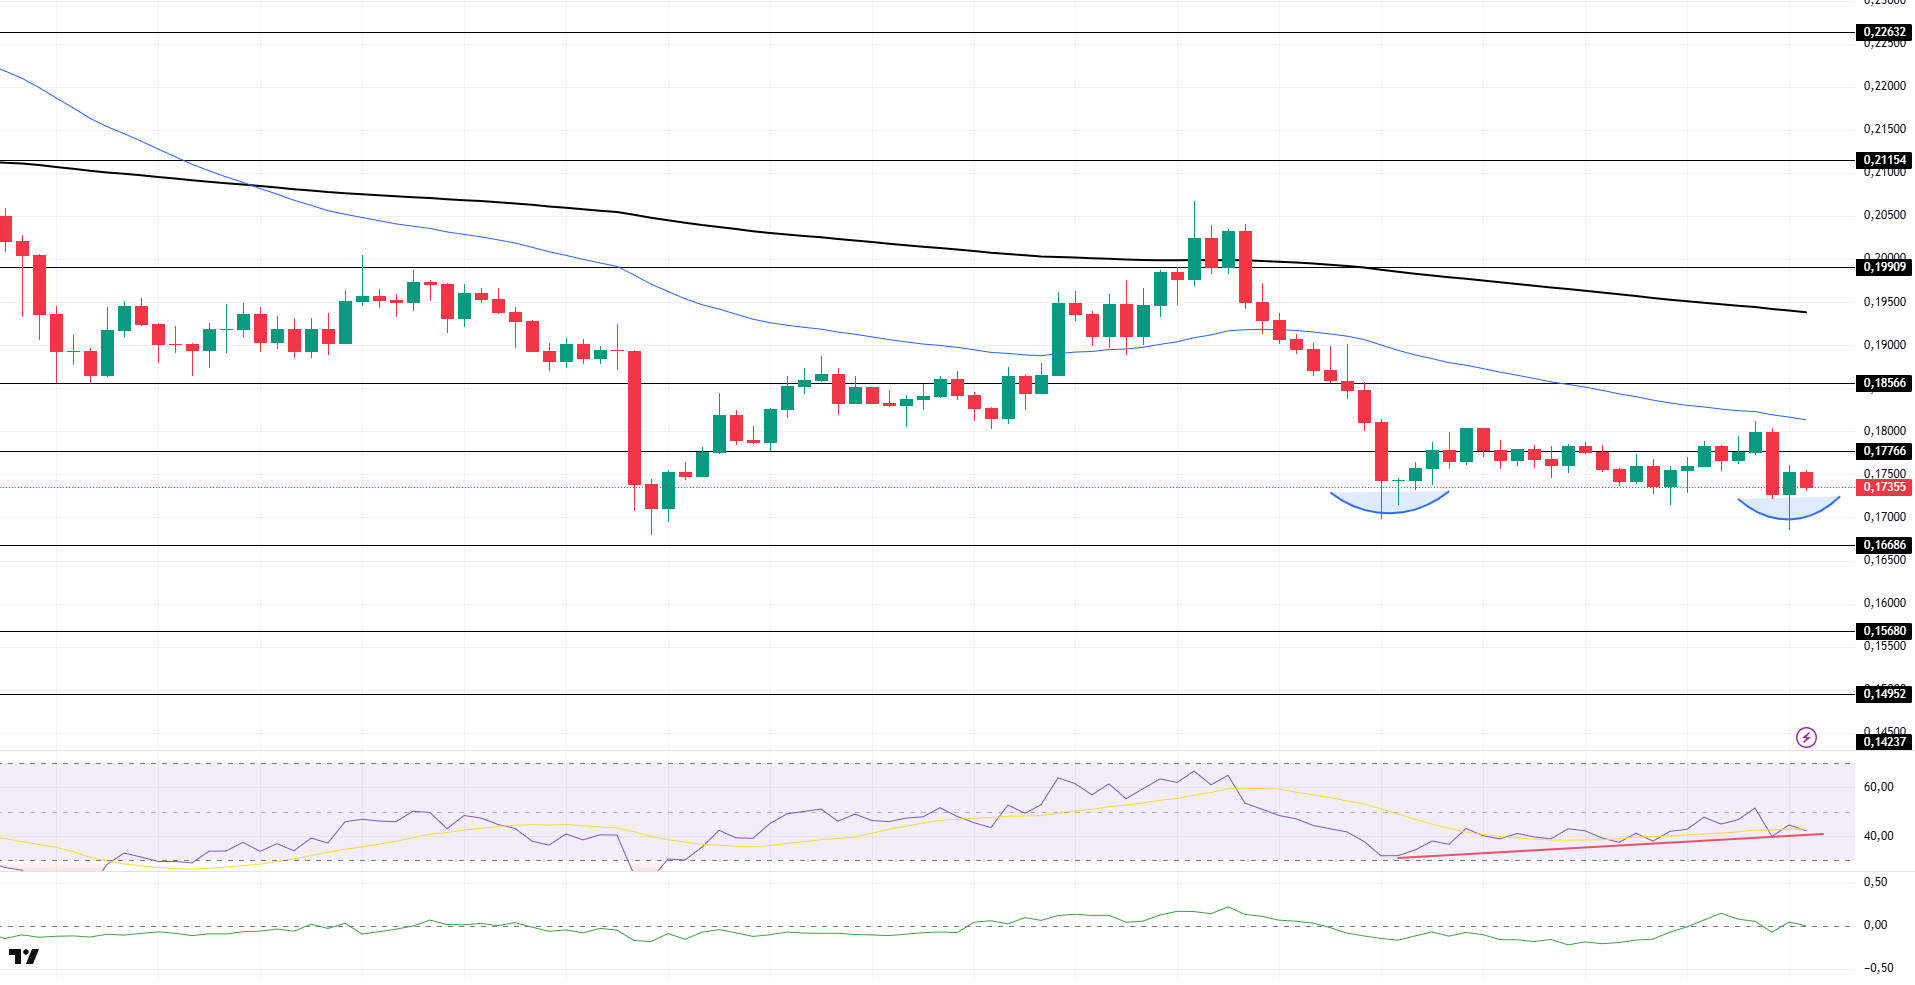
DOGE/USDT
DOGE price experienced a decline. Failing to break the 50 EMA (Blue Line), the place of strong resistance, the asset fell about 4% from here and failed to stay above the $0.17766 level. This could be a bearish signal. On the other hand, the double bottom formation may be bullish.
On the 4-hour chart, the 50 EMA (Blue Line) continues to be below the 200 EMA (Black Line). This shows us that the asset is bearish in the medium term. The fact that the price is below the two moving averages suggests that the asset is bearish in the short term. The Chaikin Money Flow (CMF-20) indicator is at a neutral level. In addition, negative money inflows may move CMF into negative territory. Relative Strength Index (RSI-14), on the other hand, remained in negative territory, but buying pressure has started to build. However, it remains above the uptrend that has formed since June 13. These may cause the price to move higher. The $0.18566 level stands out as a strong resistance zone in case of a rally in line with political developments, macroeconomic data or positive news flow in the DOGE ecosystem. In the opposite case or possible negative news flow, the $0.16686 level may be triggered. In case of a decline to these levels, the increase in momentum may start a new bullish wave.
Supports 0.16686 – 0.15680 – 0.14952
Resistances 0.17766 – 0.18566 – 0.19909
Legal Notice
The investment information, comments and recommendations contained herein do not constitute investment advice. Investment advisory services are provided individually by authorized institutions taking into account the risk and return preferences of individuals. The comments and recommendations contained herein are of a general nature. These recommendations may not be suitable for your financial situation and risk and return preferences. Therefore, making an investment decision based solely on the information contained herein may not produce results in line with your expectations.