
Active Adresses
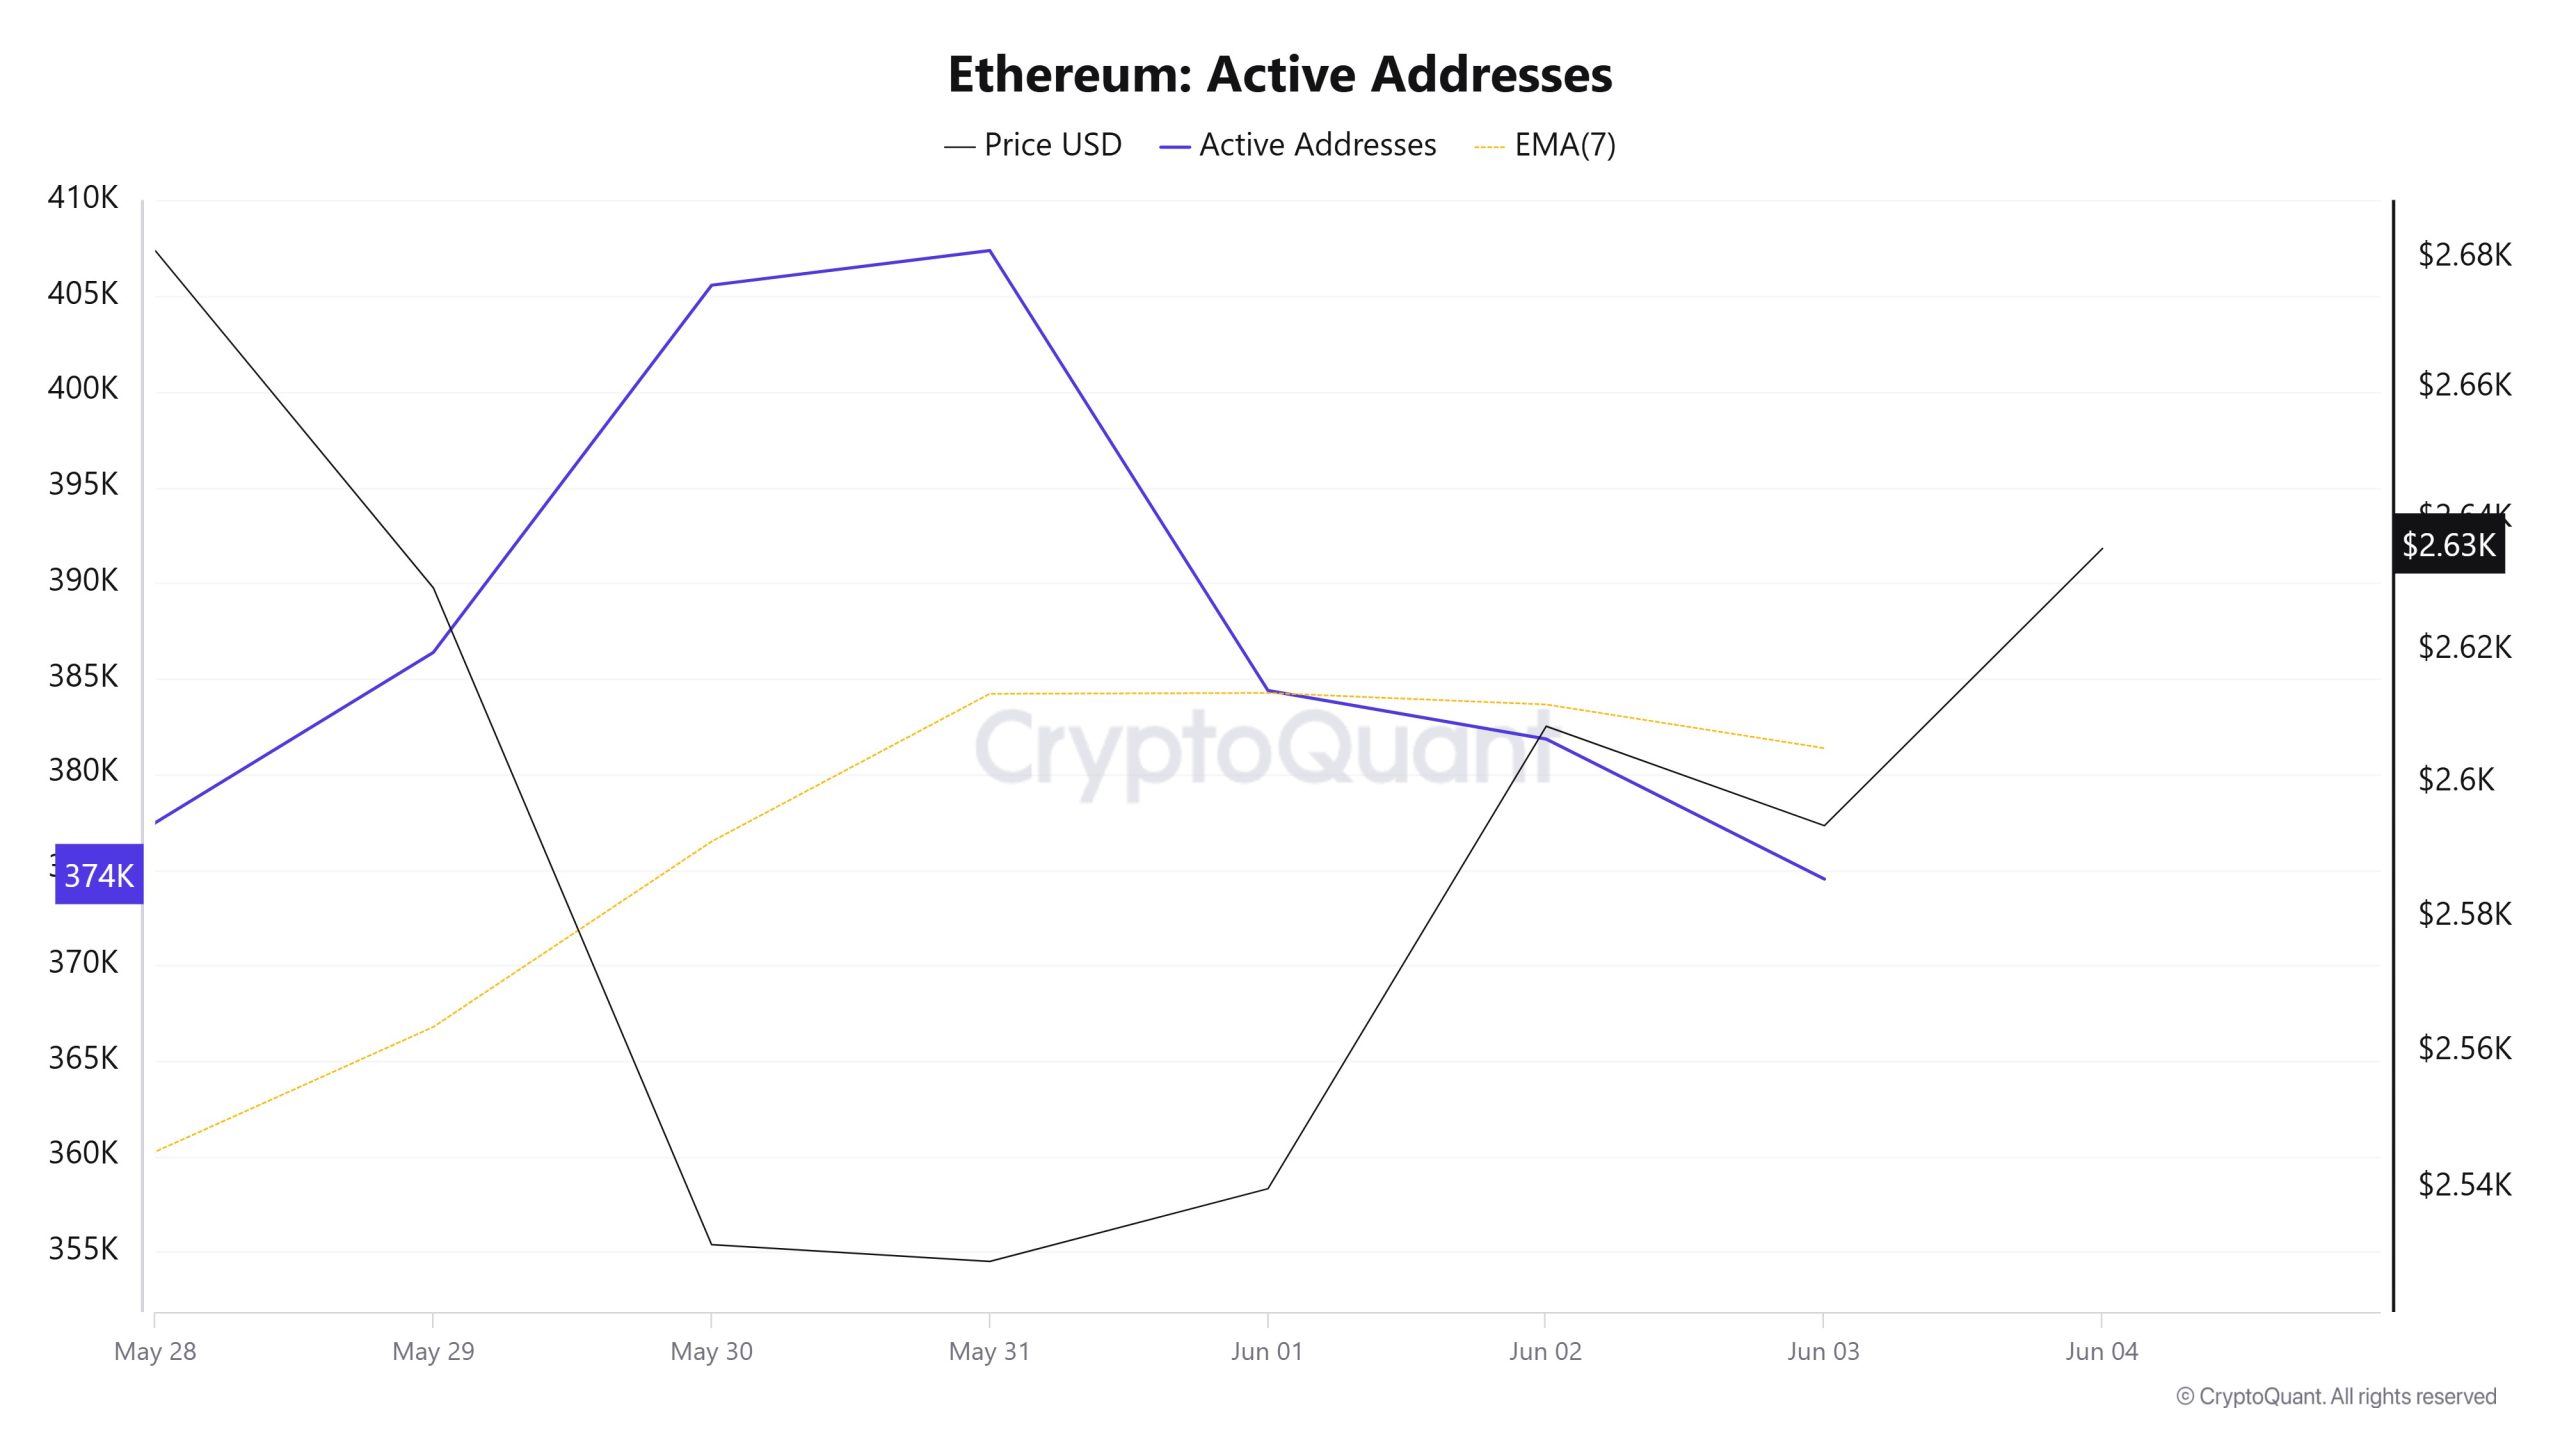
Between June 11 and June 18, there were 422,001 active inflows to the ETH network. During this period, Ethereum fell from $2,771 to $2,512. On June 15, at the intersection of price and the number of active addresses, the number of active addresses increased after Ethereum purchases weakened. When the 7-day simple moving average is followed, it is observed that the Ethereum price is on a downward trend.
Active Sending Addresses
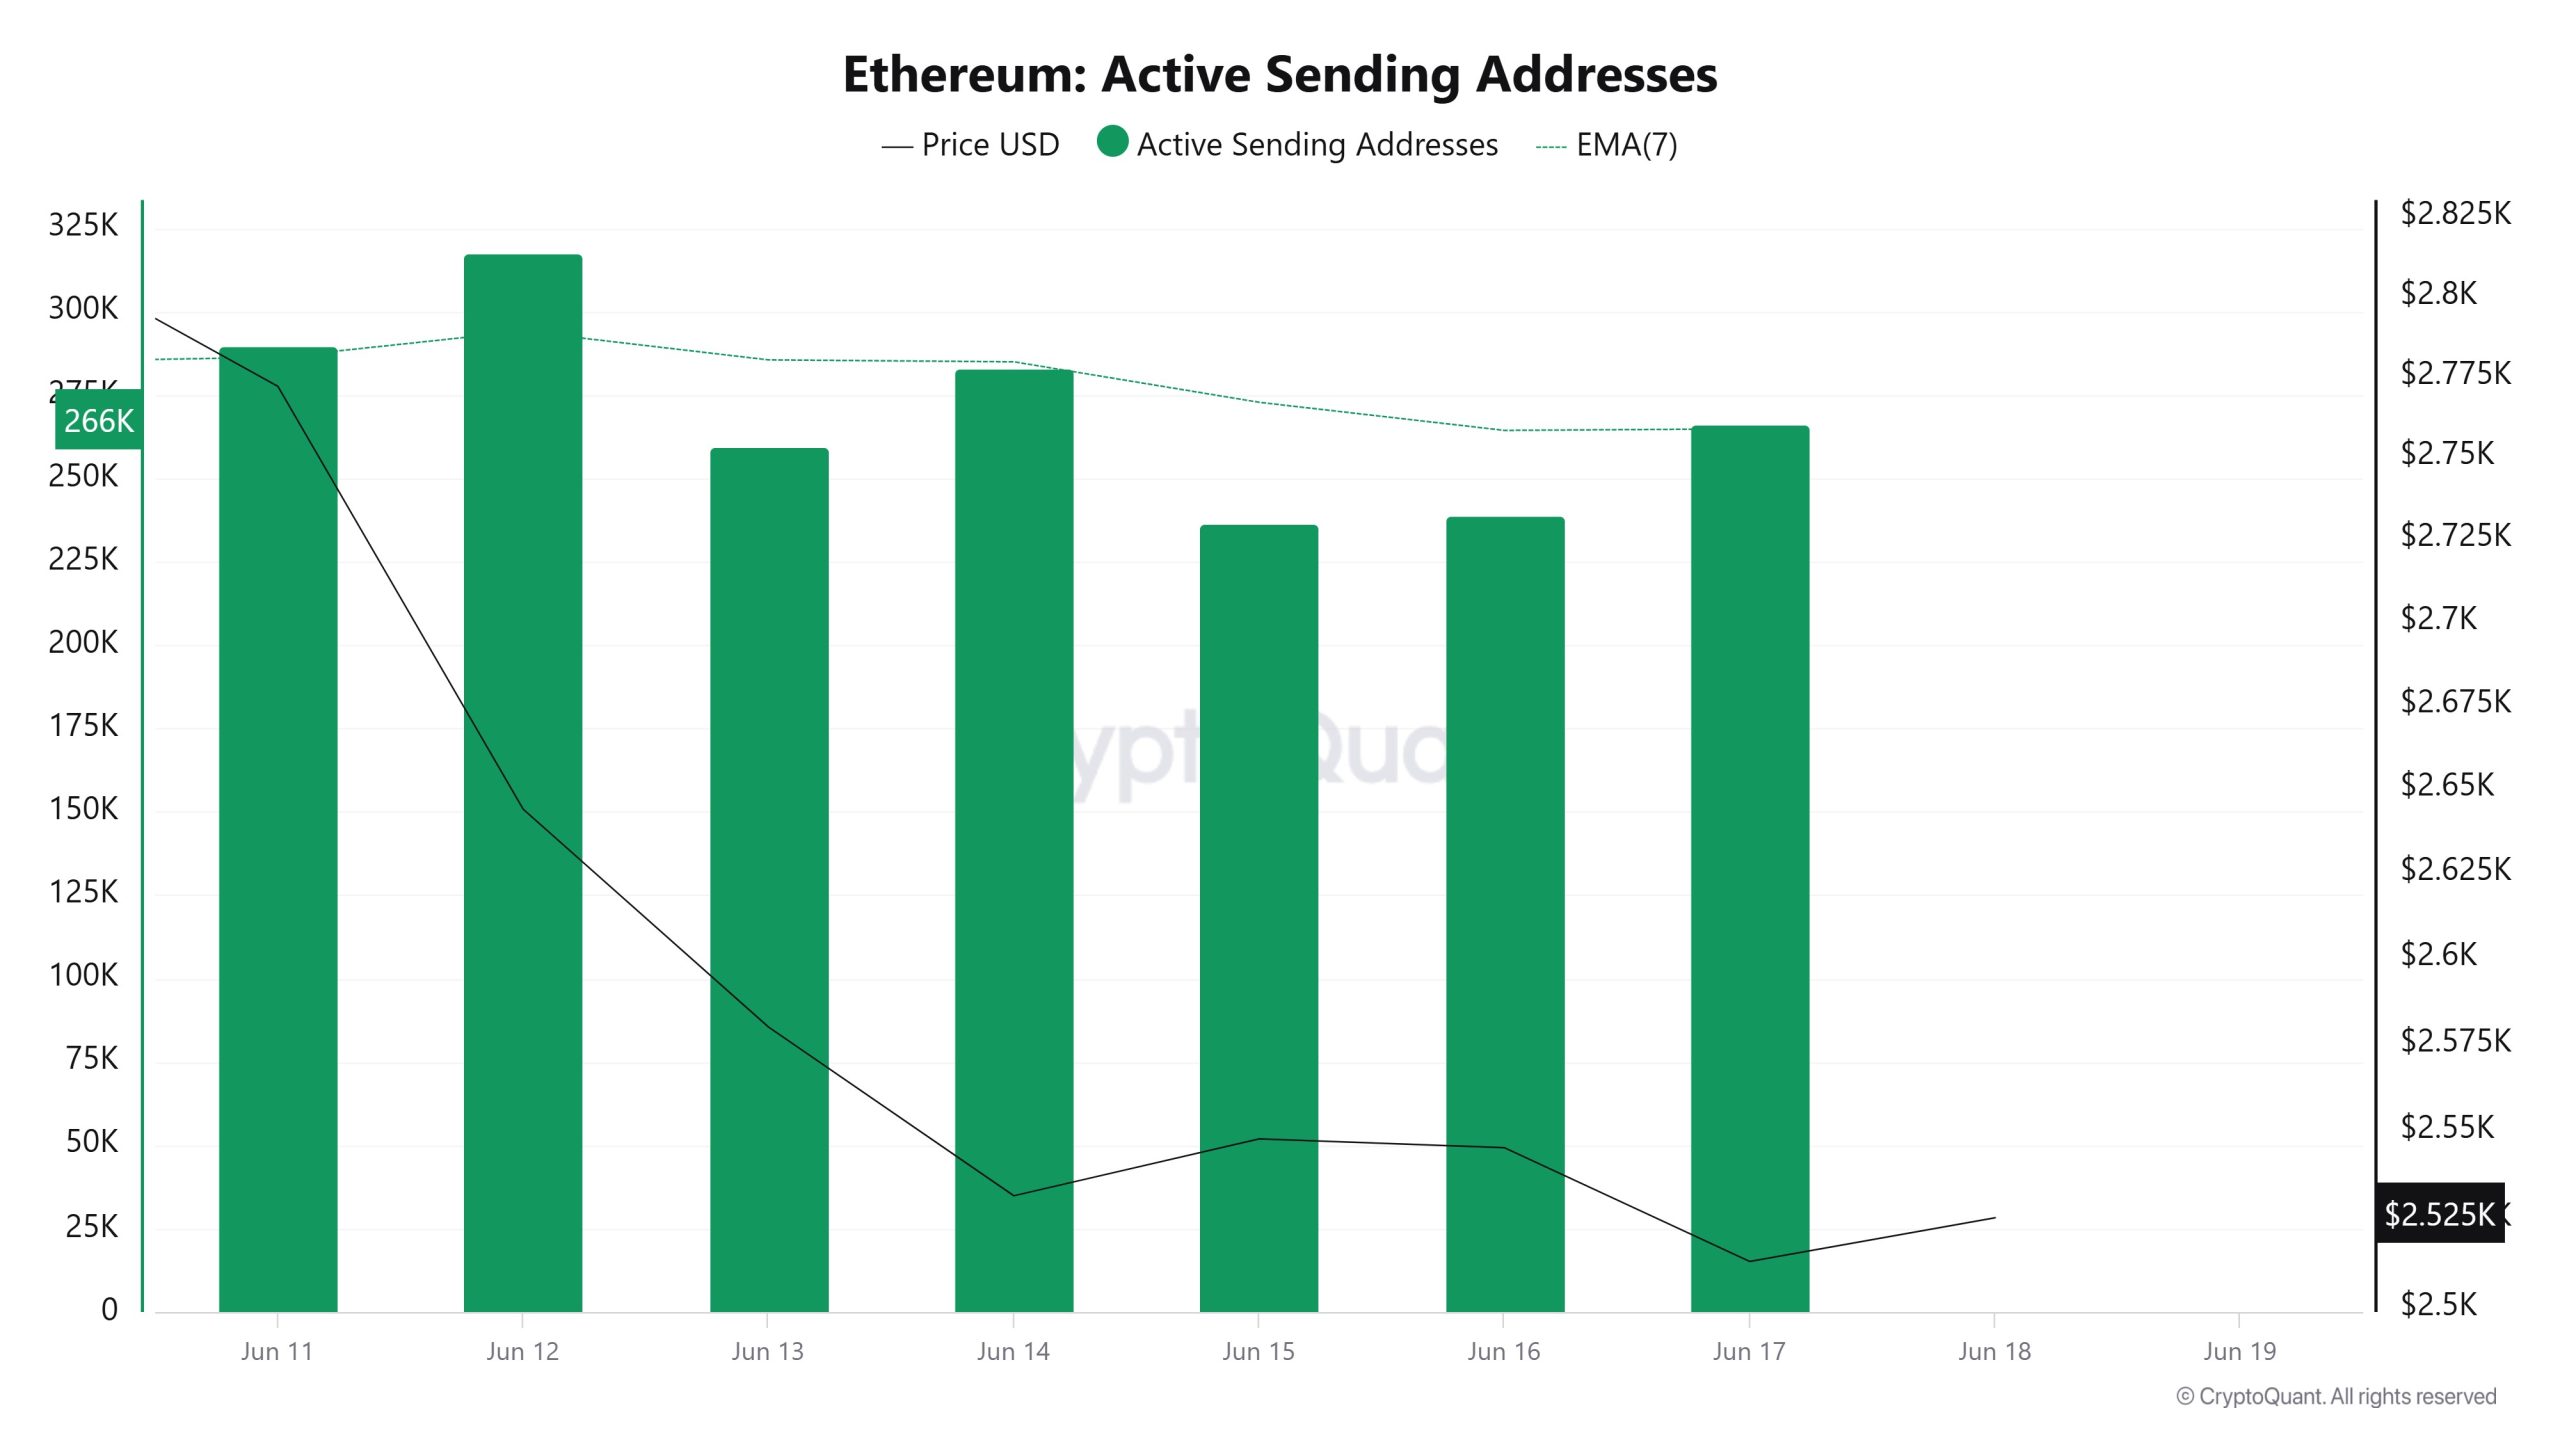
Between June 11-18, a bearish movement was observed in active shipping addresses with the Black Line (price line). On the day when the price reached its highest level on a weekly basis, active shipping addresses were at 290,039; On June 12, as Ethereum started to fall, active shipping addresses increased to 317,607. This caused Ethereum to fall to $2,512.
Active Receiving Addresses
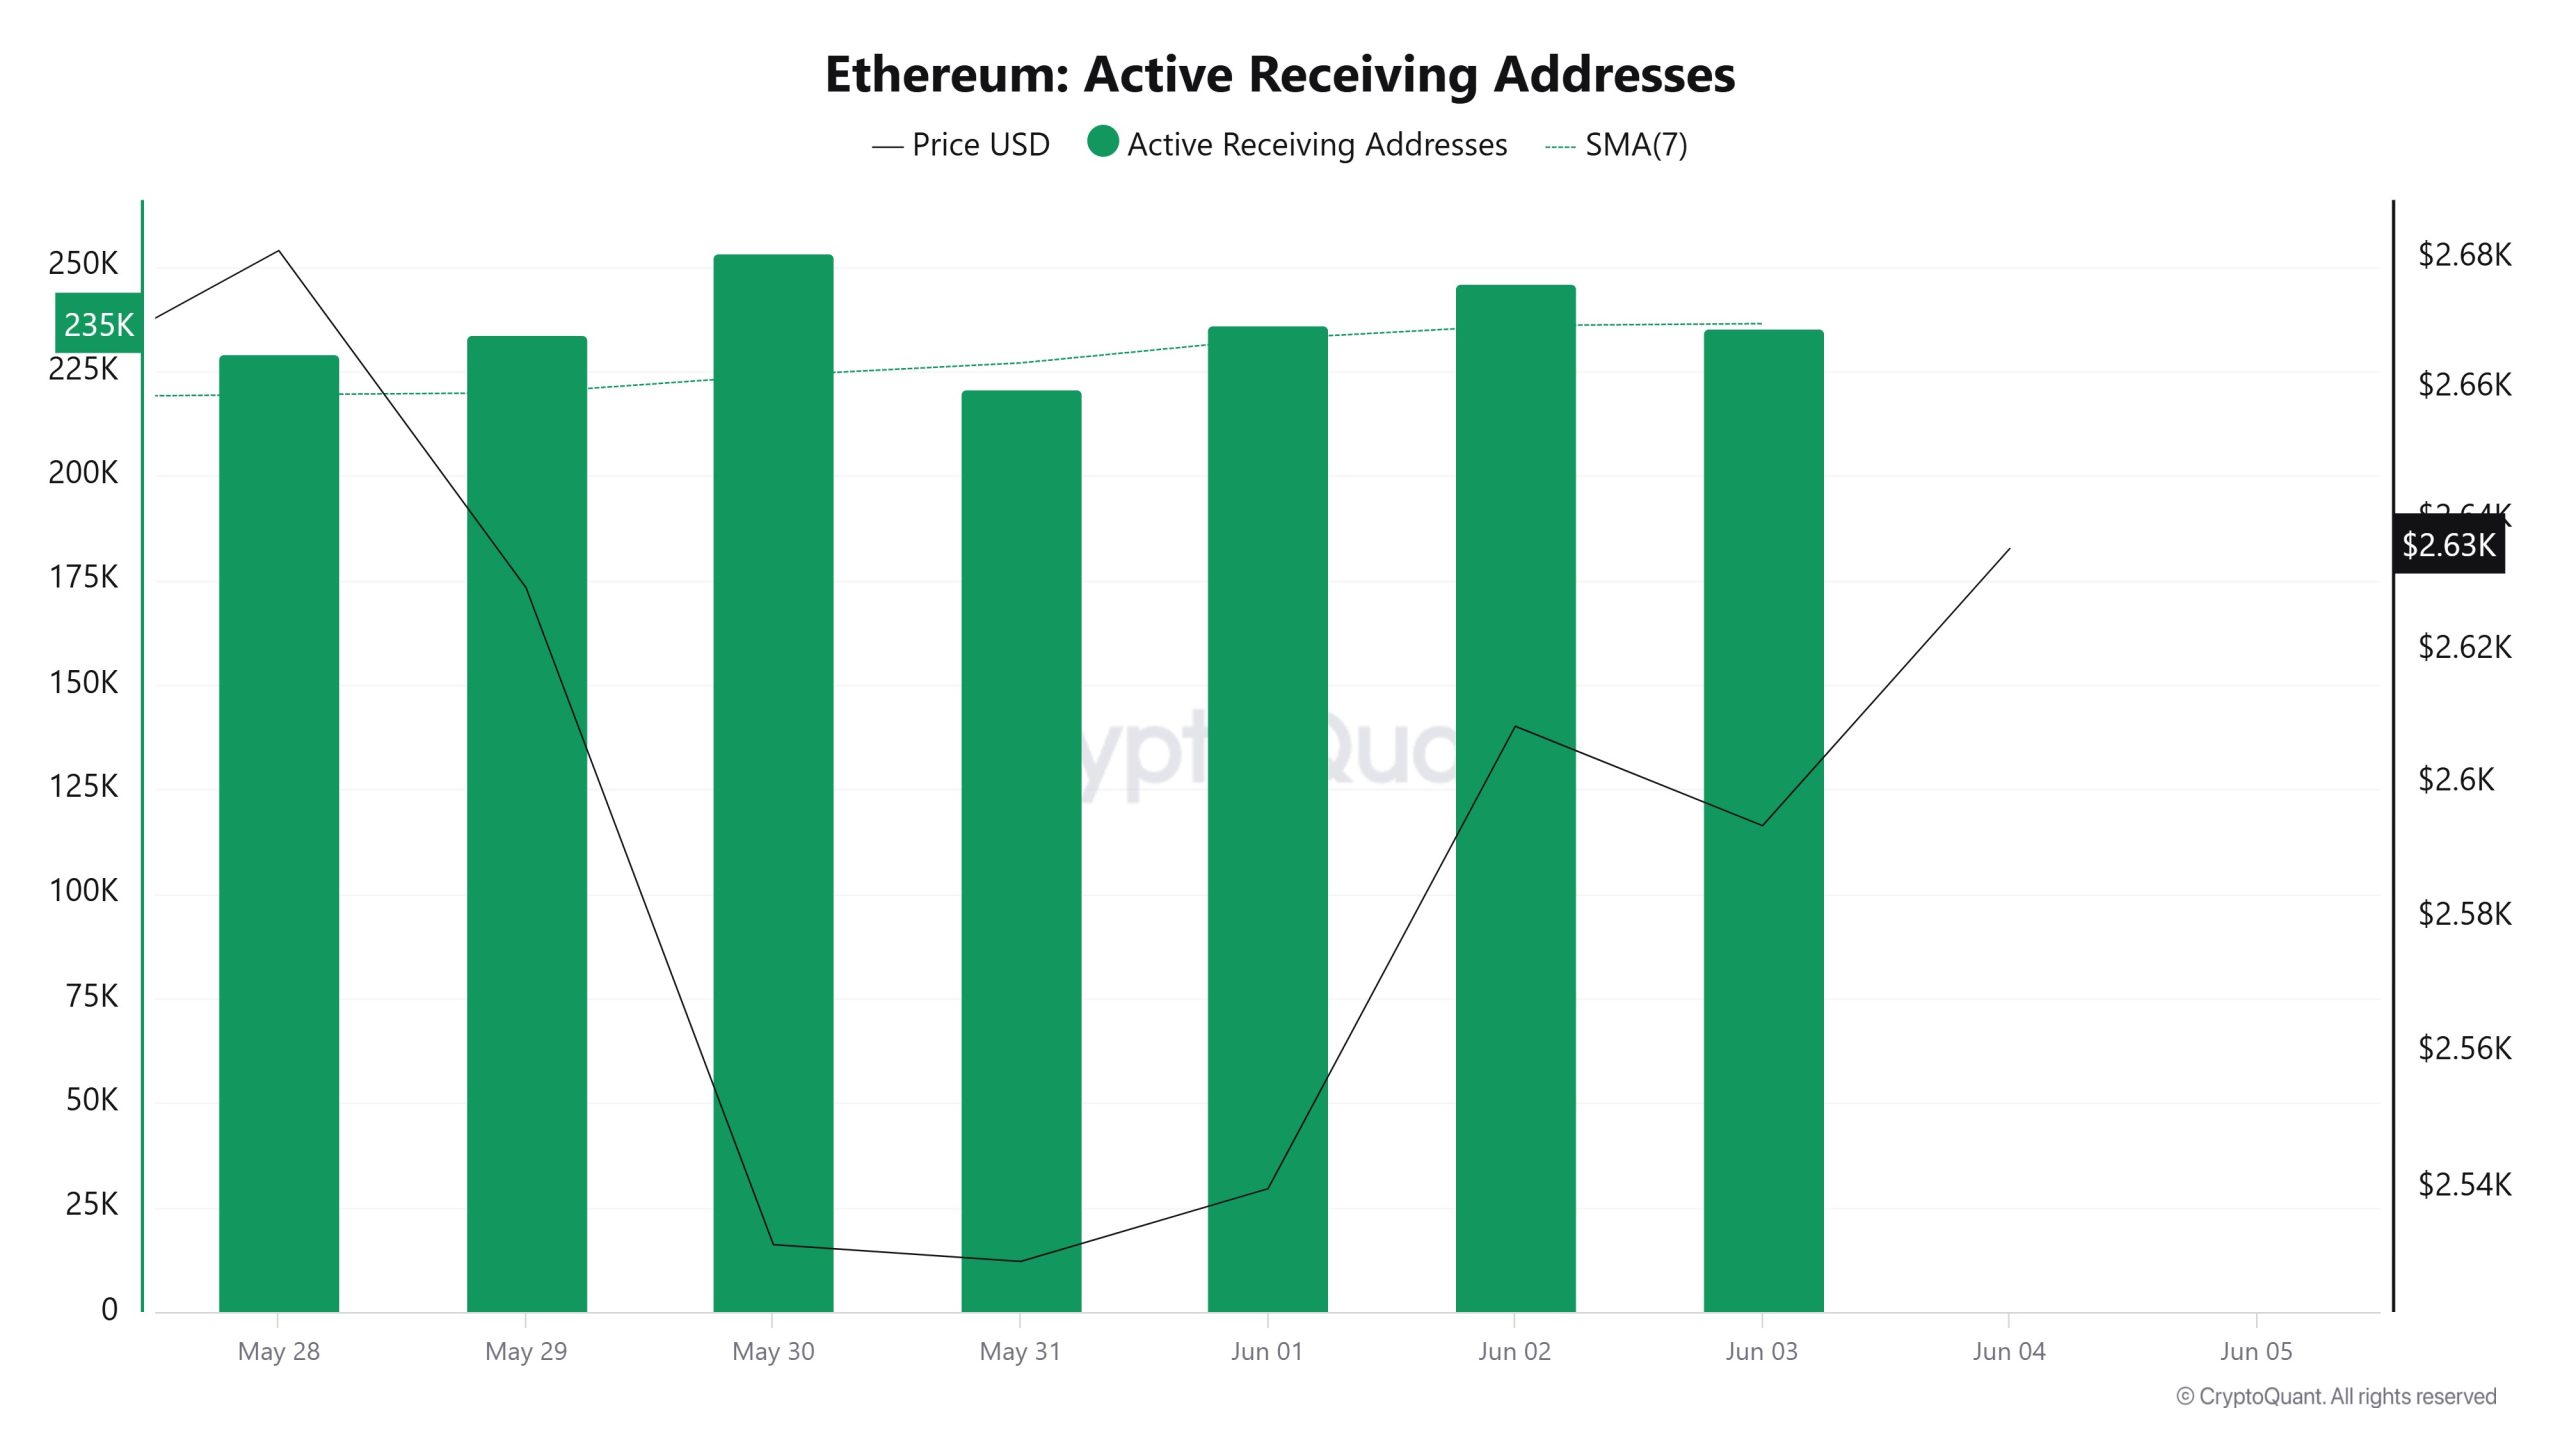
Between June 11-18, there was a significant rise in active buy addresses while the price fell. On the day when the price reached its highest level, active buy addresses rose as high as 290,039, indicating that buyers bought Ethereum at $2,771.
Total Value Staked
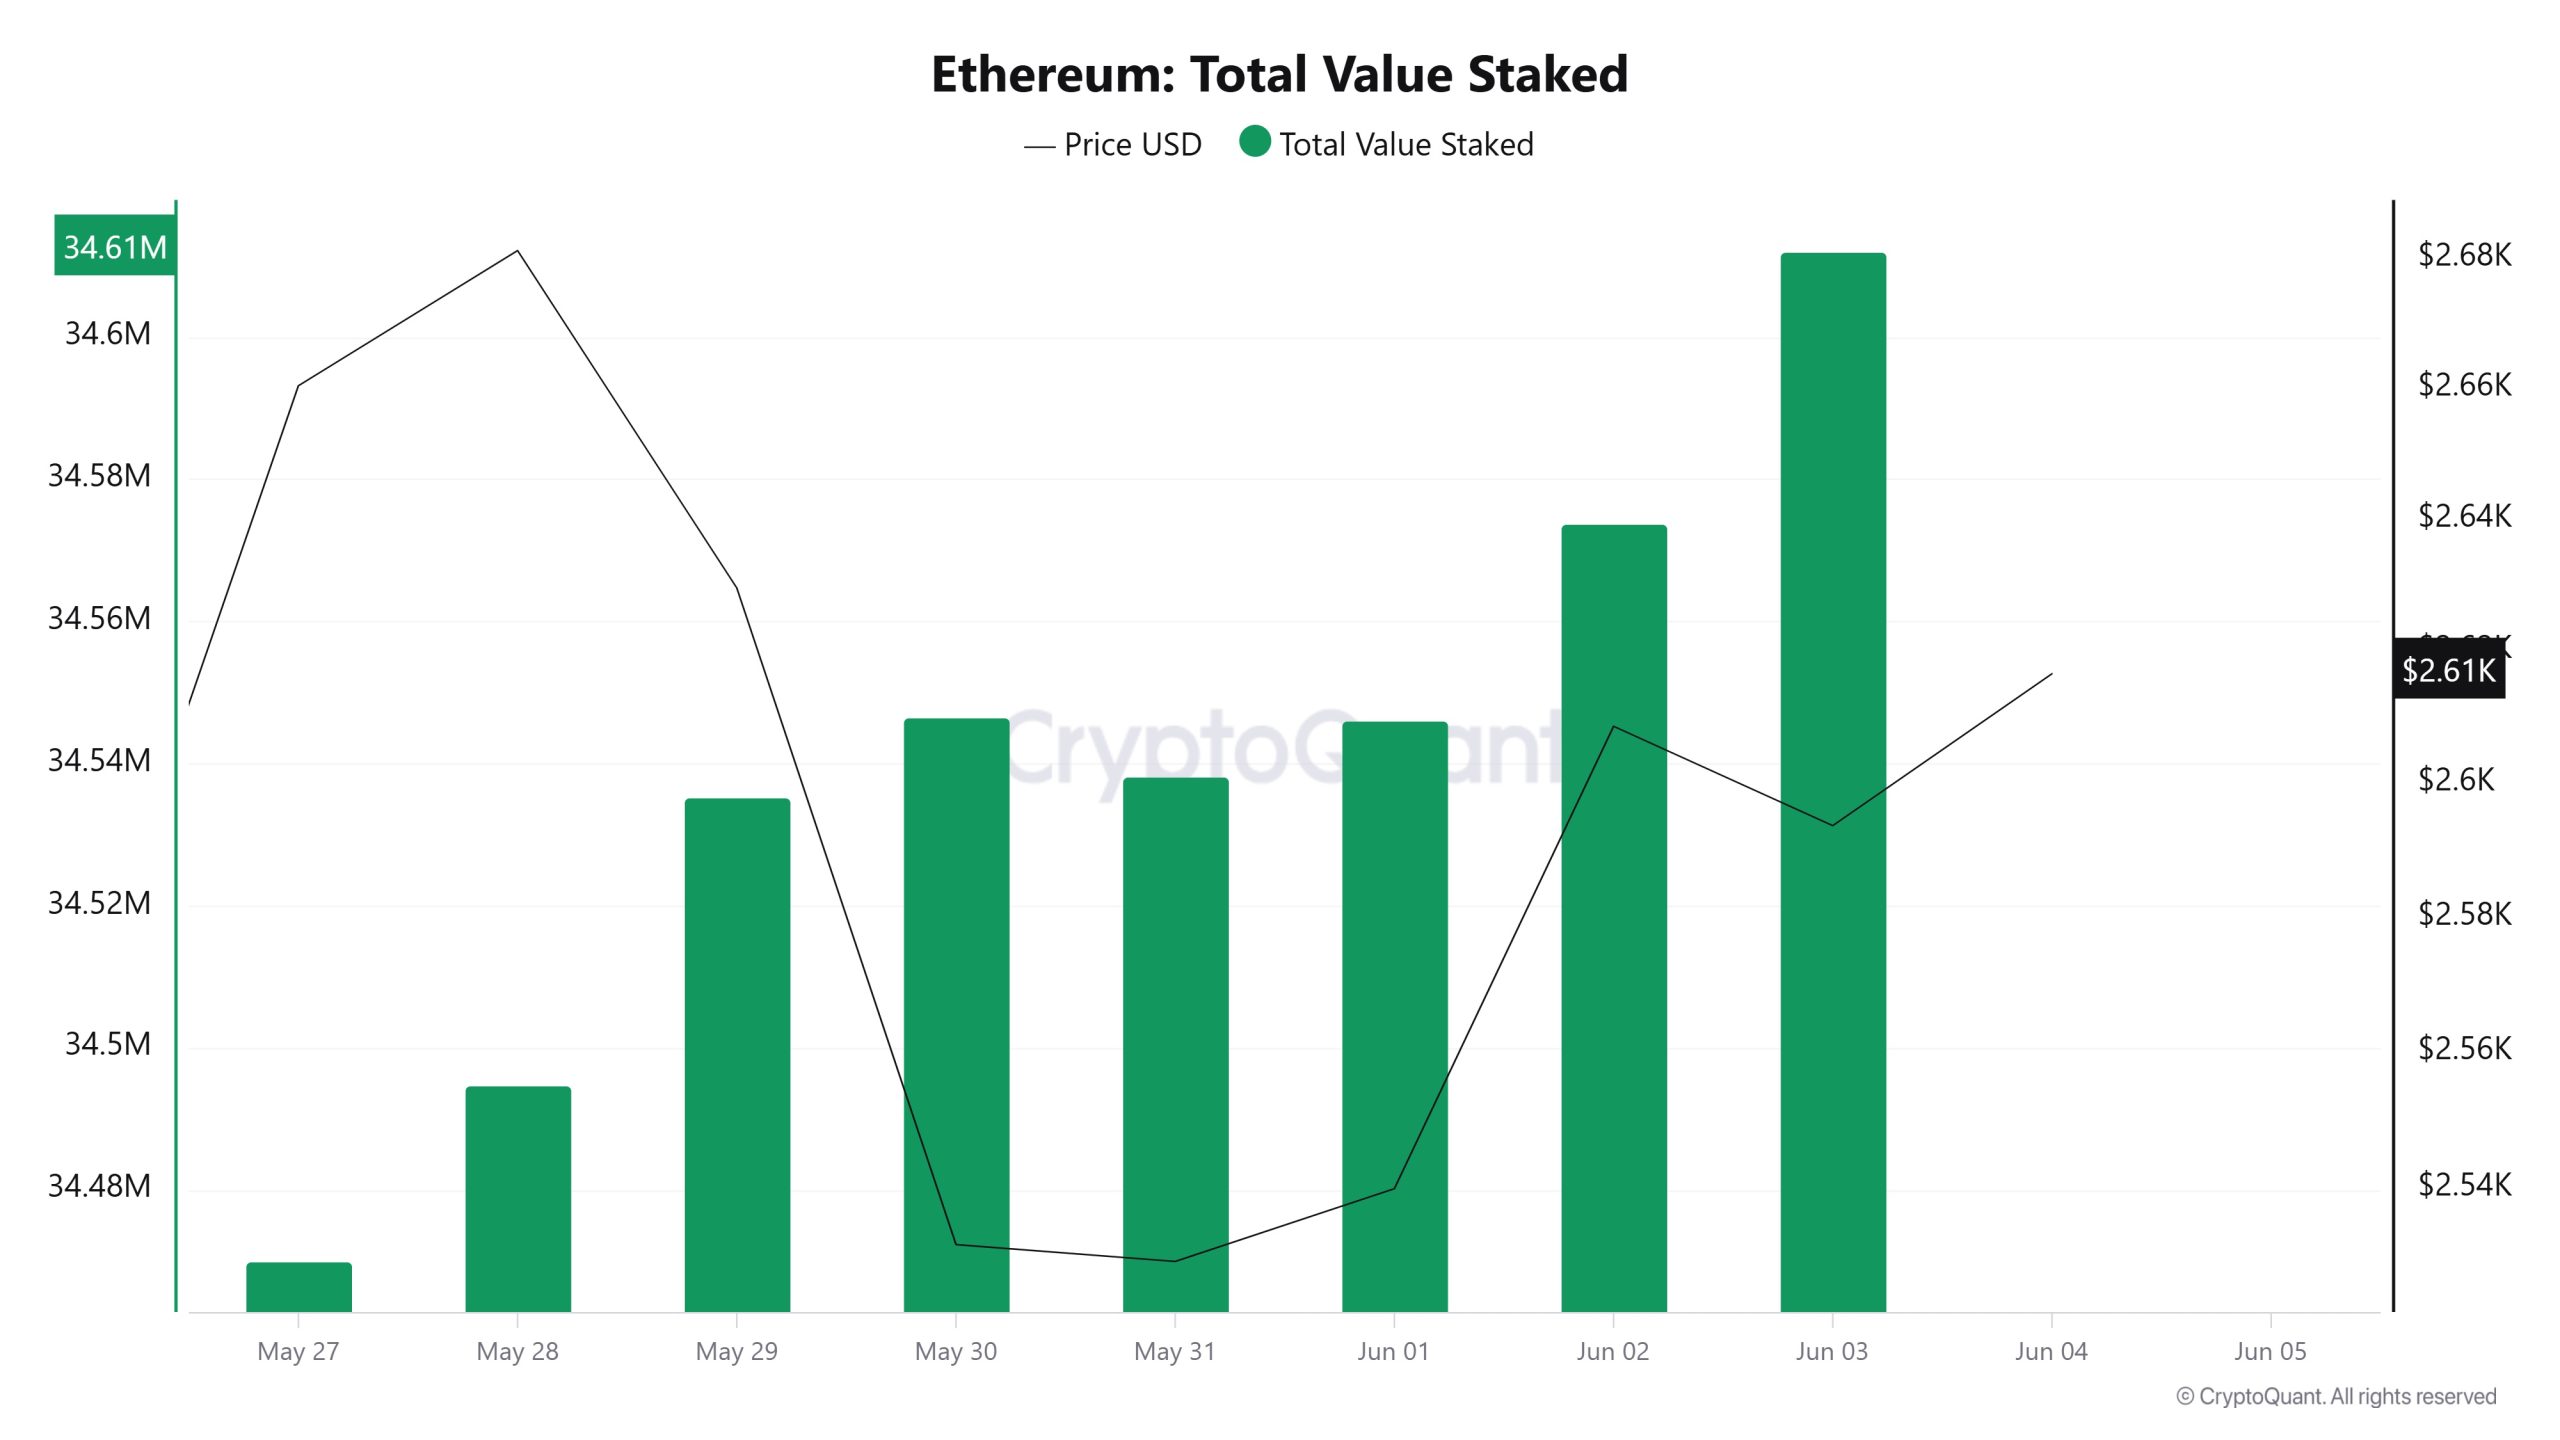
On June 11th, ETH price was 2,771 while Total Value Staked was 34,885,468. As of June 17, ETH price was down 9.36% to 2,512, while Total Value Staked was up 0.55% to 35,075,953.
Staking Inflows
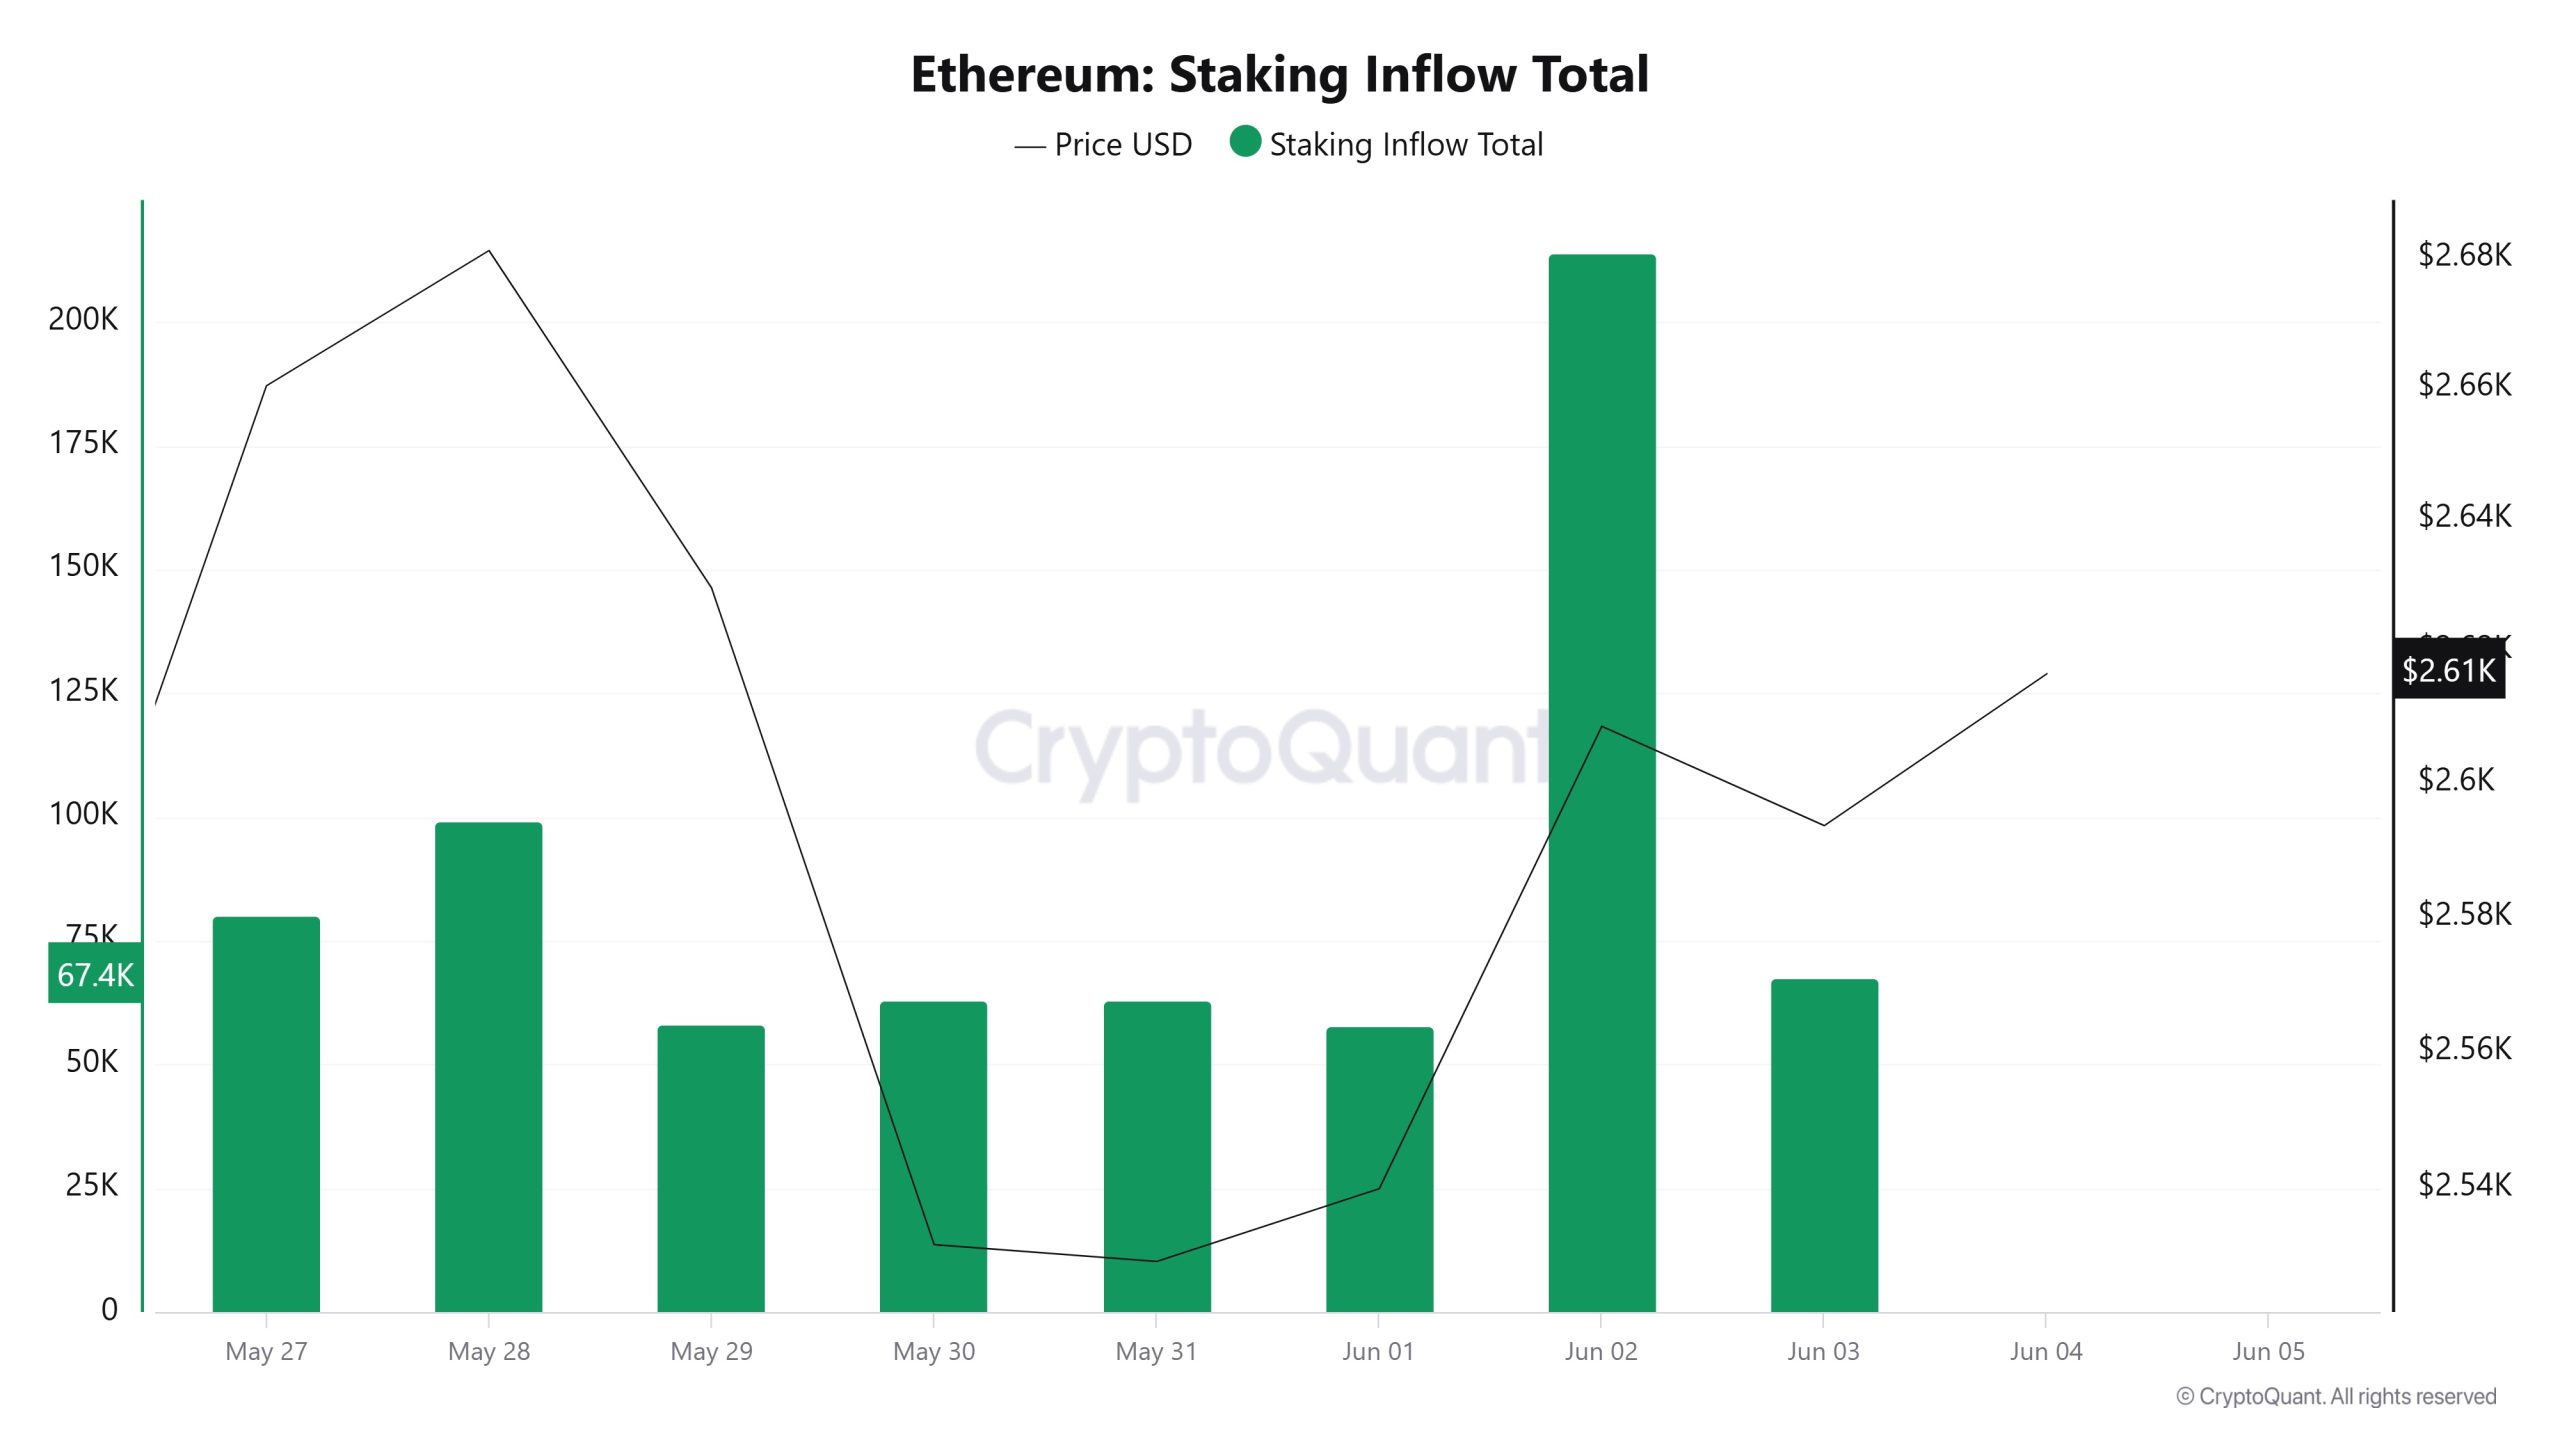
On June 11, ETH price was at 2,771 while Staking Inflow was at 55,884. As of June 17, ETH price was down 9.36% to 2,512, while Staking Inflow was up 48.87% to 83,193.
Derivatives
Open Interest
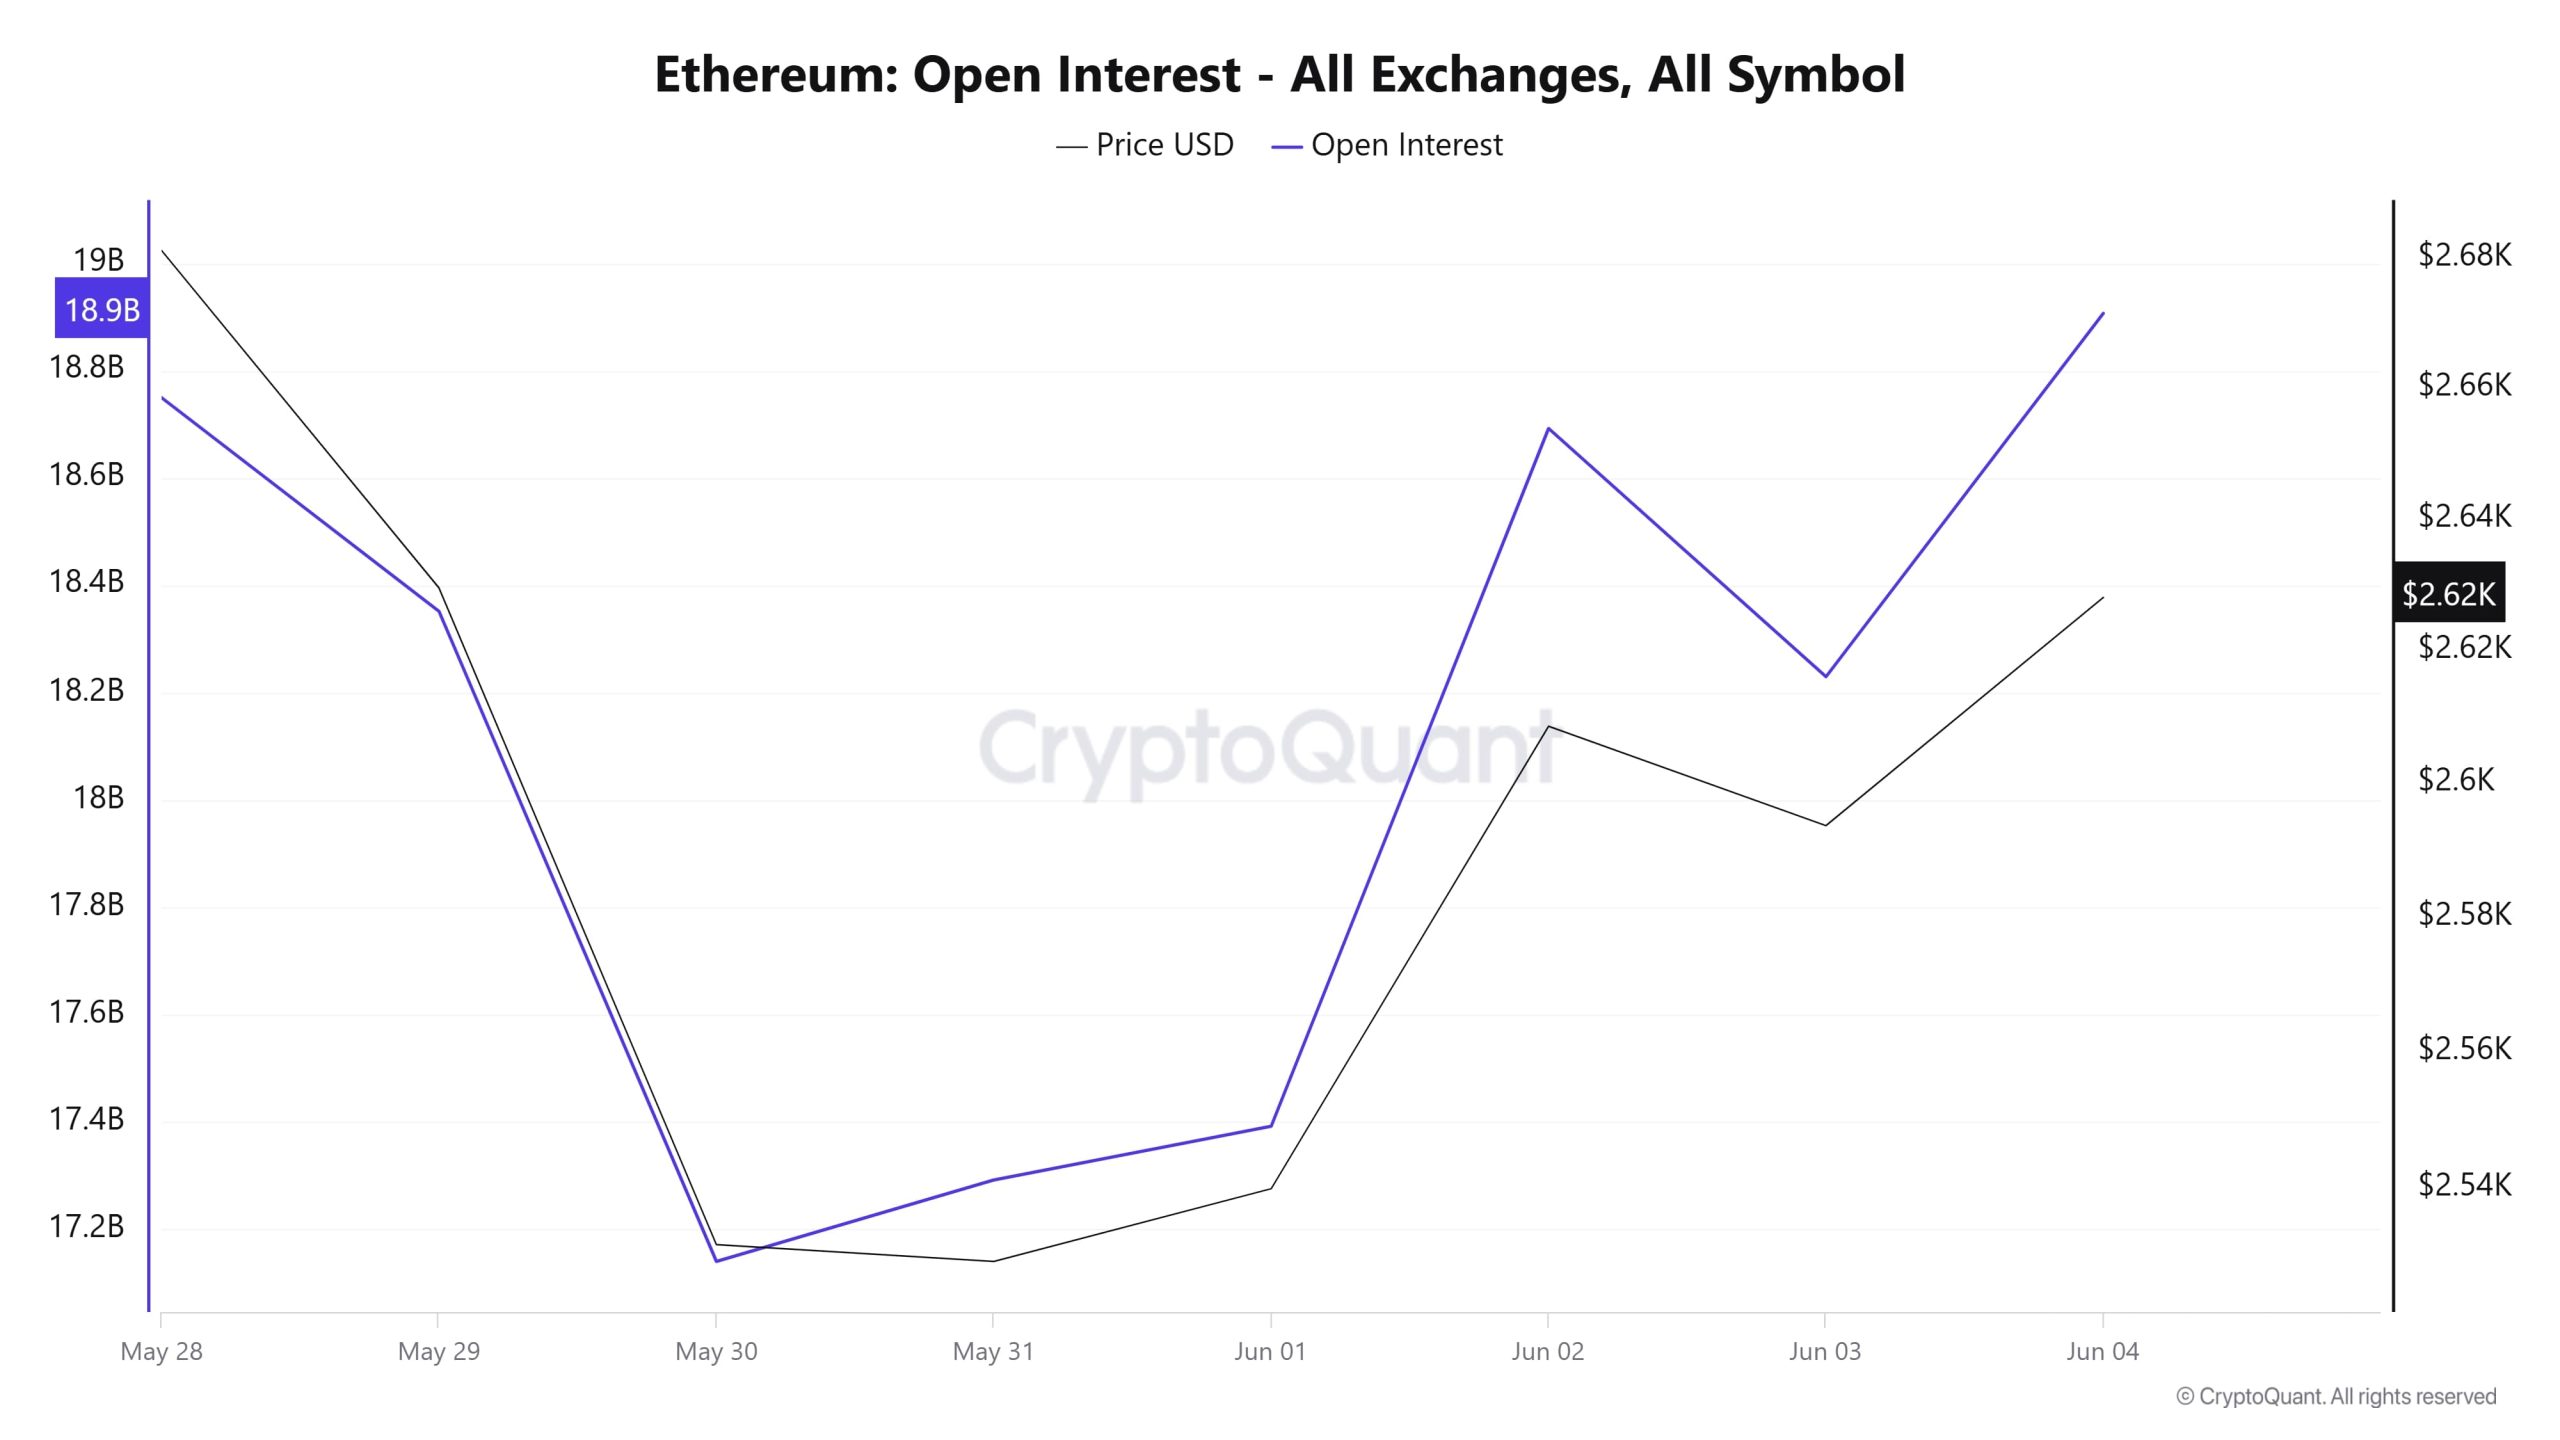
In the week when the conflicts between Israel and Iran started, a parallel downward trend with the price stands out. On June 11, open interest, which was close to $21 billion, declined to around $18 billion in a short period of time, indicating a serious position closure in terms of volume. The similar weakening of the price during this decline suggests that long positions may have been liquidated. After June 13, a significant sideways movement started, while low volume rebounds were observed both on the price and open interest side. On June 15, although there was a short-lived increase, this rise could not be permanent and the weakening process started again. However, on June 17 and 18, there are signs of recovery on both price and open interest. This may suggest that new long positions with low leverage have started to reopen in the market. Overall, the post-decline accumulation process is noteworthy and the market seems to be transitioning to a phase where it searches for a new direction.
Funding Rate
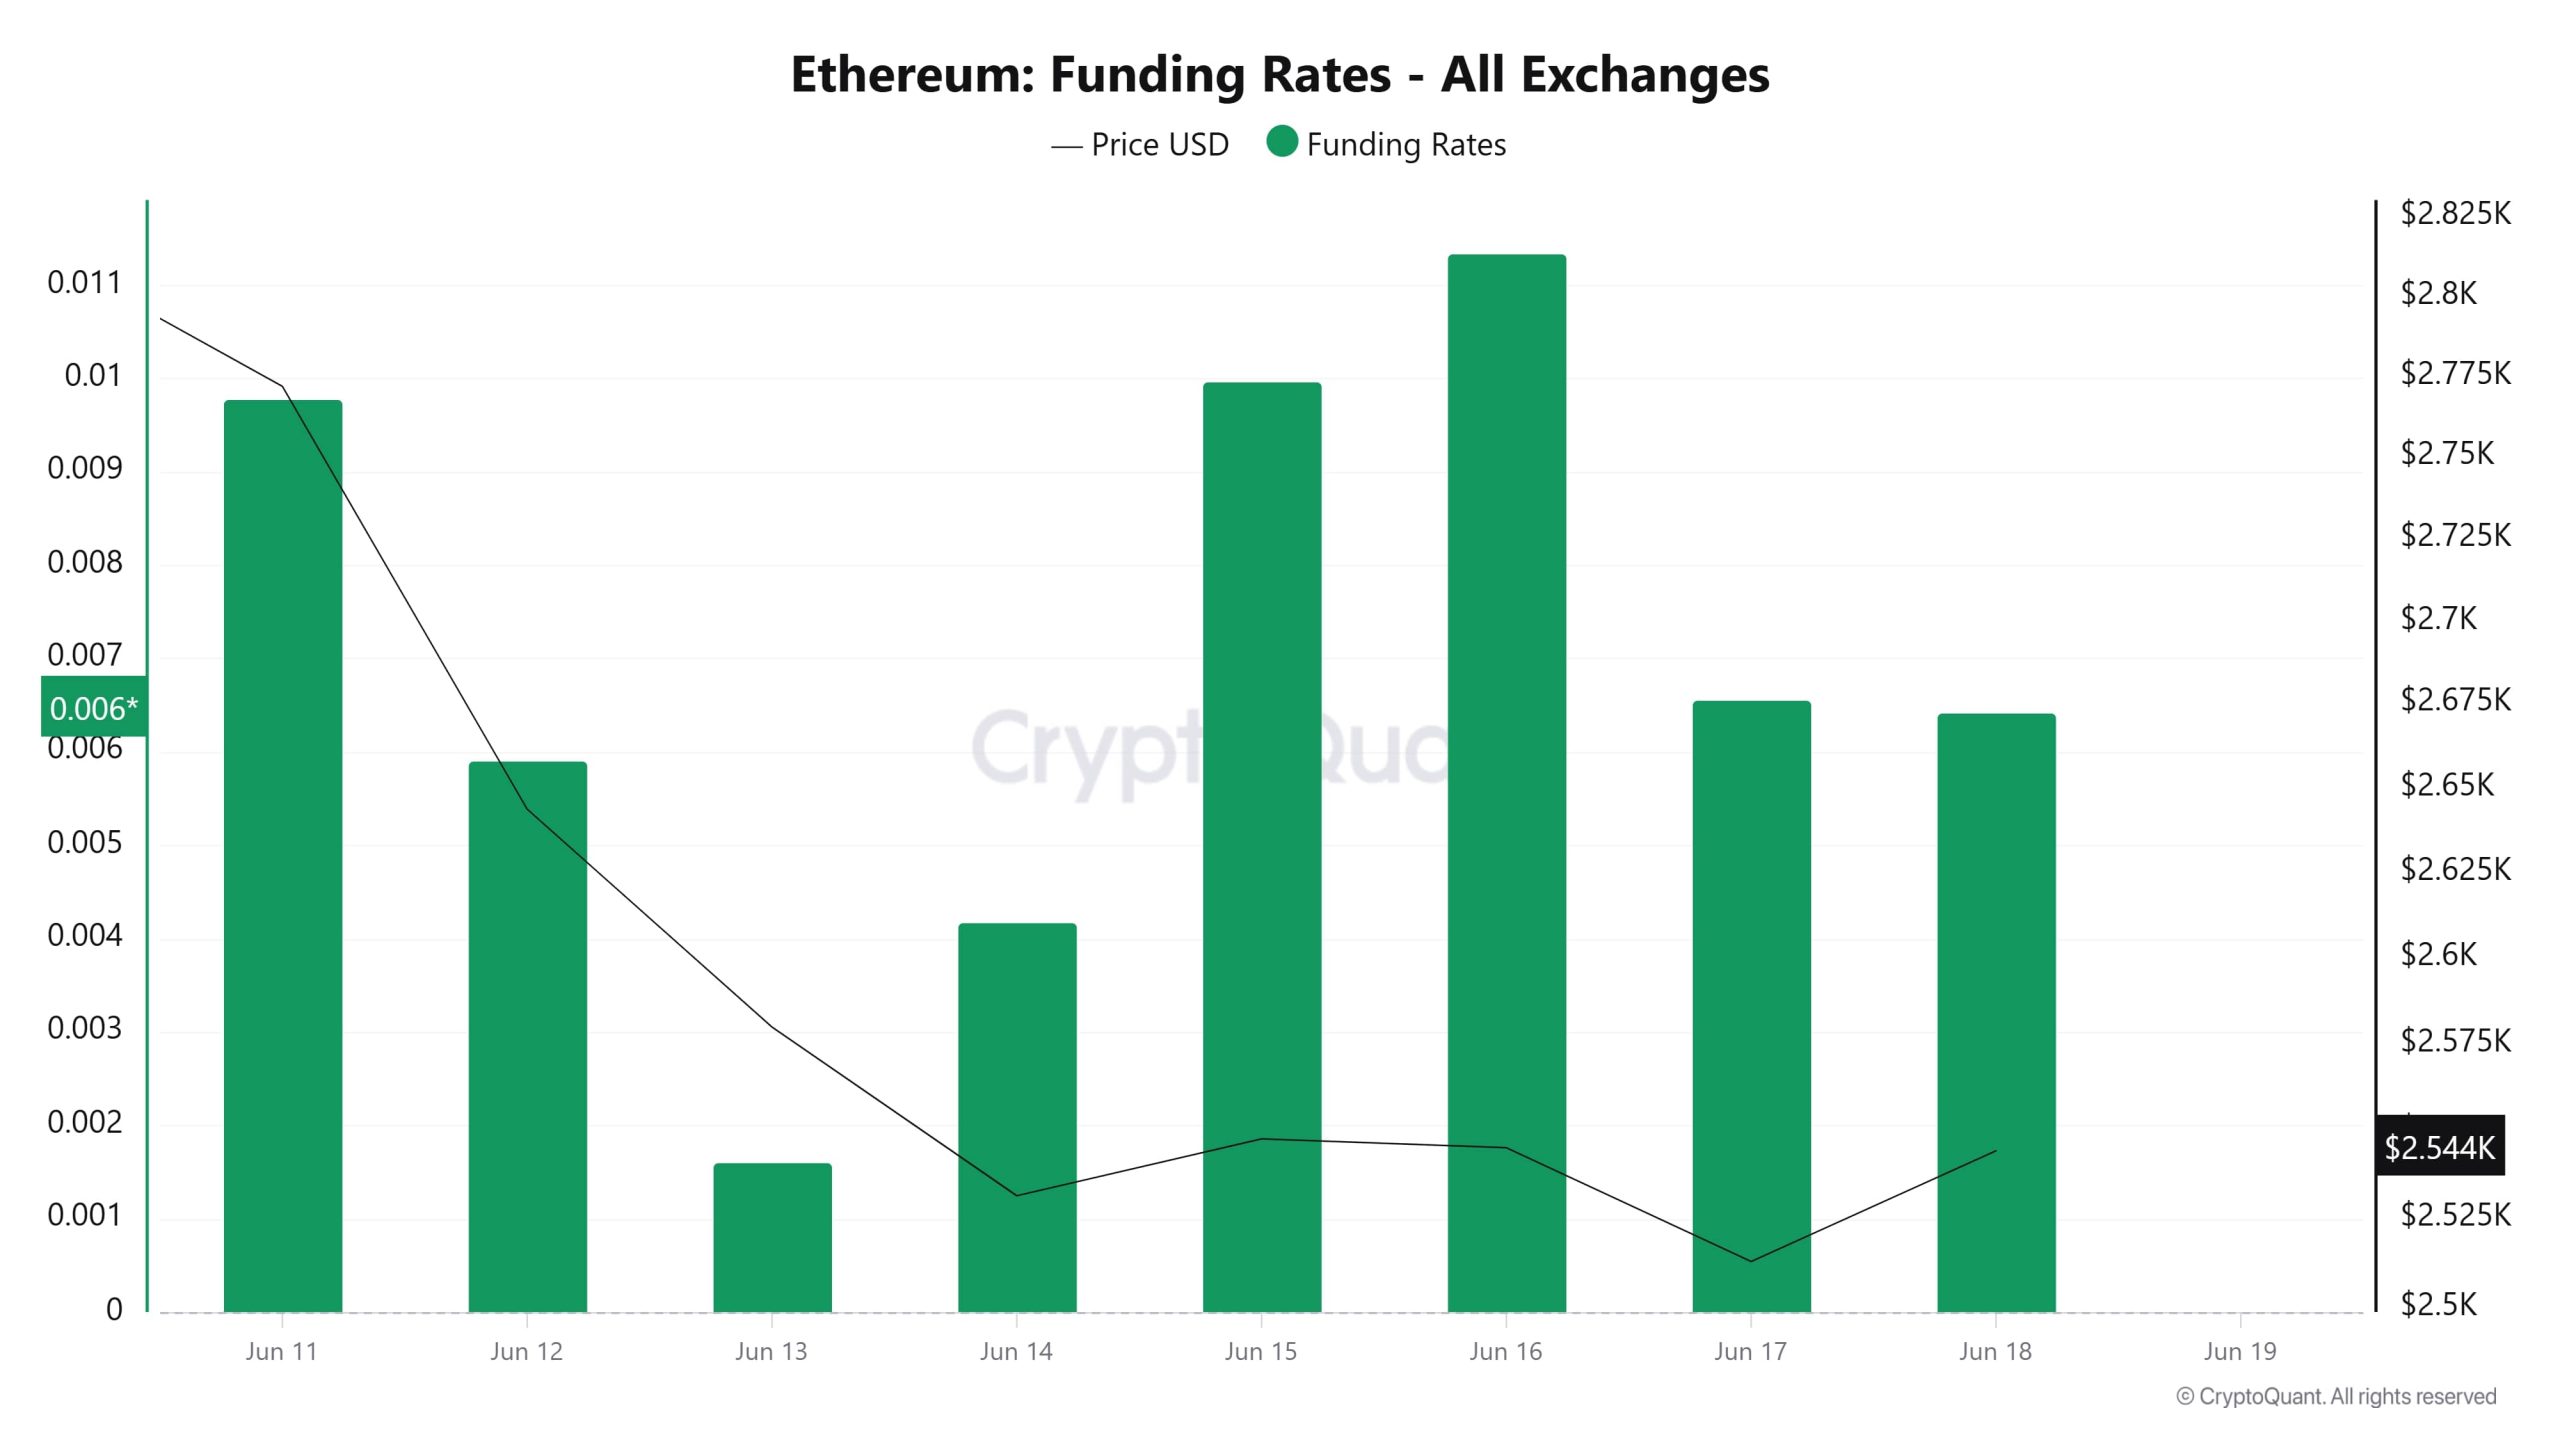
When Ethereum’s price movement is analyzed together with the funding rate data between June 11-18, it is noteworthy that market participants are looking for short-term direction. On June 11, positive funding rates approaching the level of 0.01 indicate that the demand for long positions is strong, while the price’s decline from the $ 2,800 level after this date shows that long positions are profit-taking and new short positions are opened with the price decline.
Since June 12, funding rates have been on a gradual decline while the price has been following a downward trend. On June 13, both the price and funding rates hit their lows, while the market seems to have entered a neutral or cautious waiting period.
On June 15 and 16, there was another aggressive increase in funding rates, implying that the market has resumed long accumulation and short-term bullish expectations are coming to the fore. However, price gains were limited on these dates and the $2.675 area was not breached. This outlook suggests that positions were insufficient to move the market higher and selling pressure continued at resistance levels. Finally, on June 17 and 18, funding rates still remained in positive territory, but in a decreasing trend. This suggests that the appetite for long positions is starting to weaken and the market is approaching neutral levels again, with the price falling back to the $2,544 level. Overall, the market structure suggests that aggressive long accumulation is not supported by a sustainable price rally and investors are becoming cautious.
Long & Short Liquidations
According to Cryptoquant data, the volatility in the ETH price in the past week amid tensions between Israel and Iran led to the liquidation of $1.3 billion of long positions and $2.6 billion of short positions. (This data does not coincide with some other sources.
| Date | Long Amount (Million $) | Short Amount (Million $) |
|---|---|---|
| June 11 | 76.76 | 56.74 |
| June 12 | 129.75 | 52.87 |
| June 13 | 150.23 | 1,722.79 |
| June 14 | 468.57 | 7.78 |
| June 15 | 22.41 | 17.54 |
| June 16 | 386.61 | 756.78 |
| June 17 | 101.09 | 37.23 |
| Total | 1,335.42 | 2,651.73 |
Supply Distribution
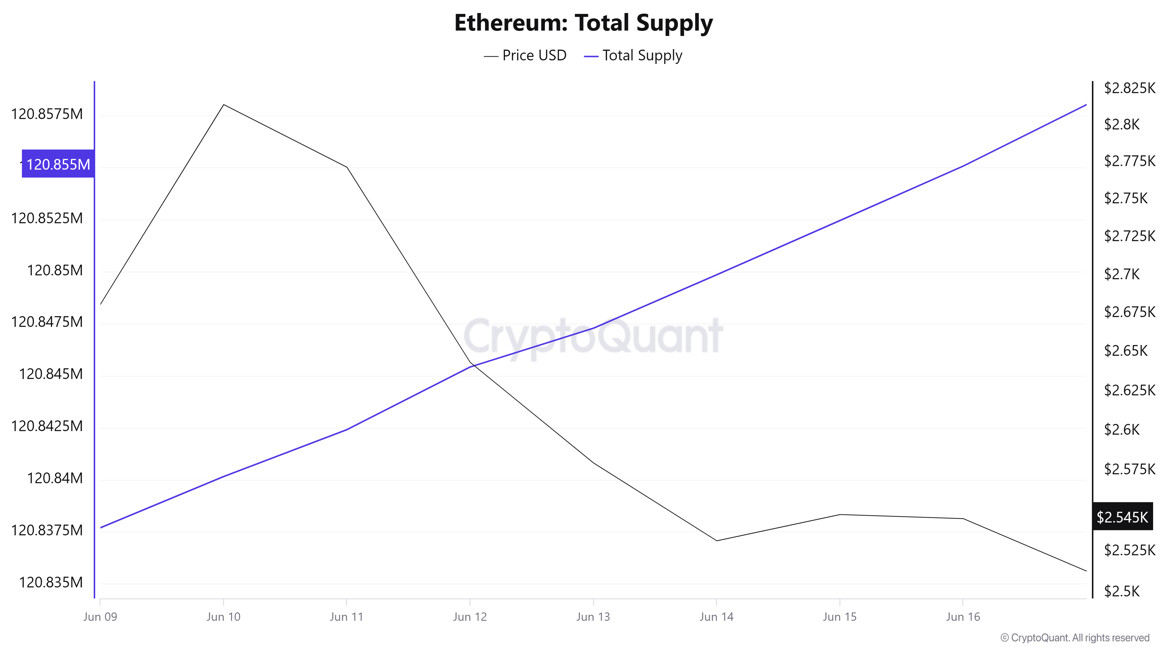
Total Supply: It reached 122,855,068 units, up about 0.3207% from last week.
New Supply: The amount of ETH produced this week was 392,734.
Velocity: Velocity, which was 8.25 last week, was 8.35 as of June 16.
According to the latest weekly data, a limited decrease of -0.30% was observed in 100 – 1k ETH wallets.
Wallets in the 1k – 10k ETH range experienced a remarkable increase of 5.67%. While the 10k – 100k ETH segment showed a significant decline of -4.30%, 100k+ ETH wallets recorded a strong increase of 5.77%.
| Wallet Category | 09.06.2025 | 16.06.2025 | Change (%) |
|---|---|---|---|
| 100 – 1k ETH | 9.1606M | 9.1329M | -0.30% |
| 1k – 10k ETH | 12.8781M | 13.6089M | +5.67% |
| 10k – 100k ETH | 17.6771M | 16.9157M | -4.30% |
| 100k+ ETH | 4.1517M | 4.3916M | +5.77% |
Exchange Reserve
“Ethereum Exchange Reserve – All Exchanges Image to be Added”
Between June 11-17, 2025, Ethereum reserves on exchanges decreased from 18,816,208 ETH to 18,695,733 ETH. During this period, there was a total net outflow of 120,475 ETH and the Ethereum reserves of the exchanges decreased by 0.64%. The price of Ethereum fell from $2,772 to $2,513 during the same period, losing about 9.3% of its value. These net outflows from exchanges show that investors continue to move their assets to cold wallets. However, despite this, the sharp decline in the Ethereum price shows that selling pressure continues. This outlook points to weak market sentiment in the short term.
| Date | Exchange Inflow | Exchange Outflow | Exchange Netflow | Exchange Reserve | ETH Price ($) |
|---|---|---|---|---|---|
| 11-Jun | 1,207,546 | 1,277,658 | -70,112 | 18,816,208 | 2,772 |
| 12-Jun | 1,031,653 | 1,050,464 | -18,811 | 18,797,397 | 2,644 |
| 13-Jun | 1,234,682 | 1,365,340 | -130,658 | 18,666,739 | 2,580 |
| 14-Jun | 324,376 | 261,279 | 63,097 | 18,729,836 | 2,532 |
| 15-Jun | 259,215 | 264,244 | -5,029 | 18,724,808 | 2,548 |
| 16-Jun | 892,392 | 1,050,130 | -157,738 | 18,567,070 | 2,545 |
| 17-Jun | 874,913 | 746,250 | 128,663 | 18,695,733 | 2,513 |
Fees and Revenues
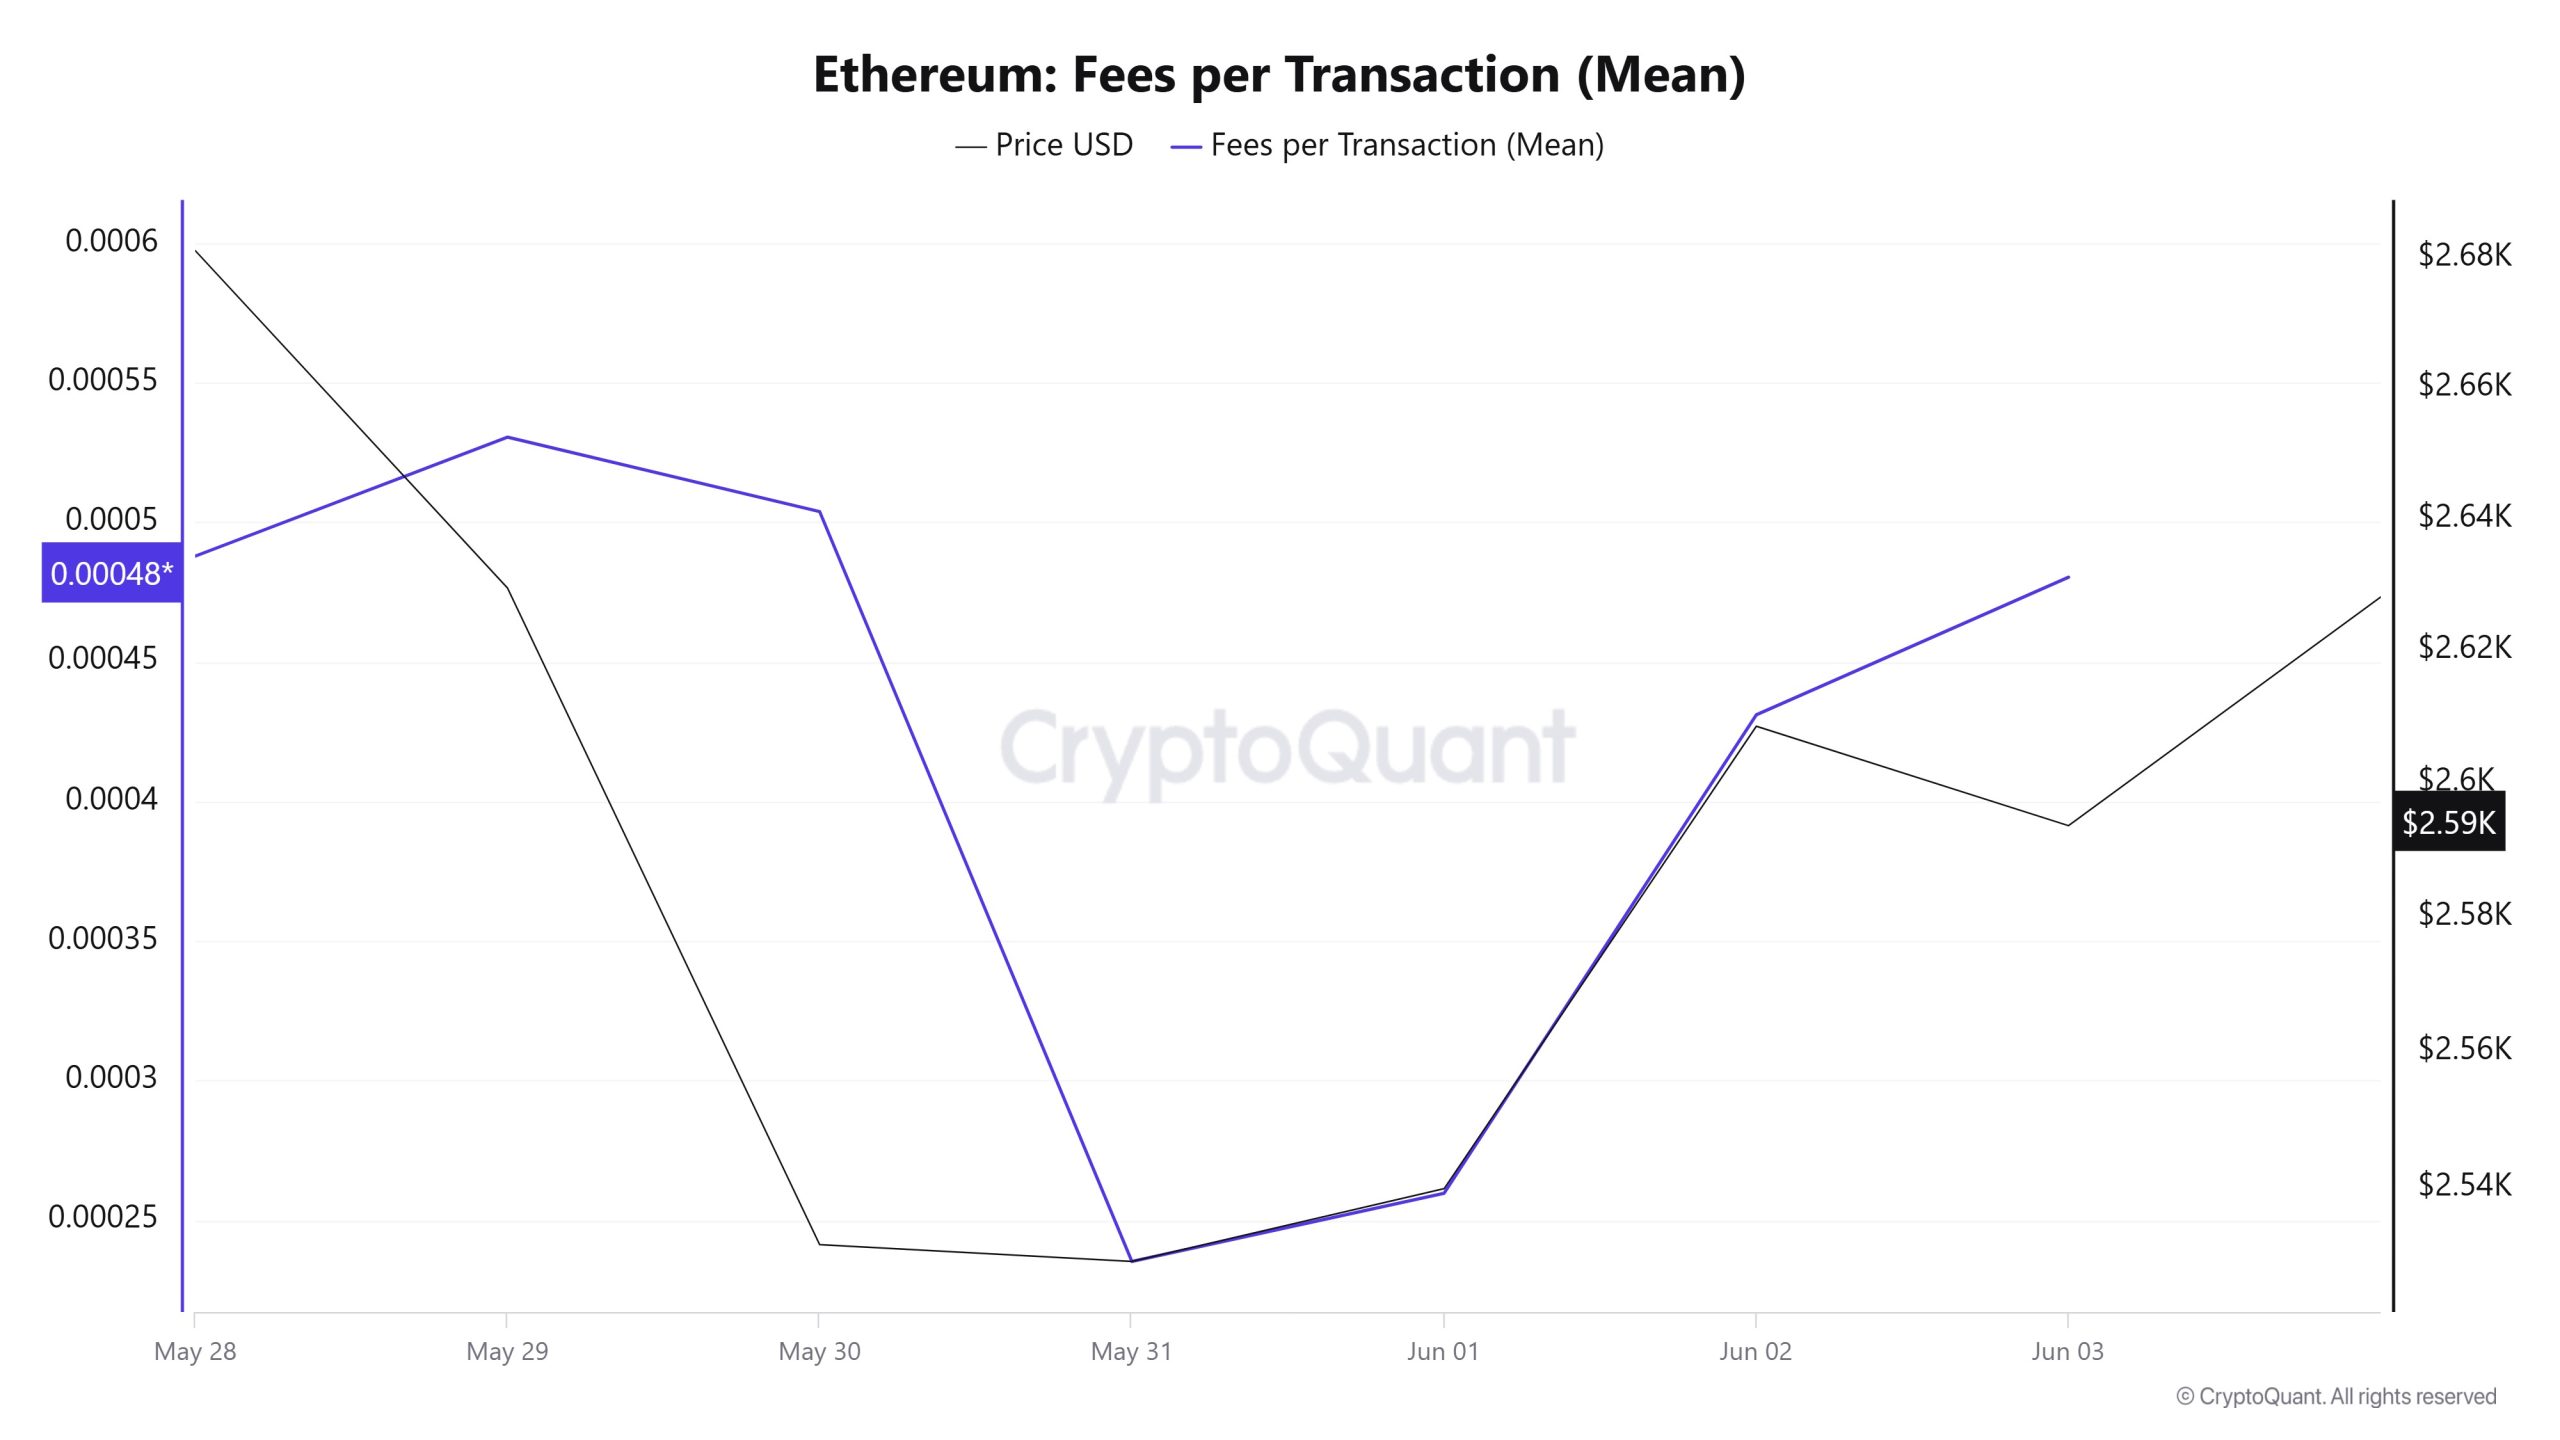
When the Ethereum Fees per Transaction (Mean) data between June 11 and June 17 are analyzed, it is seen that this value was realized at the level of 0.000488065958164542 on June 11, the first day of the week.
Subsequently, a downward trend was observed in this indicator, which fell to 0.000155943581186023 as of June 15, recording its lowest value of the week.
After this level, Ethereum Fees per Transaction (Mean) started to rise again and closed at 0.000325135568106831 on June 17, the last day of the week.
Bitcoin: Fees (Total)
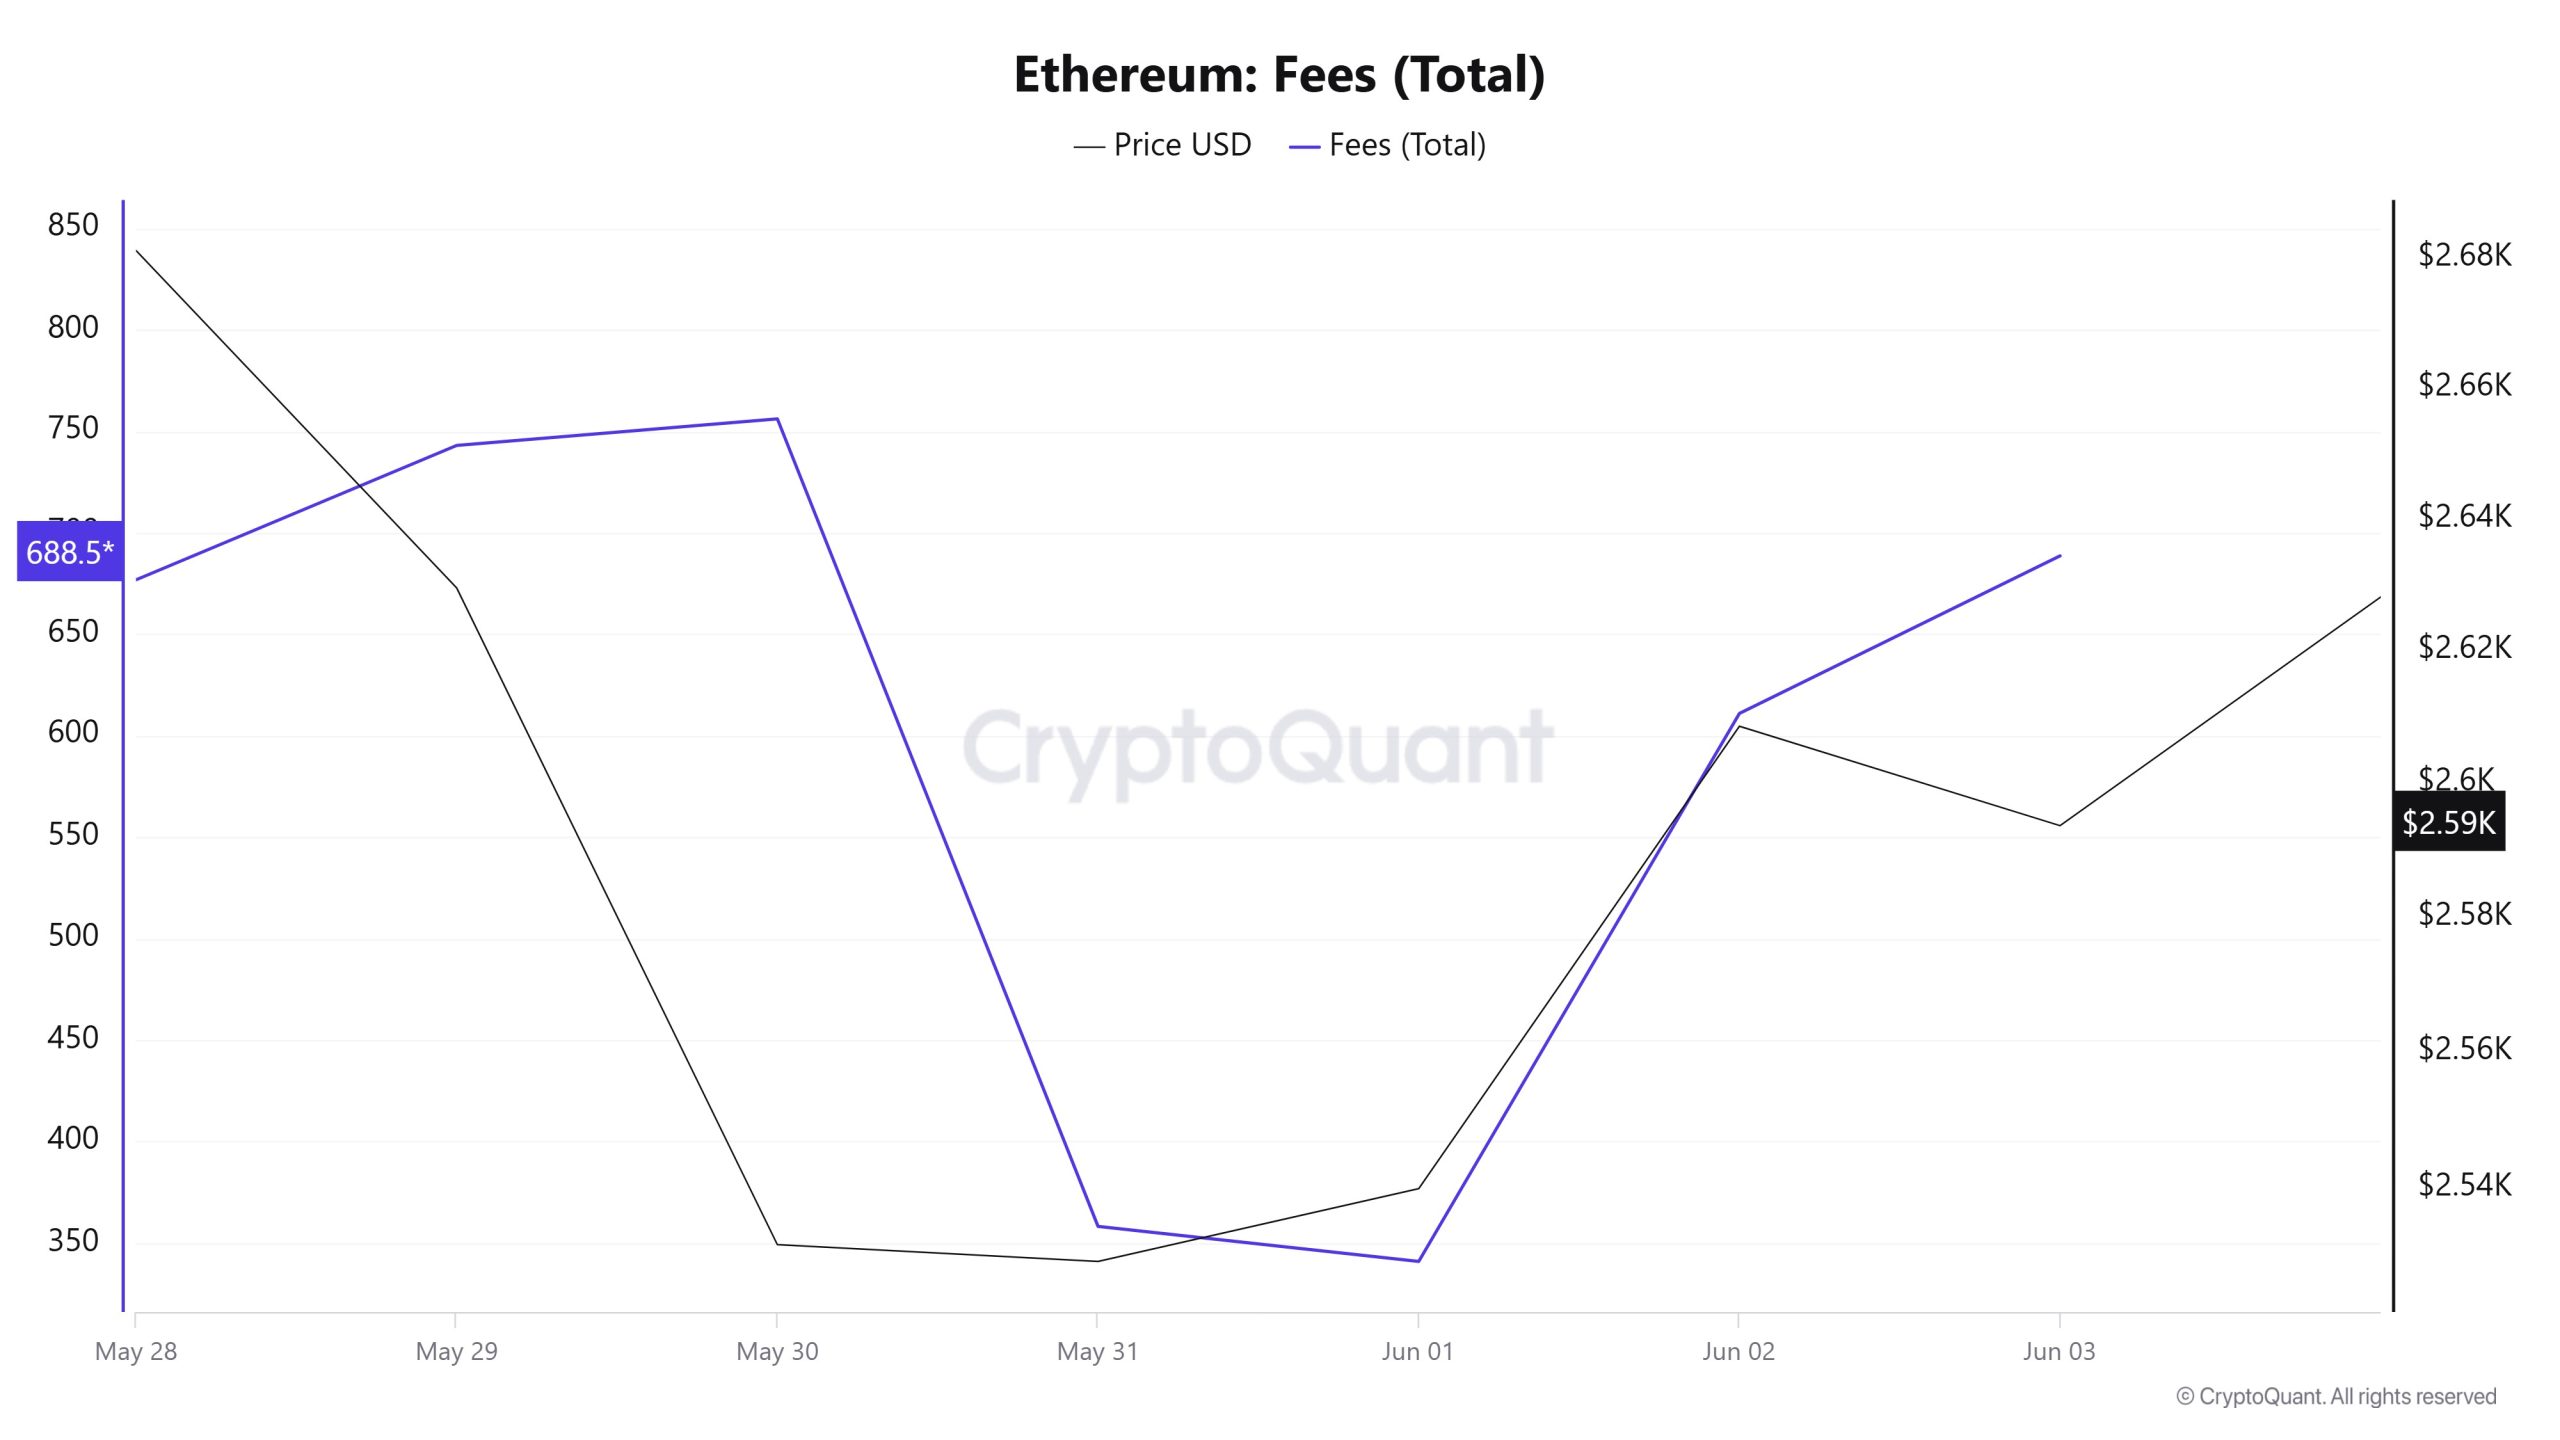
Similarly, when the Ethereum Fees (Total) data between June 11 and 17 is analyzed, it is seen that this value was realized at the level of 708.1695513839638 on June 11, the first day of the week.
Following this, a downward trend was observed in the indicator, which fell to 201.20200799762 as of June 15, recording its lowest value of the week.
After this level, Ethereum Fees (Total) started to rise again and closed at 465.6351006105631 on June 17, the last day of the week.
Blocks Mined
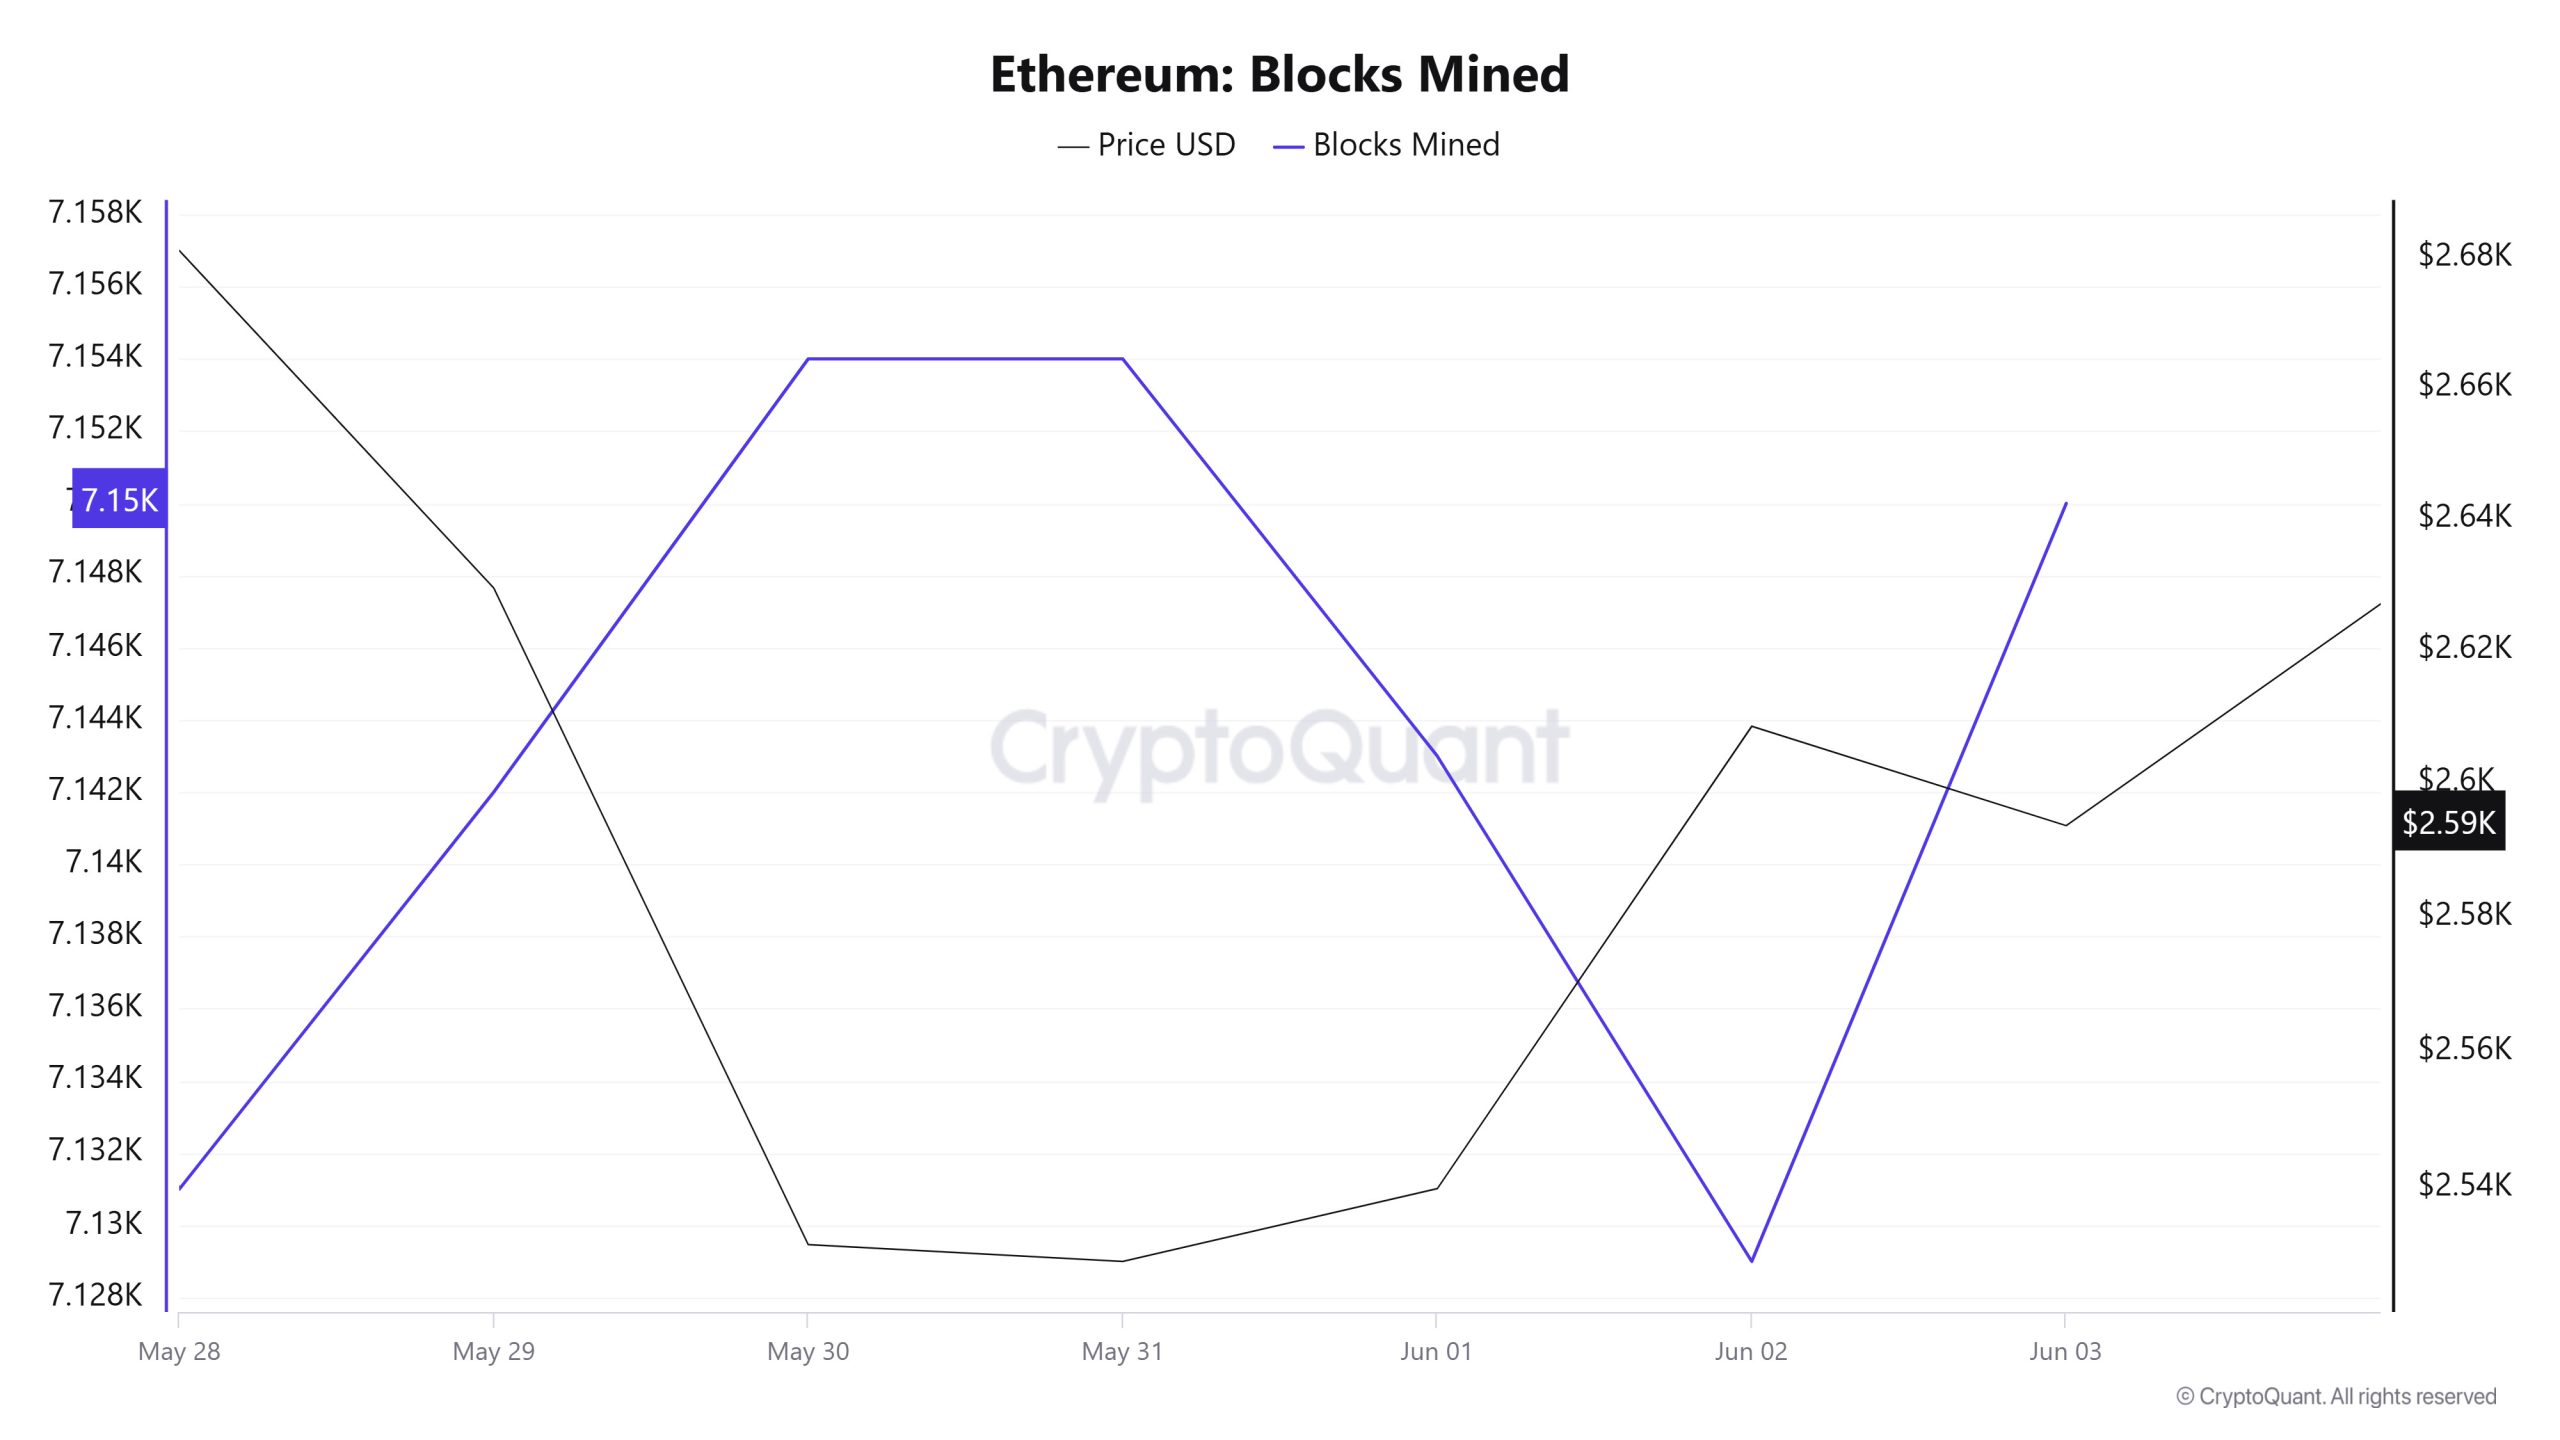
Between June 11 and June 17, Ethereum block production data shows an increase until the middle of the week, followed by a sharp decline. While 7,151 blocks were generated on June 11, this number dropped to 7,139 as of June 17. Although the increase observed at the beginning of the week indicates a short-term acceleration in the network’s transaction verification capacity, the decline in the production number in the following days shows that this momentum could not be sustained.
There was a general negative correlation between the number of block production and the Ethereum price in the relevant period.
Block Size
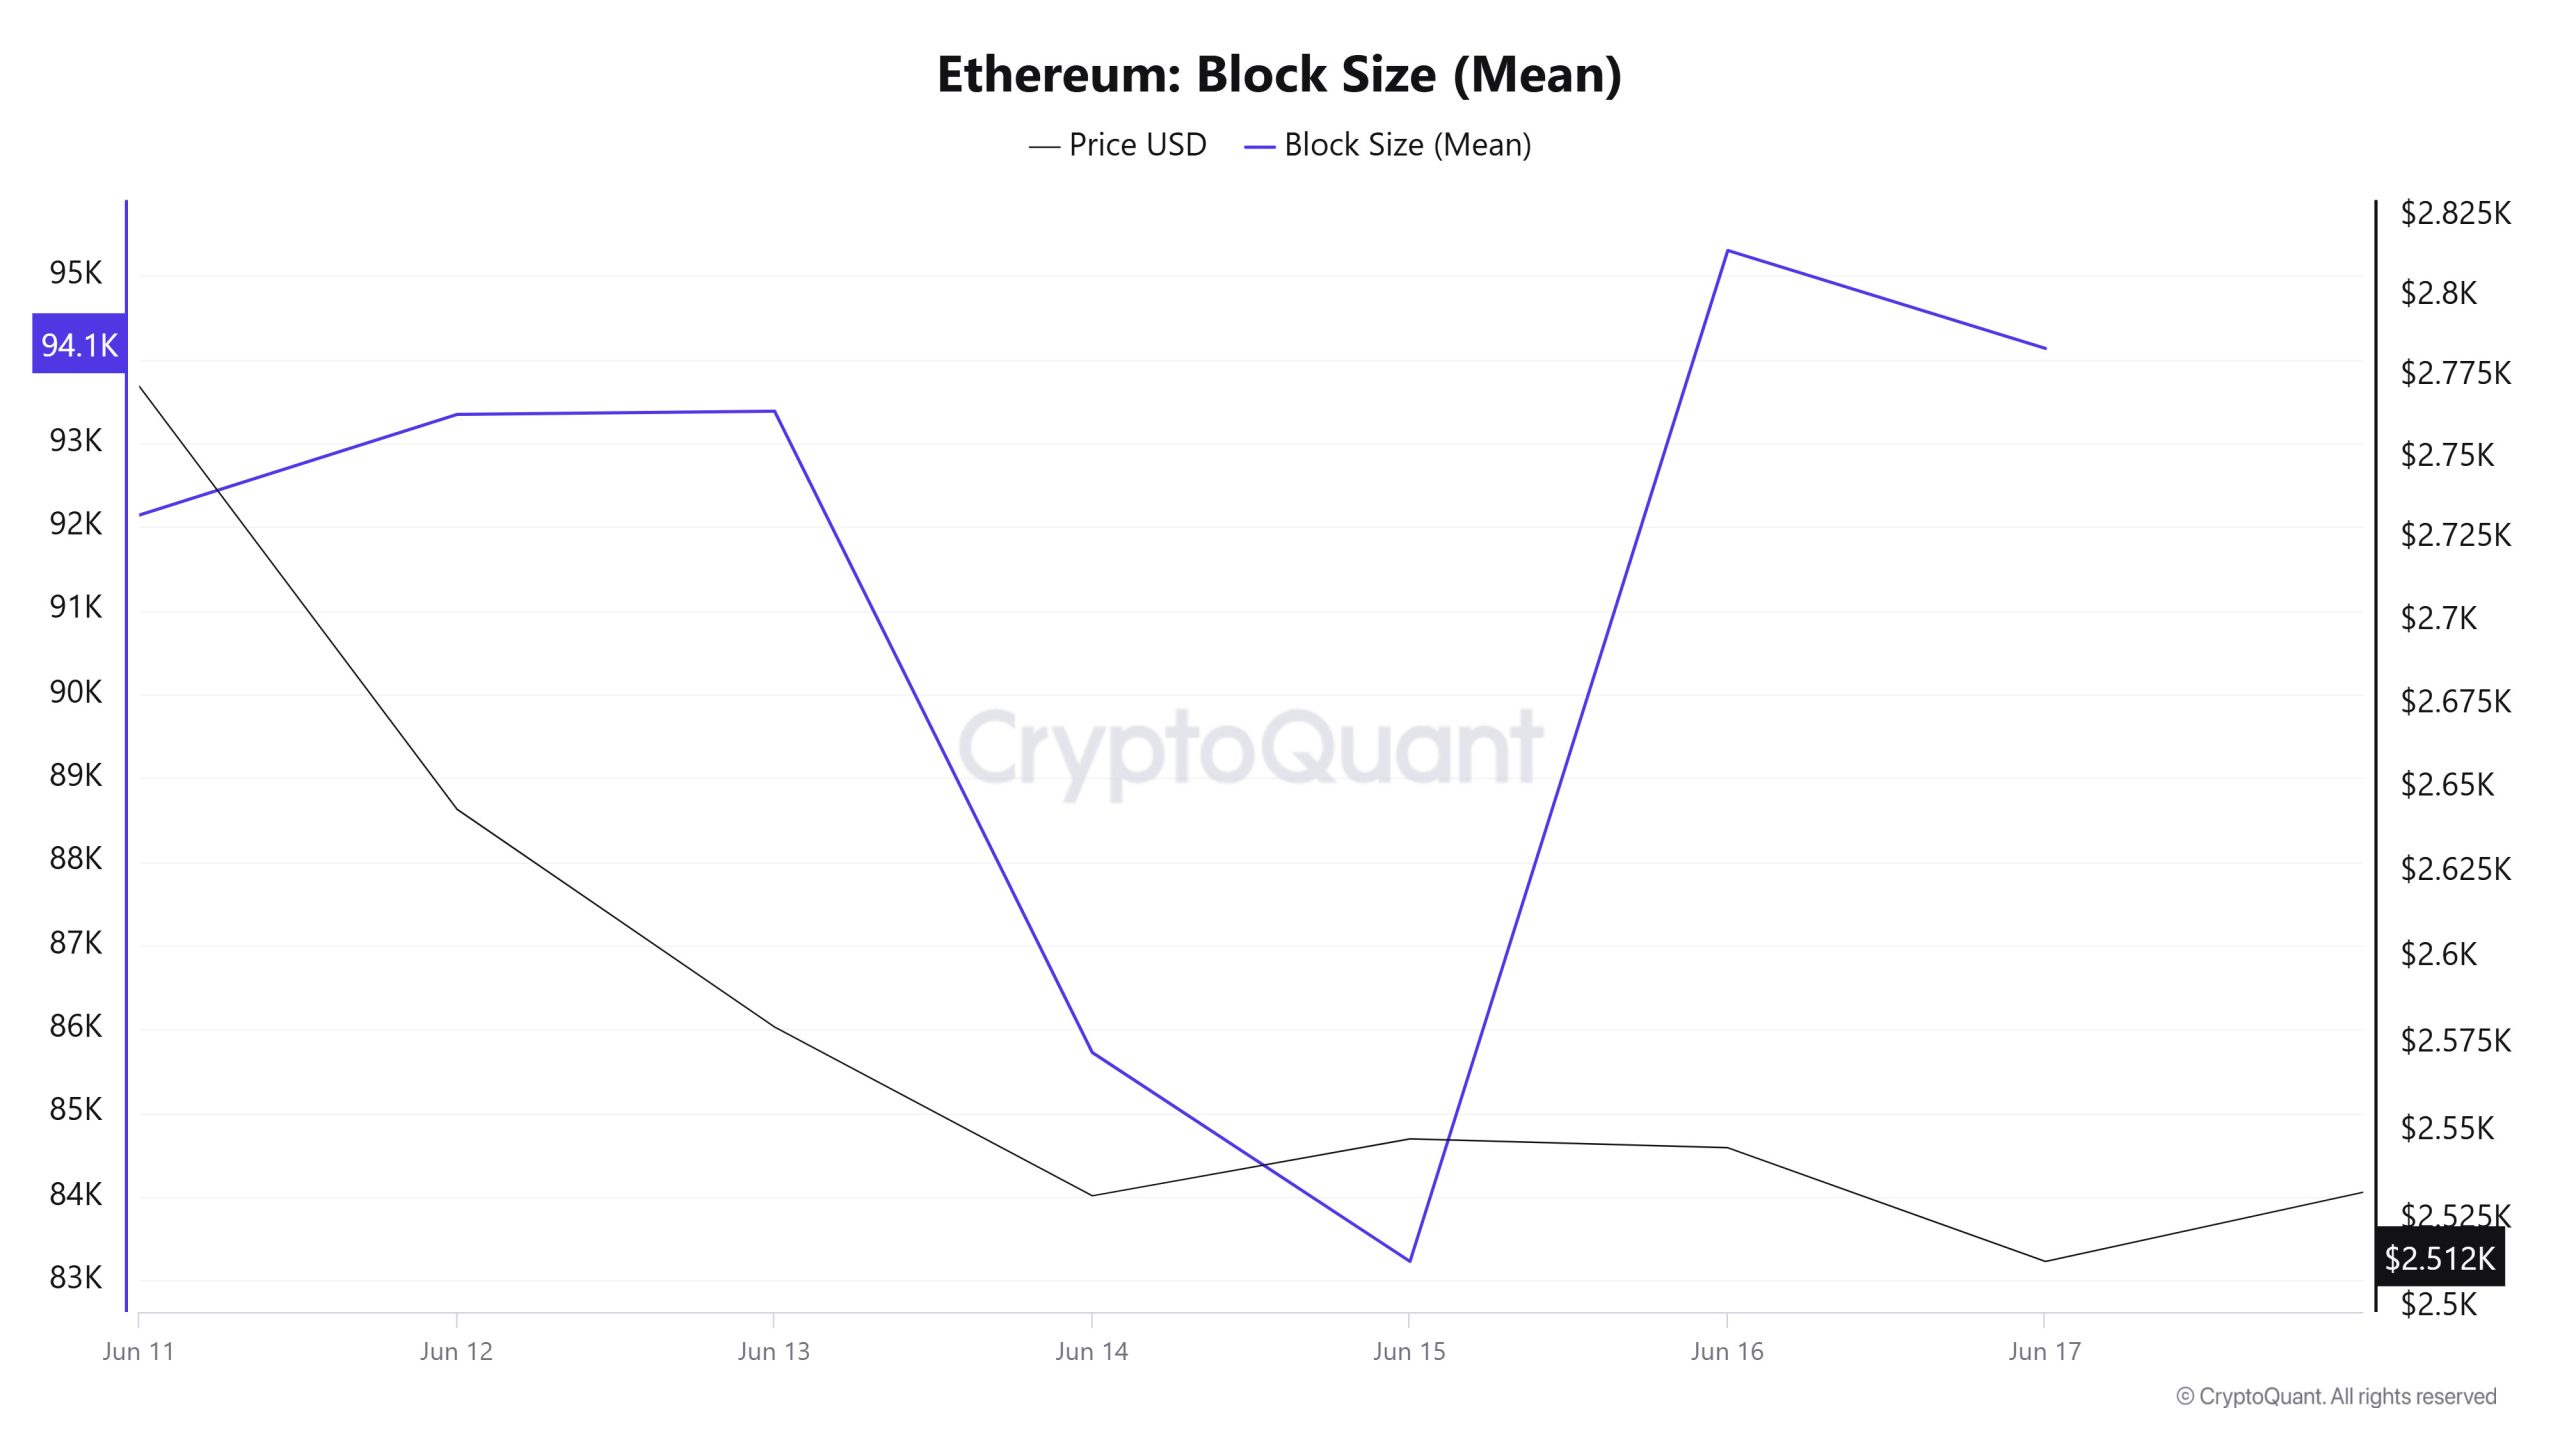
Between June 11 and June 17, Ethereum block size data showed a limited increase in the week. On June 11, the average block size was 92,138 bytes, while this value increased to 94,128 bytes as of June 17.
There was a negative correlation between block size and Ethereum price during the week.
Block Interval
“Ethereum Block Interval Image to be Added”
Between June 11 and June 17, Ethereum block data showed a downward trend in block times until the middle of the week, but towards the end of the week, this trend reversed and an increase occurred. On June 11, the average block time was recorded as 12.08 seconds, while this time increased to 12.10 seconds as of June 17.
During the period in question, Ethereum block duration and price action were positively correlated throughout the week.
Transaction
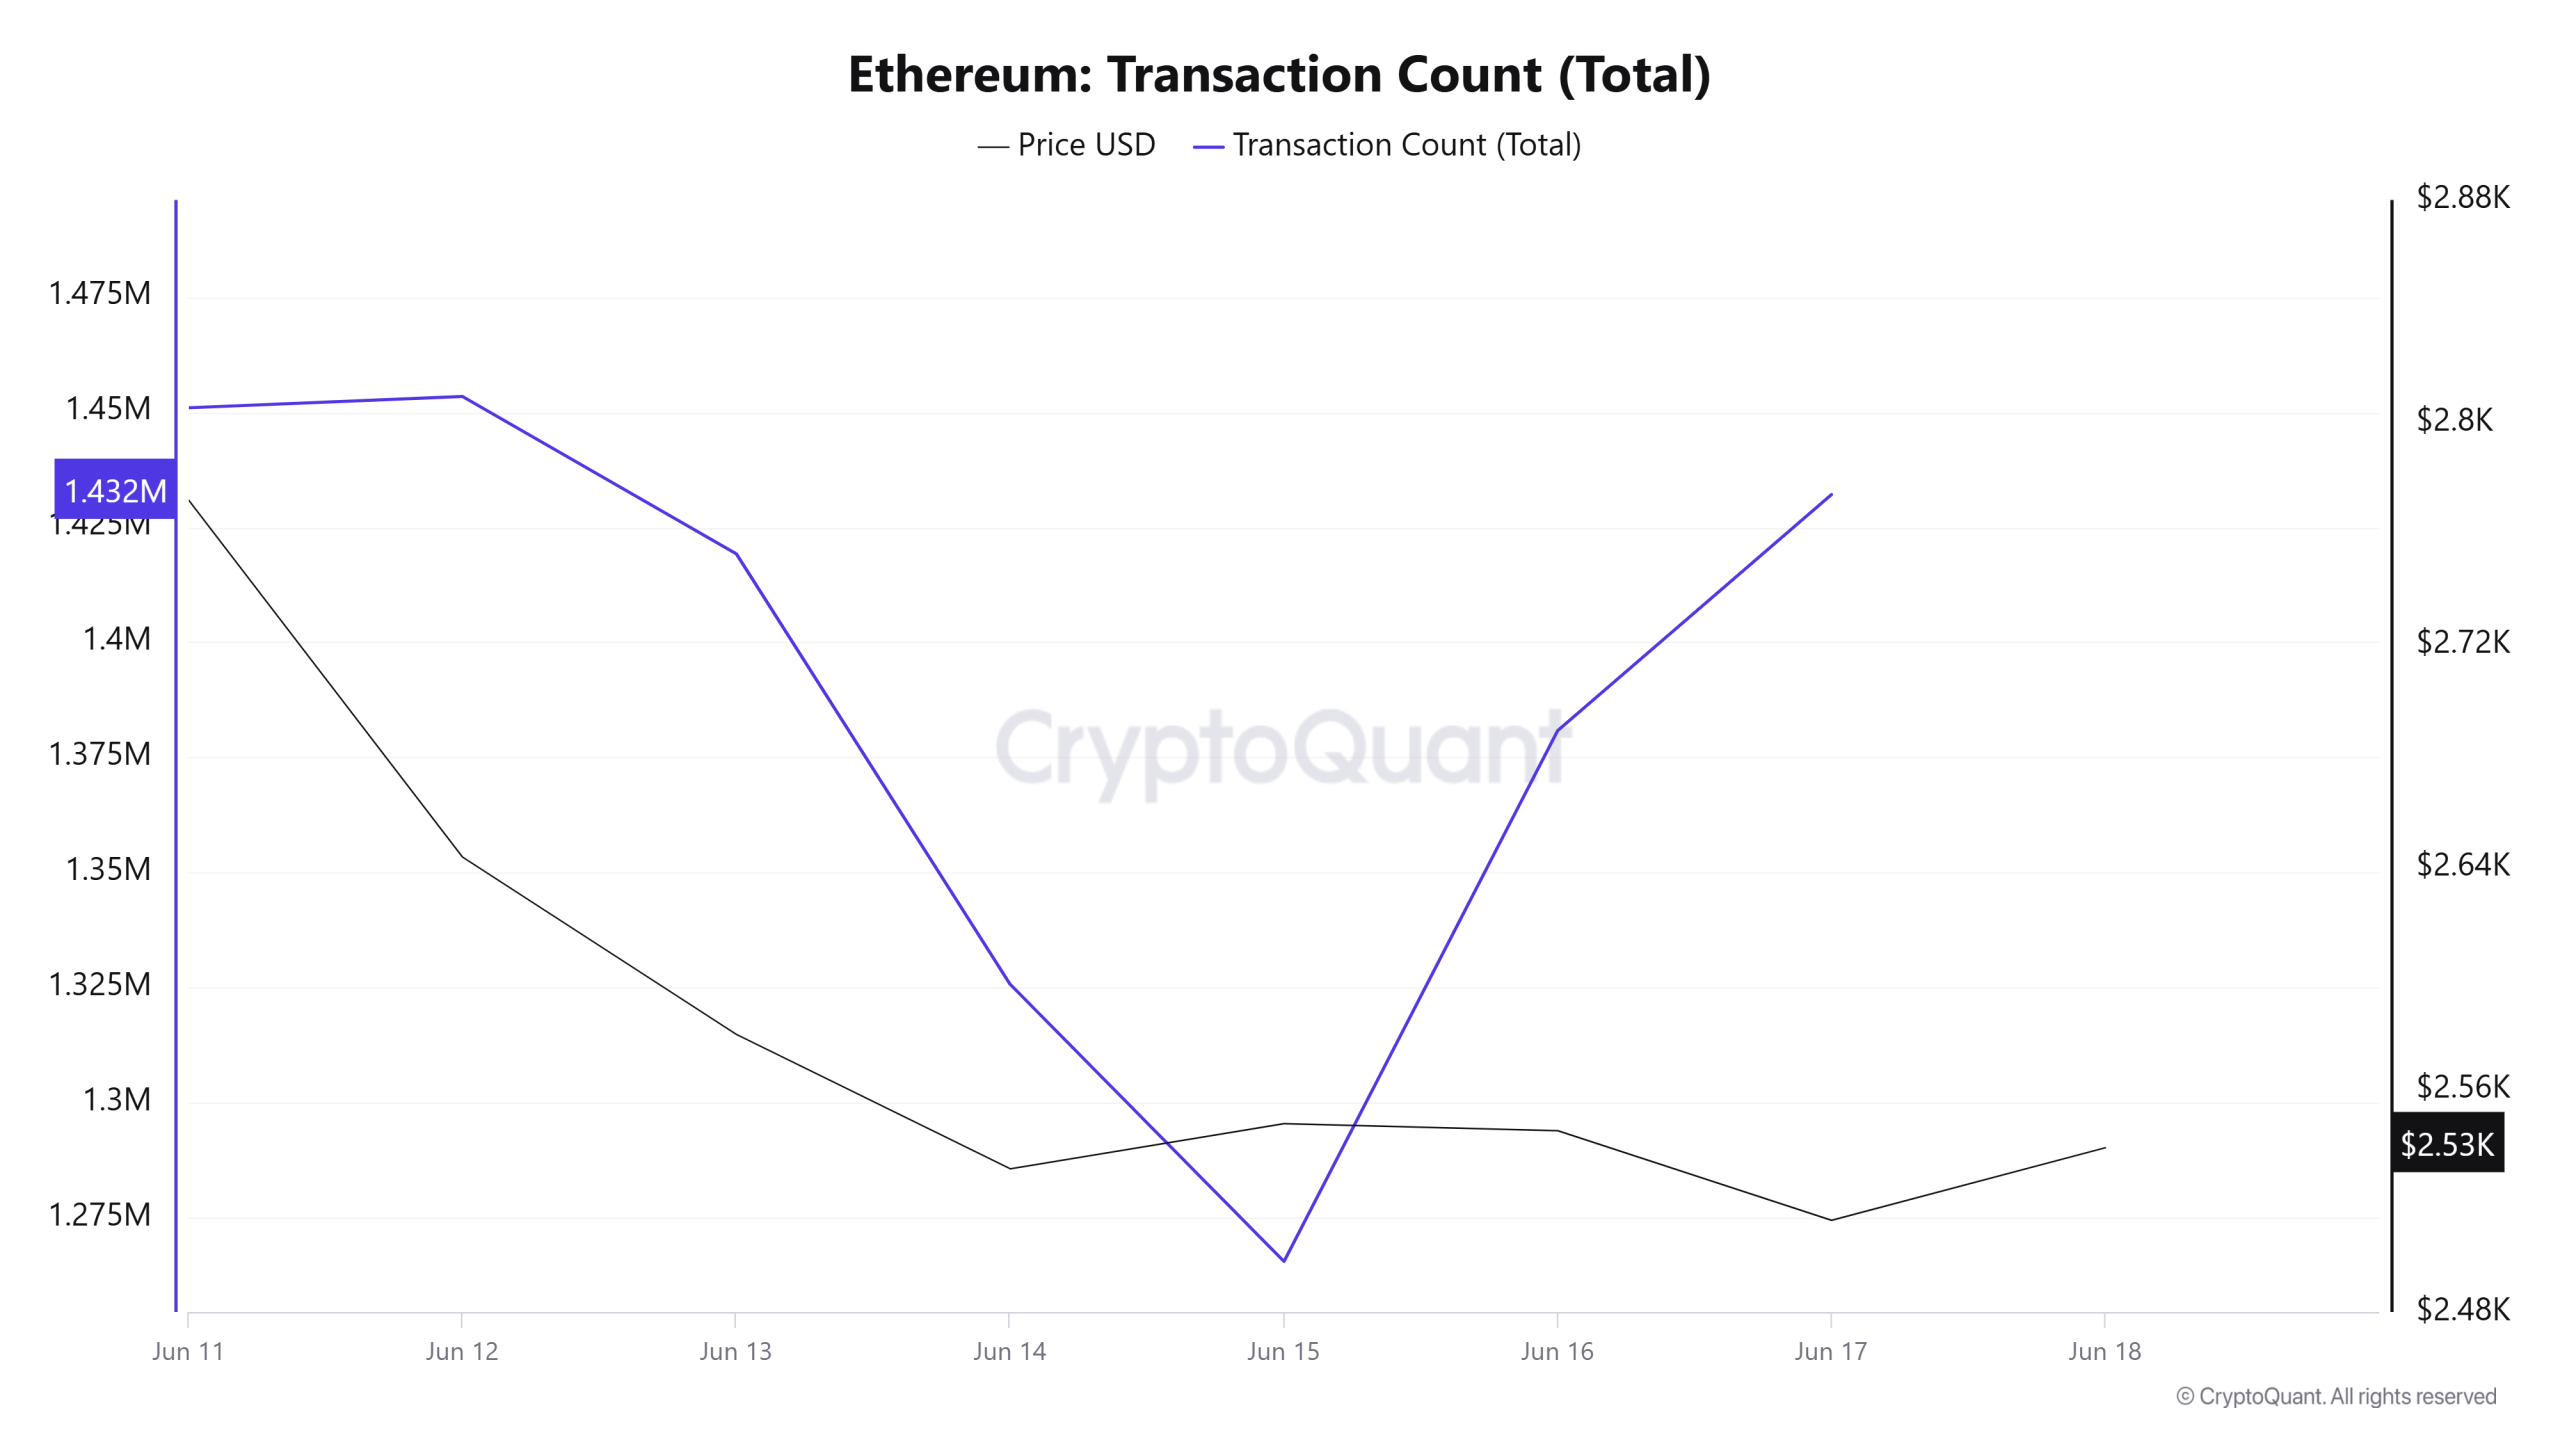
Last week, a total of 11,263,693 transactions were executed on the Ethereum network, while this week it decreased by about 13.63% to 9,727,815. The highest transaction on a weekly basis was 1,453,409 on June 12, while the lowest transaction count was 1,265,510 on June 15.
The increase in the number of transactions indicates that utilization on the network has decreased compared to last week and, accordingly, Ethereum burns have also decreased. The correlation between price and number of transactions was generally stable throughout the week. However, when analyzed on a daily basis, it is seen that the transfer movements on June 11-15 fell along with the price, and on June 16-17, transactions started to recover, but this movement has not yet been supported by price actions.
Tokens Transferred
While the total amount of ETH transferred on the Ethereum network last week was 13,786,133, it decreased by approximately 1.66% to 13,557,583 this week. The transfer of 2,899,871 ETH on June 13 was the highest daily token transfer amount of the week, while the lowest value of the week was recorded on June 15 with only 615,845 ETH transferred.
The decline in the network’s utilization, combined with a decrease in the number of transactions on Ethereum and the amount of ETH transferred, suggests that overall activity is weakening. This suggests that investors are more cautious in the short term and uncertain about the market direction.
This loss of momentum on the chain signals that most participants have switched to a wait-and-see strategy before a new trend starts. However, this calm is usually preceded by significant volatility and could herald a sharp directional breakout in the short term.
Estimated Leverage Ratio
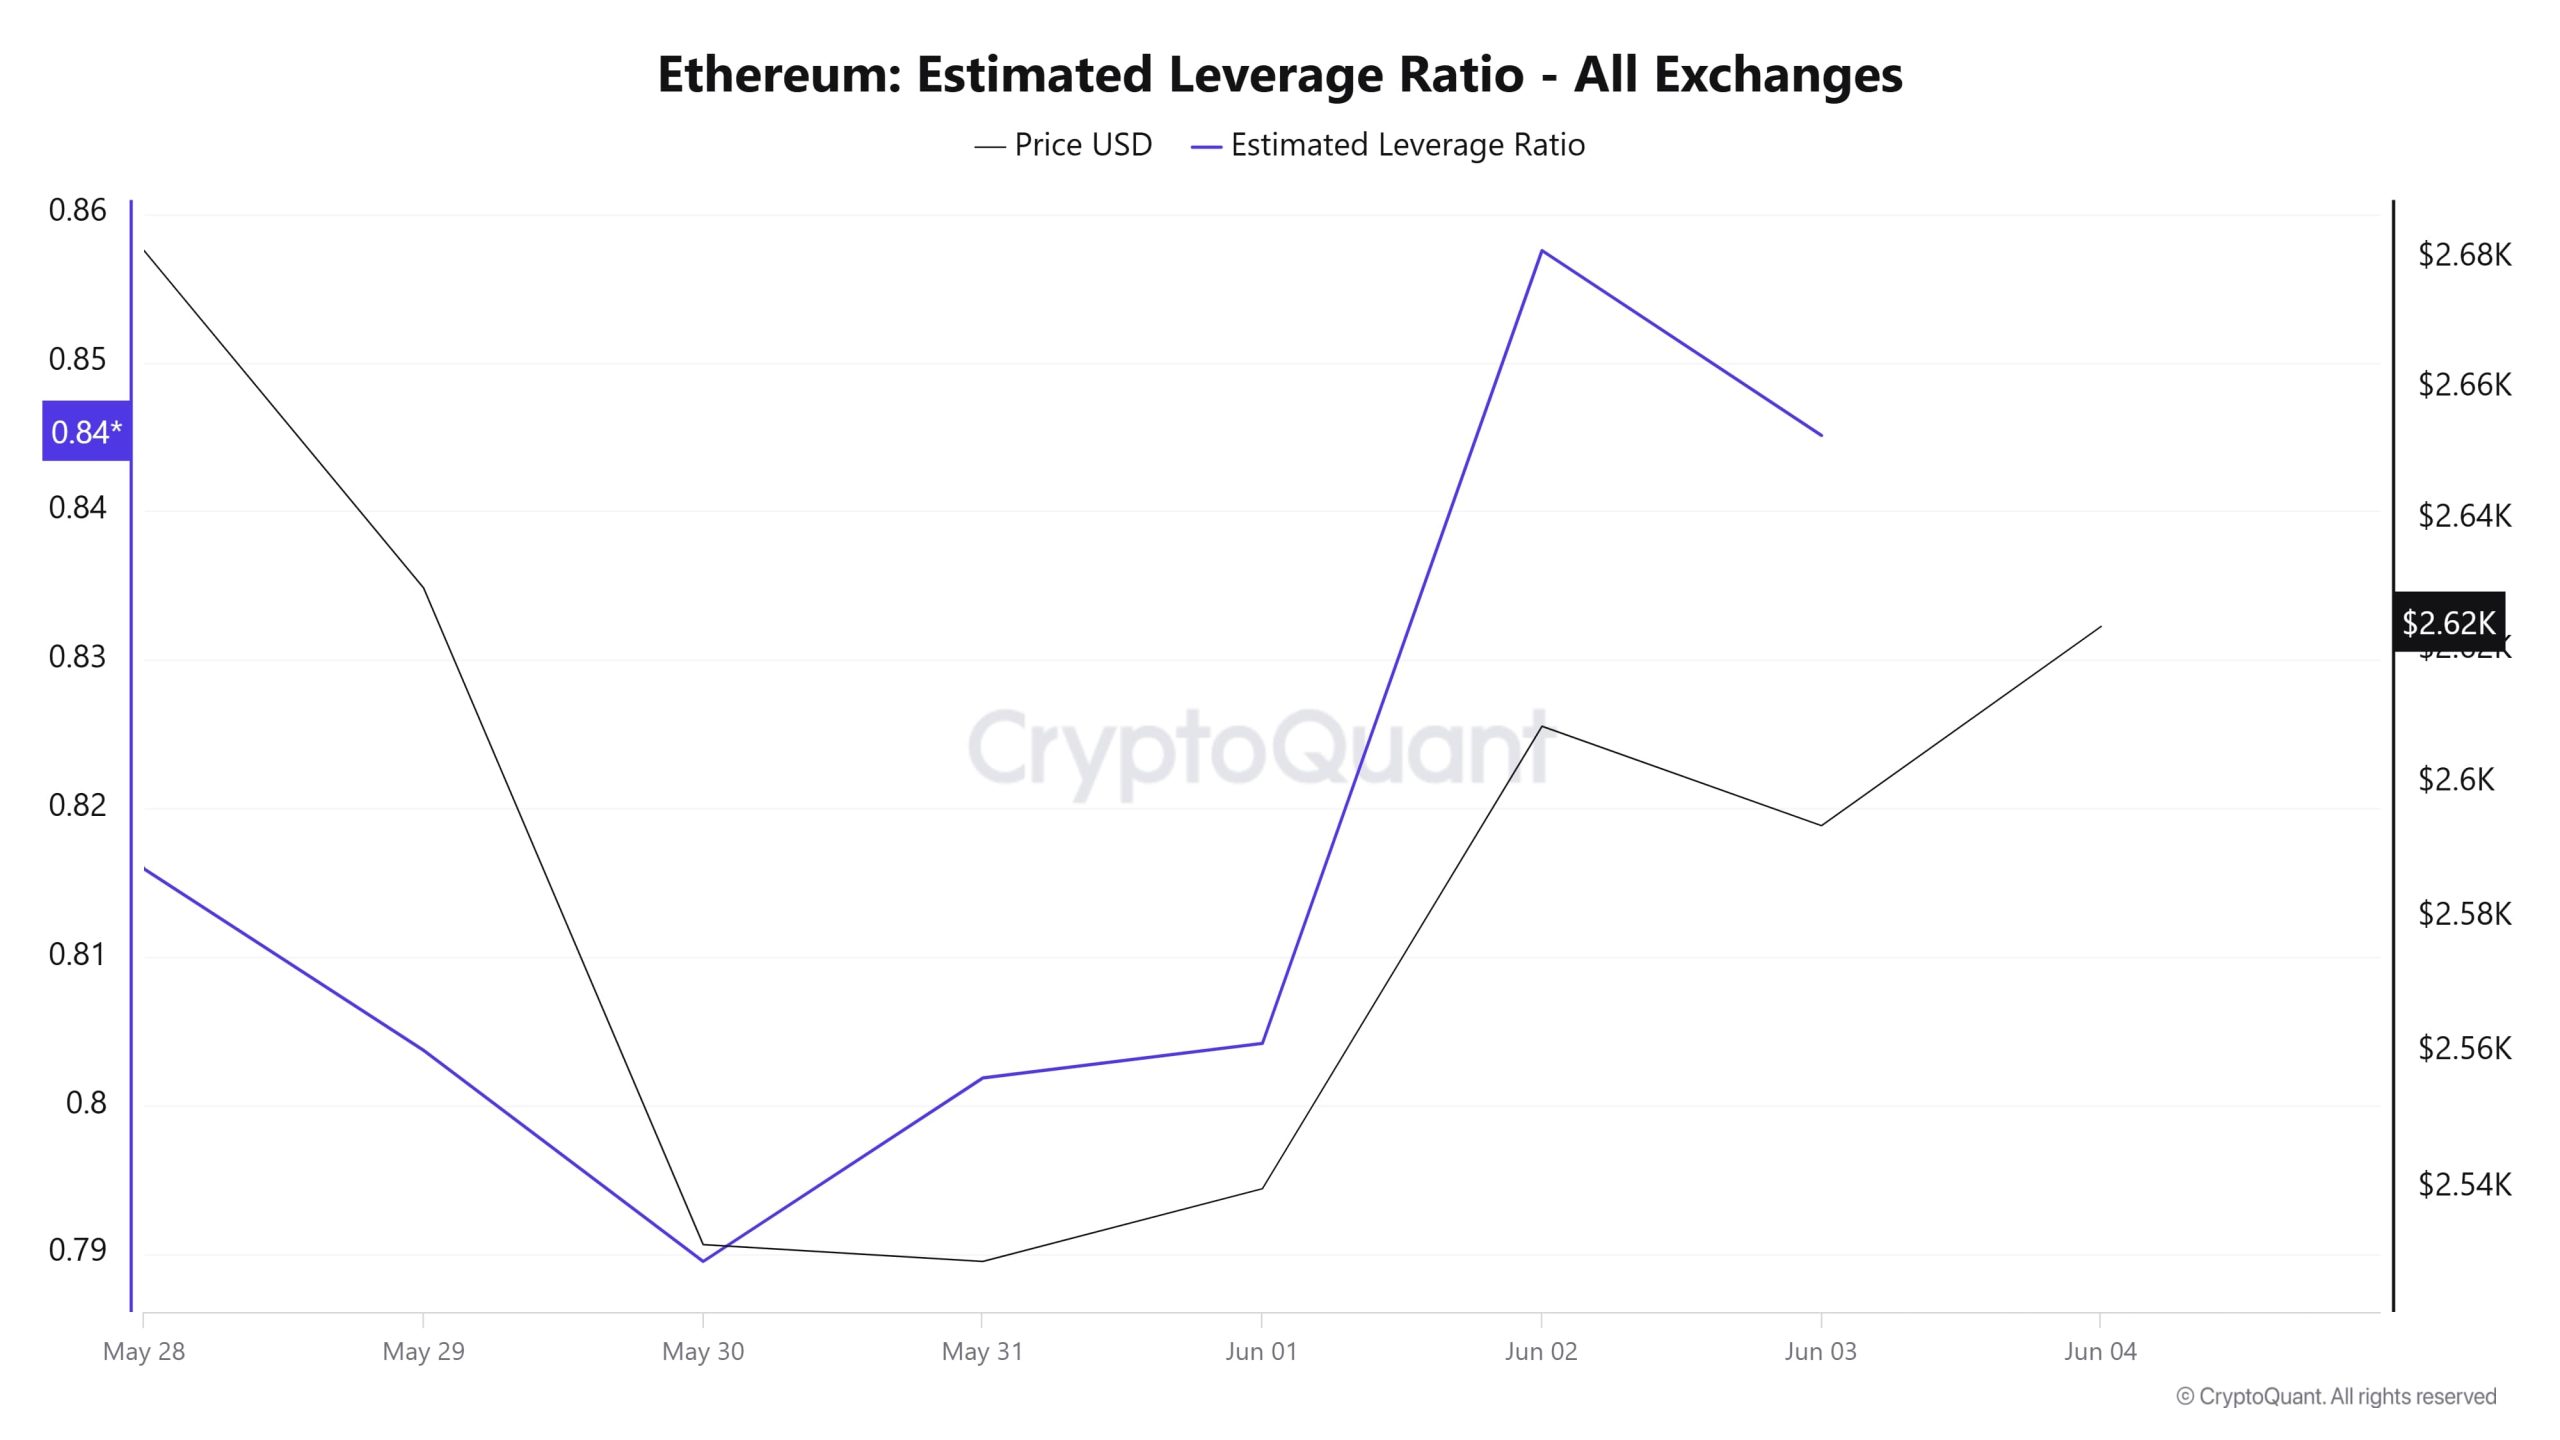
During the 7-day period, the metric generally declined during the first part of the process. ELR (Estimated Leverage Ratio), which had a value of 0.901 at the beginning of the process, was also the highest point of the process. On June 13, it fell to 0.839, the lowest point of the process. The metric, which remained flat for the rest of the process, has a value of 0.853 at the time of writing. A higher ELR means that participants are willing to take on more risk and usually indicates bullish conditions or expectations. It should be noted that these rises can also be caused by dwindling reserves. When we look at Ethereum reserves, there were 18.81 million reserves at the beginning of the process, while this figure decreased during the rest of the process and is currently 18.72 million. At the same time, Ethereum’s Open Interest is seen as 41.43 billion dollars at the beginning of the process. As of now, the volume has decreased in the process and the open interest value stands out as 34.80 billion dollars. With all this data, the ELR metric generally followed a falling trend. With all this data, the price of the asset was valued at $ 2,880 at the peak of the process, while the lowest point was realized at $ 2,440. As of the moment of writing, the depreciation in ELR is reflected in the price with the decrease in the risk appetite of investors and traders and is at $ 2,530. The fact that the open interest rate moved in parallel with the decline in reserves throughout the process explains the slight decrease in the ELR rate. As a result, the decrease in reserves and the decrease in open interest indicate that the market is currently in a pessimistic approach. We can foresee that if the decrease in the amount of reserves continues and the open interest data decreases, the retreat will continue.
ETH Onchain Overall
| Metric | Rise 📈 | Decline 📉 | Neutral ➖ |
|---|---|---|---|
| Active Addresses | ✓ | ||
| Total Value Staked | ✓ | ||
| Derivatives | ✓ | ||
| Supply Distribution | ✓ | ||
| Exchange Reserve | ✓ | ||
| Fees and Revenues | ✓ | ||
| Blocks Mined | ✓ | ||
| Transaction | ✓ | ||
| Estimated Leverage Ratio | ✓ |
*The metrics and guidance in the table do not, by themselves, describe or imply an expectation of future price changes for any asset. The prices of digital assets may vary depending on many different variables. The onchain analysis and related guidance is intended to assist investors in their decision-making process, and making financial investments based solely on the results of this analysis may result in harmful transactions. Even if all metrics produce a bullish, bearish or neutral result at the same time, the expected results may not be seen depending on market conditions. Investors who review the report should take these warnings into account.
LEGAL NOTICE
The investment information, comments and recommendations contained in this document do not constitute investment advisory services. Investment advisory services are provided by authorized institutions on a personal basis, taking into account the risk and return preferences of individuals. The comments and recommendations contained in this document are of a general type. These recommendations may not be suitable for your financial situation and risk and return preferences. Therefore, making an investment decision based solely on the information contained in this document may not result in results that are in line with your expectations.
NOTE: All data used in Ethereum onchain analysis is based on Cryptoqaunt.
