
TECHNICAL ANALYSIS
BTC/USDT
As the crisis in the Middle East deepens with the new attack on the Fordow nuclear facility, Israel’s military operations against Iran are in full swing. The Iranian currency, the rial, lost more than 20% of its value, while foreign exchange transactions came to a standstill at border crossings. Despite global uncertainty, investor interest in digital assets continued, with CoinShares reporting weekly inflows of $1.24 billion. Bitcoin-focused institutional buying also continued, with Strategy strengthening its reserves by buying another 245 BTC.
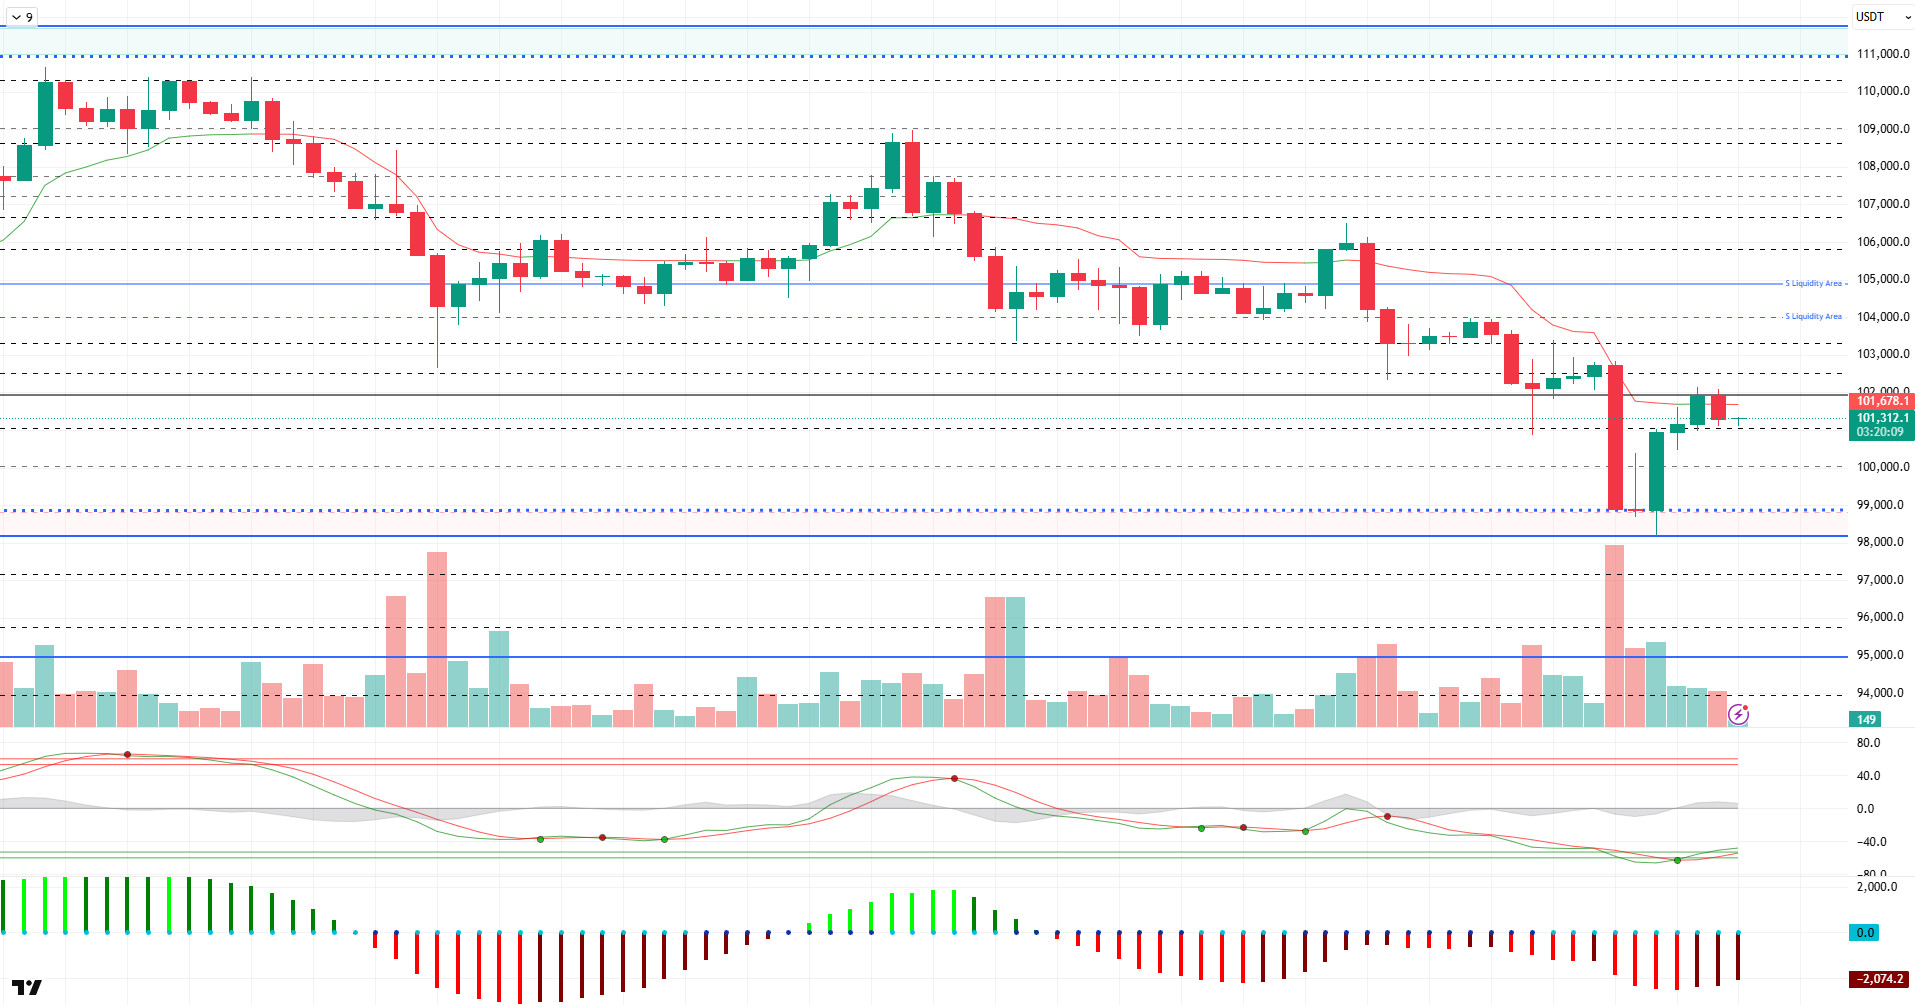
When we look at the technical outlook, it is seen that the BTC price has not yet exceeded the 102,000 level during the day. At the time of writing, BTC has recovered somewhat and continues to trade at 101,500, back above six-digit levels.
On the technical indicators front, the Wave Trend (WT) oscillator is preparing for a trend reversal in the ovelsold region, while the Squeeze Momentum (SM) indicator is moving in negative territory. The Kaufman moving average is positioned at 101,800, just above the price.
When the liquidity data is analyzed, almost all of the buying transactions were liquidated, while the 104,000- 105,000 band with the recent decline appears as the levels where the selling positions are accumulated.
As a result, BTC does not seem to have experienced a significant change compared to the previous analysis. The price, which does not give a clear image for technical recovery, draws attention to the sparseness of buying positions in liquidity data. The critical point for the price to recover in the event of a positive scenario created by fundamental developments and a possible compromise. On the other hand, if bearish movements and selling pressure continue, the 98,000 – 99,000 band will be followed as a reference support area.
Supports 101,400 – 100,000 – 99,000
Resistances 102,400 – 103,300 – 104,000
ETH/USDT
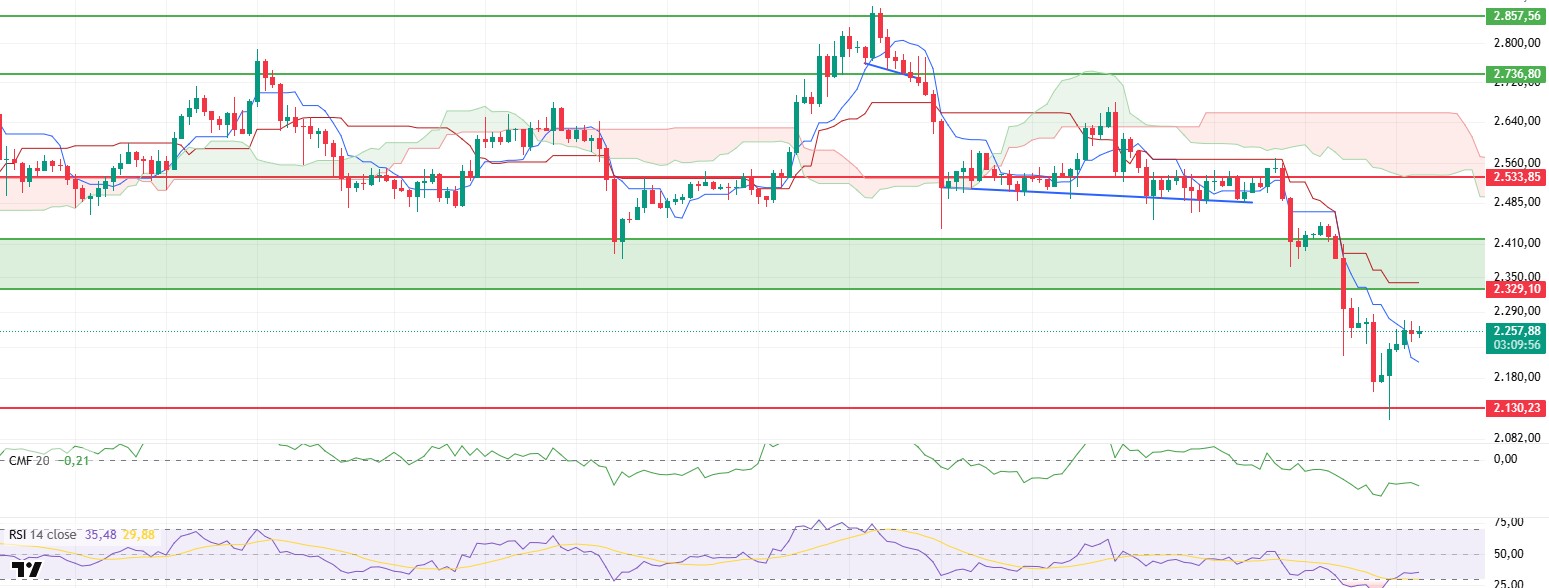
ETH moved in a narrow price range during the day in line with expectations. The price, which tested the $2,261 level again towards the last hours of the day, brought some important signals in technical indicators.
The Chaikin Money Flow (CMF) indicator, which measures liquidity flows, had moved into negative territory after the previous sharp sell-off. Although the CMF value recovered to -0.18 with a slight buying reaction in the overnight hours, it fell again during the day and remained in the negative zone. This outlook indicates that selling pressures and limited liquidity outflows still persist in the market.
When the Ichimoku indicator is analyzed, it can be considered as a short-term positive sign that the price is holding above this level despite the sharp retracement at the tenkan level with the last bearish movement. This suggests that, at least in the short term, buyers have created a certain line of defense and the market is in search of balance.
The Relative Strength Index (RSI) indicator managed to maintain its upward momentum after breaking out of the oversold zone. This confirms that there is a strengthening momentum behind the current price movements. This trend in RSI stands out as a positive technical signal for possible upward pricing.
Overall, with these signs of recovery in technical indicators, the price is likely to target the resistance line at $2,329 in the short term. However, the possibility of geopolitical risks coming back to the agenda and the CMF indicator still remaining in the negative zone indicate that upward movements may remain limited and the risk of the price testing the support area at the $2,130 level again in a possible weakness is alive.
Supports 2,130 – 2,029 – 1,802
Resistances 2,329 – 2,533 – 2,736
XRP/USDT
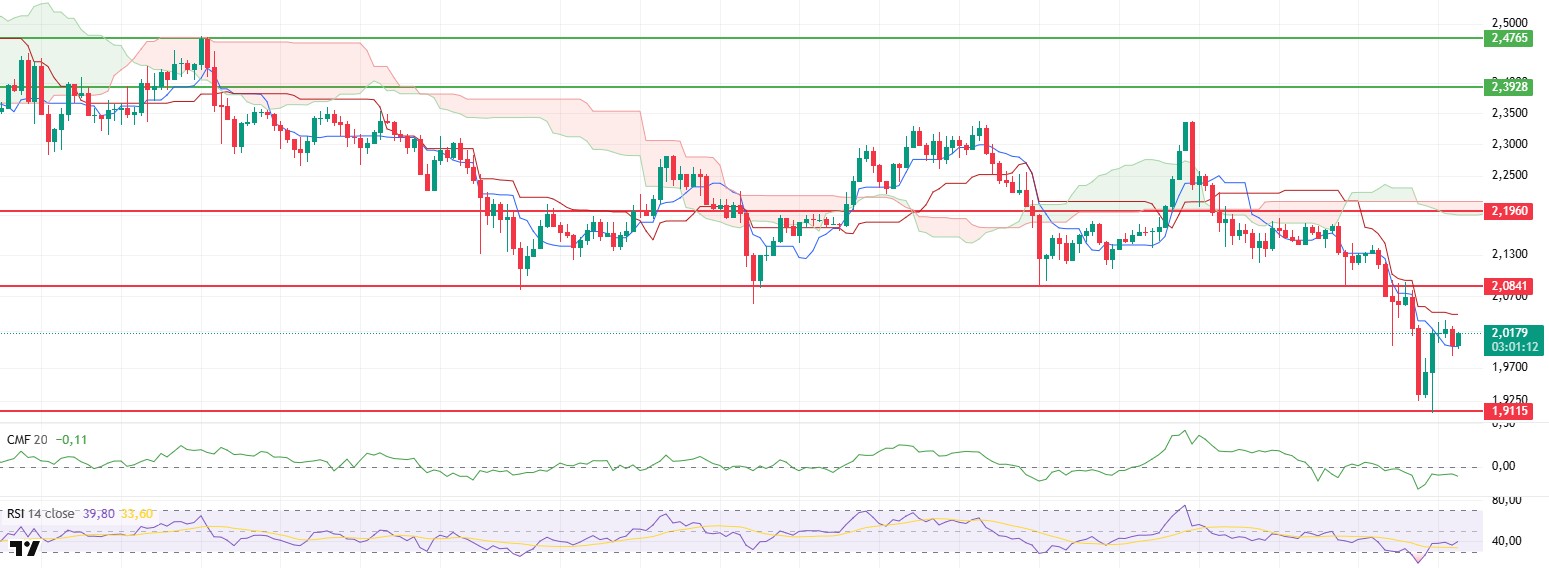
XRP retreated to the tenkan level with selling pressure during the day, but managed to rise above the $2.00 level again with reaction buying from this point. Although this movement shows that short-term buyer interest still persists, the uncertainty in the technical outlook draws attention.
When the Ichimoku indicator is analyzed, the fact that the price is stuck between the tenkan and kijun levels indicates that the indecision in determining the direction continues. While pricing in this range suggests that the market has entered a short-term stabilization process, the fact that the price is still under the kumo cloud technically reveals that the downtrend continues.
The Chaikin Money Flow (CMF) indicator, which measures liquidity flows, showed a slight recovery after crossing into negative territory with the previous sharp declines. While this suggests that liquidity inflows to the market continue, albeit limited, the fact that the indicator remains in negative territory confirms that buyers are struggling to gain strength and the cautious mood in the market continues.
Relative Strength Index (RSI), on the other hand, continued its upward trend after breaking out of oversold territory, indicating that momentum has picked up again. This movement in the RSI is among the strong technical signals that support the possibility of a short-term recovery.
Considering the technical outlook, it can be expected that the potential upward movement may continue if the price maintains above the $2.00 level. In this scenario, the kijun resistance at the $2.04 level may come to the fore first. If this level can be exceeded in volume, the next target will be the main resistance line at $2.08. However, the ongoing geopolitical risks and the fact that the CMF indicator is still in the negative zone increase the fragility of the upward movement. For this reason, if the price drops below $2.00 again, the $1.91 level stands out as strong support; If this region is broken, the possibility of deepening sales should not be ignored.
Supports 1.9115 – 1.7226 – 1.6309
Resistances 2.0841 – 2.1960- 2.3928
SOL/USDT
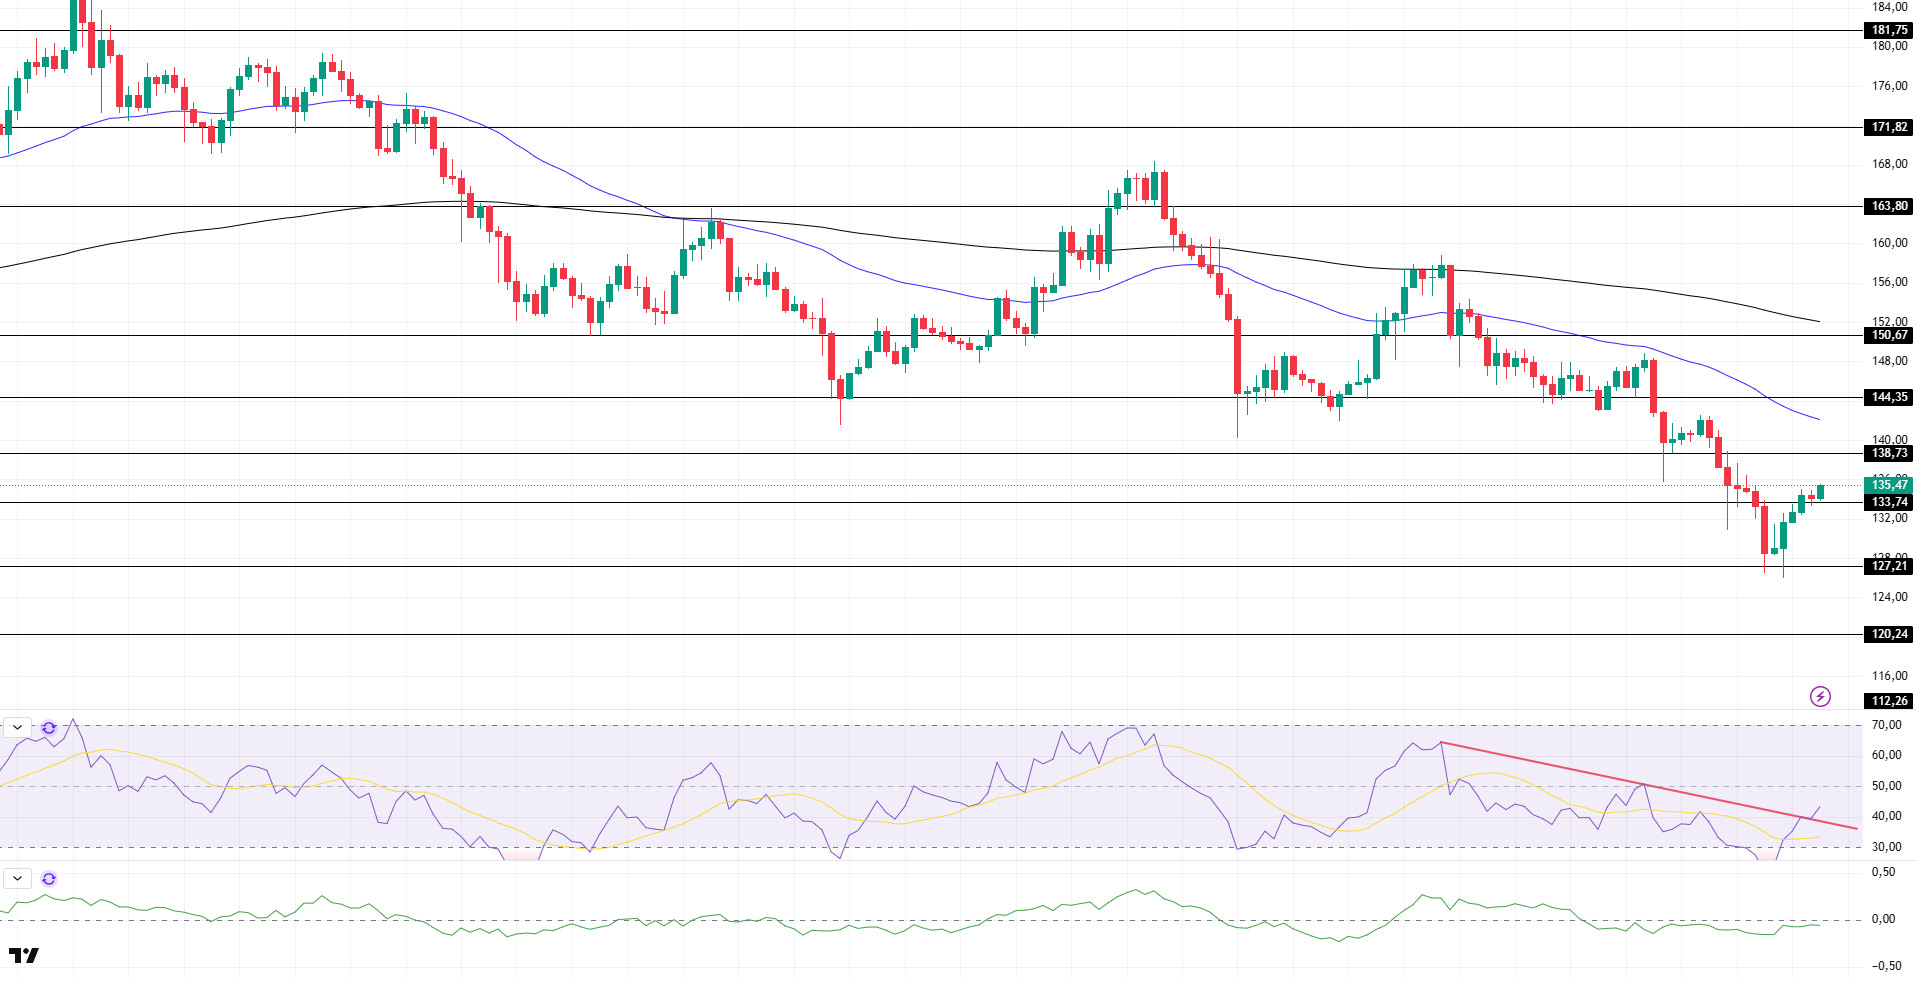
SOL price moved sideways during the day. The asset accelerated from the strong support level of $127.21 and managed to stay above the $133.74 level. If the upward movement continues, it may test the $138.73 level and the 50 EMA (Blue Line) moving average as resistance. Candle closures below the $133.74 level may experience a retracement.
On the 4-hour chart, the 50 EMA continued to be below the 200 EMA. This suggests that the bearish trend may continue in the medium term. At the same time, the fact that the price is below both moving averages suggests that the market may continue to retrace in the short term at the moment. On the other hand, the large distance between the price and both moving averages may allow the price to rebound or move sideways. Chaikin Money Flow (CMF-20) continued to be in the negative territory; in addition, the decrease in daily inflows may take CMF deeper into the negative territory. Relative Strength Index (RSI-14) remained in the middle of the negative zone. On the other hand, it is currently testing the downtrend that started on June 16 as resistance. In case of an uptrend due to macroeconomic data or positive news on the Solana ecosystem, the $138.73 level stands out as a strong resistance point. If this level is broken upwards, the rise can be expected to continue. If there are pullbacks due to contrary developments or profit realizations, the $ 127.21 level can be tested. In case of a decline to these support levels, the increase in buying momentum may offer a potential bullish opportunity.
Supports 133.74 – 127.21 – 120.24
Resistances 138.73 – 144.35 – 150.67
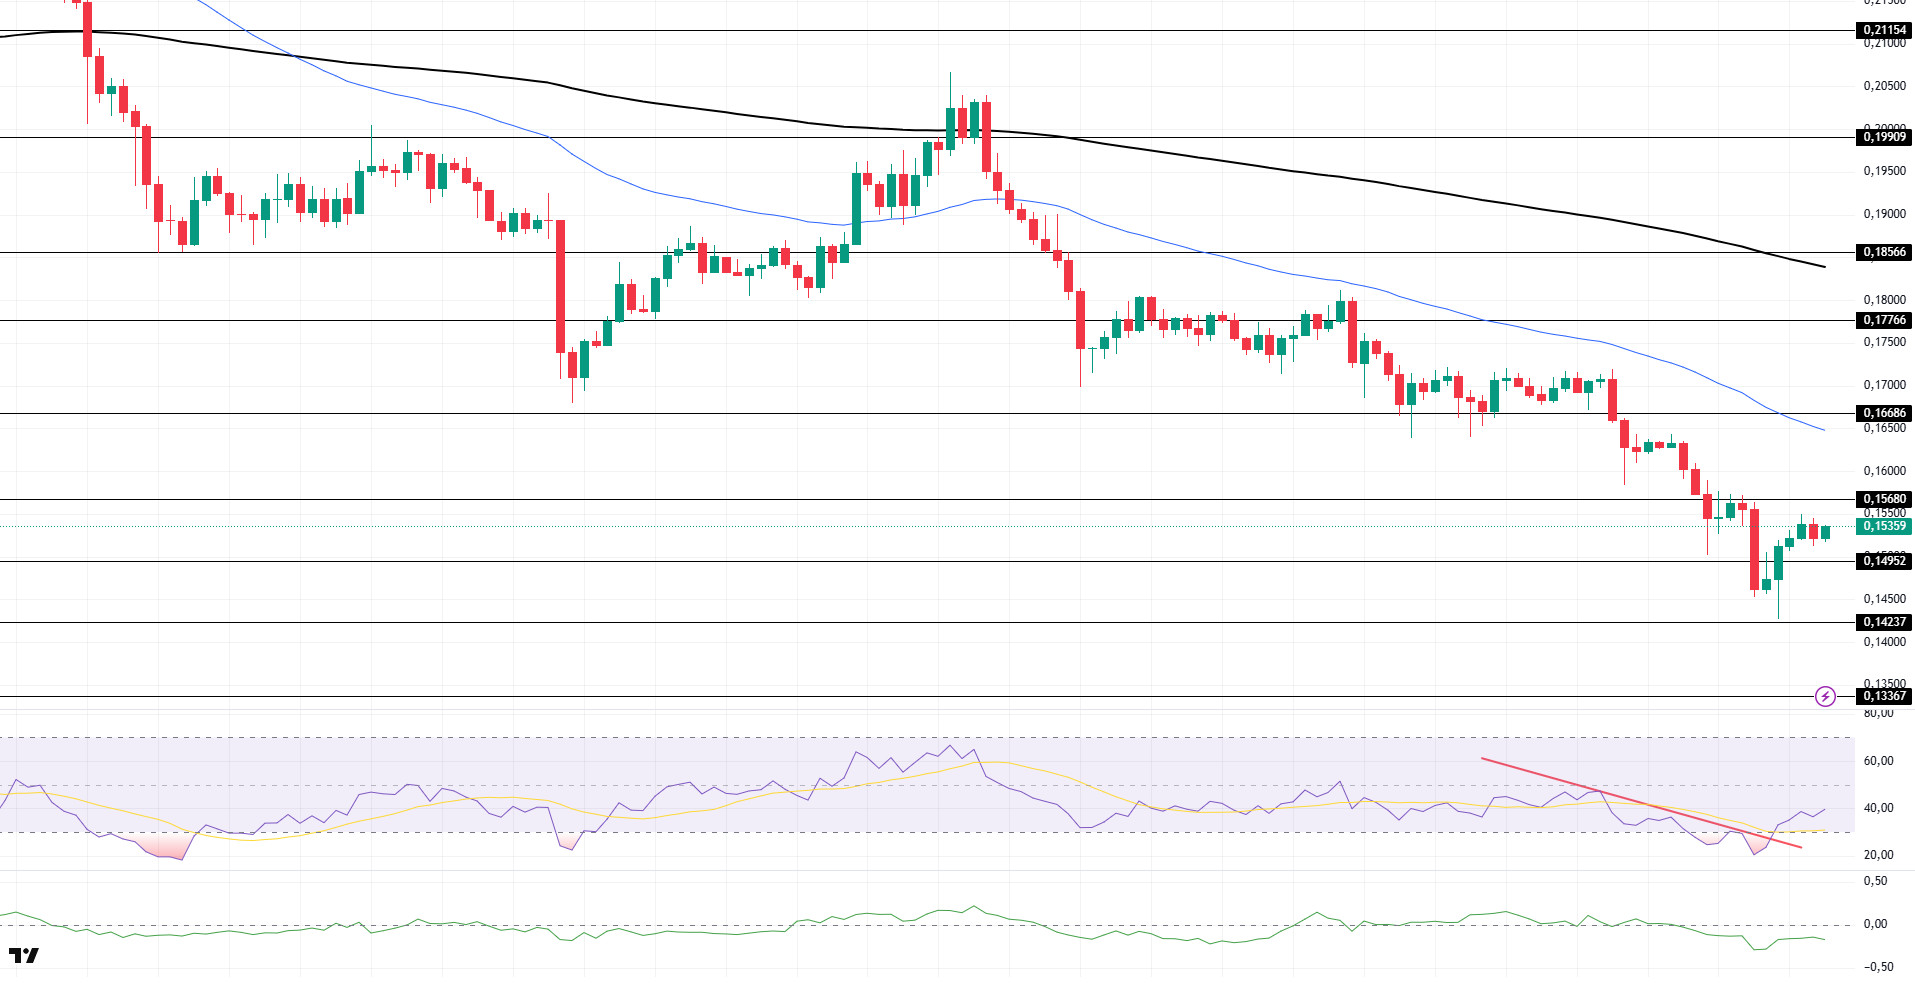
DOGE/USDT
The DOGE price moved sideways during the day. The asset, which managed to hold above the strong support level of $ 0.14952, may test the $ 0.16686 level if it continues to accelerate. Otherwise, the strong support level of $ 0.14237 should be followed.
On the 4-hour chart, the 50 EMA (Blue Line) continues to be below the 200 EMA (Black Line). This suggests that the asset is bearish in the medium term. The fact that the price is below the two moving averages signals that the asset remains bearish in the short term. Chaikin Money Flow (CMF-20) remained in negative territory. In addition, negative inflows may push CMF deeper into the negative territory. Relative Strength Index (RSI-14) continued to be in negative territory. However, it remained above the downtrend that has formed since June 20. This could be bullish. The $0.16686 level stands out as a strong resistance zone in the event of a rally in line with political developments, macroeconomic data or positive news flow in the DOGE ecosystem. In the opposite case or possible negative news flow, the $0.14237 level may be triggered. In case of a decline to these levels, the increase in momentum may start a new bullish wave.
Supports 0.14952 – 0.14237 – 0.13367
Resistances 0.15680 – 0.16686 – 0.17766
Legal Notice
The investment information, comments and recommendations contained herein do not constitute investment advice. Investment advisory services are provided individually by authorized institutions taking into account the risk and return preferences of individuals. The comments and recommendations contained herein are of a general nature. These recommendations may not be suitable for your financial situation and risk and return preferences. Therefore, making an investment decision based solely on the information contained herein may not produce results in line with your expectations.