
BTC/USDT
Last week was an eventful week with both legislative activities and macro data. With the annual core inflation data coming in below expectations, uncertainties regarding the Fed’s monetary policy came back to the agenda, while the Beige Book report indicated that the economic outlook shifted from neutral to pessimistic. In light of these developments, the nearest interest rate cut expectation points to September. On the other hand, the House of Representatives passed three important bills, while President Trump made statements that would pave the way for pension funds to invest in cryptocurrencies and called for a rate cut for the Fed.
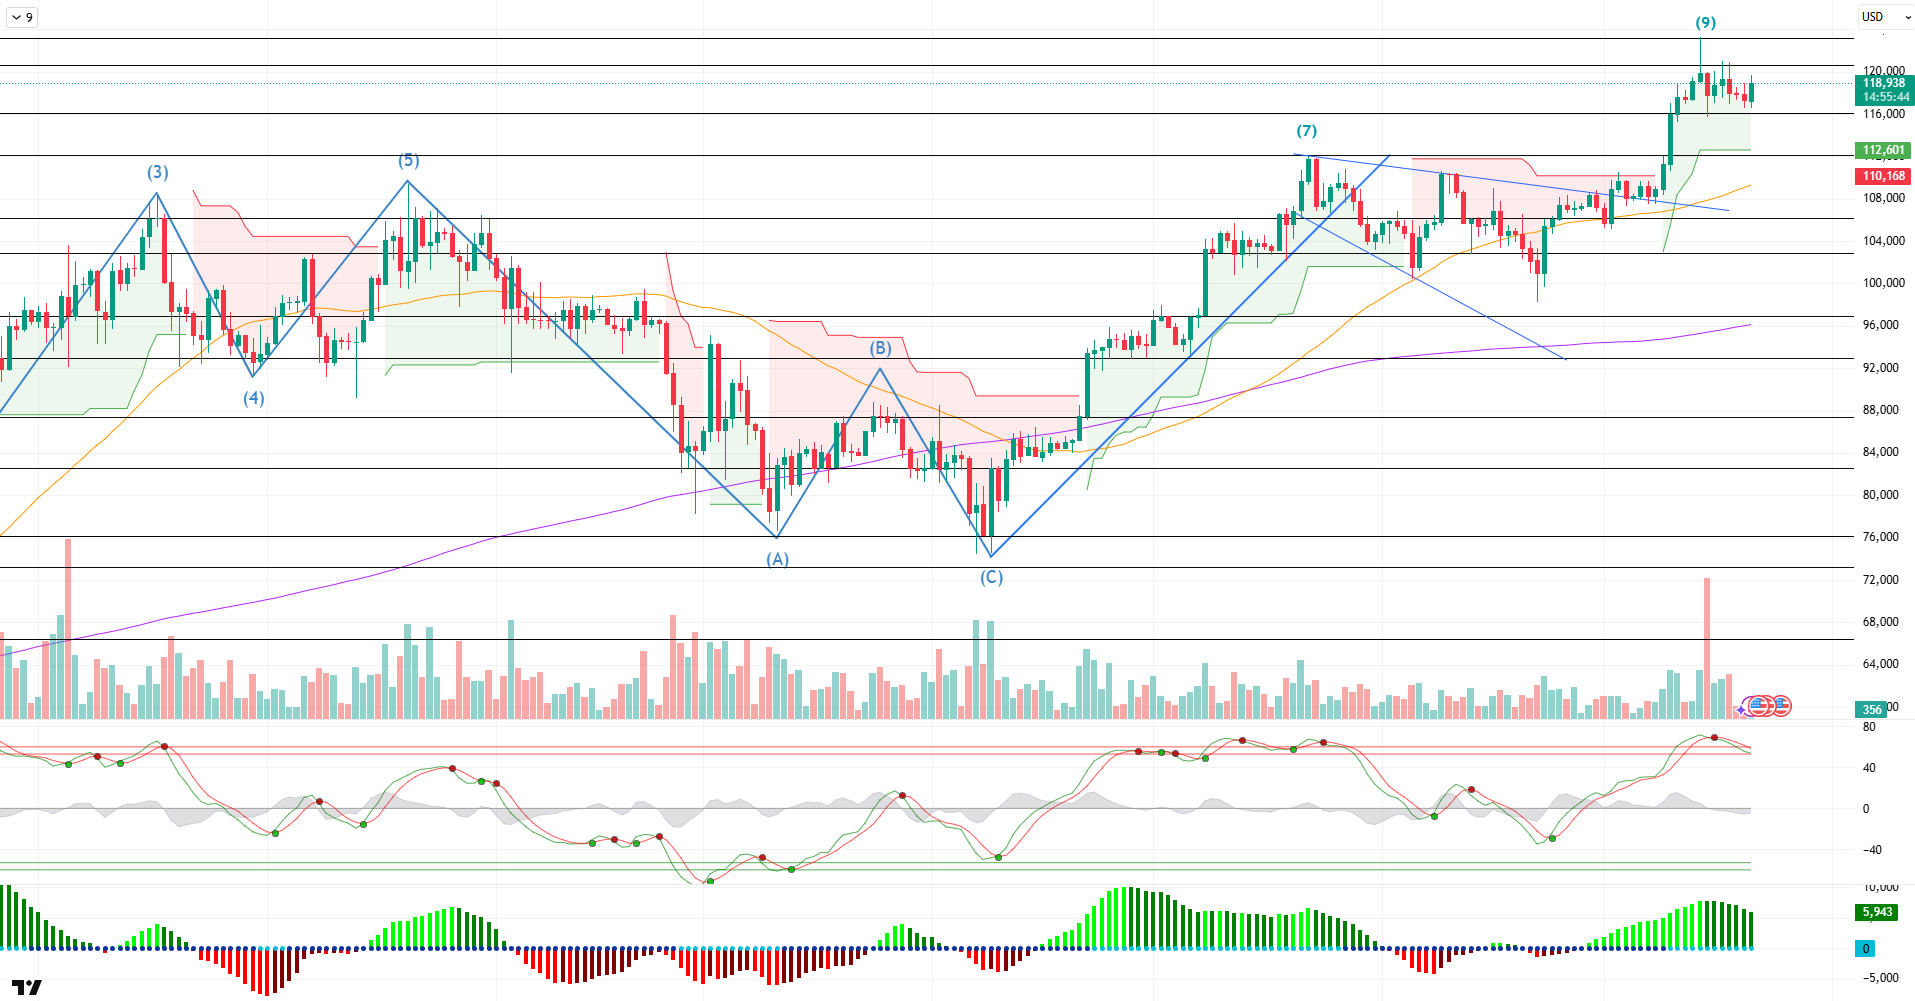
After all these developments, when we look at the daily technical outlook, it is seen that BTC entered the consolidation phase close to the ATH level after the peak at the 9th point reached with the golden cross structure. BTC, which carried the ATH level to 123,300, started the week at 119,000 levels.
Looking at the technical indicators, the WT oscillator came above the overbought zone on the daily. The histogram on the SM indicator shows that momentum support has reached the maximum level in the positive zone. On the other hand, moving averages show that the golden cross structure continues as the 50-day SMA cuts the 200-day SMA upwards.
When the weekly liquidity data is analyzed, it is seen that while the buying positions at 117,000 level were liquidated with the last decline, the selling phase continues above 120,000 level.
In summary, while fundamental developments continue to be a driving force on the price, the technical has reached its saturation point with the recent rise. Liquidity data, on the other hand, suggests that a correction of the uptrend may be healthier in terms of pricing. In this context, the 110,000 level and the 120,000 band appear as the new “Gap” zone for BTC, while pricing to fill these levels can be seen as important for the rise to be permanent. Therefore, while we think that the support zones will be liquidity areas for the moment, the 115,000 level can be followed as a critical reference point. On the other hand, we will follow the 123,300 ATH level in the continuation of the rise.
Supports: 117,400 – 115,000 – 112,000
Resistances 120,000 – 123,300 – 125,000
ETH/USDT
Developments in the cryptocurrency market last week set the stage for a remarkable price movement in Ethereum. Macroeconomic and regulatory news, especially from the US, has significantly increased institutional interest in the market. The passage of the Genius Act in the Senate and claims that Donald Trump is preparing a regulation that could pave the way for US pension funds to invest in crypto assets directly affected investor sentiment. With the impact of these developments, the ETH price recorded a rapid rise, reaching as high as $3,800. This rise brought a serious acceleration not only in the spot market but also in futures and institutional investment channels.
Inflows to spot Ethereum ETFs stood out as one of the main building blocks of this rise. 726.6 million on July 16, $602 million on July 17 and $402 million on July 18. This three-day period was recorded as the time period with the highest net inflows since the launch of Ethereum ETFs. After 248 trading days, the total cumulative net inflows have reached $7.49 billion. This data reveals that institutional investors’ interest in ETH has increased sustainably and is one of the most important factors providing liquidity to the market. Looking at Ethereum staking data for the same period, Total Value Staked (TVS) increased from 36.01 million ETH to 36.15 million ETH. This indicates that investors’ long-term conviction is increasing and more restrictions are being created on the supply side.
When the on-chain and futures market data are analyzed, it is clearly seen that the market is intensifying with bullish expectations. In particular, the fact that the open interest rate reached an all-time high of $26.60 billion shows that the number of open positions in the market has increased significantly and investors have increased their positions. This outlook also supports the increasing depth and liquidity in the ETH market. The funding rate, which is analyzed together with the open interest data, rose to 0.0177, indicating that the appetite for long positions is quite strong. This ratio confirms that investors maintain their bullish expectations and the buying pressure in the spot market is also reflected in the futures markets.
On the technical indicators, there is a broad-based support for the uptrend. The Chaikin Money Flow (CMF) indicator continued to remain in positive territory, reaching 0.30, indicating that the volume of money entering the market is strong and liquidity flows are in favor of ETH. This strong structure in CMF suggests that investor interest is not waning in the short term and that there is a solid demand base behind the uptrend.
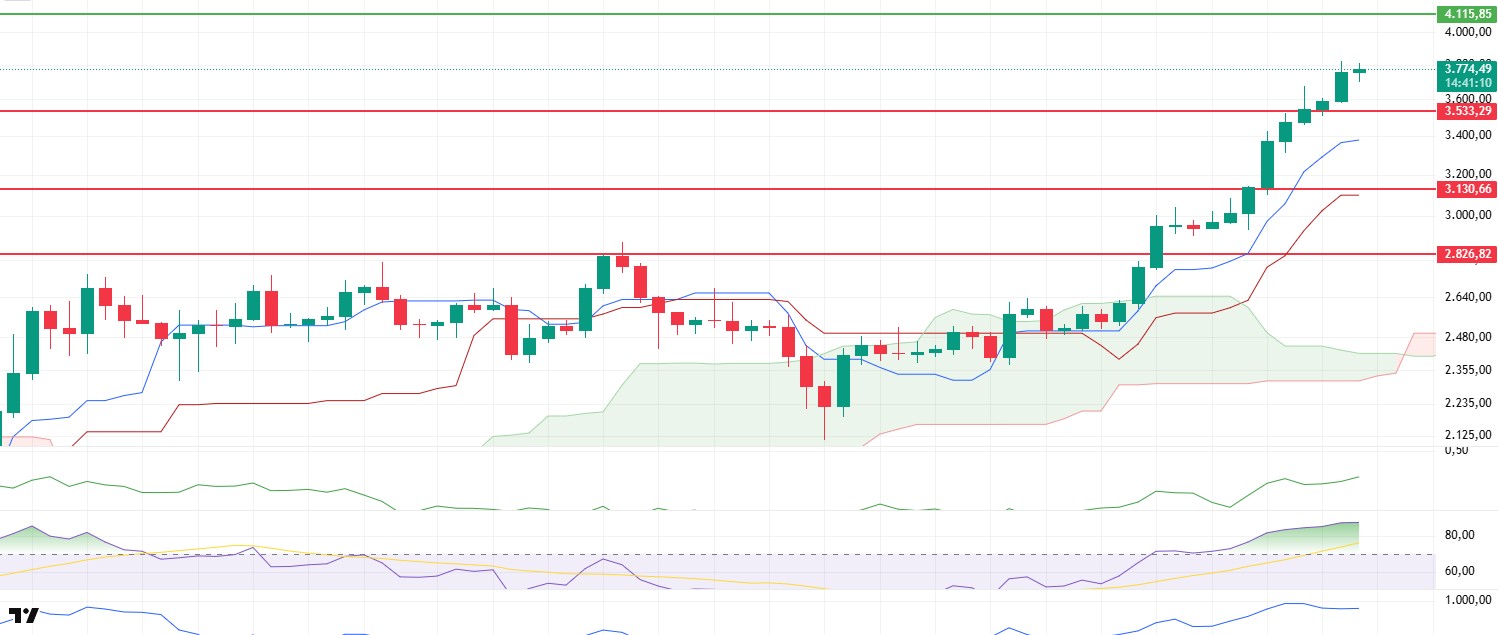
When the Ichimoku indicator is analyzed, it is seen that the price continues to be positioned above the cloud, Tenkan and Kijun sen levels are upward and the Kumo cloud is expanding. These structures show that the technical uptrend maintains the potential to continue in the medium term and does not signal a structural weakness.
Momentum indicators also continue to trend upwards. The RSI indicator remains in overbought territory, indicating that buying pressure remains intense. However, while this suggests a strong technical market structure, it is also a reminder that the risk of a short-term correction should not be ignored. While this structure in the RSI offers cautious optimism to investors, it also raises the possibility that the price could be subject to a correction at any time as long as it remains in the overbought zone.
As a result, the combination of supportive macro news flows, an increase in institutional demand, ETF inflows, staking data and a harmonious positive outlook in technical indicators clearly shows that ETH maintains its bullish potential in the medium and long term. In the short term, the possibility of the price settling above the $4,000 level has strengthened. However, the sharpness of the recent rise and the fact that the RSI remains in the overbought zone brings with it the possibility of a possible correction. In this possibility, the $3,533 region stands out as the most critical support level. Maintaining this level can be quite decisive in terms of the continuation of the rise with a healthy correction.
Supports 3,533 – 3,130 – 2,826
Resistances 4,115 – 4,369 – 4,890
XRP/USDT
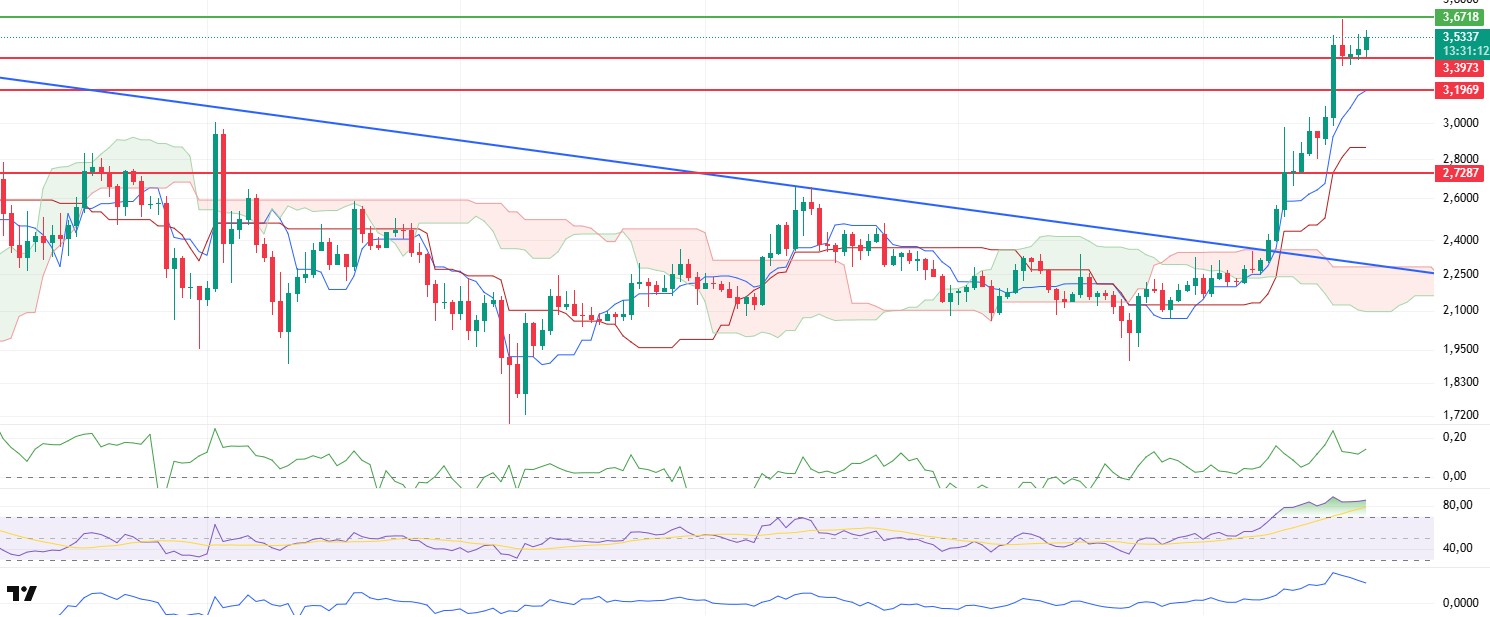
Last week, the reflection of the developments originating from the US on the cryptocurrency market was extremely effective, especially for XRP. The passage of the Genius Act bill in the Senate created a more positive perception of the crypto market on the political ground. The allegations that Donald Trump is favorable to a new regulation that could pave the way for US pension funds to invest in crypto assets, which came to the agenda after this legislation, further increased investor interest and became one of the most important catalysts that directly pushed the XRP price up. Following these developments, XRP rose as high as $3.66, hitting an all-time high of ATH. However, short-term profit sales in the period following this sharp rise caused the price to retreat to the $3.40 support level. The price, which stabilized in this region, signaled a strong recovery, rising above the $3.50 level again after the weekly close.
When market dynamics are analyzed in more depth, the structure in the futures markets is particularly striking. The fact that the open interest rate rose to $4.60 billion shows that open positions in the market have increased significantly and investors’ interest in XRP continues to increase. This indicates that investors continue their bullish expectations and that price movements may find support not only in the short term but also in the medium term. Similarly, the funding rate reached 0.0323, indicating a high appetite for long positions. However, the structure in the spot market is more balanced compared to the futures market. While the Cumulative Volume Delta (CVD) data shows that there is a limited but steady volume on the spot side, the Chaikin Money Flow (CMF) indicator remains balanced in the positive territory, suggesting that spot investors remain active in the market but an aggressive buying wave has yet to emerge.
On the technical indicators side, there are some notable signs of weakness. In particular, the decline in the momentum indicator since Thursday increases the likelihood of a slowdown in the uptrend. This outlook brings to the table the possibility that the price may enter a short-term correction. Moreover, the Relative Strength Index (RSI) is still in the overbought territory, indicating that the upside potential may be limited and the possibility of a correction is getting stronger. Although this structure in the RSI indicates that the general buying appetite in the market is strong, the fact that the price remains at an overvalued level creates a ground that may pave the way for short-term pullbacks.
The technical outlook on the Ichimoku cloud side still gives strong signals that the uptrend continues. The price’s positioning above both the tenkan and kijun levels and the upward movement of these levels continue simultaneously with the price. The upward expansion of the kumo cloud in parallel with the price movement shows that the uptrend is structurally supported and the technically positive outlook continues. This structure reveals that the general trend remains upward, although there is a possibility of correction.
Overall, there was a strong bullish surge in XRP last week in line with the news flow and parallel market data. However, some overbought signals and momentum weakening in technical indicators after this rise indicate that there may be a loss of momentum in price movements next week. In this context, short-term correction scenarios should be considered. While the first important support level stands out as $3.40 in possible pullbacks, the $3.19 region should be monitored as a strong second support area in pricing below this level. As long as these regions can be maintained, it is predicted that the uptrend can continue in a healthy way. Top of the Form Bottom of the Form
Supports 2.7287 – 2.5925 – 2.3576
Resistances 3.1969 – 3.3973- 3.7232

SOL/USDT
Last week in the Solana ecosystem
- Meme coin launch platform Pump.fun raised $500 million last week in an initial coin offering (ICO) that sold out in about 12 minutes.
- Kenya launched its national digital token KenyaNDT on the Solana blockchain.
- Solana achieved a remarkable feat in terms of network performance, with its TPS (Transaction Per Second) surpassing 1,400 and setting a new record.
- Liquid Collective offered Solana liquid staking token LsSOL to institutions in anticipation of spot SOL ETF approvals.
- DeFi Dev Corp. unveiled Solana’s DFDV Treasury Accelerator, which will transform the decentralized finance ecosystem.
- Shinhan bank launched crypto services on the SOL app ahead of a regulatory change in Korea.
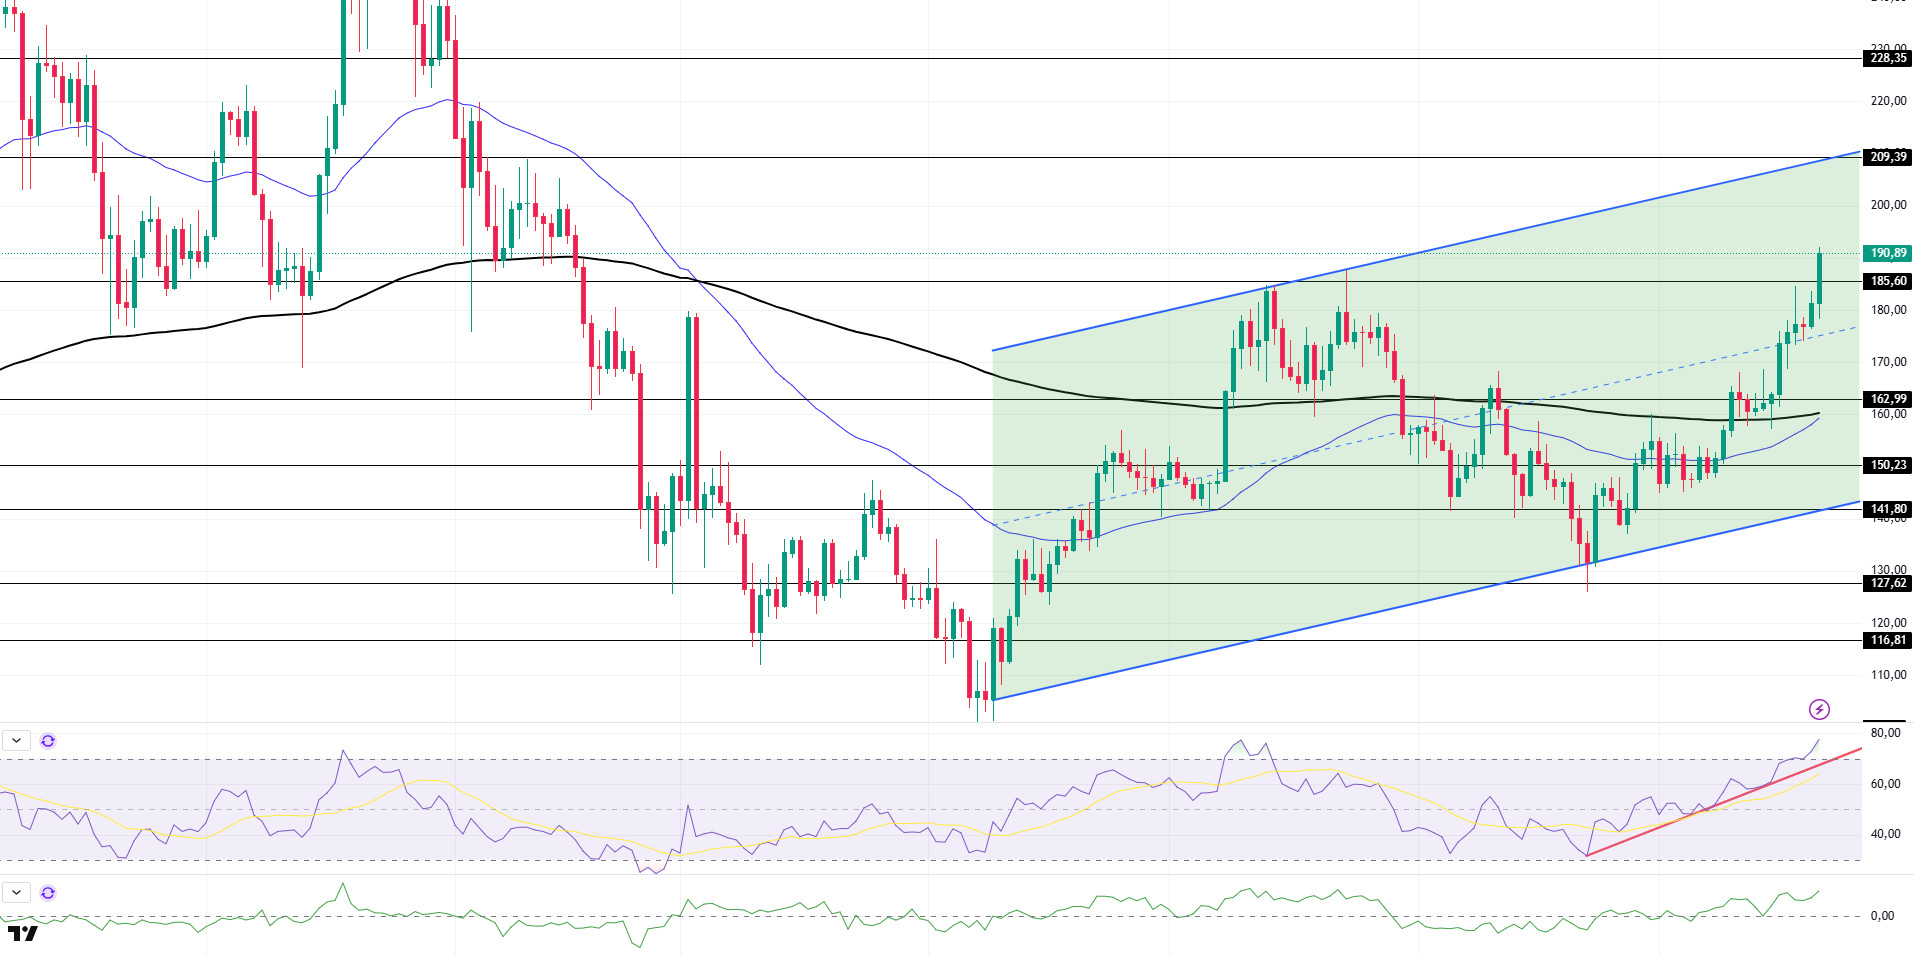
SOL price rallied nearly 19% this week. The asset accelerated from the base level of the uptrend that started on April 9 and continued its uptrend last week with support from the 200 EMA (Black Line) moving average. The price, which is currently testing the $ 185.60 level as resistance, which is a strong resistance place, may continue its rise on candle closes above this level and test the ceiling level of the rising trend at $ 209.39. Otherwise, the $ 162.99 level can be followed in retracements.
The asset is trading above the 50 EMA (Blue Line) and 200 EMA (Black Line) moving averages, indicating that the asset is in an uptrend. In addition, the fact that the 50 EMA continues to remain below the 200 EMA indicates that a “death cross” formation continues from a technical point of view . This suggests that bearish potential remains in the medium term. RSI (14) is in the positive territory and buying pressure continues. Additionally, the metric managed to stay above the uptrend that started on June 22. Chaikin Money Flow (CMF-20) remained in positive territory; an increase in money inflows may push the CMF-20 indicator to the upper levels of the positive zone. If macroeconomic data remains positive and ecosystem developments remain positive, the first major resistance point at $209.39 could be retested. Conversely, in case of possible negative news flow or deterioration in macro data, the $162.99 level can be monitored as a potential buying opportunity.
Supports 162.99 – 150.23 – 141.80
Resistances: 185.60 – 209.39 – 228.35
DOGE/USDT
Bit Origin announces $500 million Dogecoin treasury initiative.
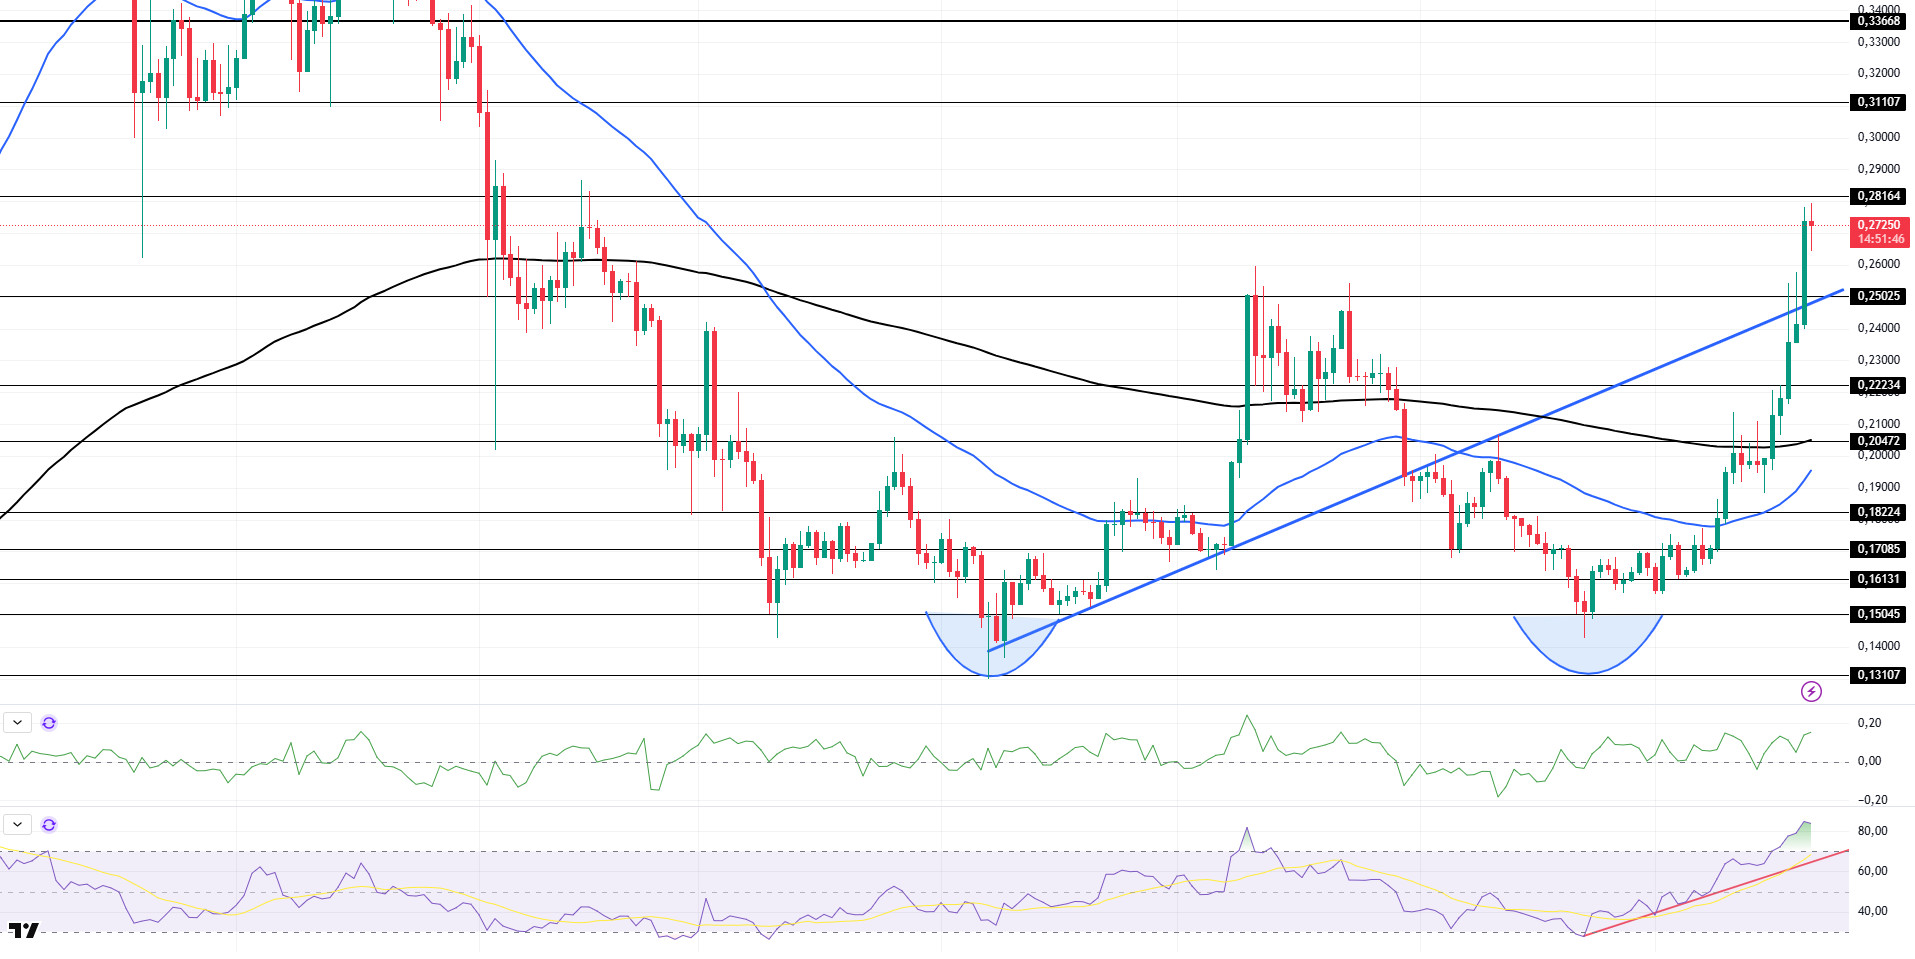
On the daily chart, DOGE has risen by about 37% since last week. Starting on April 8, the asset accelerated due to market dynamics as well as the double bottom formation at the bottom of the uptrend, which started on April 8, and continued its momentum by breaking the 200 EMA (Black Line) moving average. As of now, the price, which has managed to hold above the uptrend, may test the $0.31107 level if the momentum continues. In case of a pullback, the rising trend level may work as support.
The asset is trading above the 50 EMA and 200 EMA moving averages. This signals us that the asset is in an uptrend. On the other hand, the 50 EMA continued to be below the 200 EMA, suggesting that the death cross pattern remains valid. This suggests that bearish pressure may continue in the medium term. The Chaikin Money Flow (CMF-20) indicator remained in positive territory. Money inflows continue to decline. This may move the CMF-20 into negative territory. When we look at the Relative Strength Index (RSI-14) indicator, it is at the overbought level. This may bring profit sales. In addition, it continued to be above the uptrend that has been going on since June 22. This may mean that the uptrend may continue. In case of macroeconomic risks or negative news from the ecosystem, the $0.22234 level can be monitored as a strong support. On the other hand, the $0.31107 level stands out as the first strong resistance level if the upward movement gains strength.
Supports: 0.25025 – 0.22234 – 0.20472
Resistances: 0.28164 – 0.31107 – 0.33668
TRX/USDT
SRM Entertainment announced on Wednesday that as part of its corporate restructuring process, it has changed its company name to ‘Tron Inc.’ and will update its trading symbol on Nasdaq to ‘TRON’. This step officially confirms the company’s strategic transformation to manage significant institutional assets of the Tron blockchain.
During the week of July 14 – 20, 2025, a total of 45.5 million TRX were burned on the TRON network. Thus, the circulating supply decreased by 18.1 million. The decrease in circulating supply continues to put deflationary pressure on TRX. In addition, the total number of addresses increased by 1.35 million to 320.8 million in the same week.
Over the past week, the TRON network generated a total of $91.5 million in revenue, increasing its revenue by nearly $6 million compared to the previous week and continuing to be the highest revenue generating ecosystem among all blockchain networks. This revenue growth is directly related to the high volume of transactions on the network, the rise in total locked assets (TVL), the stable number of daily active addresses and the intense user interaction on DeFi protocols.
TRX, which started last week at 0.3028, rose by approximately 3.5% during the week and closed the week at 0.3141. Thus, it closed the fourth consecutive week with an increase. TRX, which is currently trading at 0.3145, is in the upper Bollinger band on the daily chart. The Relative Strength Index (RSI) value is very close to the overbought zone at 67. TRX price can be expected to fall from these levels and move towards the Bollinger middle band. In such a case, it may test the 0.2975 support. If it closes daily below the 0.2975 support, it may want to test the 0.2880 support. If it cannot close daily below 0.3130 support and the positive atmosphere in the market continues, it can be expected to continue its rise with the purchases that may occur in this region. In such a case, it may test 0.3230 resistance. On the daily chart, 0.2880 is an important support and as long as it remains above it, bullish appetite can be expected to continue. If this support is broken, selling pressure may increase.
Supports 0.3130 – 0.2975 – 0.2880
Resistances 0.3230 – 0.3355 – 0.3455
AVAX/USDT
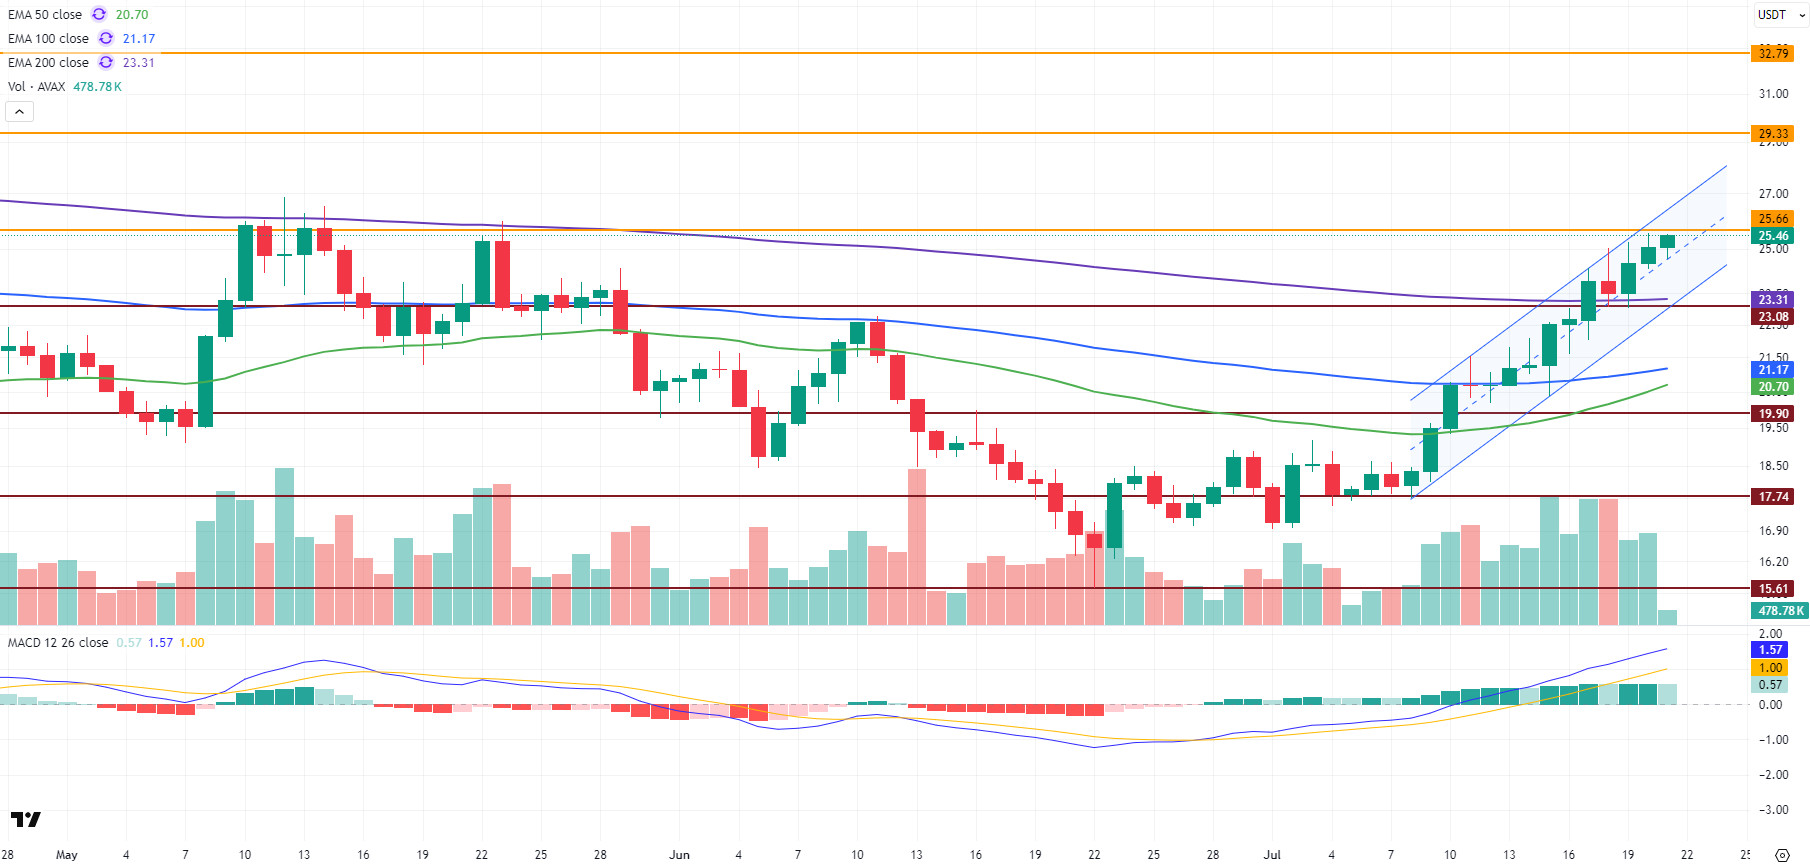
Last week, Avalanche (AVAX) showed significant growth in terms of ecosystem volume and activity. On July 15th, the Avalanche network saw over 20 million transactions in a single day. This figure demonstrated the platform’s scalability capacity and its increasing usage and adoption, especially in the gaming and DeFi spaces. In addition, there have also been notable developments on the institutional side. ETF rumors and a strategic partnership with Crypto Finance accelerated Avalanche’s integration into the global financial system. In the positive atmosphere created by these developments, AVAX price also gained a strong upward momentum. AVAX, which started last week at $ 21.21, closed the week at $ 25.04 with a value increase of 18.1%. On-chain growth and positive news flow may continue the upward trend in AVAX.
From a technical perspective, the Moving Average Convergence/Divergence (MACD) indicator on the daily chart crossed into positive territory with last week’s price action. The fact that the MACD line continues to stay above the signal line indicates that strong momentum continues. If this momentum continues, the continuation of the rise in AVAX is technically supported. Also, AVAX has managed to break the 200-day Exponential Moving Average (EMA200) on the upside and is currently trading above important Exponential Moving Average (EMA) levels . On the technical outlook, the price action is moving within the bullish channel and this pattern supports the bullish scenario.
In the coming period, closes above the $ 25.66 resistance are important for AVAX to continue its uptrend. In case of persistence above this level, the upward movement can be expected to gain momentum. In this possible scenario, resistance levels of $ 29.33 and $ 32.79 may come to the agenda in the continuation of AVAX’s rise. On the contrary, if the $ 25.66 level cannot be broken upwards and selling pressure occurs, the EMA200 and $ 23.08 support levels can be tested first. In case of persistence below these levels, support levels of $19.90 and then $17.74 may come back on the agenda, respectively.
(EMA50: Green Line, EMA100: Blue Line, EMA200: Purple Line)
Supports 23.08 – 19.90 – 17.74
Resistances 25.66 – 29.33 – 32.79
SHIB/USDT
This week, the Shiba Inu (SHIB) ecosystem had an important period of supply constriction mechanisms working effectively, accelerated whale accumulation and technological deepening of the project vision. Under the automated cremation system run through the Shibarium network, 70% of transaction fees continued to be converted into SHIB and taken directly out of circulation. During the week, the burn rate rose as high as 3.615%, with over 1 billion SHIB tokens burned in a single day, one of the highest daily burns of the year. This increase had both a direct contractionary effect on supply and a noticeable increase in community interest. On-chain data from the same timeframe revealed that high-volume traders increased their positions. A total of 728 billion SHIBs were transferred to large wallets in just three days, reflecting a strategic accumulation process. SHIB reserves on centralized exchanges fell to 83.8 trillion units, the lowest level of the year, indicating that investors tend to hold their assets for the long term.
Moreover, the number of loss-making addresses decreased by 16%, while the number of profitable addresses increased by 38%. One of the most notable developments of the week was the release of a 36-page strategy document called “The Shib Paper” by the Shiba Inu development team. This document revealed that Shiba Inu aims to develop participant-driven applications in the fields of art, storytelling and digital production by integrating decentralized artificial intelligence technologies. The document also emphasized that the “Shib AI” ecosystem, built with community input, will provide a decentralized, transparent and open-source AI infrastructure for both creators and developers. In line with this vision, Shiba Inu has clearly stated that it aims to transform into a long-term sustainable Web3 platform, not only financially but also technologically.
The sharp increase in burn rates immediately following the announcement reflected the community’s positive response to this vision. In addition, Layer-2 rollup integrations are planned to provide customizable chain solutions for developers on the Shibarium infrastructure. All these developments reveal that Shiba Inu is repositioning itself as not only a token project, but also a multi-layered technological structure and a sustainable ecosystem.
On the technical side, it is seen that the indicators supporting the bullish trend in Shiba Inu price action are gaining more strength. The increase in momentum, trading volume and volatility indicates that the buy side is taking a more active role in the market, creating a favorable ground for the price to maintain its upward momentum. The fact that the price broke the resistance levels of $0.00001380 and $0.00001480 and reached $0.00001520 is among the important technical developments confirming the short-term positive outlook.
With this rise, the price moved above the 200-day exponential moving average (EMA 200 – blue line), indicating a strengthening in terms of the medium-term technical outlook. The Chaikin Money Flow (CMF) oscillator remains in positive territory, confirming that capital flows are predominantly in the direction of buying and the upward demand in the market continues. As long as this technical structure can be maintained, it seems possible that the price may gradually move towards the next resistance levels of 0.00001550, 0.00001625 and 0.00001745 dollars.
On the other hand, if there is a weakening in momentum and a decrease in trading volume, the price may have difficulty holding at current levels and the possibility of a retreat towards the 0.00001380-dollar level may come to the fore in the first place. Below this region, 0.00001255 and 0.00001195 dollar levels will be followed as support, respectively. In general terms, with the support of rising momentum and volume, technical indicators suggest that the positive trend is maintained, but the sustainability of this trend will depend on whether buyer interest will continue in the coming days.
Supports 0.00001380 – 0.00001255 – 0.00001195
Resistances 0.00001550 – 0.00001625 – 0.00001745
LTC/USDT
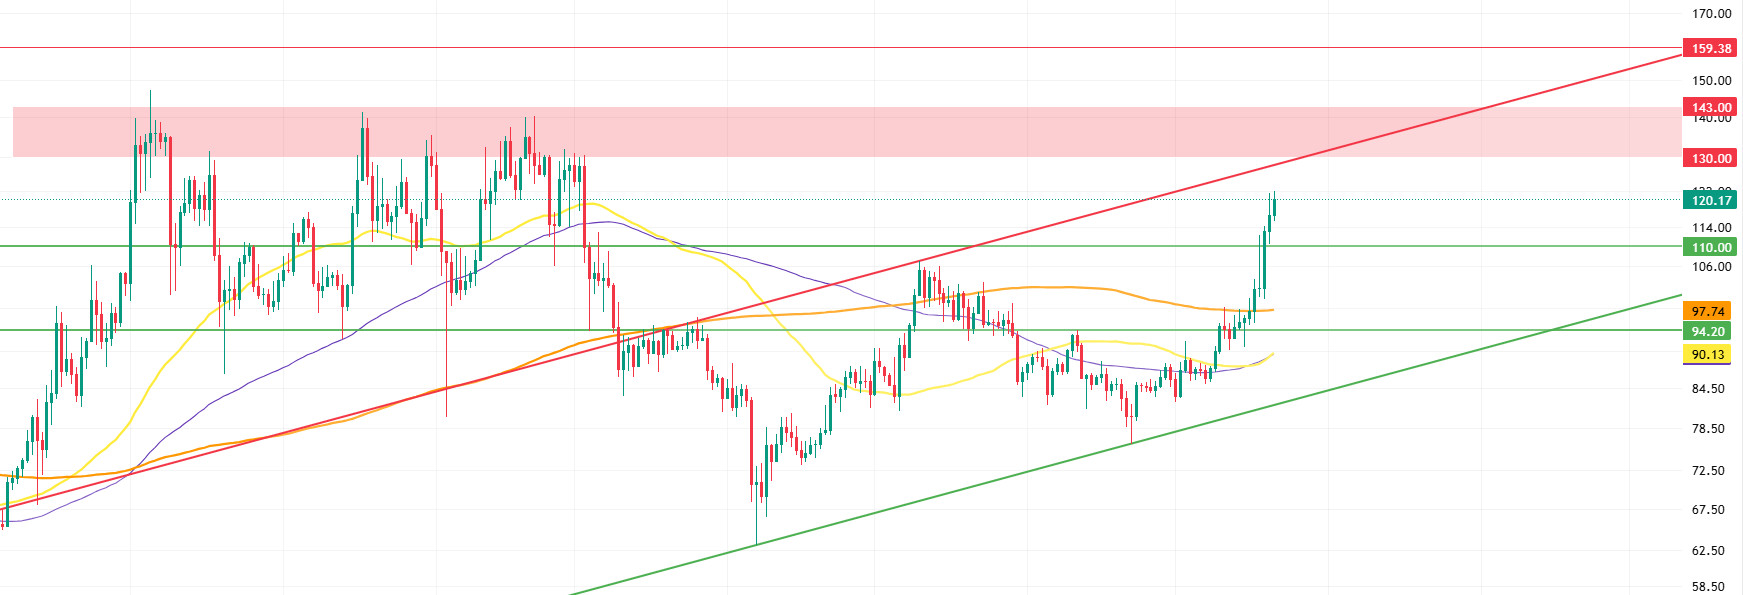
Litecoin (LTC) has started the new week at 116.59, up 23.22% over the past week. LTC’s market capitalization, which also appreciated 25% against Bitcoin in this process, is approximately $9.14 billion and jumped 2 places to 19th place in the market rankings. On the futures side, open positions have increased by about 67% compared to last week and funding rates remain positive. Positive funding and positions support the upward movement of the market.
As of this week, Litecoin (LTC) is pricing above all major short, medium and long term moving averages. The fact that the price no longer has any moving averages forming dynamic resistance above it suggests that the upside momentum is gaining strength and selling pressure is weakening. The prominent zone is the 130.00 – 143.00 range. This band is notable both for being an important resistance zone that has been tested for about 8 weeks in the past and for its intersection with the rising channel lower ban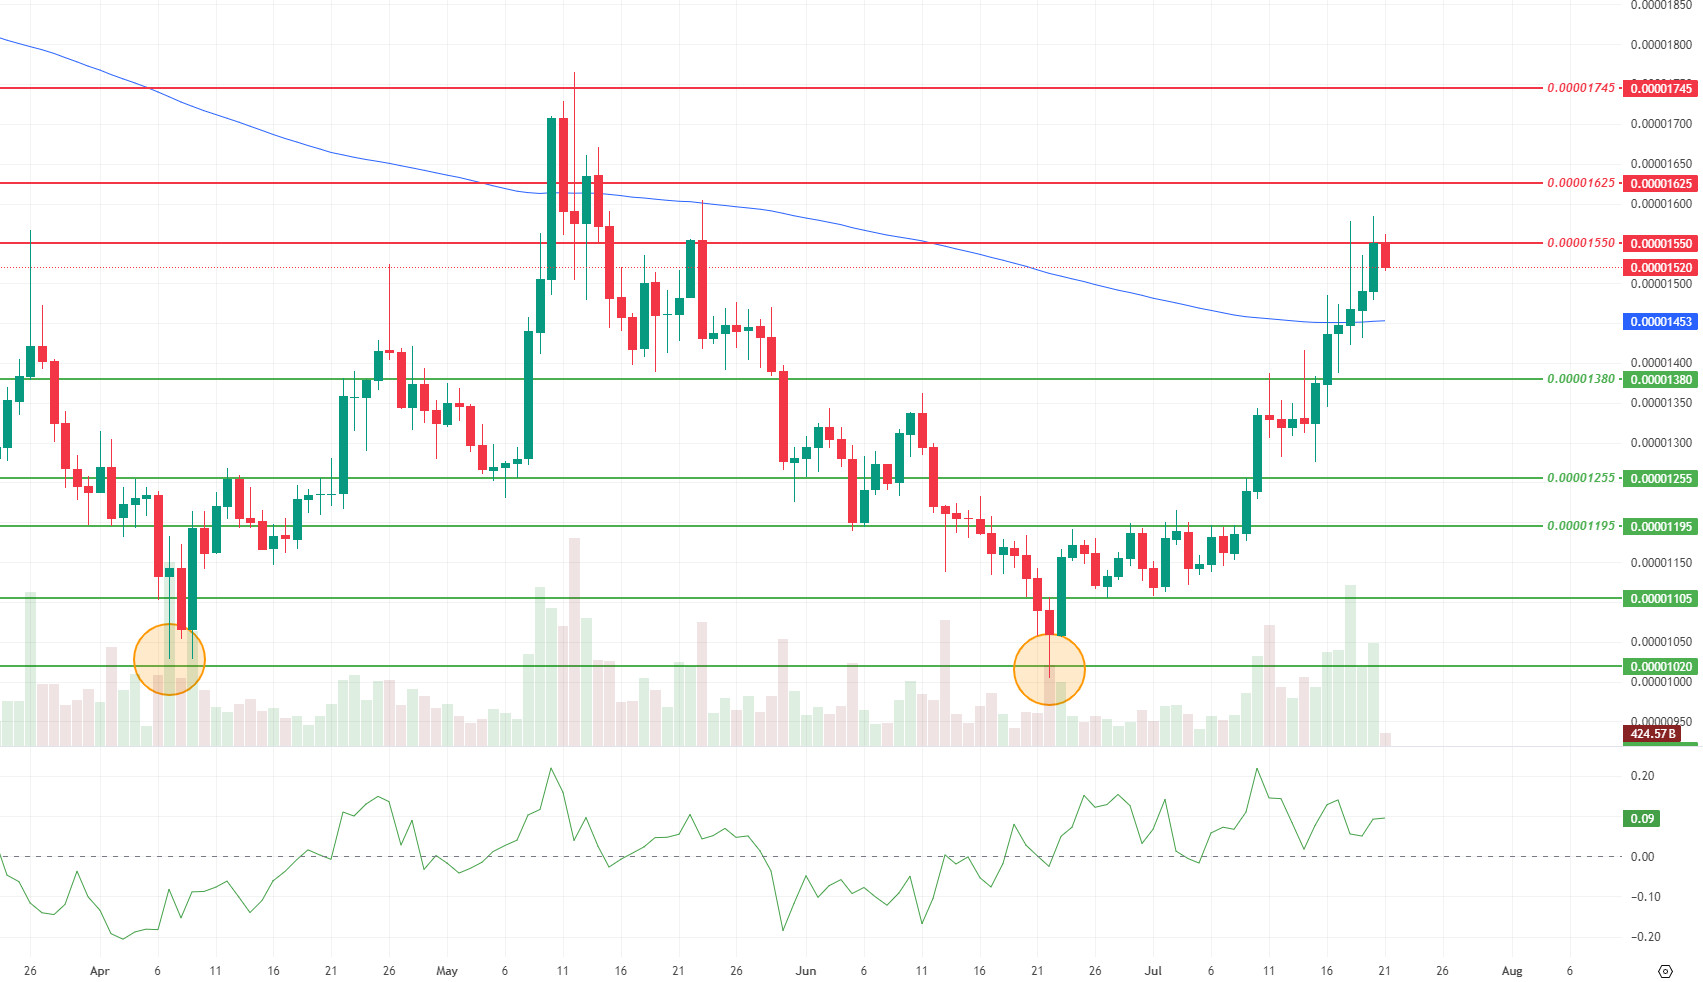 d at 130.00. Short-term selling reactions may be seen on the approach to this area, but in case of a breakout, the technical outlook will clearly turn bullish. If this resistance zone is breached on the upside, there is no obvious barrier to the price except the horizontal resistance at 159.38. With confirmation from RSI, volume and trend indicators, price action can be expected to gain momentum after the breakout.
In possible pullbacks, resistances that were broken upwards last week can be expected to work as support as of this week. In this context, the horizontal support at 110.00 stands out as the first strong support. Below this level, 94.20 may be followed as intermediate support. In deeper correction scenarios, the 50 and 100-day moving averages, which are very close to each other at 90.13, can be considered as the strongest support zone. This area constitutes a strong line of defense both technically and psychologically. On the other hand, the fact that Litecoin has been rising for 8 days in a row increases the possibility of profit realizations and pause at the first resistance levels in the short term.
Resistances 130.00 – 143.00 – 159.38
Supports 110.00 – 94.20 – 90.13
LINK/USDT
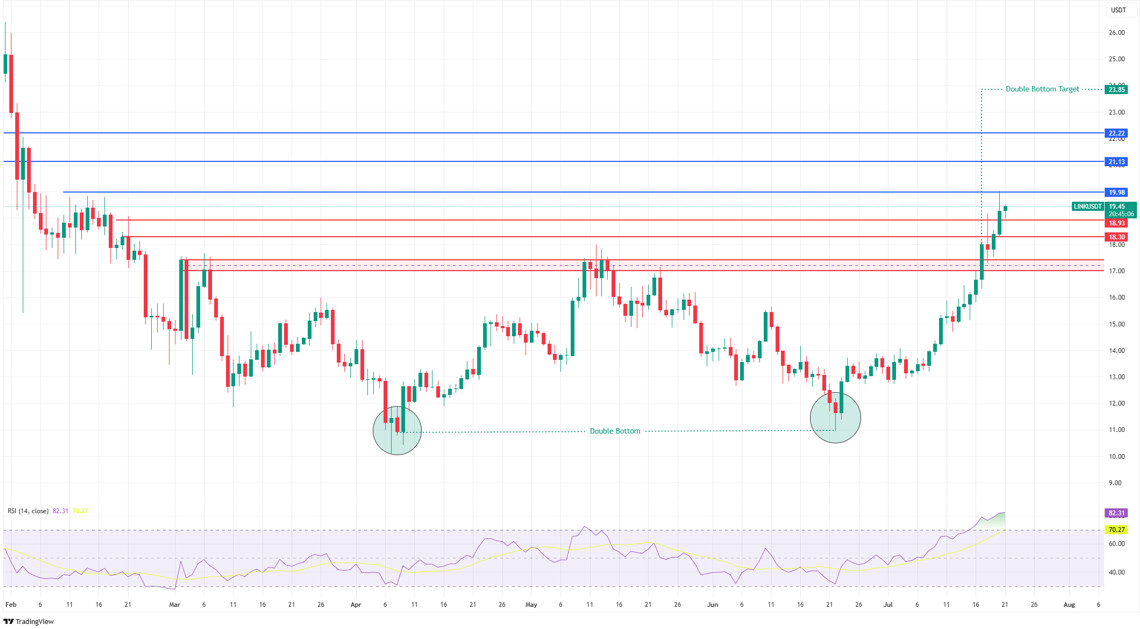
Last week, LINK tested the $20 region by rising above the $17 level, which is the target point of the falling wedge pattern that we follow technically. In the current technical outlook, we see that the price tested the $10 level twice in April and June, making it a strong bottoming area, and has risen more than 80% since the last bottom. With this rise, the breakout above the $17 level means that the double bottom pattern clearly seen on the chart is also confirmed. According to this pattern, the technical target is in the range of approximately $ 23.85 – $ 24.00.
However, in order to reach this level, it is important for the price to persist above $ 20, our first resistance point. Otherwise, the possibility of a pullback to the support area, which is the neckline of the pattern, up to the $ 17 level, may come to the agenda. In order for this scenario to materialize, it will be important to monitor whether the price can maintain the support zones of 18.93 and 18.30, respectively. In particular, a daily close below the $17 level would be a critical signal that could increase selling pressure. Our resistance points that we should follow in upward movements seem to be $ 21.13 and $ 22.22 levels.
On the momentum side, the Relative Strength Index (RSI) is currently at 82 and moving in overbought territory. While this suggests that the current uptrend has strong momentum, it also brings the possibility of profit selling in the short term.
Supports 18.93 – 18.30 – 17.40
Resistances 20.20 – 21.13 – 22.22
BNB/USDT
This week in the BNB ecosystem, ERA and C projects were listed on the Binance Launchpool. These listings are expected to have an overall positive impact on the BNB price as they increase the demand for BNB used in transaction fees and reduce the supply in circulation through users staking BNB.
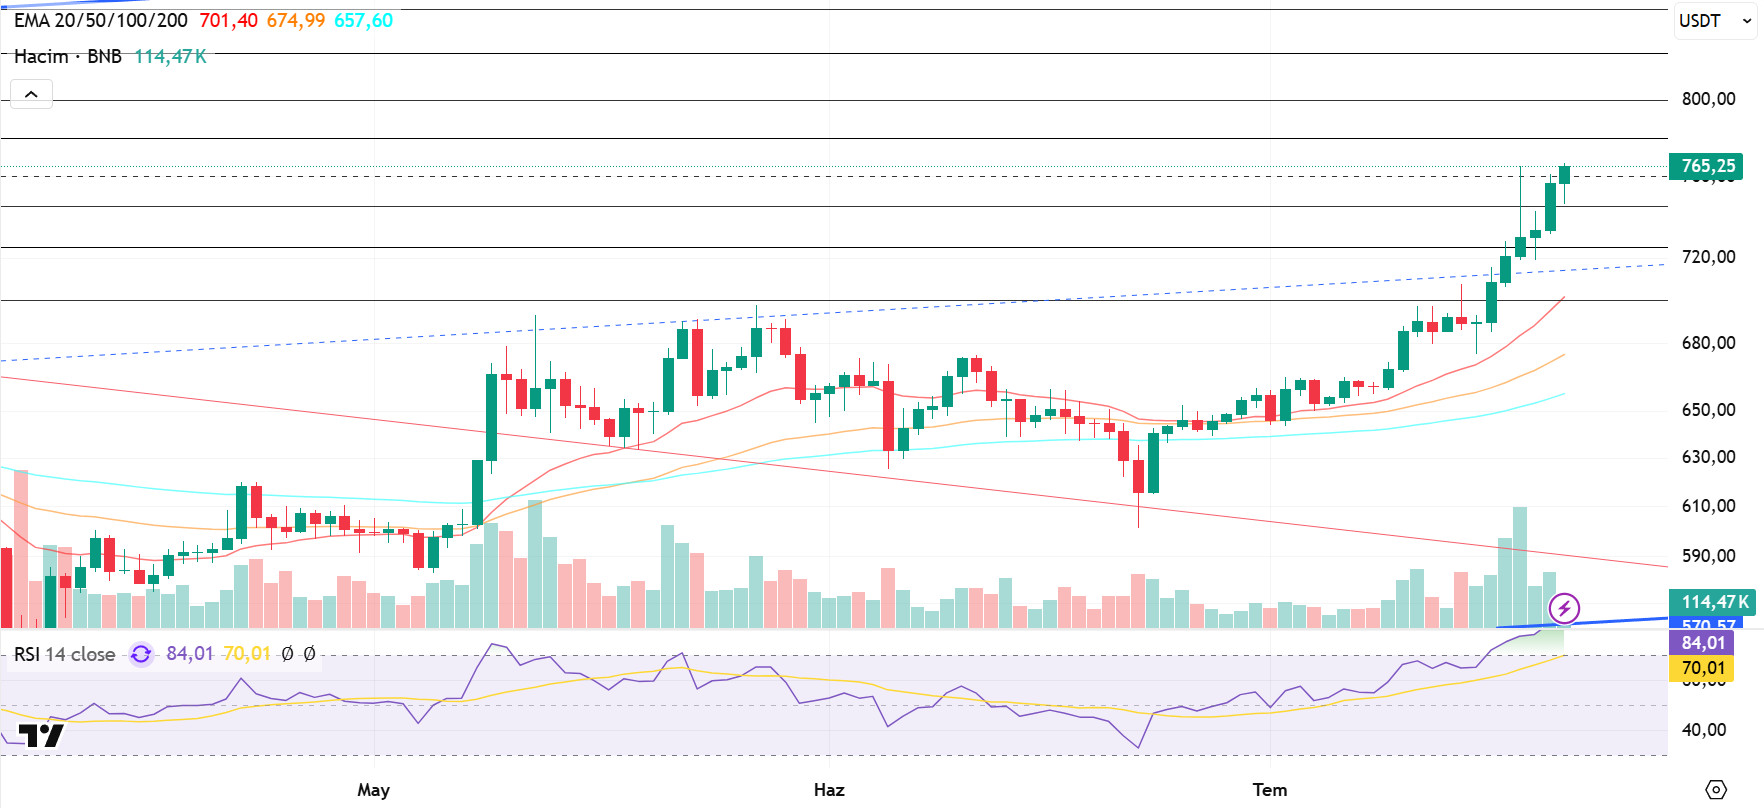
From a technical point of view, the ongoing bullish process in the BNB/USDT pair, along with the general positive effect of the market, contributed to the acceleration of the price to the $ 760 level. With this resistance exceeded as the new week began, BNB made a positive start to the week and exhibited an upward outlook by pricing above the $ 760 level.
In the BNB/USDT pair, which is currently trading in the range of $ 745-780, technical indicators show that a strong and positive trend in trading volume has come to the fore in the last one-week period. This indicates that the buying appetite has increased throughout the market. However, the decrease in trading volume in recent days may be a harbinger of a possible correction. On the other hand, the Relative Strength Index (RSI) has been on an upward trend due to the recovery in recent days and has risen above both its average value and the 70 level. Although this technical structure suggests that positive trends are at the forefront in the short term, it also indicates that selling pressures may be seen at certain levels.
Within the framework of the current technical outlook, if the positive momentum continues, the BNB price is expected to test the $ 780 resistance level in the first place. If this level is exceeded upwards, the $800 and $825 levels stand out as the next strong resistance zones, respectively. On the other hand, if the $ 780 level cannot be exceeded and selling pressure increases, the price is likely to head towards the $ 745 support level again. If this support is broken downwards, the $725 and $700 levels should be followed as the next critical support points.
Supports 745 – 725 – 700
Resistances 780 – 800 – 825
SUI/USDT
The Sui network started the week on a strong note, supported by updates and stabilizing factors in supply dynamics. Both increased intra-network activity and the ecosystem’s expanding infrastructure have made Sui’s medium-term potential even more visible. Nasdaq reached an important institutional milestone for Sui by filing a 21b-19 application to list a spot SUI ETF in partnership with 4Shares. This development continues to put Sui among the elite alternative digital currencies being considered for such financial products. While the SEC is yet to approve the application, this adds to the project’s positive market sentiment, especially its visibility. The Sui network has integrated WebAuthn-based passkeys and zk Login to facilitate user authentication. These improvements lower barriers to entry by enabling users to access blockchain applications using familiar web login methods. The upgrades support Sui’s overall goal of making blockchain technology more accessible to mainstream users while maintaining robust security standards. On a daily basis, a rise of around 7% was also observed.
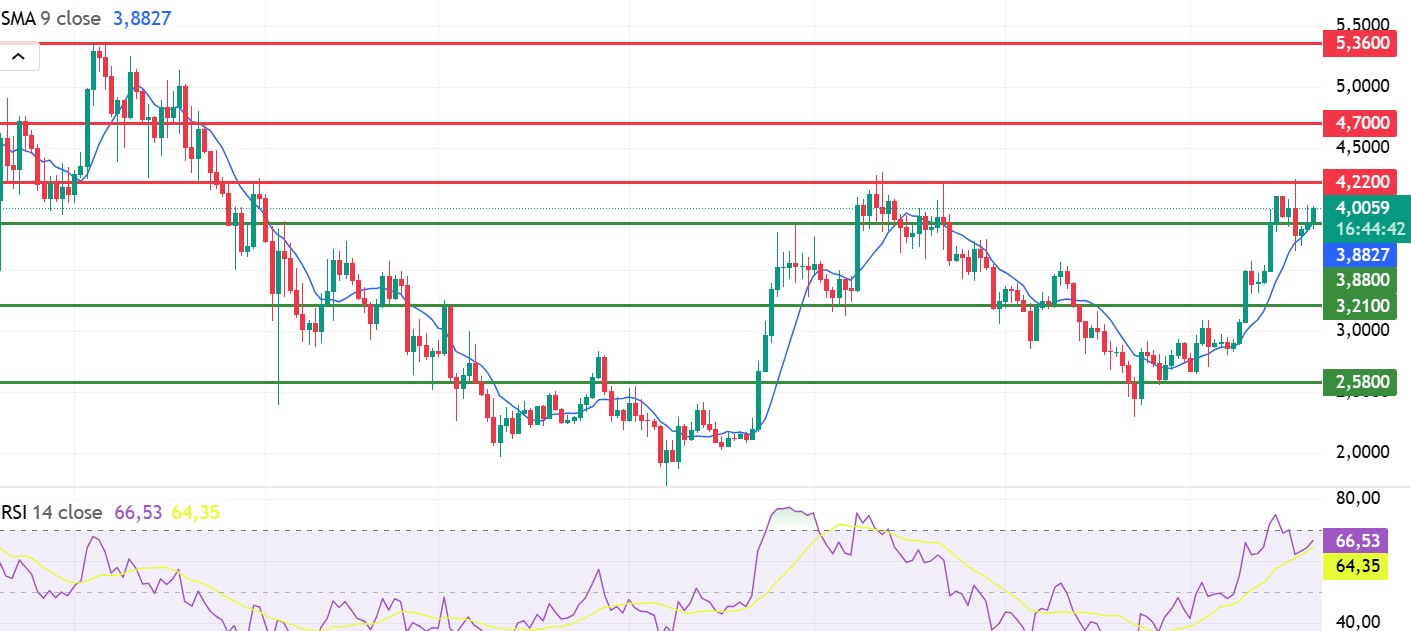
When we look at Sui’s technical outlook following the recent developments, it is seen that the price has risen sharply on a weekly basis to around $4.00, driven by fundamental developments. The Relative Strength Index (RSI) is currently in the range of 66.53 – 64.35. While this value range indicates that the market is close to the selling zone, a weakening of the RSI to a range of 35.00 – 50.00 may indicate a potential buying point. If the price moves upwards, the levels of 4.22 – 4.70 – 5.36 dollars can be followed as resistance points, respectively. However, if the price falls to new lows, it may indicate that selling pressure may deepen. In this case, the $3.88 and $3.21 levels stand out as strong support zones. Especially based on the trend line, the possibility of a pullback to $ 2.58 seems technically possible. According to Simple Moving Averages (SMA) data, Sui’s average price is currently at $3.88. If the price stays above this level, the current uptrend could technically continue. The upward trend of the SMA also supports this.
Supports 2.58 – 3.21 – 3.88
Resistances 4.22 – 4.70 – 5.36
ADA/USDT
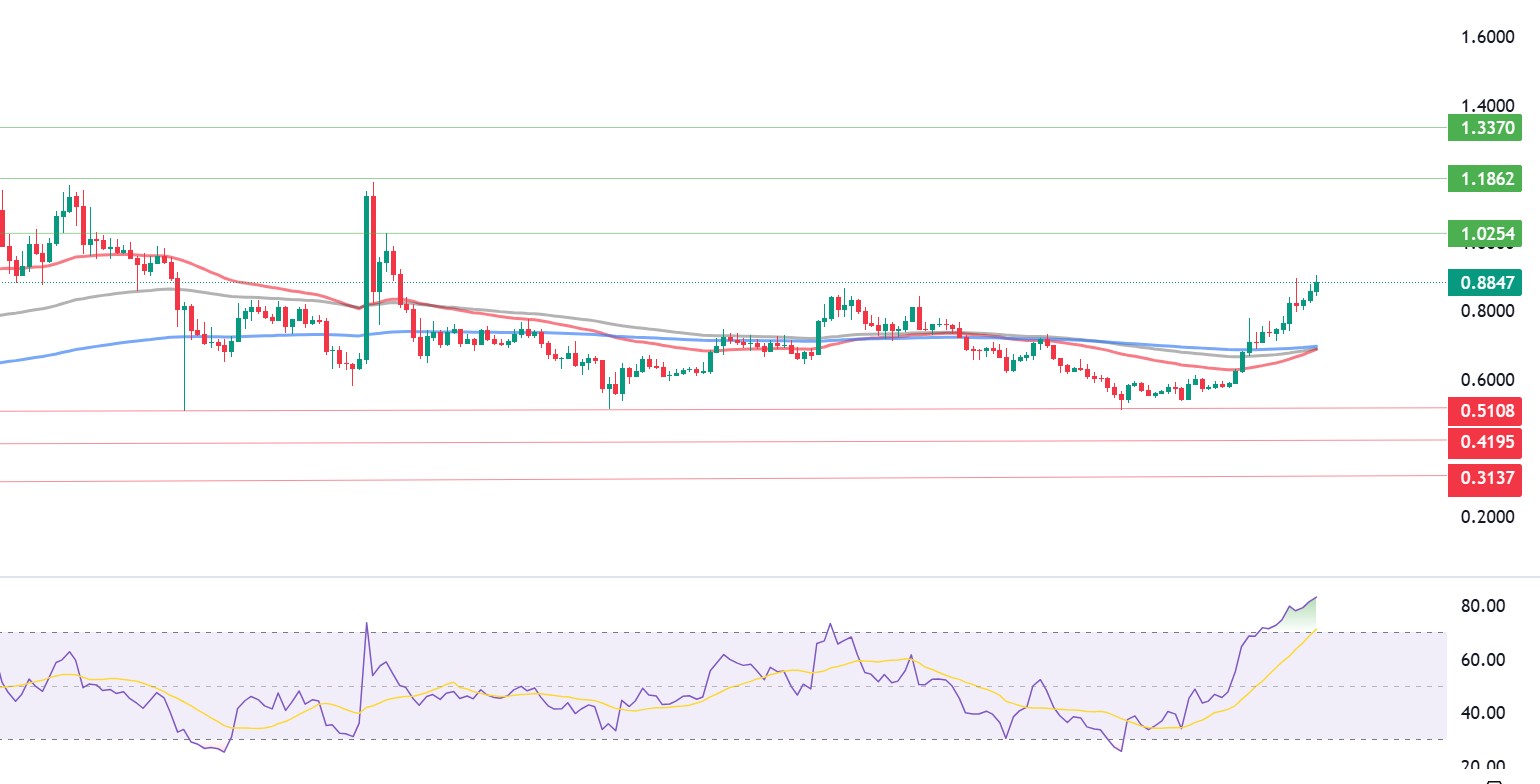
Over the past week, the Cardano (ADA) ecosystem has seen significant growth in terms of network activity and development. On July 16, the daily trading volume on the Cardano network exceeded 15 million transactions, once again proving the platform’s scalability potential. This increase is attributed to increased utilization, particularly in DeFi and NFT projects. Progress in the testnet phase of the Midnight privacy-focused sidechain was notable. Furthermore, the expansion of Cardano’s strategic partnerships with NASA and UNDP has increased the network’s impact in real-world applications and attracted institutional interest. These positive developments started a strong uptrend in the ADA price. Starting the week at $0.7555, ADA closed at $0.8847, a 15.2% increase in value. On-chain growth and positive news flow support the potential for the uptrend to continue.
Technically, the bowl pattern and the rising bottom on the chart continue to move with a clear bullish momentum. The fact that the price has risen above the 50, 100 and 200-day exponential moving averages suggests that it will continue a technically strong uptrend. The RSI indicator rising above the 70 level and the acceleration of the bullish momentum is an indication that it is in the overbought zone. The resistance of $ 0.8717, which I mentioned in the ADA analysis last week, is also behind and the $ 1.0254 level should be followed as the next critical level. If there are closures above this level, it may open the door to a movement towards 1.1862 and 1.3370 levels. In a possible pullback, 0.7000 dollars, followed by 0.6500 and 0.6170 levels should be followed as support.
Supports 0.7000 – 0.6500 – 0.6170
Resistances 1.0254 – 1.1862 – 1.3370
Legal Notice
The investment information, comments and recommendations contained in this document do not constitute investment advisory services. Investment advisory services are provided by authorized institutions on a personal basis, taking into account the risk and return preferences of individuals. The comments and recommendations contained in this document are of a general type. These recommendations may not be suitable for your financial situation and risk and return preferences. Therefore, making an investment decision based solely on the information contained in this document may not result in results that are in line with your expectations.