
What Awaits Us?
U.S Macroeconomic Data
Non-Farm Payrolls Data (NFP) – 01 August
This data, which shows the employment strength in the US economy, will play a key role in the FED’s assessment of the direction of the interest rate path.
Consumer Price Index (CPI) – August 12
Consumer inflation data for June will shape the inflation expectations of the markets.
Gross Domestic Product (GDP) – August 28
Growth data for the US economy will be released.
Personal Consumption Expenditures (PCE) – August 29
PCE data, which stands out as the FED’s inflation indicator, will be announced.
Other Developments
Customs Tariffs – 01 August
US President Donald Trump noted that the tariff rates outlined in the tariff letters will be implemented starting August 1 and will not be extended.
Blockchain.RIO 2025 05 – 07 August
Blockchain.RIO 2025, Latin America’s most important blockchain and digital finance event, will open its doors in Rio de Janeiro, Brazil on August 5-7, 2025.
Rare Evo Las Vegas 2025 – 06 – 10 August
Rare Evo 2025 will take place from August 6-10, 2025 at Caesars Palace in Las Vegas, Nevada.
Jackson Hole Economic Symposium- August 21-23
A symposium on economic policy held annually in August in Wyoming, USA and attended by global central bank
Crypto Insigth
| Market Overview | Current Value | Change (30d) |
|---|---|---|
| Bitcoin Price | 118,480 $ | + 10.18% 📈 |
| Ethereum Price | 3,825 $ | + 56.93% 📈 |
| Bitcoin Dominance | 61.36% | – 6.35% 📉 |
| Ethereum Dominance | 12.04% | + 33.28% 📈 |
| Tether Dominance | 4.27% | – 11.82% 📉 |
| Total Market Cap | $ 3.83 T | + 17.72% 📈 |
| Fear and Greed Index | Greed (77) | Greed (68) |
| Altcoin Season Index | 38/100 | 20/100 |
| Crypto ETFs Net Flow | $ 222.30 M | – |
| Open Interest – Perpetuals | $ 809.04 B | – |
| Open Interest – Futures | $ 3.57 B | – |
*Prepared on 29.07.2025 at 13:00 pm. (UTC)
Metrics – Summary of the July
Flow by Asset
| Asset | Week 1 | Week 2 | Week 3 | Week 4 | Net Total $ (m) |
|---|---|---|---|---|---|
| Bitcoin (BTC) | 2,224.0 | 790.0 | 2,731.0 | 2,196.0 | 7,941.0 |
| Ethereum (ETH) | 429.1 | 226.4 | 990.4 | 2,118.0 | 3,760.0 |
| XRP (Ripple) | 10.6 | 10.6 | 1.1 | 36.1 | 58.4 |
| Solana (SOL) | 5.3 | 21.6 | 92.6 | 39.1 | 158.6 |
| Litecoin (LTC) | – | – | – | – | – |
| Cardano (ADA) | 0.7 | 0.4 | 0.5 | 0.3 | 1.9 |
| SUI | 1.4 | 1.6 | 3.5 | 9.3 | 15.8 |
| Other’s | 2.7 | 2.8 | 2.1 | -0.5 | 7.1 |
Interest in digital assets reached remarkable heights in July. While total monthly inflows reached $12 billion, a general upward trend was observed in the crypto market. Bitcoin showed that it has regained the trust of investors with an inflow of $8 billion. Ethereum made a big leap and saw $3.7 billion in inflows, cementing its position as the leading altcoin. Ripple (XRP) was one of the notable altcoins with an inflow of $58.4 million. While investments in Solana continued to increase, Litecoin remained weak in terms of investor interest. Cardano (ADA), on the other hand, showed a decline in investor interest with only $1.9 million in inflows. However, other altcoins added to the diversity of the market, with inflows totaling $7.1 million.
Total Market Cap
The total value of the cryptocurrency market started July at $3.27 trillion. During the month, there was a capital inflow of approximately $557 billion, an increase of 17%. This increase was supported by purchases in major assets and expectations for spot ETFs. In the first three weeks of the month, the positive momentum was maintained and the total market capitalization reached $3.94 trillion, the highest level seen in July. However, this level could not be sustained. In the last week of the month, there was a correction as profit selling accelerated and risk appetite declined across the market. In this process, the total market capitalization was reduced to around 3.82 trillion dollars.
Spot ETF
For spot Bitcoin ETFs, July stood out as a period of strong institutional demand. ETFs, which recorded a net inflow of $4.6 billion in June, increased this momentum in July, totaling $6 billion in net inflows. While outflows were seen on only a few days throughout the month, the overall picture was dominated by net inflows. This indicated that institutional interest did not diminish in the summer months and Bitcoin maintained its importance in portfolios. Notable flows in July were particularly concentrated in Blackrock’s IBIT fund . IBIT alone received a net inflow of $4.96 billion, accounting for about 83% of total flows. On the price side, Bitcoin, which opened at $107,168 on July 1, closed at $118,086 on July 28, up about 10.2%. Strong demand for ETFs was the main factor supporting price movements. High inflows, especially in the July 2-18, 2025 date range, showed that confidence in the market continues. Overall, July 2025 was a stable and positive month for Spot Bitcoin ETFs in terms of both price and fund flow. If this institutional demand carries over into the September quarter, it would not be surprising to see Bitcoin test new highs.
For spot Ethereum ETFs, it was the most remarkable month since launch. Since the launch of Spot Ethereum ETFs, total cumulative net inflows have risen to $9.42 billion, while July alone saw strong net inflows totaling $5.19 billion and institutional demand peaking. July was a record-breaking period for Spot Ethereum ETFs. In particular, four of the strongest days of the month were recorded, with net inflows of $726.6 million on July 16 (the largest net inflow since launch), $602 million on July 17, $533.8 million on July 22 and $452.8 million on July 25. In total, these four trading days saw net inflows of approximately 2.3 billion dollars. For the month as a whole, only July 2 saw a small net outflow of $1.9 million and all other trading days were positive. On the price performance side, the impact of this strong corporate demand was clearly felt.
Options Data
In the Bitcoin options market, BTC contracts worth $4.69 billion will expire in the last week of this month, totaling $29.26 billion. Call options were concentrated in the $120,000-$122,000 band with a total of 555.88 thousand expiry trades, while put options were in the $105,000-$110,000 range with 400.36 thousand expiry trades. With a put/call ratio of 0.91, the maximum pain point will be realized at an average of $111,500.
When we look at the last trading day of this month in the Ethereum options market, ETH contracts worth $ 17.59 million will expire, while this figure will total 4,539 units. The number of Call options was concentrated in the band of $ 3,900 – $ 4,000 with a total of 1,575 expiry transactions, while Put options were in the range of $ 3,700 – $ 3,800 with 2,964 expiry transactions. The put/call ratio is 1.88 and the point max pain price) will average $3,850.
Crypto Side – August
Bitcoin July Performance: The Strong Cycle Continued
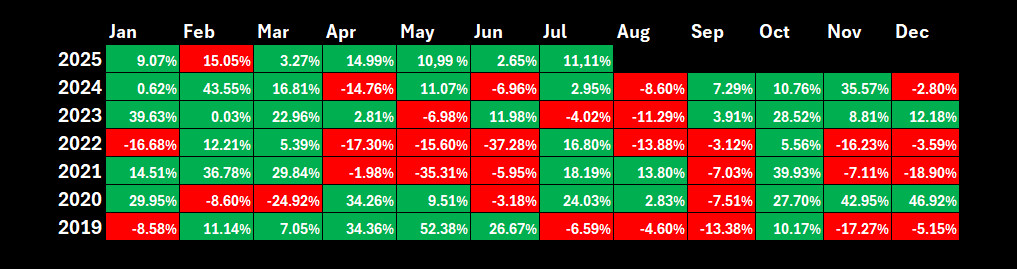
July has historically represented a mostly positive period for Bitcoin. Based on data since 2013, Bitcoin’s July performance has averaged a 7.56% increase. As a matter of fact, in line with this year, Bitcoin rose by 11.11% in July, increasing its historical July gain average by 7.83%.
August A Historically Weak and Cautionary Period
Looking at August, there is a more cautious outlook for Bitcoin. Especially post-2020 data reveals that this month attracted attention with an average negative performance of 3.55%. While the last three consecutive years have closed down, the average return calculated since 2013 has remained at just 1.75%. Double-digit positive closes only occurred in 2013, 2017 and 2021.
In light of this data, a more cautious approach stands out for August 2025. Bitcoin, which entered the consolidation process after the peak level reached in July, seems to have difficulty gaining upward momentum. This increases the possibility of a technical correction. Seasonal cycles and the strong rally of the previous month make these risks even more pronounced.
Although August is pessimistic or neutral, it should not be forgotten that the current period is highly sensitive to the macroeconomic and geopolitical developments in the rest of the report
*Prepared on 29.07.2025 at 08:00 am. (UTC)
Source: Darkex Research Department
Here are some important headlines that may have an impact on the market in August:
Geopolitical Tensions: The ongoing instability in the Middle East and the war between Russia and Ukraine continue to play a decisive role on investor sentiment.
Customs Tariffs: As of August 1, new customs tariffs will come into effect, which stands out as a critical development in terms of trade balances.
UK Bitcoin Sale: In the UK, the new Finance Minister Rachel Reeves is looking for revenue to alleviate the budget deficit (up to £20 billion). Against this backdrop, the Home Office has put on the agenda the sale of crypto assets, including at least 61,000 Bitcoins (approximately £5 billion / $7 billion).
Market Pulse
New Crypto Asset Laws and Macro Balances
It was a busy and eventful month for global markets. Negotiations on trade wars remained at the top of the agenda. Meanwhile, we also witnessed a process that could be revolutionary for digital assets. In the US, the world’s largest economy, three important laws were passed that are closely related to cryptocurrencies. This was a long-awaited development.
Towards the end of the month, we again witnessed a period when macroeconomic dynamics drove asset prices. While the Federal Open Market Committee (FOMC) kept interest rates unchanged as expected, other published indicators showed that the US economy grew by 3% in the second quarter of the year. Inflation data was not so innocent. This equation made it slightly less likely that the FOMC will decide on a rate cut at its September meeting.
August is unlikely to be any quieter than the last month. US data will remain under the scrutiny of investors and the Jackson Hole meeting will be on the agenda. In addition to the gains made by the digital world, we can say that the global economic climate and related expectations will continue to be influential in the values of major cryptocurrencies.
August 1 – US Employment Data
After leaving July behind, on August 1, the markets will be receiving the July Non-Farm Payrolls (NFP) data, which will provide clues about the tightness of the financial ecosystem in the coming period, which will provide information about the US Federal Reserve’s (FED) interest rate cut path. In addition, March figures such as average hourly earnings and the unemployment rate will also be monitored.
In June, the US economy added 147K jobs (Market Expectation: 111K).
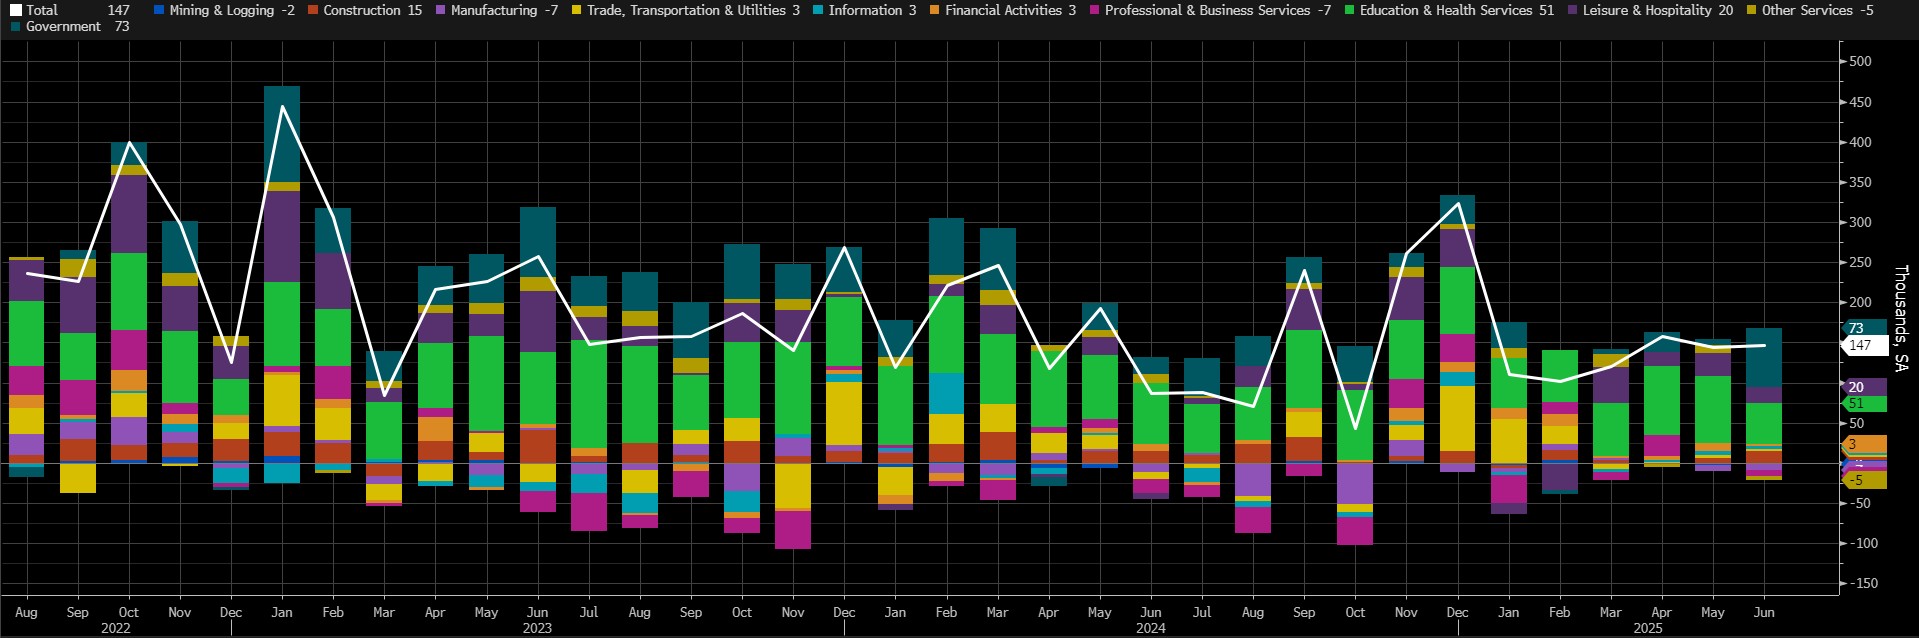
Source: Bloomberg
Our forecast for the highly sensitive NFP data is that the US economy added 166K jobs in the non-farm sectors in July. At the time of writing, although the number of forecasts entered is small, we see that the consensus (median forecast) in the Bloomberg survey is more pessimistic, around 118K (Investors are advised to follow Darkex daily bulletins as this expectation figure may change later with the entry of new forecasts and surveys).
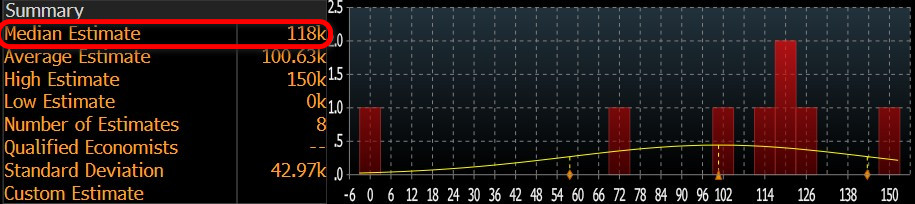
Source: Bloomberg
We believe that if the NFP data for July, which will be published in the shadow of Trump’s tariff-centered foreign policy, the deterioration that it may create domestically and the pressure created by his statements about FED Chairman Powell, is slightly below expectations, this will be priced as a potential metric that may create an expectation that the FED may act more boldly to lower the interest rate, thus increasing risk appetite and having a positive impact on financial instruments, including digital assets. We think that a slightly higher than expected data may have a similar but opposite effect .
August 12 – US Consumer Price Index: CPI
One of the important macro indicators that may provide information on the timing of the US Federal Reserve’s (FED) interest rate cut will be the July inflation, Consumer Price Index (CPI) change. In the current difficult conjuncture, the CPI data, which may give a sign of the course, will be closely monitored as it may have an impact on pricing behavior.
The annual inflation rate in the US accelerated for the second consecutive month to 2.7% in June 2025 from 2.4% in May, the highest level since February, in line with expectations. On a monthly basis, CPI rose by 0.3%, the largest increase in five months, compared to 0.1% in May. Our expectation is that we will see a monthly data of around 0.27% in July. In the chart below, you can see the monthly CPI data and its breakdowns, with core services continuing to be the largest component.
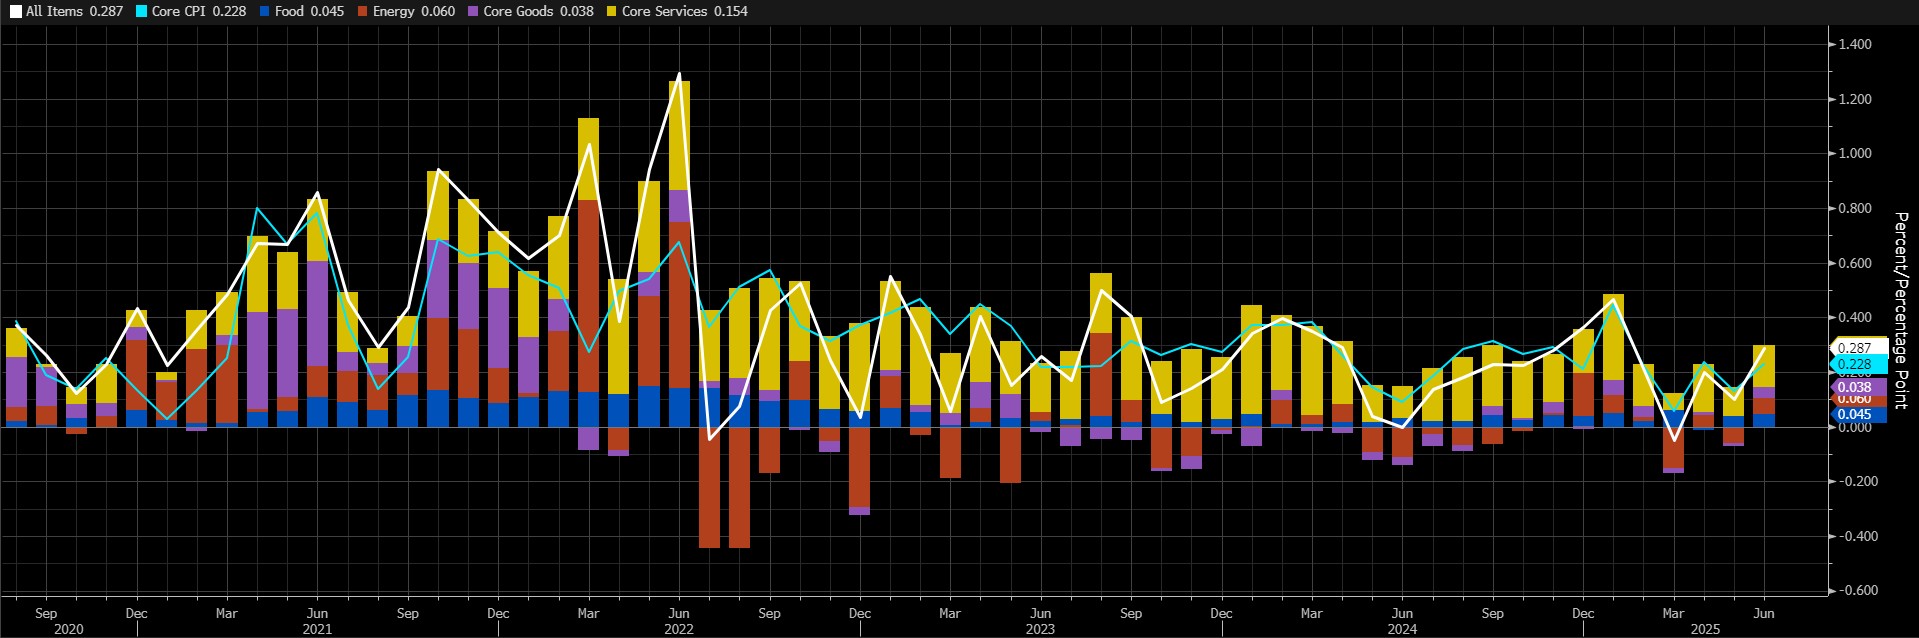
Source: Bloomberg
A lower-than-expected CPI reading could mean that the Fed will be in a better position to cut interest rates, which could have a positive impact on digital assets. A figure that exceeds forecasts has the potential to add pressure by reinforcing expectations that the Fed will not rush into another rate cut.
August 21-23 – 2025 Jackson Hole Economic Policy Symposium
This year’s Jackson Hole Economic Policy Symposium will be held between August 21-23. The theme for 2025 is “Labor Markets in Transition: Demography, Productivity and Macroeconomic Policy”.
The Jackson Hole meeting, which draws attention to Wyomin every year with the participation of central bank officials who manage the monetary policies of major economies, as well as representatives of the US Federal Reserve (FED), government officials, financial sector leaders, academics and journalists, will again be under the scrutiny of market participants.
We can say that the messages coming from the FED front will be closely monitored. Investors will try to get clues about the interest rate cut route of the Federal Open Market Committee (FOMC) and will examine every detail about this issue in order to predict the level of financial tightness in the coming period. Expectations regarding the FOMC’s decisions, which may also be important for the value of digital assets, will be one of the main agenda items in the crypto world.
August 28- US GDP Change
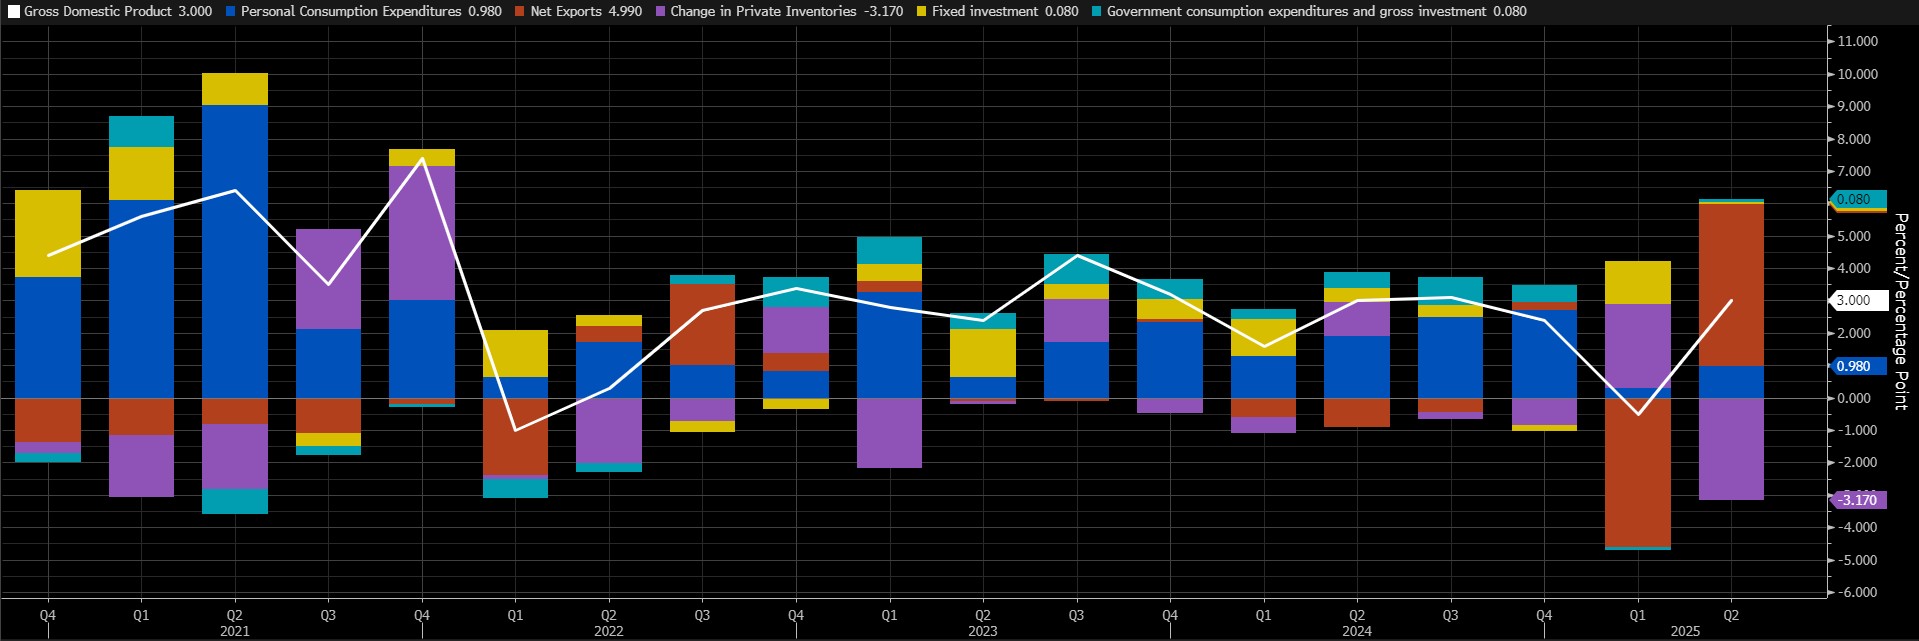
Donald Trump’s unpredictable policy choices continue to be a challenging factor for the entire world. Economic actors are also facing the challenges of this highly uncertain environment as they formulate their expectations and plan for the future. There are some outcomes of this situation. The most important of these is a slowdown or fluctuation in economic activity… In this respect, it will be important to see how much the US economy grew in the second quarter of the year. According to the first estimate, the US economy grew by 3% in the second quarter, after contracting in the previous quarter. According to the Bureau of Economic Analysis, which prepares this statistic, the US economy contracted by 0.5% in the first quarter of 2025 (the previous estimate for the period was -0.2%), reflecting the consequences of Trump’s unpredictable policies. This was the first decline since the first quarter of 2022. In the following quarter, we can say that we saw a relatively enthusiastic growth data.
As can be seen in the chart below, the main driver of the fluctuation in GDP (0.% contraction in the first quarter and 3% growth in the second quarter) is the change in net exports. In January, when President Trump took office, trade wars were on the agenda, which affected the direction of economic activity, especially foreign trade. Afterwards, in the April-May-June period, we saw that this item recorded a significant increase as the concerns about the issue diminished and became the biggest catalyst for the GDP increase.
Source: Bloomberg
The new data will be the second estimate for the second quarter of the year. It is still difficult to quantify and measure the impact of Trump’s policies on consumer behavior. The data will allow for healthier and longer-term projections on the direction of economic growth.
In terms of immediate market reaction, we think that a data above the consensus expectation may increase risk appetite and have a positive impact on digital assets. A lower-than-expected GDP data may have a negative impact from this point of view.
August 28 – FED’s Favourite Inflation Indicator PCE
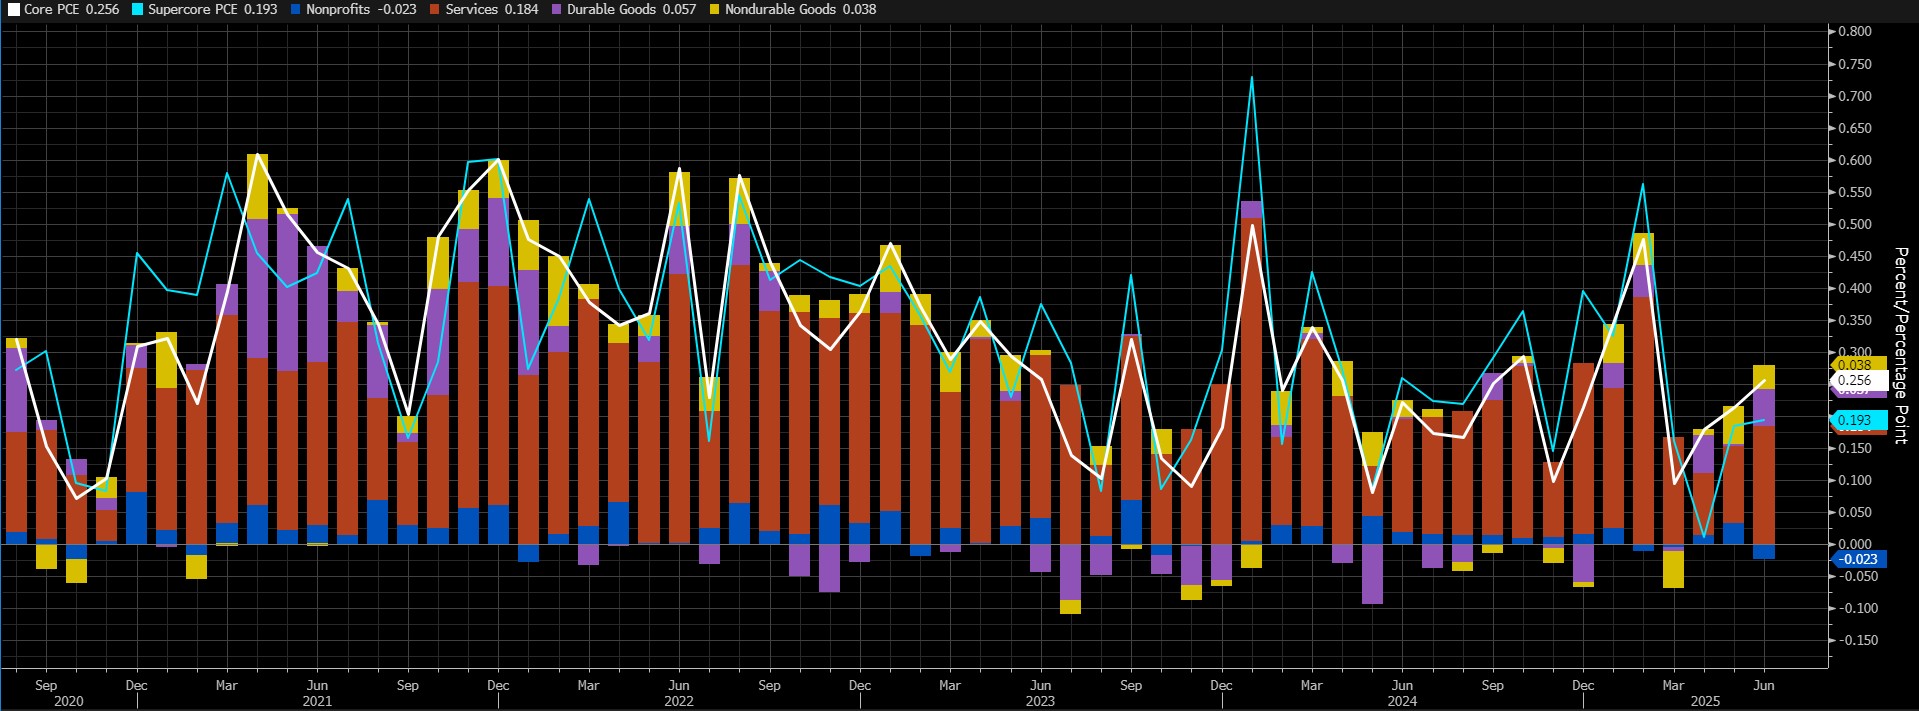
Markets will be watching the Personal Consumption Expenditures (PCE) data for July closely for clues on whether a rate cut will be decided at the Federal Open Market Committee (FOMC) meeting in September. This indicator is known as the preferred indicator for FOMC officials to monitor changes in inflation.
Source: Bloomberg
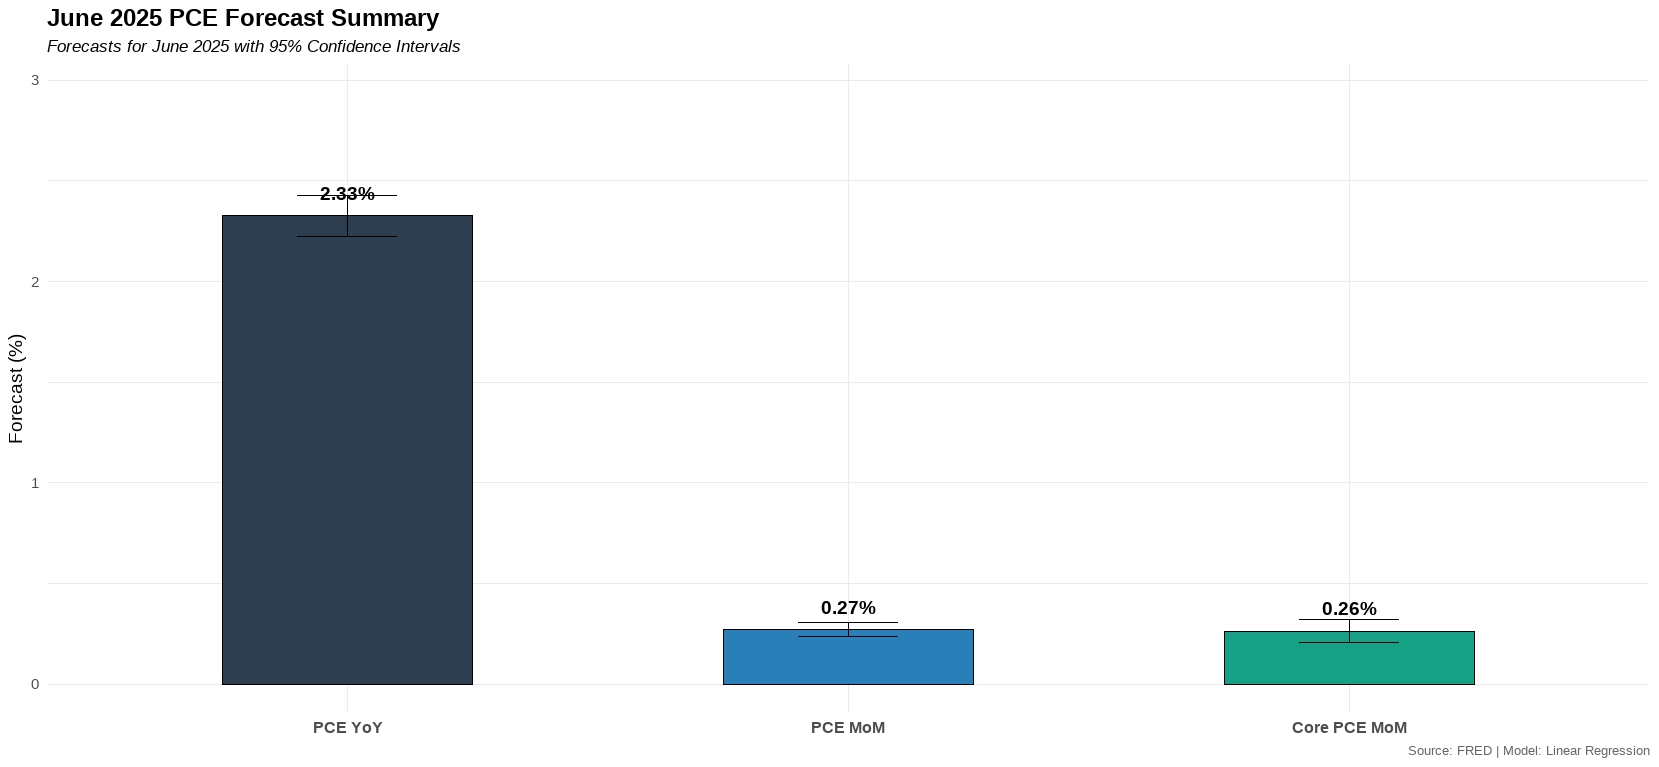
According to the latest data, core PCE increased by 0.3% mom in June. On an annual basis, core PCE increased by 2.8%. We can say that we continue to feel the Trump effect in this data . Our expectation is that the core PCE data will increase by around 0.26% in July.
 Source: Darkex Research
A higher-than-expected data may support expectations that the FED will maintain its cautious stance on interest rate cuts, reducing risk appetite and putting pressure on digital assets. A lower-than-expected data may pave the way for value gains with the opposite effect.
*General Information About Forecasts
In addition to the general market expectations, the forecasts shared in this report are based on econometric modeling tools developed by our research department. Different structures were considered for each indicator, and appropriate regression models were constructed in line with data frequency (monthly/quarterly), leading economic indicators and data history.
The basic approach in all models is to interpret historical relationships based on data and to produce forecasts that have predictive power with current data. The performance of the models used is measured by standard metrics such as mean absolute error (MAE) and is regularly re-evaluated and improved. While the outputs of the models guide our economic analysis, they also aim to contribute to strategic decision-making processes for our investors and business partners. Data is sourced directly from the FRED (Federal Reserve Economic Data) platform in an up-to-date and automated manner, so that every forecast is based on the latest economic data. As the research department, we are also working on artificial intelligence-based modeling methods (e.g. Random Forest, Lasso/Ridge regressions, ensemble models) in order to improve forecast accuracy and react more sensitively to market dynamics. The macroeconomic context should be taken into account in the interpretation of model outputs, and it should be kept in mind that there may be deviations in forecast performance due to economic shocks, policy changes and unforeseen external factors. With this monthly updated working set, we aim to provide a more transparent, consistent and data-driven basis for monitoring the macroeconomic outlook and strengthening decision support processes.
Legal Notice
The investment information, comments and recommendations contained in this document do not constitute investment advisory services. Investment advisory services are provided by authorized institutions on a personal basis, taking into account the risk and return preferences of individuals. The comments and recommendations contained in this document are of a general type. These recommendations may not be suitable for your financial situation and risk and return preferences. Therefore, making an investment decision based solely on the information contained in this document may not result in results that are in line with your expectations.