
Technical Analysis
BTC/USDT
Strategy purchased 21,021 BTC at an average price of $117,256 between the end of July and the beginning of August, totaling a $2.46 billion investment. MARA Holdings produced 703 BTC in July, increasing its total reserves to 50,639 BTC, and announced plans for a wind-powered data center in Texas. Empery Digital increased its total BTC holdings to 3,913 by purchasing an additional 110 BTC. Japan-based Convano Inc. announced a strategy to hold 21,000 BTC by March 2027 and revealed plans to raise approximately $13.54 million in August.
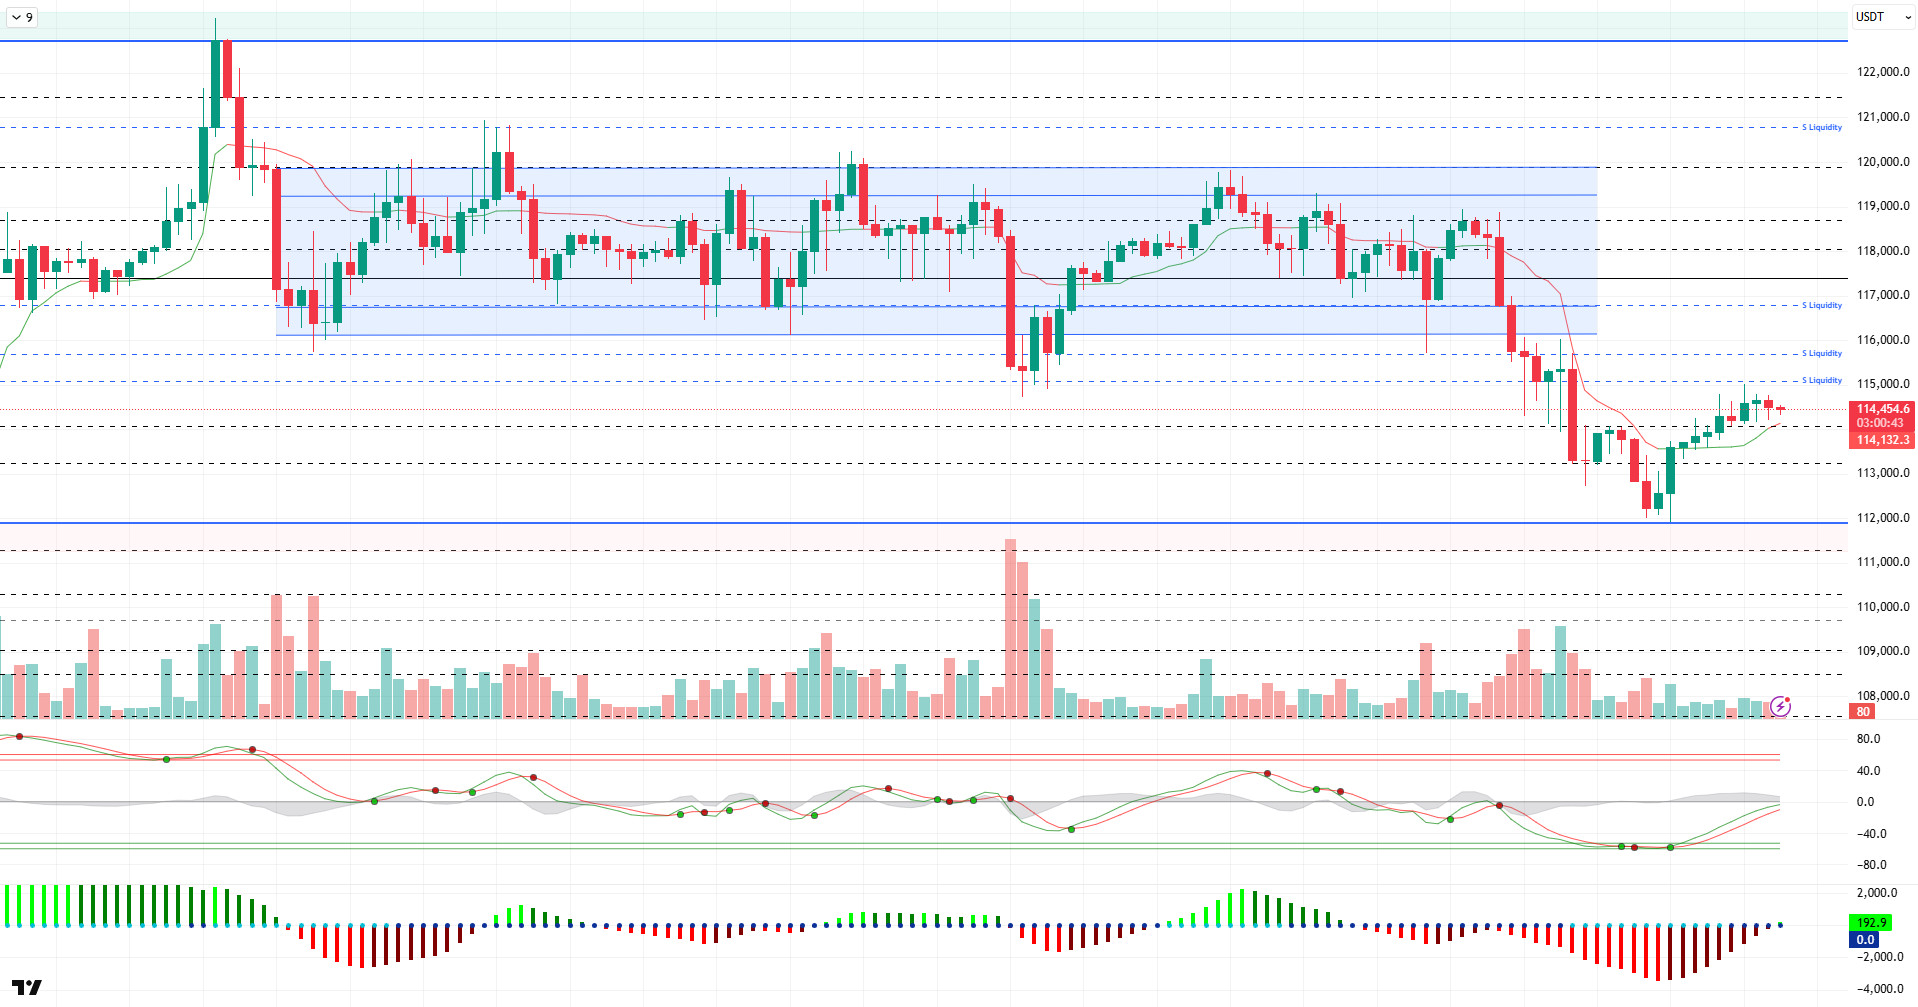
Looking at the technical picture, BTC broke down from the horizontal consolidation range and fell to 111,900. The price, which found support at this level, rebounded and tested the 115,000 level again. At the time of writing, it continues to trade at 114,300 with slight selling pressure.
On the technical indicators front, the Wave Trend (WT) oscillator retreated to the oversold zone amid selling pressure, but reversed its trend direction upward. The Squeeze Momentum (SM) indicator began to gain momentum in the negative zone. The Kaufman moving average retreated to 113,700.
Looking at liquidity data, nearly all buy-side transactions were liquidated, while sell-side transactions continued to increase. Short-term sell accumulation remains in the 115,100 – 116,800 range, while long-term accumulation continues to hold above the 120,000 level.
In summary, while fundamental developments emerged as factors creating selling pressure in terms of pricing, the manipulation of announced data and increasing expectations of interest rate cuts led to a loss of confidence in the market. Technical outlook and liquidity data, however, kept the price’s upward momentum alive, and in this context, the 115,000 reference point will be monitored. If the price breaks above this level, it is expected to return to the consolidation range and continue pricing near the ATH level. On the other hand, closes below this level indicate that pricing will continue in the “gap” zone, and the 112,000 level becomes critical in the event of new selling pressure.
Support levels: 114,000 – 113,200 – 112,000
Resistance levels: 115,000 – 116,000 – 116,800
ETH/USDT
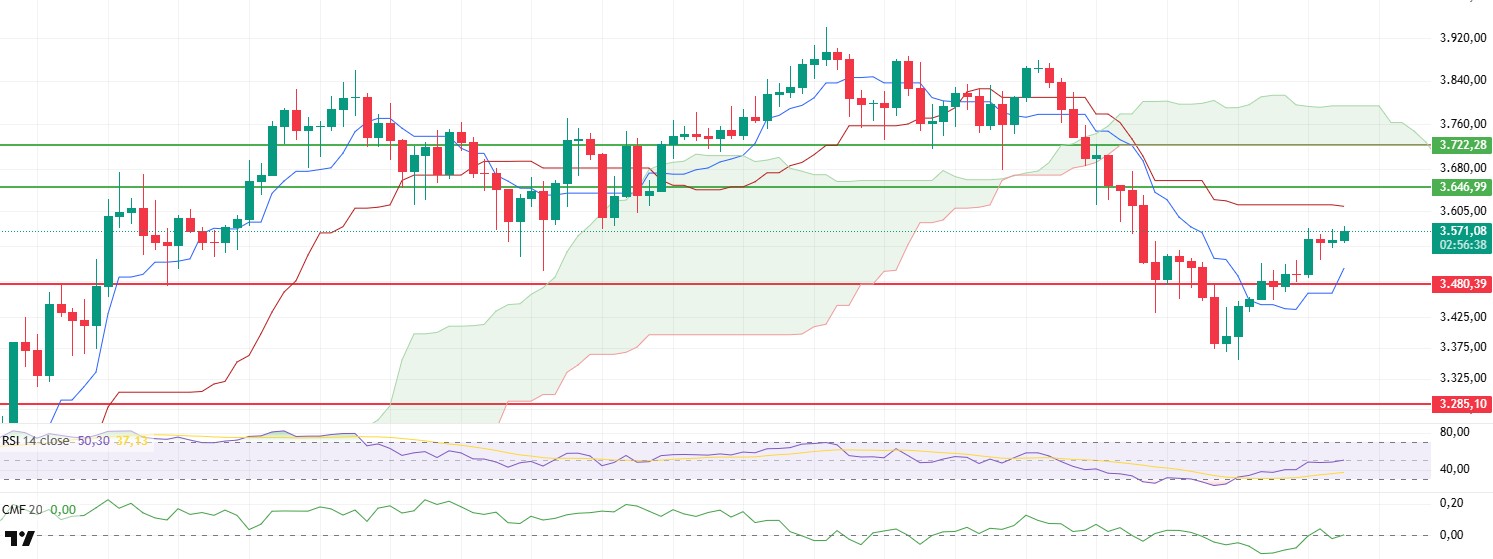
Ethereum managed to hold the $3,550 level during the day and continues to trade relatively flat in this region. During this period, when price movements have occurred within a narrow range, both technical indicators and on-chain data show significant improvements. The price is currently positioned between the Tenkan and Kijun levels according to the Ichimoku cloud indicator. This indicates that the market is in an indecisive structure in the short term, but the search for direction continues.
The Chaikin Money Flow (CMF) indicator had temporarily dropped into negative territory following the recent decline. However, it quickly rebounded from this level and returned to positive territory. This movement indicates that liquidity is beginning to flow back into the market, particularly on the spot side, signaling increased buyer appetite. The CMF’s continued stay in the positive zone emerges as a key factor strengthening the likelihood of the price exhibiting upward reactions.
In parallel, the Relative Strength Index (RSI) indicator also continues to gain strength. After reversing from the oversold zone, it rose above the 50 level and returned to positive territory. This structure of the RSI indicates that momentum in the market is recovering and that the price has increased potential for upward movement. The RSI’s ability to hold at these levels could be interpreted as a positive signal for the sustainability of upward momentum.
When examining the Ichimoku indicator, the price remaining above the Tenkan level and the Tenkan line showing an upward trend confirm a short-term recovery trend. However, despite these positive signals, the cloud structure remains red, and the price continues to trade below the cloud, indicating that the overall structure has not yet fully turned positive and that the market is progressing cautiously. The red cloud, in particular, suggests that pressures are still present, especially from a medium-term perspective.
When all these technical and on-chain data are evaluated together, the possibility of a gradual rise to the $3,647 level in the short term remains strong if the price maintains the $3,480 level. Testing this resistance level could confirm that the market recovery is technically justified. However, the possibility of renewed downward pressure and the start of a deeper correction should not be overlooked if the 3,480 dollar intermediate support level is broken. Therefore, whether this support level holds or not will play a critical role in determining the price direction for the remainder of the day.
Support levels: 3,480 – 3,285 – 3,081
Resistance levels: 3,646 – 3,722 – 4,084
XRP/USDT
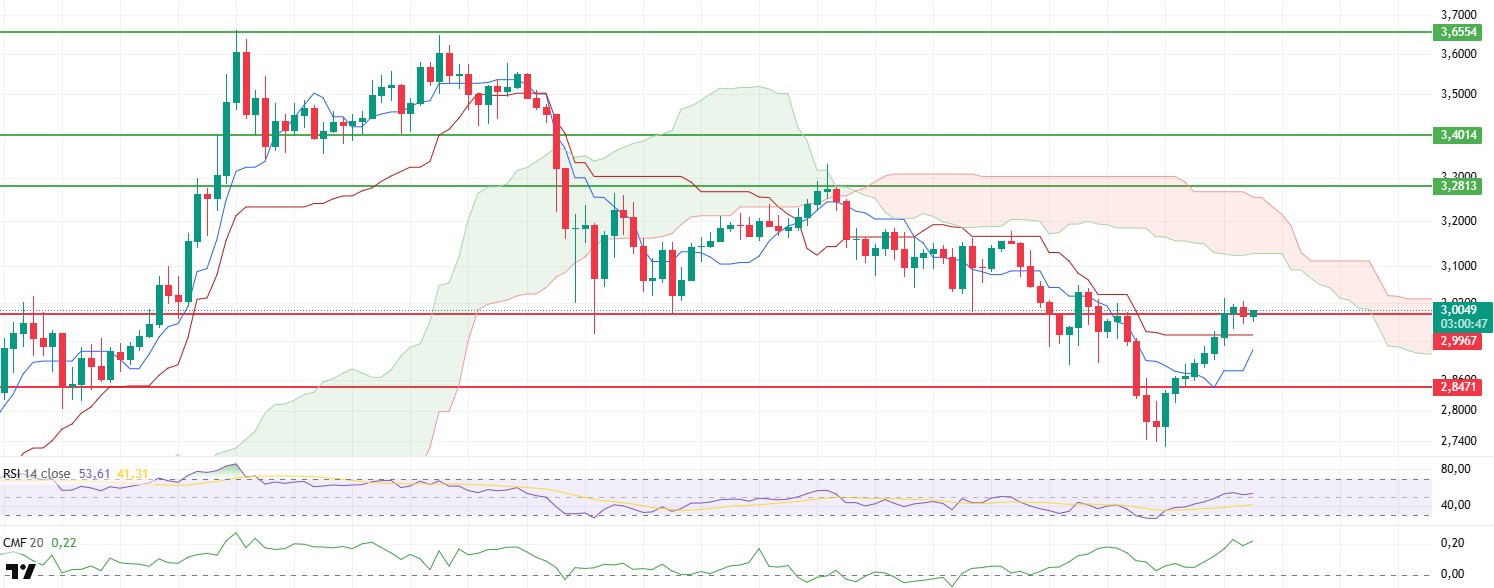
XRP, following the sharp decline it experienced in recent days, rose above the $2.99 level, signaling a strong recovery. This movement not only signified the reclaiming of an important psychological and technical threshold but also confirmed that the market structure had undergone a temporary correction and that short-term bottom levels may have formed. With the price settling above this level, technical indicators have also begun to show clear signs of recovery, indicating that the upward trend is technically grounded.
The Chaikin Money Flow (CMF) indicator remains positive following the recent rally and is also showing upward momentum. This indicates that liquidity inflows are continuing in the market and that buyers are still dominant. In particular, the increase in spot purchases is one of the key factors supporting the upward movement of prices. Maintaining this positive trend is crucial for the sustainability of the upward movement.
In addition, the Relative Strength Index (RSI) is managing to stay above both its own average value and the 50 threshold level. The fact that the RSI is holding steady in these regions indicates that market momentum remains positive and that XRP still has technical upside potential. This balanced rise, achieved without approaching the overbought zone, suggests that the market has not yet reached saturation and that a healthy foundation has been laid for continued upward movement.
The Ichimoku cloud analysis also presents a picture that parallels the technical outlook. While the Kijun level remains horizontal, the upward movement of the Tenkan line supports the short-term bullish signal. The convergence of these two levels indicates that the price is gaining momentum and exhibiting an upward-sloping structure in search of direction . Additionally, the price continuing to remain above both the Tenkan and Kijun levels confirms these signals. This structure presents a clear picture indicating that buyers are in control from a technical perspective.
When all these data are taken together, it is crucial for the XRP price to remain above the $2.99 level in order to maintain the short-term positive structure. As long as this scenario continues, there is a high probability that the price will test the lower band of the Ichimoku cloud at the $3.12 level. This area serves as both a technical resistance level and a psychological threshold, so how buyers react at this level will be decisive. On the other hand, a daily close below the $2.99 level could lead to the breakdown of the current positive structure and the re-emergence of downward pressure. In such a scenario, the price could enter a gradual downward correction.
Supports: 2.8471 – 2.6513 – 2.4777
Resistances: 2.9967 – 3.2813 – 3.4014
SOL/USDT
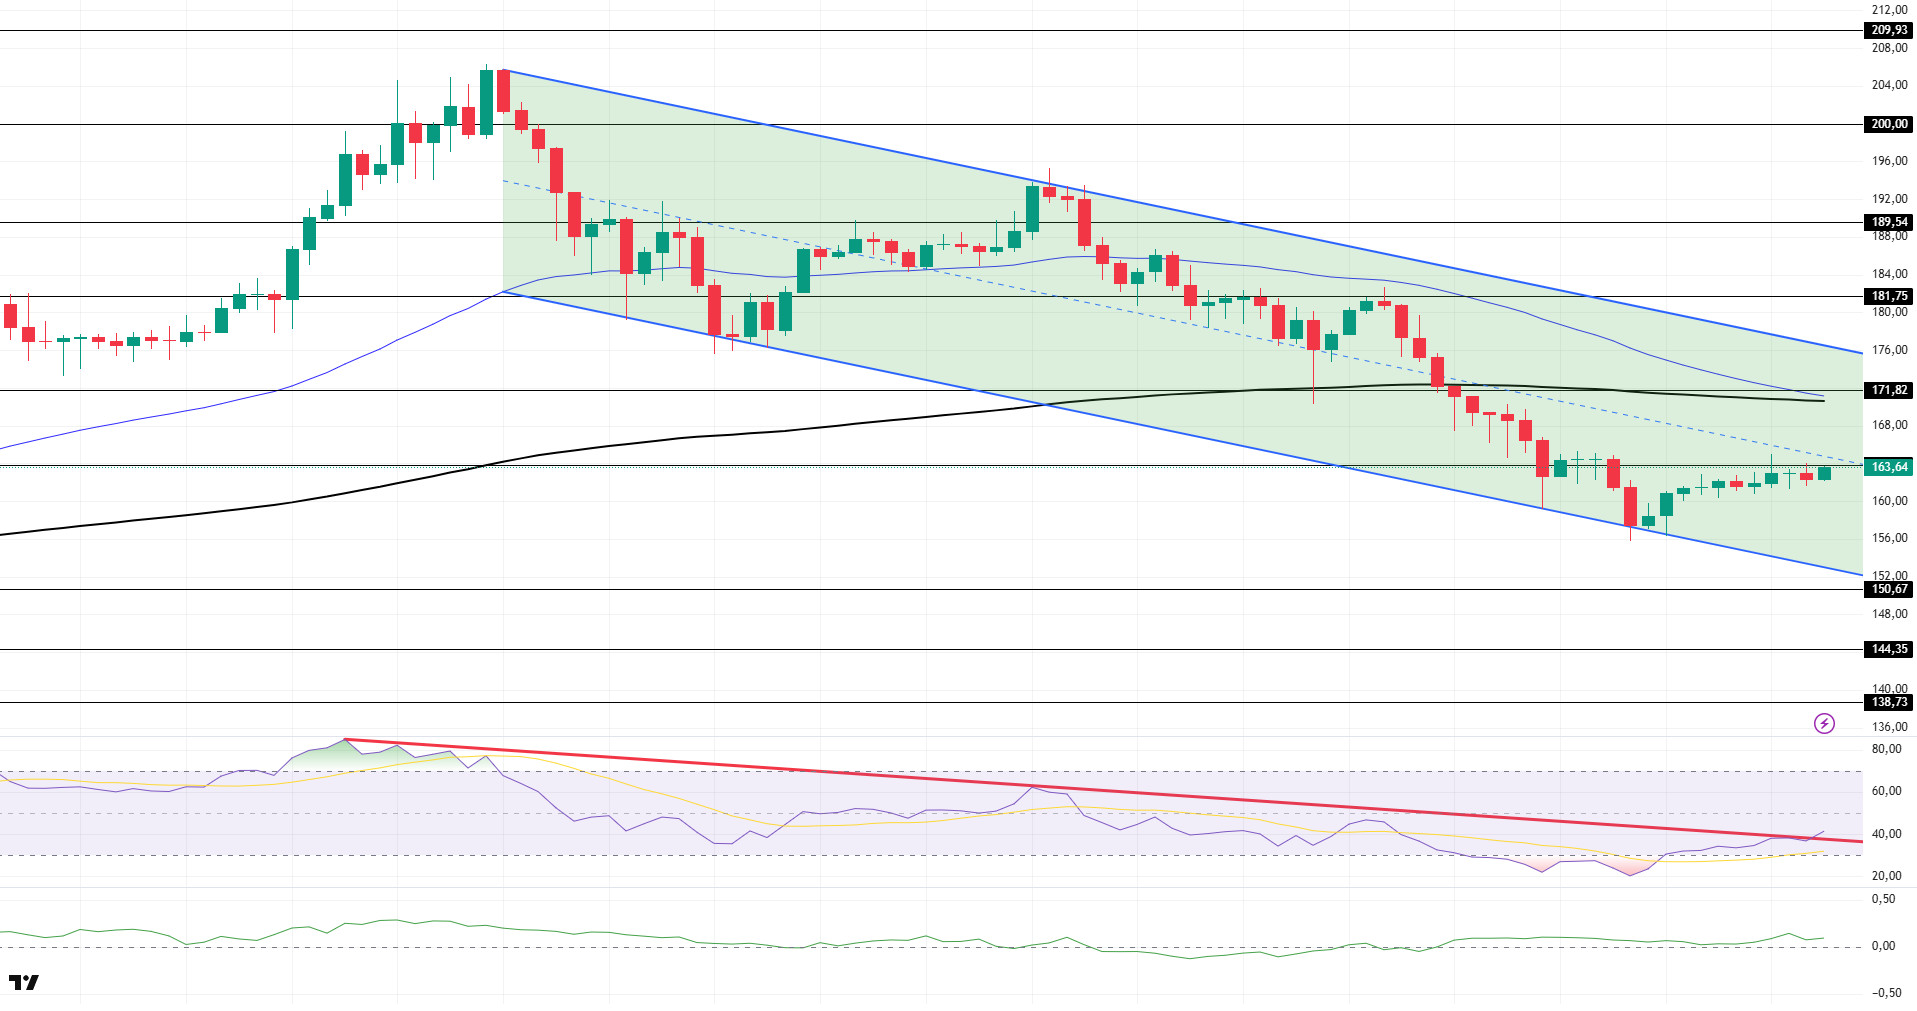
The SOL price remained flat during the day. The asset continued to remain within the downward trend that began on July 23. The price, which continues to remain below the 200 EMA (Black Line) moving average, is currently testing the strong resistance level of $163.80. If the upward movement continues, the 171.82 dollar level can be monitored. In the event of a downward movement, the bottom level of the downward trend should be monitored.
On the 4-hour chart, the 50 EMA (Blue Line) remains above the 200 EMA (Black Line). This indicates that the upward trend may continue in the medium term. At the same time, the price being below both moving averages shows that the market is currently in a downward trend. The Chaikin Money Flow (CMF-20) remains at a positive level. However, an increase in money inflows could push the CMF to the upper levels of the positive zone. The Relative Strength Index (RSI-14) broke above the downward trend that began on July 21. This could signal an upward movement. In the event of an uptrend driven by positive macroeconomic data or news related to the Solana ecosystem, the $171.82 level emerges as a strong resistance point. If this level is broken upward, a continuation of the uptrend is expected at . In the event of a pullback due to adverse developments or profit-taking, the 150.67 dollar level could be tested. A decline to these support levels could see an increase in buying momentum, potentially presenting an opportunity for an upward move.
Support levels: 150.67 – 144.35 – 138.73
Resistance levels: 163.80 – 171.82 – 181.75
DOGE/USDT
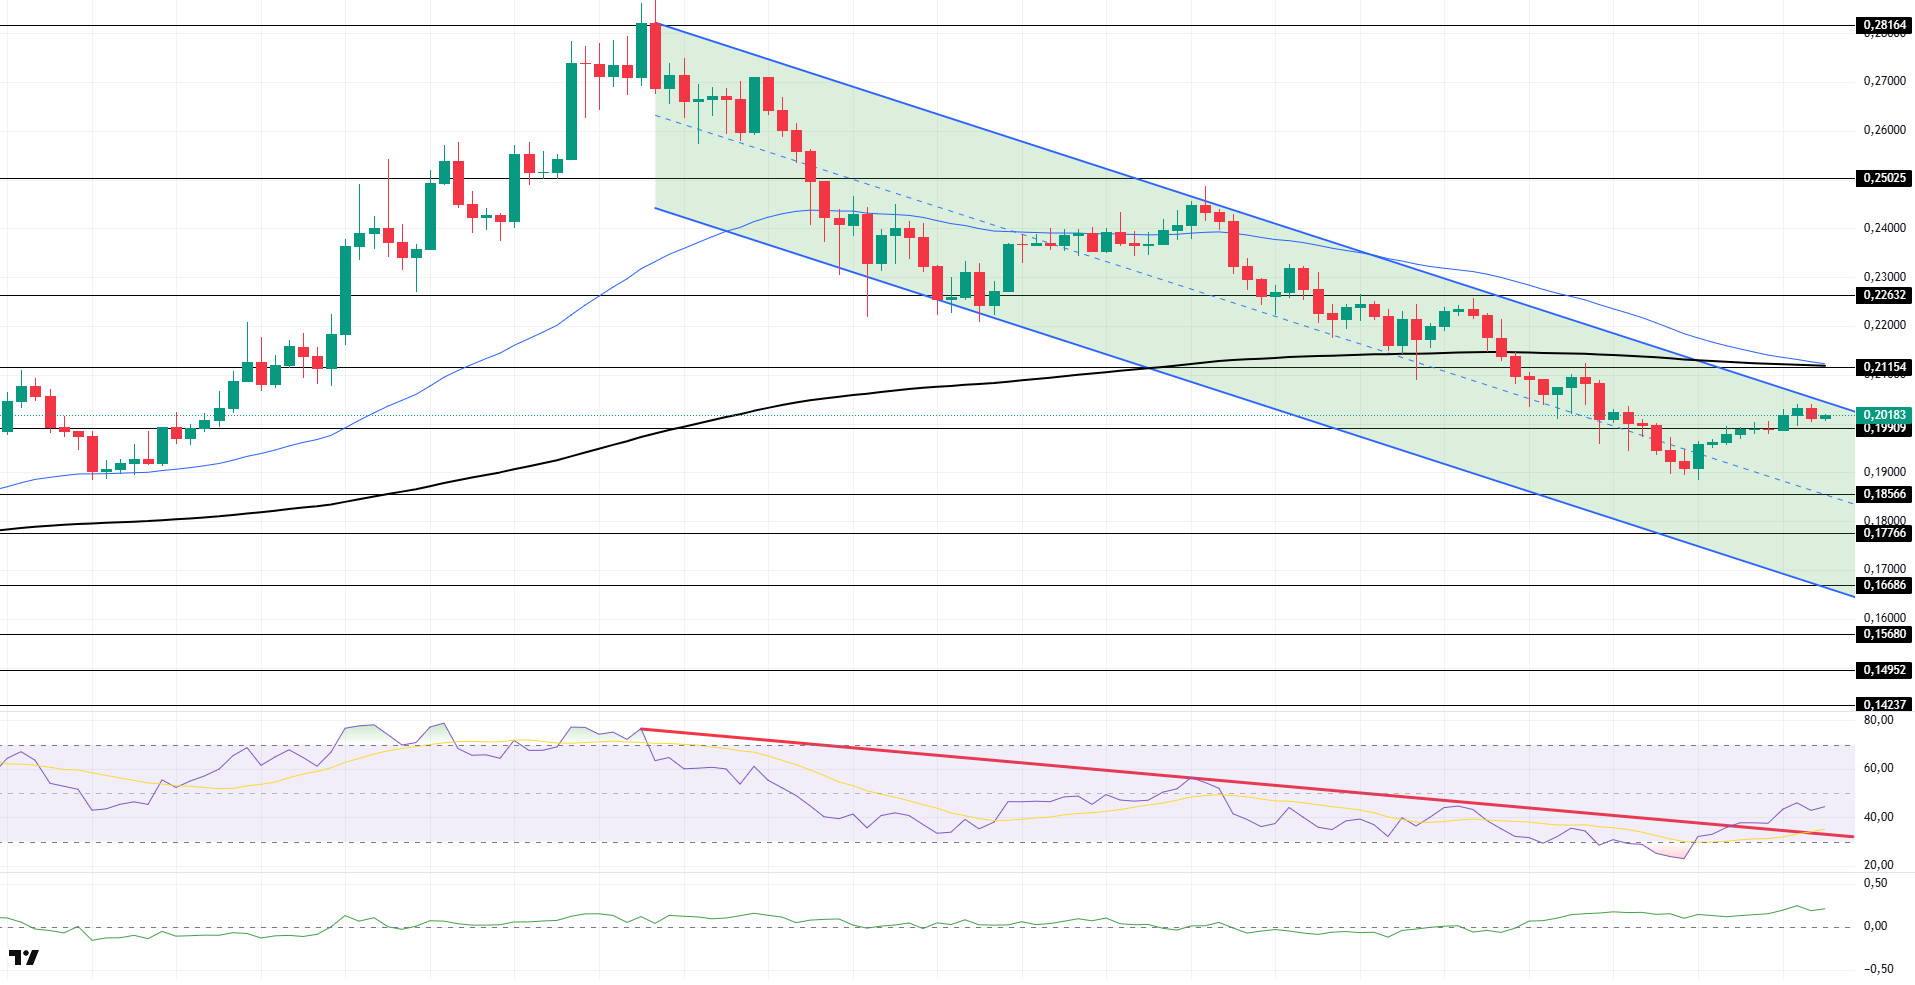
The DOGE price continued to trade sideways during the day. The asset remains near the upper line of the downtrend that began on July 21. The price also remained below the 200 EMA (Black Line) moving average. In the event of a continued decline, the 0.19909 dollar level can be monitored as support. If an upward movement begins, the 0.21154 dollar level should be monitored.
On the 4-hour chart, the 50 EMA (Blue Line) remains above the 200 EMA (Black Line). This indicates that the asset is in an upward trend in the medium term. The price being below both moving averages signals that the asset is in a downward trend in the short term. Chaikin Money Flow (CMF-20) remained at a positive level. Additionally, negative cash inflows could push the CMF into negative territory. The Relative Strength Index (RSI-14) remains in the negative zone. However, it has continued to stay above the downward trend that began on July 21. This could trigger an upward movement. In the event of an uptrend driven by political developments, macroeconomic data, or positive news flow within the DOGE ecosystem, the $0.22632 level emerges as a strong resistance zone. In the opposite scenario or in the event of potential negative news flow, the 0.18566 dollar level could be triggered. A decline to these levels could increase momentum and potentially initiate a new upward wave.
Support levels: 0.19909 – 0.18566 – 0.17766
Resistance levels: 0.21154 – 0.22632 – 0.25025
Legal Notice
The investment information, comments, and recommendations contained herein do not constitute investment advice. Investment advisory services are provided individually by authorized institutions taking into account the risk and return preferences of individuals. The comments and recommendations contained herein are of a general nature. These recommendations may not be suitable for your financial situation and risk and return preferences. Therefore, making an investment decision based solely on the information contained herein may not produce results in line with your expectations.
