Technical Analysis
BTC/USDT
Corporate companies’ Bitcoin purchase strategies continue to expand. The Smarter Web Company increased its Bitcoin holdings to 2,395 units at an average price of 89,000, bringing its BTC investment return to 55% year-to-date. Metaplanet announced that it holds 18,113 BTC and purchased 518 BTC in its latest transaction for 61.4 million dollars. El Salvador has reached a total of 6,266 BTC by purchasing 1 BTC every day for 1,000 days; the current value of its holdings is calculated at 745.9 million dollars. Today, the market’s focus is on U.S. inflation data, and volatility is expected to increase following the announcement.
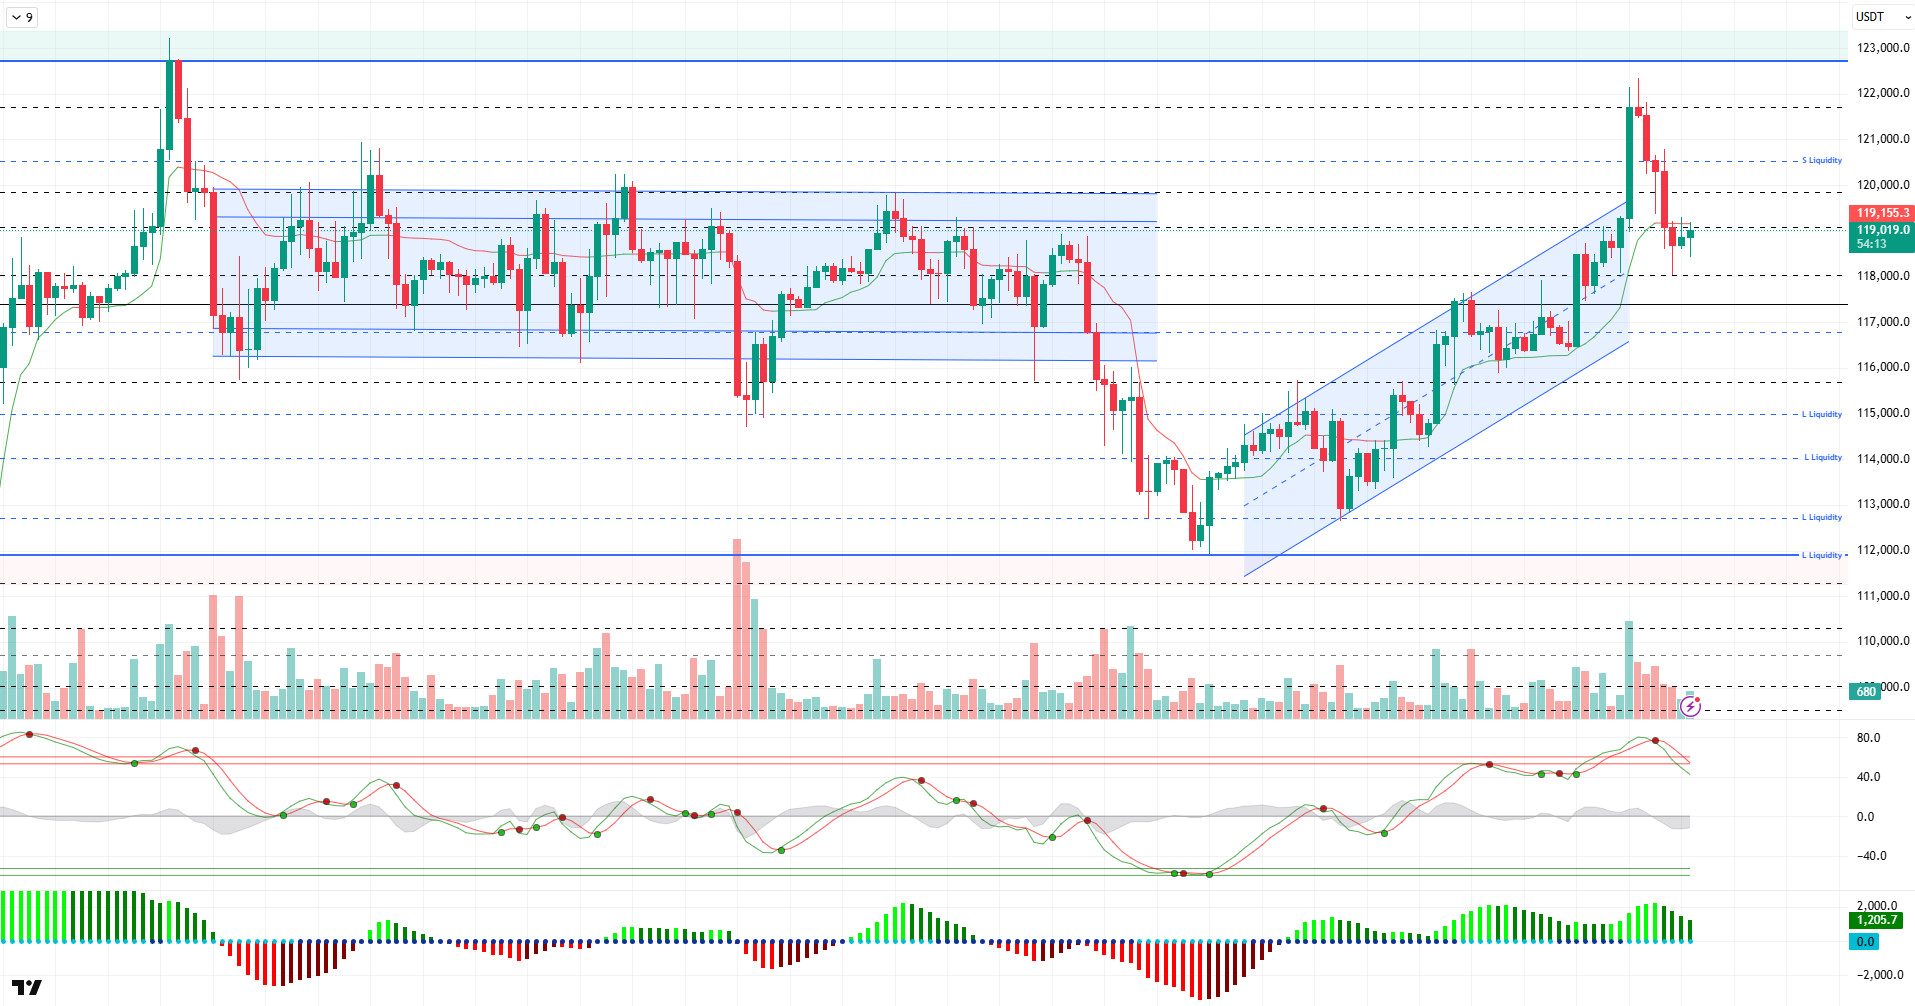
Looking at the technical picture, BTC, which had been testing its all-time high (ATH) level in the previous analysis, corrected downward due to profit-taking, retreating to the 118,000 level. The price, which re-entered the 116,000-120,000 range where it had been consolidating for a long time, continues to trade at the 119,000 level at the time of writing.
Technical indicators point to a trend reversal in the Wave Trend oscillator (WT) above the overbought zone. The Squeeze Momentum (SM) indicator shows a weakening of momentum in the positive zone, while the Kaufman moving average is currently trading just above the price at 119,100.
Looking at liquidity data, a significant portion of the heavy buy positions that began at the 115,000 level have been liquidated around 118,000, while the highest accumulation remains open at the 115,000 level. Sell positions, on the other hand, have accumulated at the 121,000 and 123,000 levels in the short term.
In summary, while institutional buying continues to send positive signals in the fundamental developments section, silence prevails on the Trump front. Expectations for an interest rate cut in September are around 84% ahead of inflation data. The technical structure continues to reflect that pricing has reached its saturation point and that the correction movement may continue, while liquidity data shows that transactions at the 115,000 level are significant. In this context, if the price continues to pull back, the 118,000 level will be monitored as a support area, and in case of a breakout, the 117,500 level will be followed. If the selling pressure continues, the 115,000 level will be monitored as a reference for the continuation of positive pricing. On the other hand, if the technical structure reverses, the 120,000 level will emerge as resistance before the ATH, and closes above this level could trigger an increase in momentum.
Support levels: 118,000 – 117,500 – 115,000
Resistance levels: 120,000 – 121,500, 123,000
ETH/USDT
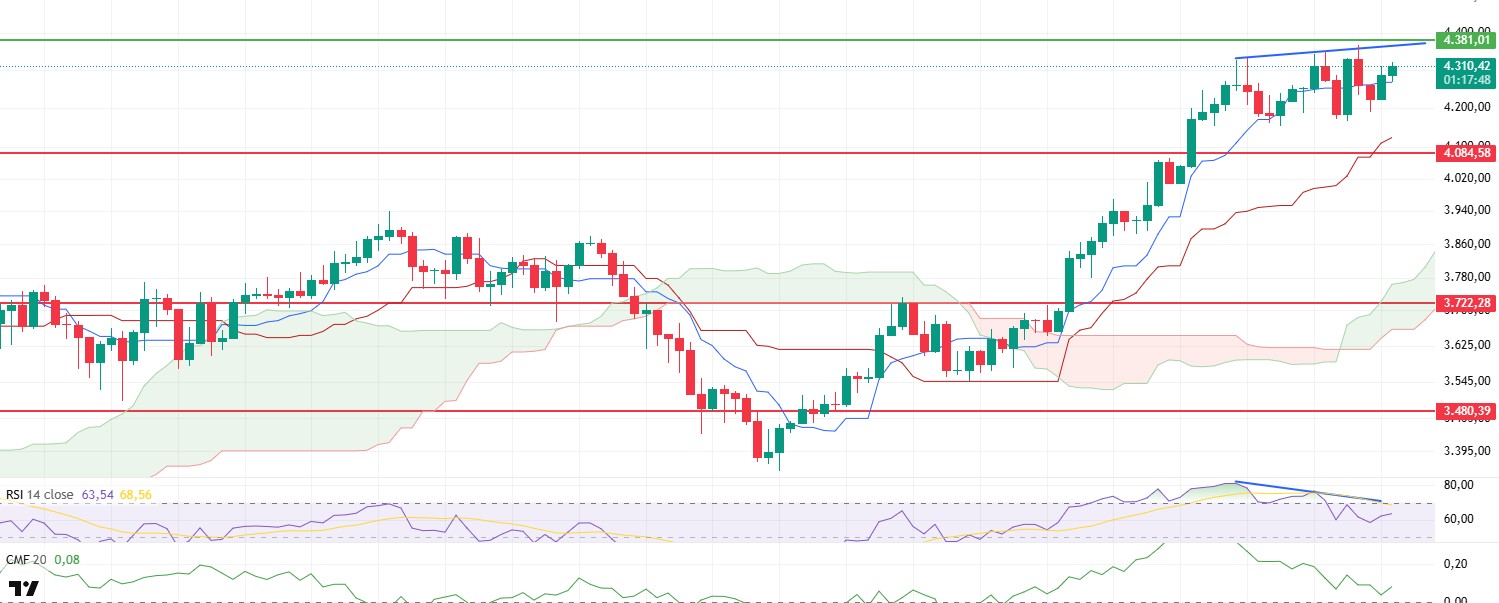
ETH fell to $4,170 yesterday evening, testing the short-term support zone. Buying from this point quickly pushed the price up to $4,365. However, increased selling pressure during the night caused the price to fall back below the $4,300 level. This price movement indicates that short-term upward momentum has weakened in the market and buyers have lost strength.
When on-chain and technical data are evaluated together, it is noteworthy that the Cumulative Volume Delta (CVD) indicator shows that price increases are primarily driven by futures trading. This indicates that the rally is not based on organic spot demand and has a fragile structure fueled by leveraged positions. This fragility increases the risk of sharp pullbacks due to sudden liquidations, especially during periods of high leveraged long positions. Supporting this view, open interest has reached $29 billion, and the funding rate continues to trend positively. Positive funding rates indicate that long positions dominate the market, suggesting that a downward price movement could trigger sharp declines due to the liquidation of leveraged long positions.
While the Chaikin Money Flow (CMF) indicator, which measures liquidity flow, remains in positive territory, its decline toward the zero line signals a slowdown in fund inflows and continued capital outflows from the market. This is a signal that the liquidity support needed to sustain upward momentum is weakening.
When examining the Ichimoku indicator, the fact that the price has tested the Tenkan level multiple times indicates that the market is struggling to find direction in the short term and that upward moves are likely to remain short-lived reactions rather than the start of a strong trend.
On the Relative Strength Index (RSI) side, a negative divergence is observed. While the price chart shows rising peak levels, the RSI producing lower peak levels indicates that buyers are using less power at each new peak and momentum is gradually shifting to sellers. This is generally considered one of the leading signals of a trend reversal.
In light of all these indicators, if the price fails to hold above the 4,381 dollar level during the day and especially at the close, selling pressure is expected to continue and the downward movement to accelerate. In such a scenario, the 4,084 dollar level is the main support level from a technical perspective, and closes below this level could trigger a deeper correction. On the other hand, closes above 4.381 USD, supported by high trading volume, could reignite the upward trend and pave the way for a transition to a new price range between $4,450 and $4,500.
Top of Form
Below the Form
Support levels: 4,084 – 3,722 – 3,646
Resistance levels: 4,381 – 4,550 – 4,857
XRP/USDT
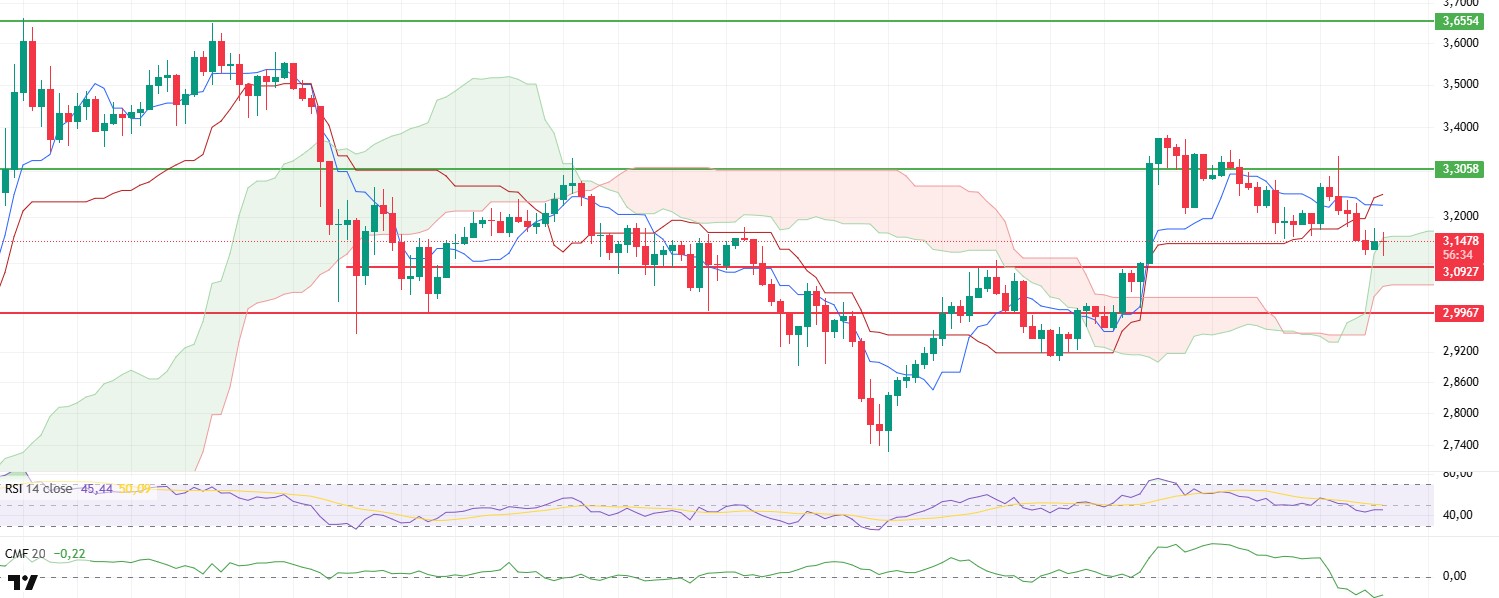
The XRP price followed a downward trend as expected yesterday evening, falling to the kumon cloud and thus testing an important technical support zone. During this pullback, weakening signals in technical indicators also continued to be evident.
The Relative Strength Index (RSI) indicator broke below the 50 level and the moving average (MA) line, indicating that market momentum has shifted into the hands of sellers. This break in the RSI confirms that buying appetite has weakened and that the price is likely to test lower levels. With the momentum indicator also losing momentum, downward movement is expected to continue in the short term.
The Chaikin Money Flow (CMF) indicator remains in negative territory, deepening the downward trend and indicating an intensification of fund outflows from the market. This suggests that short-term buyers are exiting the market and selling pressure is strengthening.
When examining the Ichimoku indicator, the “sell” signal that emerges as the price retreats into the kumo cloud and the Tenkan line crosses below the Kijun line further strengthens the bearish outlook from a technical perspective.
In light of all this data, if the negative signals produced by technical indicators continue, it is likely that the price will decline to the support level of $3.09 during the day. Breaking below this level could lead to an acceleration of selling pressure and more severe pullbacks. On the other hand, the 3.30 dollar level stands out as an important resistance point, and if the price breaks above this level, the current negative scenario could become invalid, and upward momentum could regain momentum.
Supports: 3.0927 – 2.9967 – 2.7355
Resistances: 3.3058 – 3.6554 – 4.0055
SOL/USDT
Alameda opened a position of 35.5 million dollars in SOL.
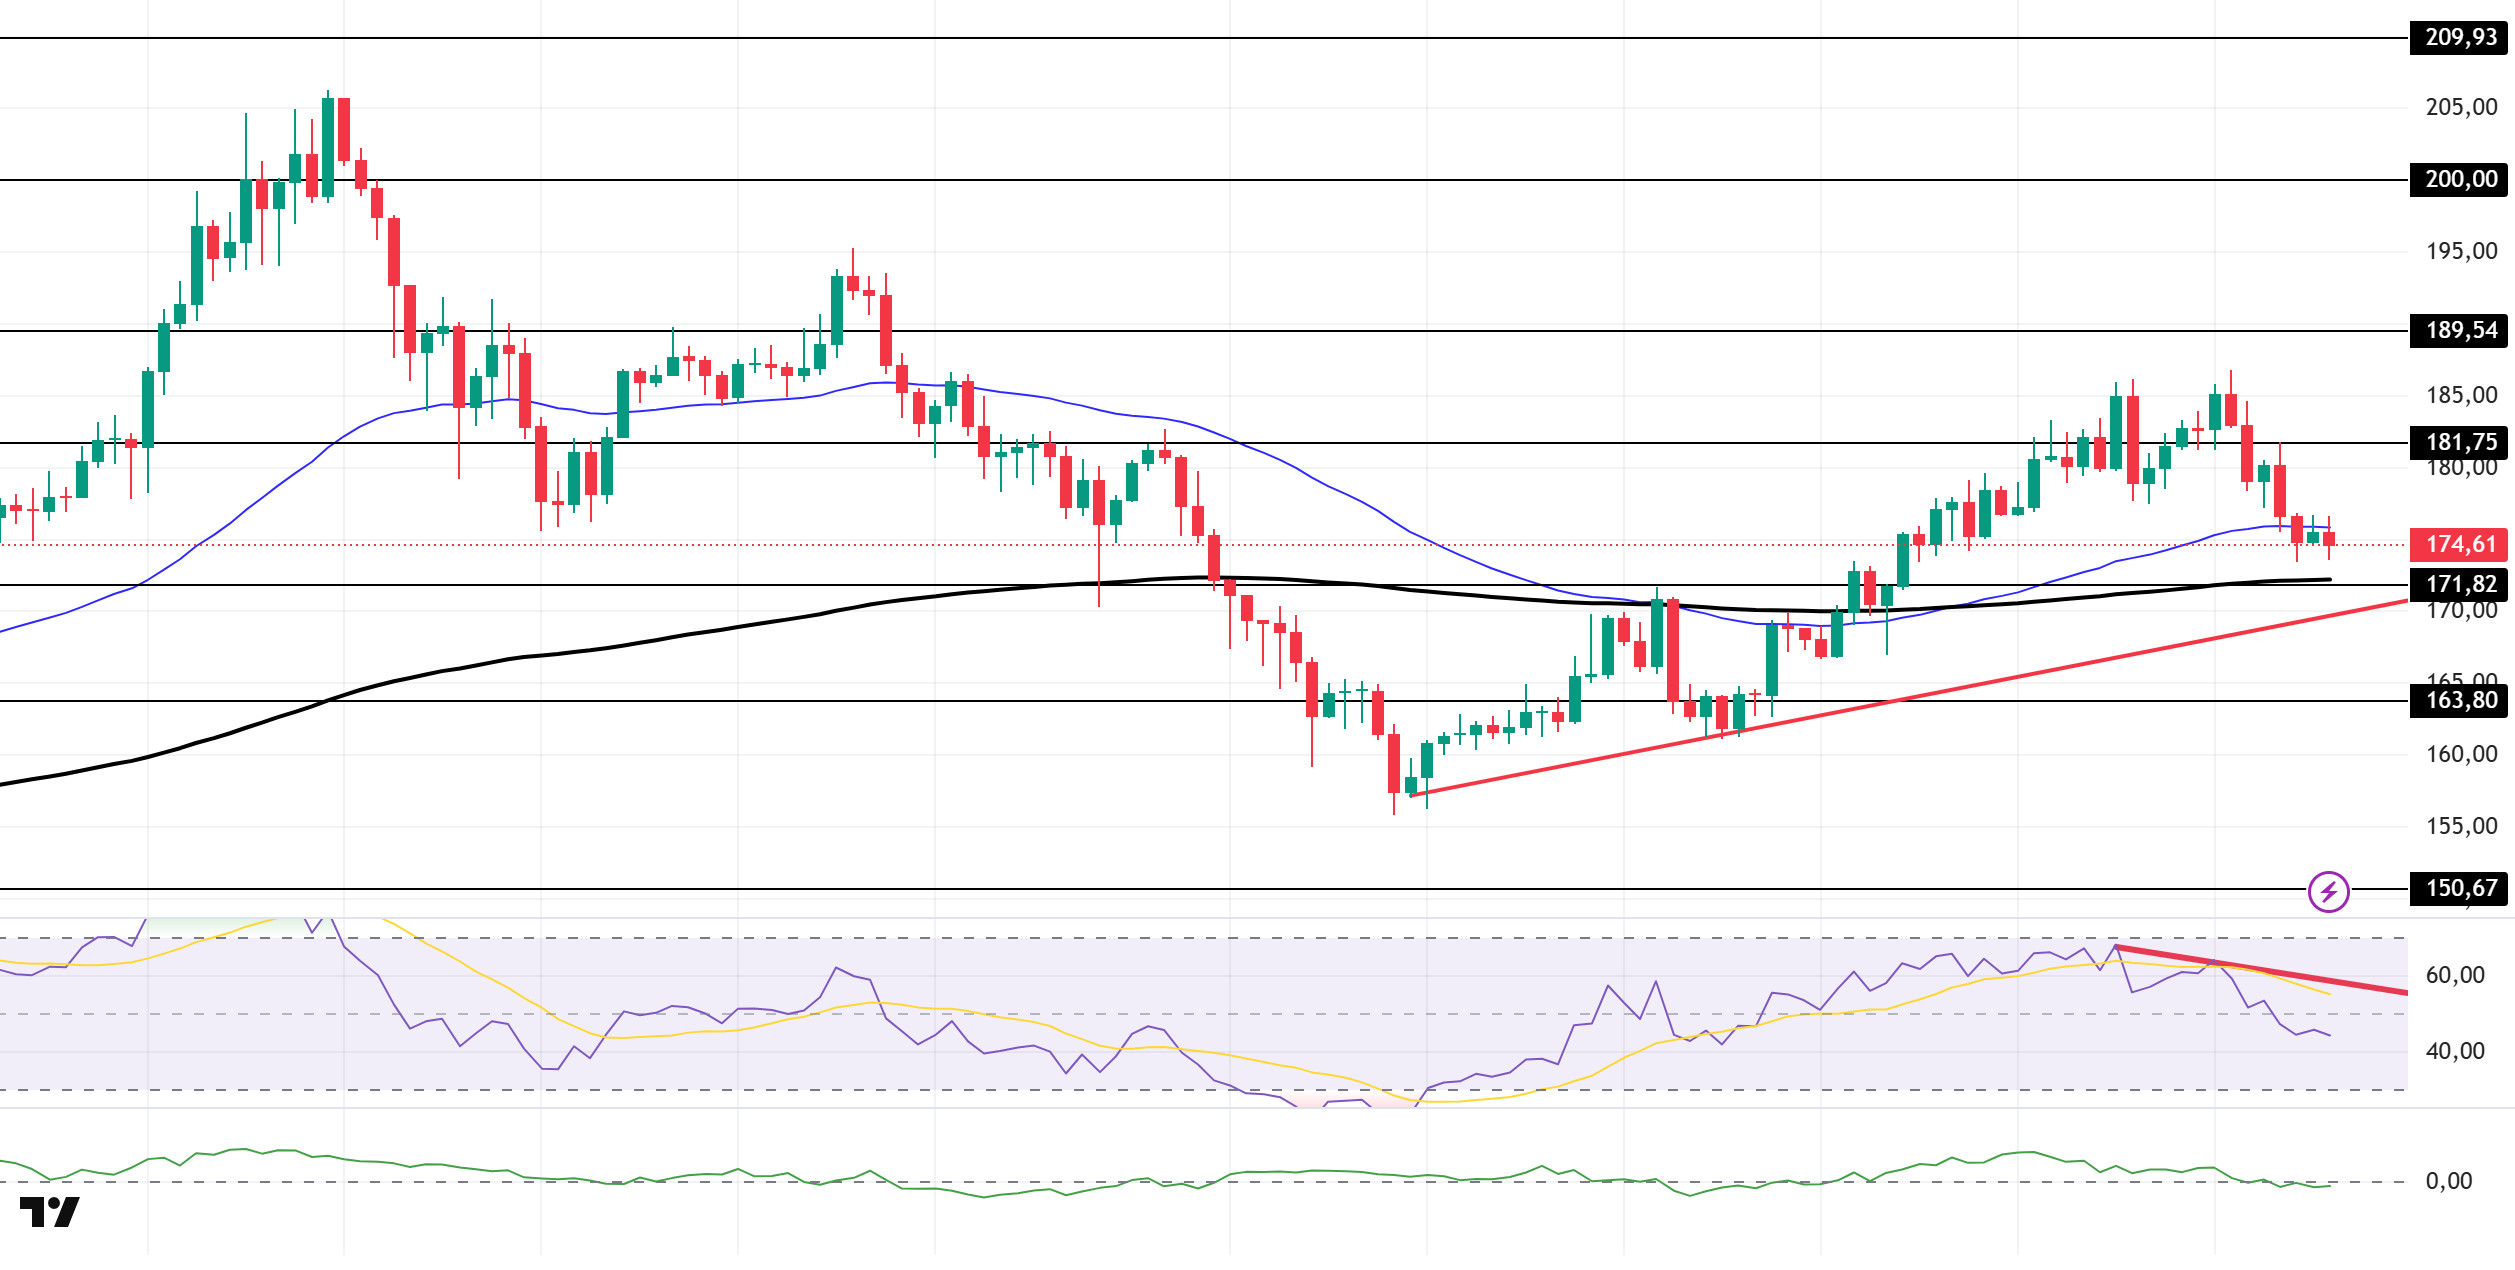
The SOL price experienced a pullback. The asset remained above the upward trend line that began on August 2. The price broke below the major level of $181.75, lost momentum, and continued its decline. As of now, the price is testing the 50 EMA (Blue Line) moving average as resistance, experiencing a pullback and continuing its decline. If the declines continue, it could test the $171.82 level. In case of an uptrend, the $181.75 level can be monitored.
On the 4-hour chart, the 50 EMA (Blue Line) remains above the 200 EMA (Black Line). This indicates that the upward trend may continue in the medium term. At the same time, the price being between the two moving averages shows that the market is currently in a decision phase. The Chaikin Money Flow (CMF-20) is at a neutral level. However, an increase in money inflows could push the CMF into the positive zone. The Relative Strength Index (RSI-14) remains below the downward trend that began on August 10. This indicates that selling pressure is continuing. In the event of an upward movement due to macroeconomic data or positive news related to the Solana ecosystem, the $181.75 level emerges as a strong resistance point. If this level is broken to the upside, the upward trend is expected to continue. In the event of a pullback due to adverse developments or profit-taking, the 171.82 dollar level could be tested. A decline to these support levels could see an increase in buying momentum, presenting a potential opportunity for an upward move.
Support levels: 171.82 – 163.80 – 150.67
Resistance Levels: 181.75 – 189.54 – 200.00
DOGE/USDT
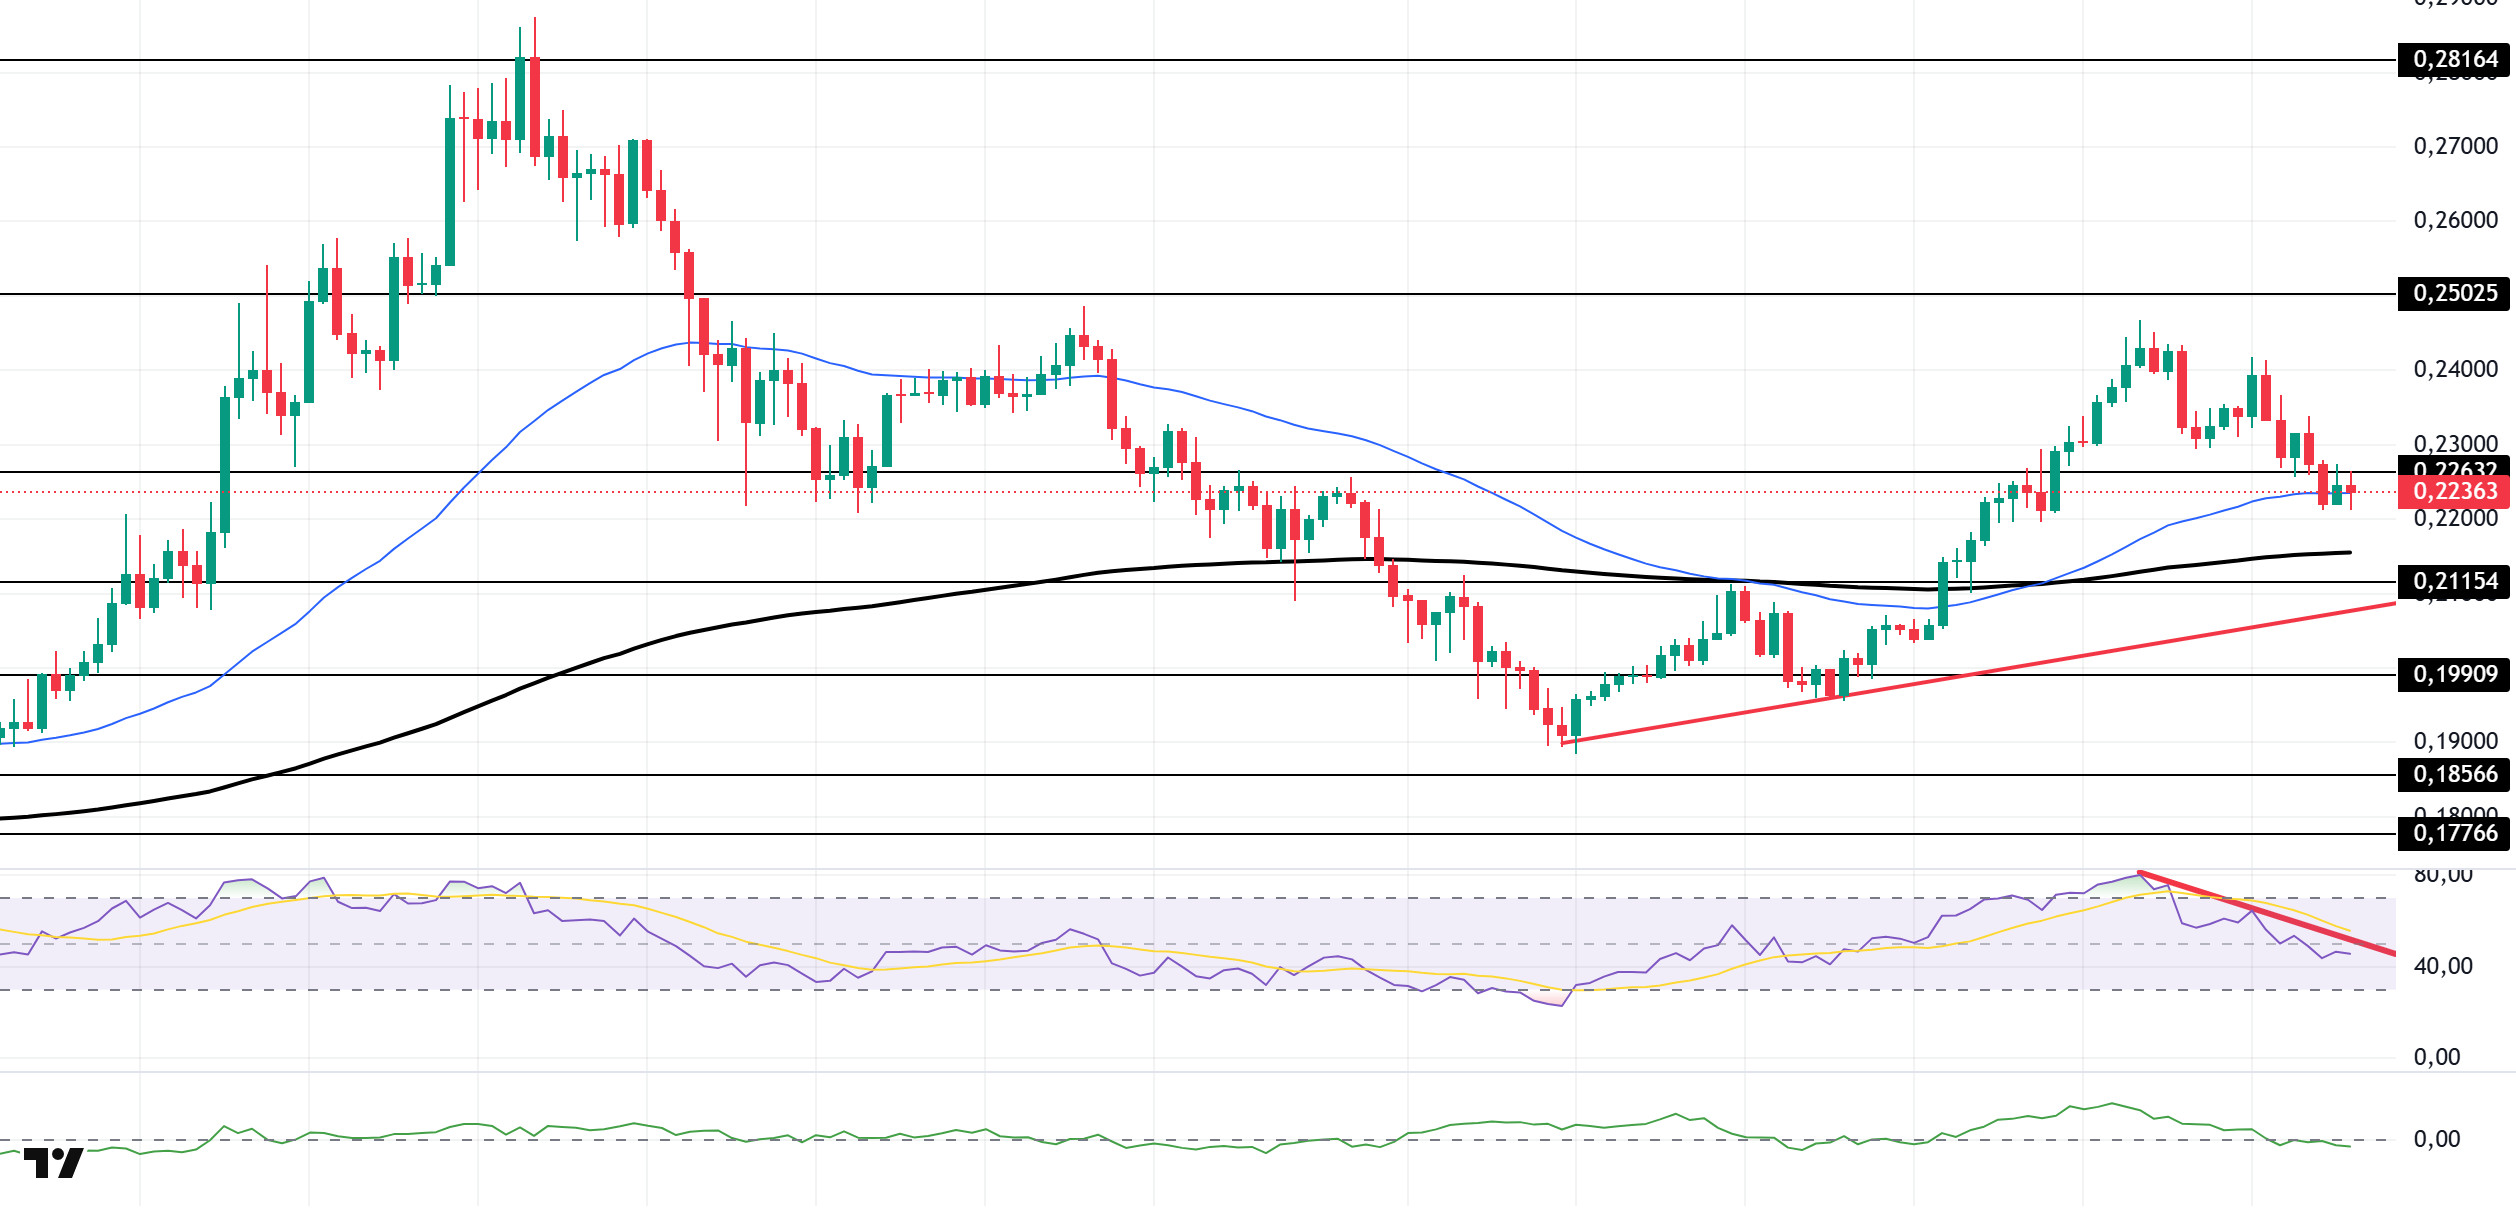
The DOGE price continued to experience a pullback. The asset remained above the upward trend that began on August 2. However, the price broke below the strong support level at $0.22632 and continued its decline, currently testing the 50 EMA (Blue Line) moving average as support. If the price closes below the 50 EMA, the 200 EMA (Black Line) moving average can be monitored as support.
On the 4-hour chart, the 50 EMA (Blue Line) remains above the 200 EMA (Black Line). This indicates that the asset is in an upward trend in the medium term. The price being above both moving averages also indicates that the asset is in an upward trend in the short term. Chaikin Money Flow (CMF-20) remains in the negative zone. Additionally, negative cash inflows could push the CMF further into the negative zone. The Relative Strength Index (RSI-14) is at a neutral level. At the same time, the indicator, which began to fall below the downward trend that started on August 9, signaled that selling pressure could continue. In the event of an upward movement driven by political developments, macroeconomic data, or positive news flow in the DOGE ecosystem, the $0.25025 level stands out as a strong resistance zone. In the opposite scenario or in the event of negative news flow, the 0.21154 dollar level could be triggered. A decline to these levels could lead to increased momentum, potentially initiating a new upward wave.
Support levels: 0.21154 – 0.19909 – 0.18566
Resistances: 0.22632 – 0.25025 – 0.28164
SHIB/USDT
The Shibarium network has surpassed the 1.5 billion transaction milestone, reaching an important milestone. In response to increasing demand, the development team updated Shibarium’s documentation portal and launched the “High Five” initiative, aiming to grow the ecosystem in decentralized applications, games, and community-focused use cases. The SHIB token burn rate saw a sudden increase of 158%, but the total weekly burn volume remained 97% lower.
The LEASH token supply unexpectedly increased by nearly 10%. This was attributed to the reactivation of the rebase mechanism, which was previously believed to be inactive. Two options were presented to the community for a solution. Either completely disabling rebase in the current contract or transitioning to a “LEASH v2” smart contract without the rebase feature. Additionally, the proposal by project leader Shytoshi Kusama to elect him as “SHIB President” sparked intense debate within the community. While some members emphasized the risk of centralization, Kusama argued that it aligns with the project’s vision.
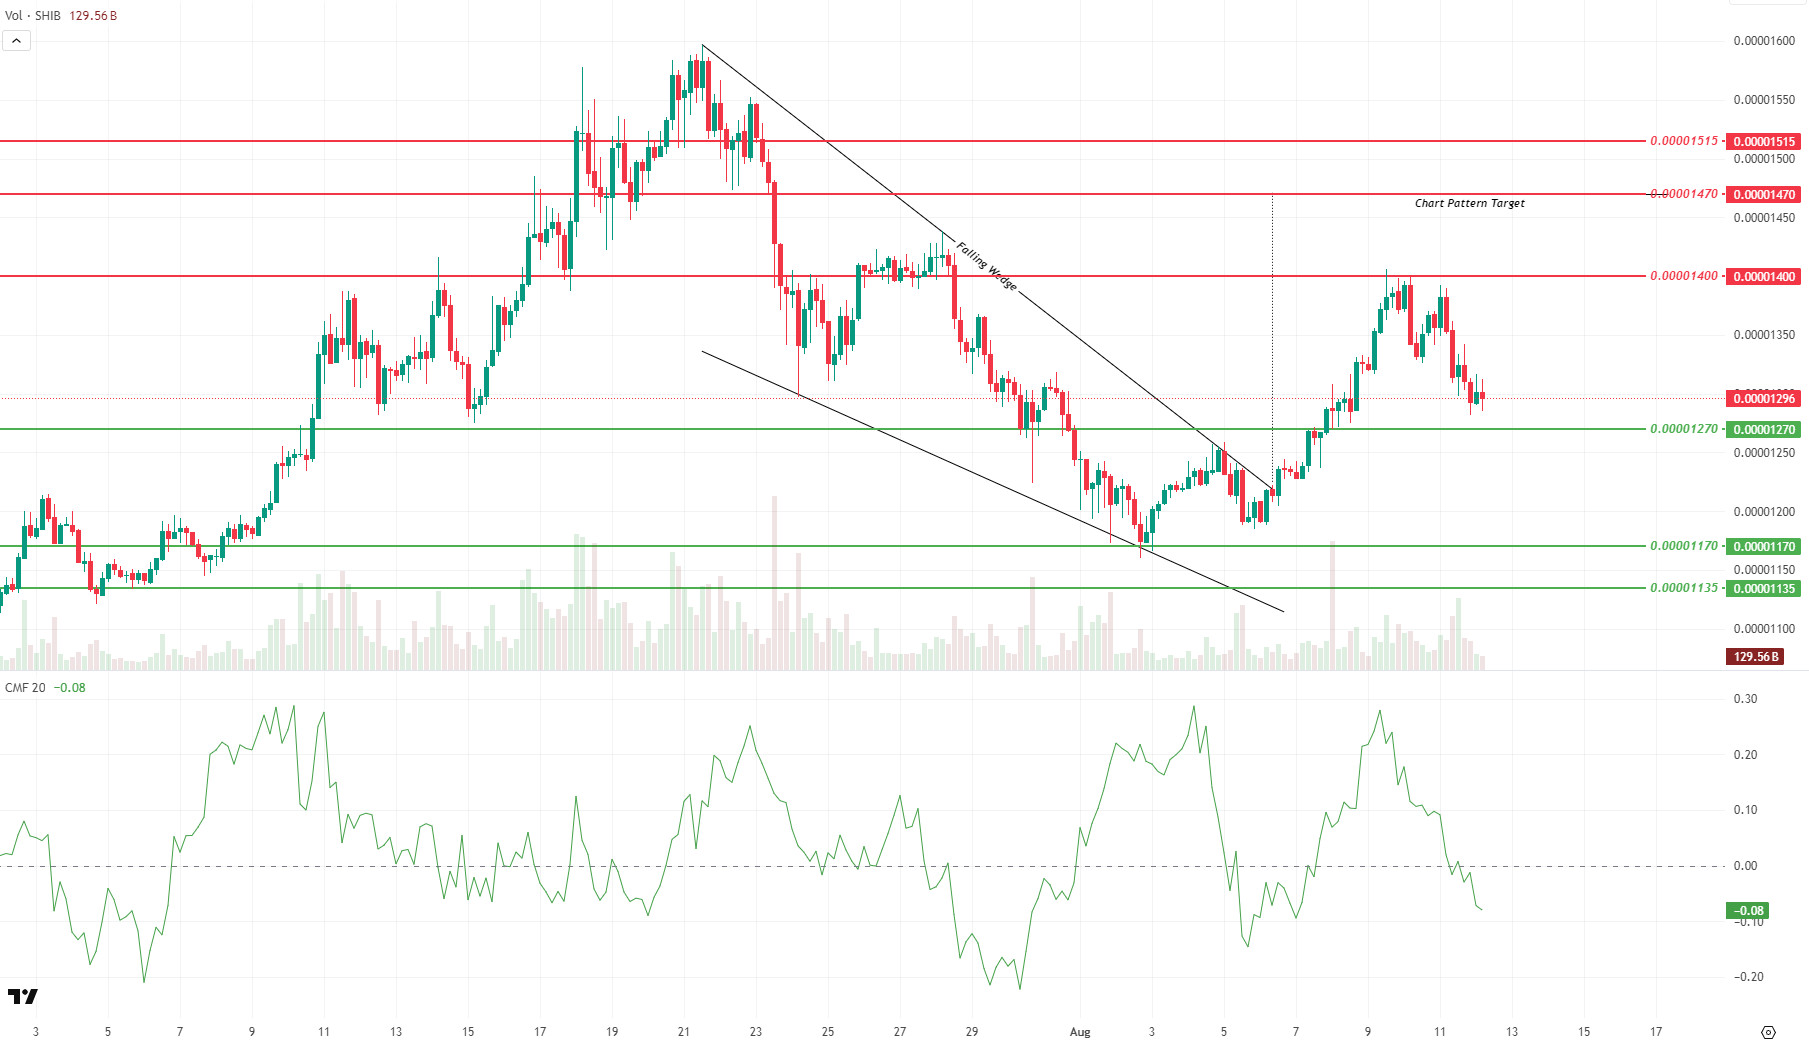
Shiba Inu prices have shown signs of weakness over the past two trading days, with buyers appearing less active and indicators indicating a noticeable slowdown. The decline in momentum, trading volume, and volatility confirms the decrease in buying appetite in the market. The price retreated from the resistance level of $0.00001400, dropping to $0.00001298. The Chaikin Money Flow (CMF) indicator’s movement in the negative zone indicates that capital flow is concentrated on the selling side.
For the upward movement that began after the breakout of the Falling Wedge formation formed on July 21 on August 6 to reach the formation target of $0.00001470, a significant increase in trading volume is required. The $0.00001270 level is the most critical support level in the short term. Below this level, support levels are at 0.00001170 and 0.00001135 dollars. For an upward recovery, the price must first rise above 0.00001330 dollars and then break through the 0.00001390–0.00001400 range.
Support levels: 0.00001270 – 0.00001170 – 0.00001135
Resistance levels: 0.00001400 – 0.00001470 – 0.00001515
ADA/USDT
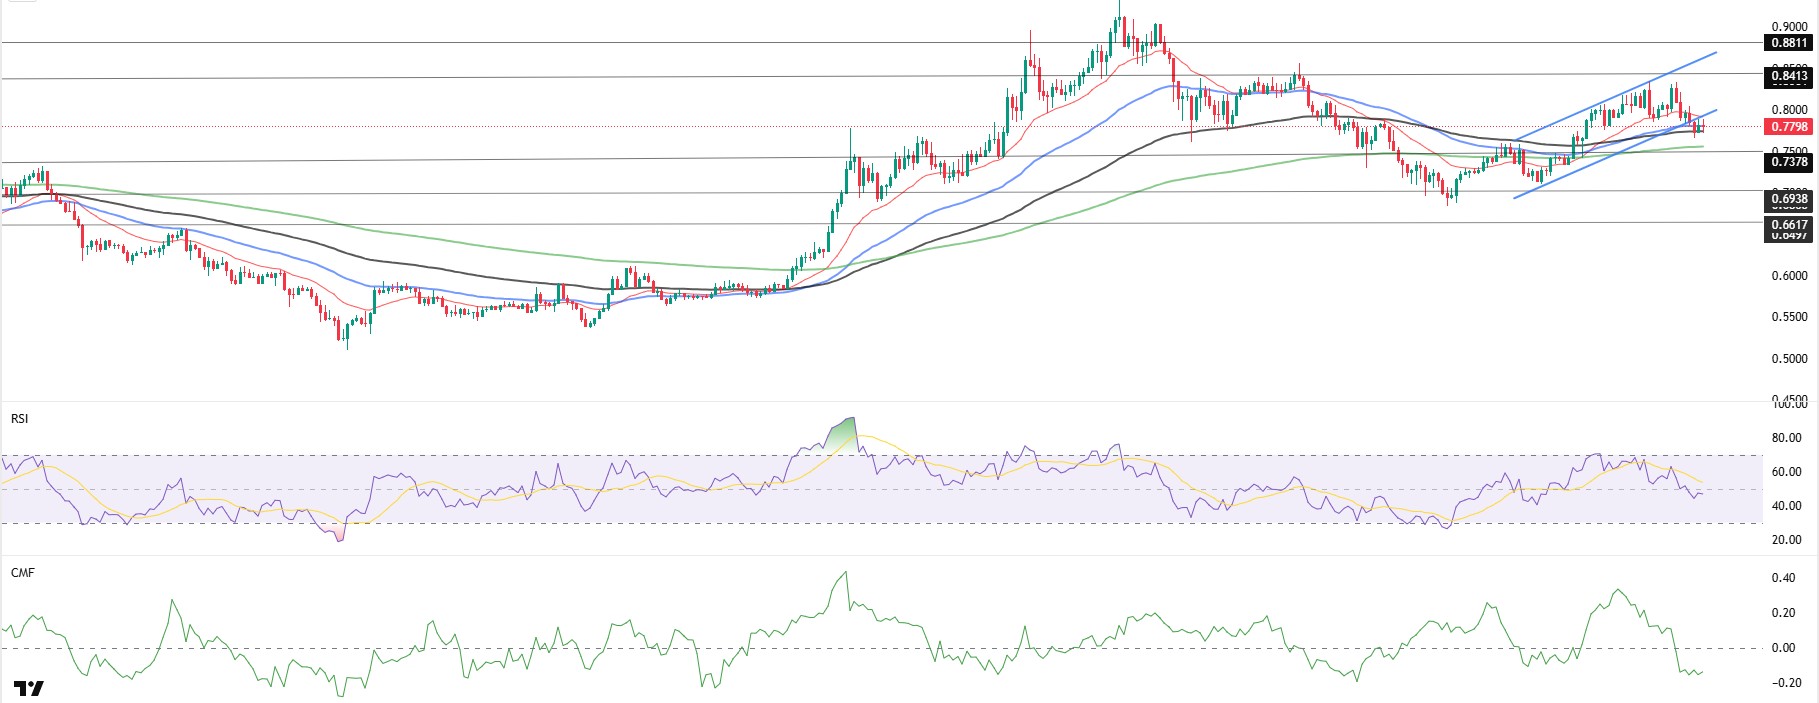
ADA broke out of the rising channel amid selling pressure on cryptocurrencies late last night, causing the price to gradually drop to 0.7818. While there were no developments that could directly affect the price throughout the day, investors appear to be focusing on technical levels.
The price is preparing to form a death cross by falling below the 50 and 100-day Exponential Moving Average (EMA-Blue Line) and (EMA-Black Line) on the 4-hour chart. If the price rises during the day and re-enters the rising channel band, the resistance level of 0.8413 will be the important level to watch. This situation may indicate that the upward trend could continue in the medium term. The narrowing of volatility confirms that the market is cautious and in a wait-and-see mode in the short term. If the price falls below all moving averages during the day, it may indicate that the downward trend could continue. The Relative Strength Index (RSI-14) has dropped to 49 levels, signaling a downtrend alongside the Chaikin Money Flow (CMF-20). A decrease in capital inflows could keep the CMF in the negative zone and indicate that selling pressure may continue.
In the event of an uptrend driven by positive macroeconomic data or news related to the Cardano ecosystem, the 0.8811 dollar level emerges as a strong resistance point. If this level is broken to the upside, the uptrend is expected to continue. In the event of a pullback due to adverse developments or profit-taking, the 0.7378 dollar level could be tested. A decline to these support levels could see an increase in buying momentum, potentially presenting an opportunity for an upward move.
Support levels: 0.7378 – 0.6938 – 0.6617
Resistance levels: 0.8413 – 0.8811 – 0.9038
Legal Notice
The investment information, comments, and recommendations contained herein do not constitute investment advice. Investment advisory services are provided individually by authorized institutions taking into account the risk and return preferences of individuals. The comments and recommendations contained herein are of a general nature. These recommendations may not be suitable for your financial situation and risk and return preferences. Therefore, making an investment decision based solely on the information contained herein may not produce results in line with your expectations.