
Technical Analysis
BTC/USDT
Blockchain security firm Cyvers detected that approximately $48 million worth of crypto assets were transferred unusually across different networks from BtcTurk. The exchange announced that it has temporarily suspended deposit and withdrawal transactions and that users will not be affected. In the US, the July Producer Price Index rose 3.3% year-on-year, reaching its highest level in three years. The core CPI rose by 0.6% month-on-month and 2.8% year-on-year. U.S. Treasury Secretary Bessent stated that the sale of Bitcoin assets worth approximately 15–20 billion dollars would be suspended and that BTC would continue to be held as a store of value. Today, statements regarding “Project Crypto” will be made by SEC Chairman Paul Atkins during a program he will attend.
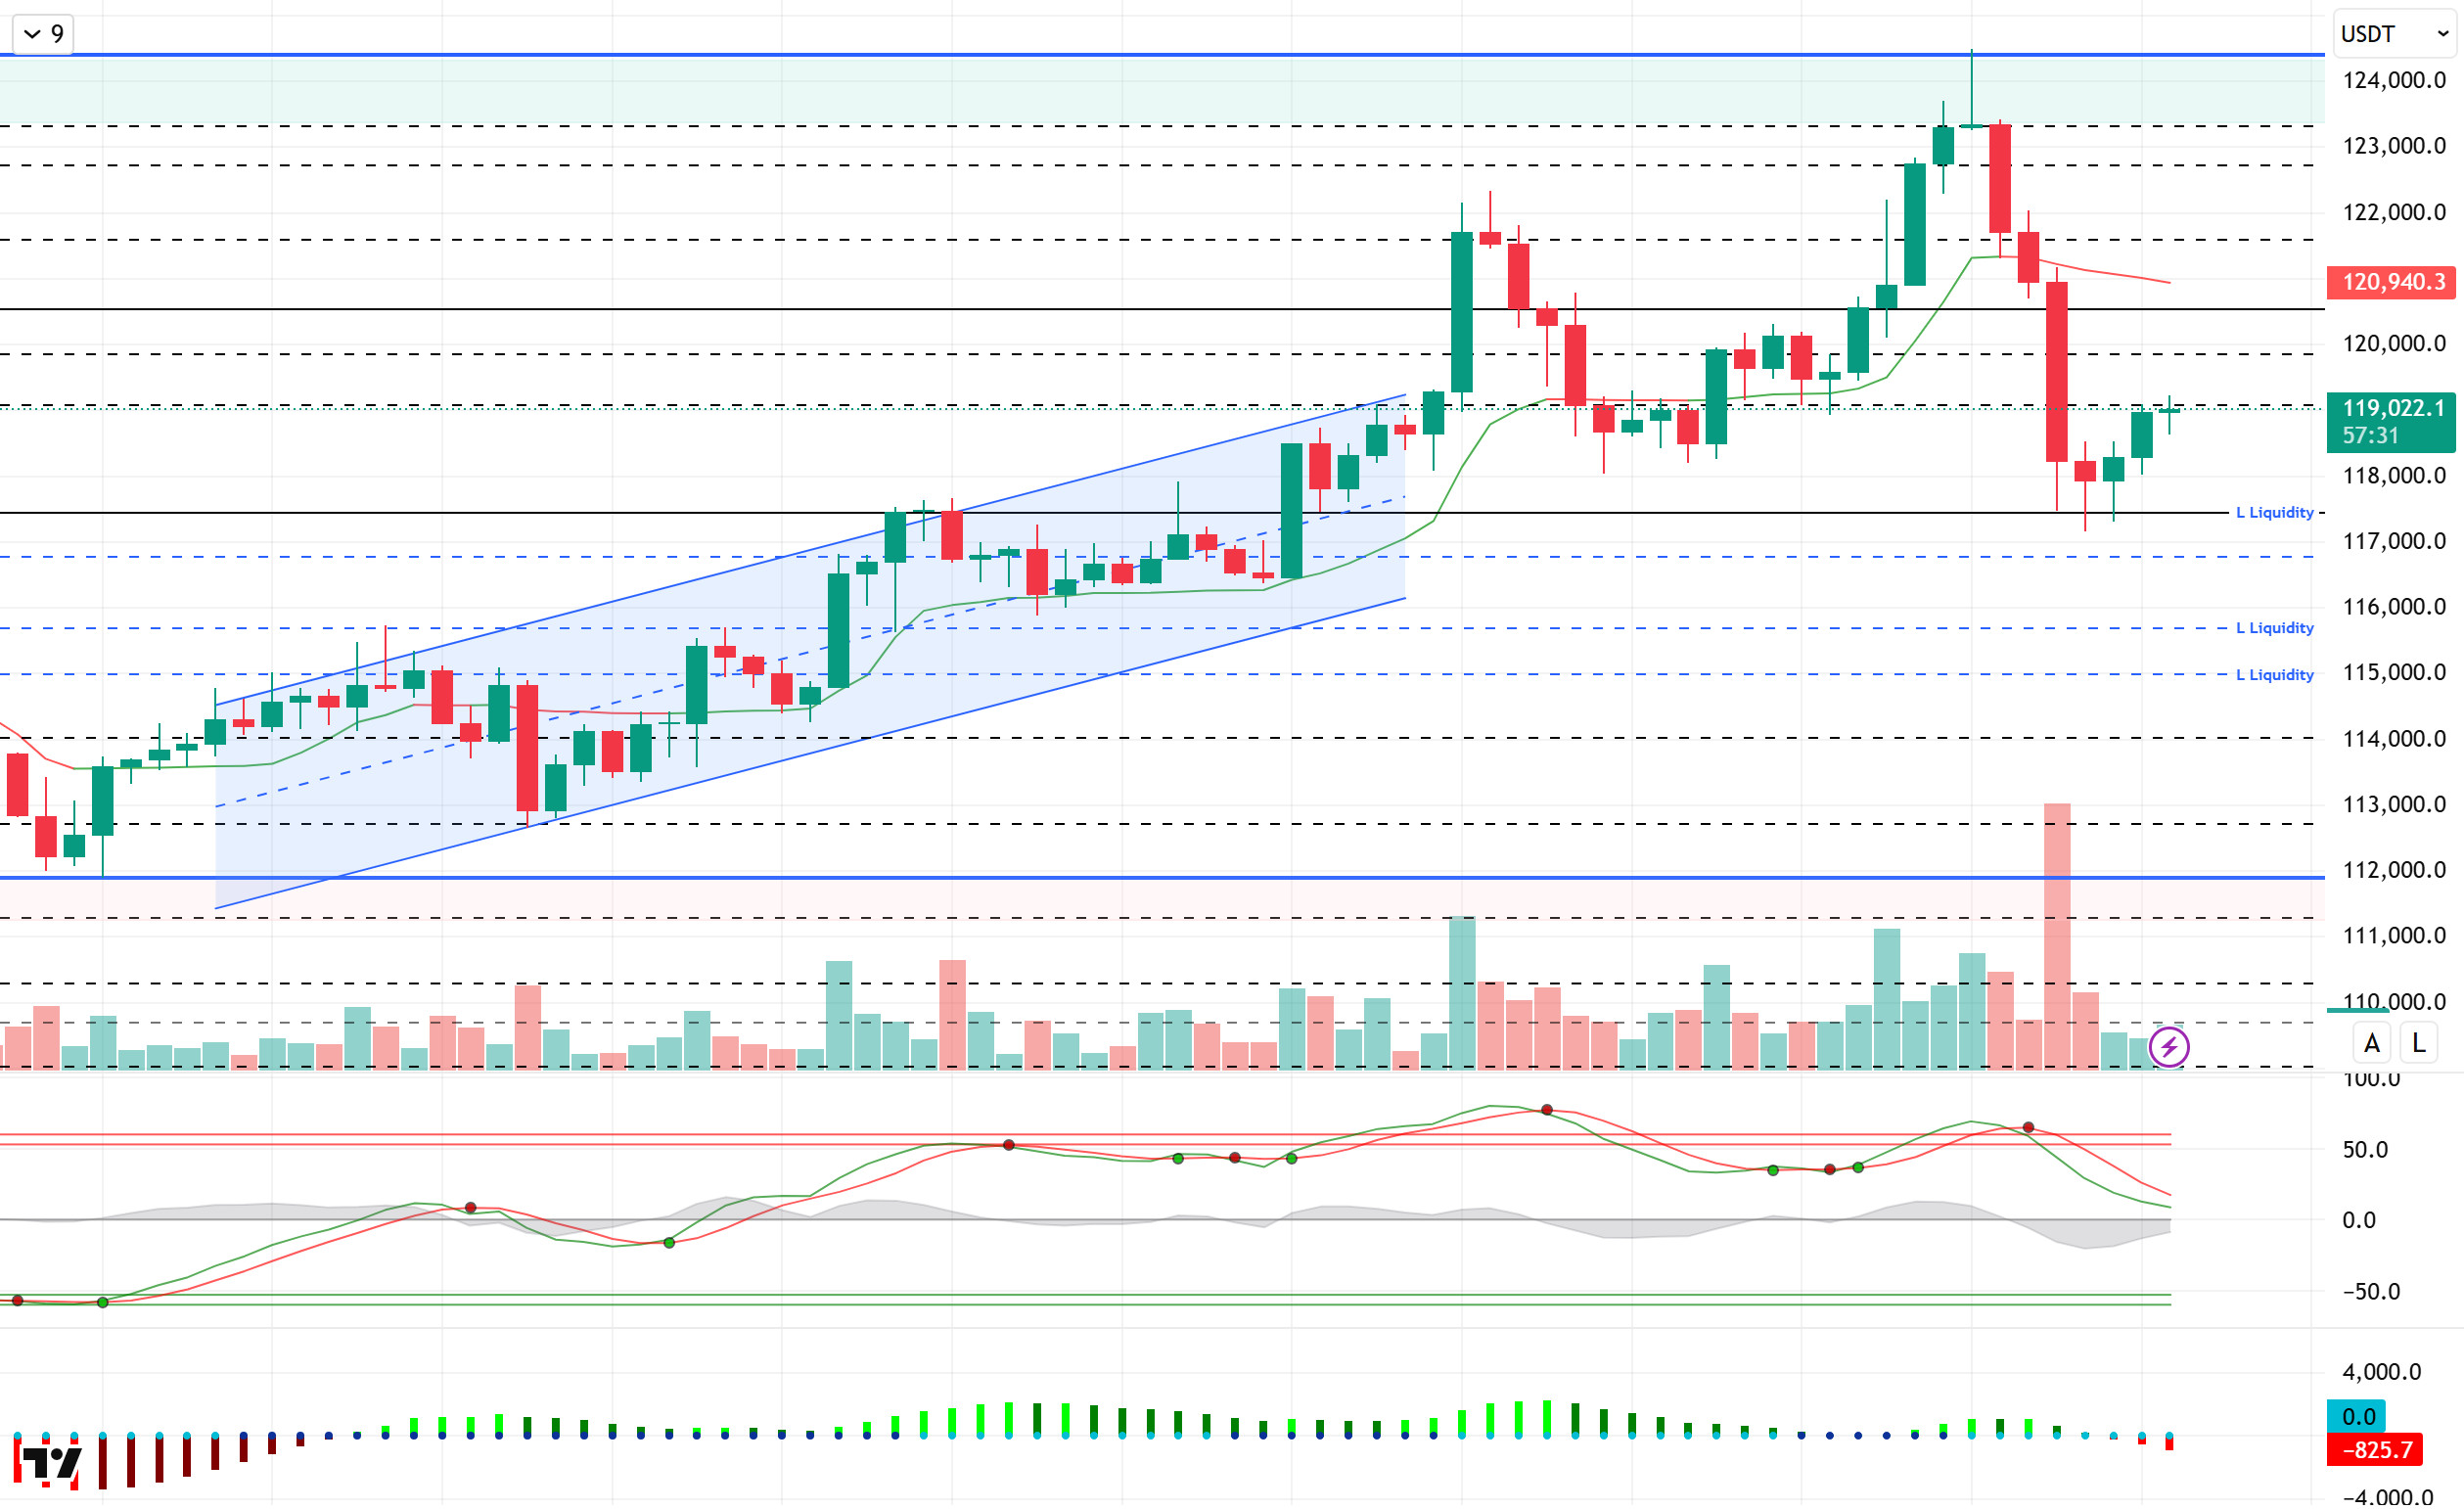
Looking at the technical picture, BTC, which was moving around 121,000 in the previous analysis, fell to 117,400 with a sharp pullback. The price, which recorded high volatility, rose above the 119,000 level with the reaction it received from this region. Then, facing selling pressure again, BTC tested the 117,200 level. Repeating the same movement once more, the price is trading at the 119,100 level at the time of writing this analysis.
Technical indicators show that while the Wave Trend oscillator (WT) has turned downward with a trend reversal in the overbought zone, it has weakened without approaching the middle band of the channel. The Squeeze Momentum (SM) indicator’s histogram has been in the positive zone since the beginning of the month, but it moved into the negative zone with yesterday’s decline. The Kaufman moving average is currently trading above the price at the 120,900 level.
Looking at liquidity data, we noted that short-term sell positions reappeared at 119,300 and 119,700, while buy positions continued to show aggressive concentration at 117,000 and 115,000. Indeed, the price retreating to the 117,200 level forced some positions to liquidate and others to close due to a Long Squeeze. However, the 115,000 level continues to remain a dense accumulation zone.
In summary, the disappearance of the recent optimistic mood due to fundamental developments, the US Treasury’s announcement that it will use BTC as a store of value, a hack attack on a local exchange, and the increase in US CPI data have created strong selling pressure on the price. Technically, indicators reaching saturation points and increasing buy positions in liquidity data have contributed to volatility, causing the price to decline from its new all-time high (ATH) of 124,000 to 117,200. After the recent decline, BTC is attempting to recover and is once again heading toward the 120,000 level. Breaking above this level is seen as crucial for the completion of selling pressure and regaining momentum. In the event of continued selling pressure, the 119,000 support area comes into focus, and a break below this level would target the 117,300 level once again.
Support levels: 120,000 – 121,500 – 122,700
Resistance levels: 119,000 – 117,300 – 115,000
ETH/USDT
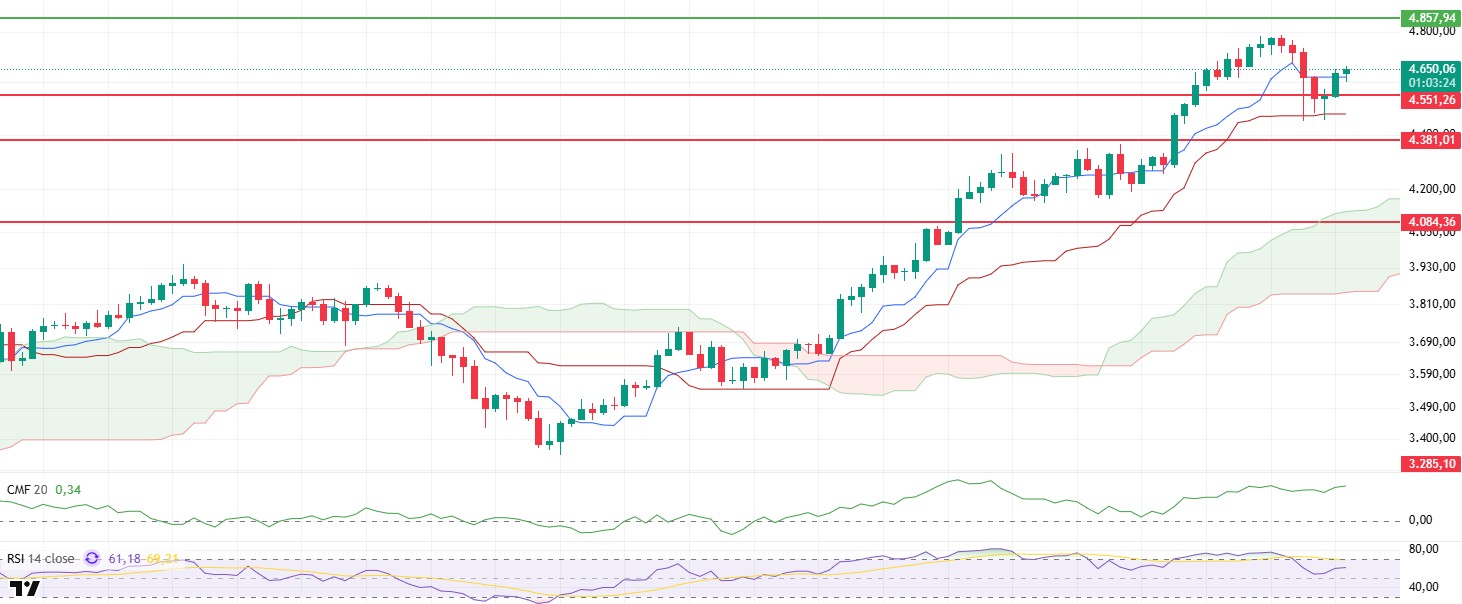
The ETH price dropped below the 4,550 dollar support level yesterday with sharp sell-offs and fell to 4,450 dollars. Overnight buying in this region pushed the price back up, breaking above the tenkan level of $4,619. This movement indicates that short-term selling pressure has weakened and the market is showing signs of recovery. The price holding above the tenkan in the Ichimoku indicator is an important technical signal suggesting that upward momentum could be maintained.
On-chain data also clearly reflects this recovery. Open interest, which had dropped to $31.60 billion yesterday, rose to $32.8 billion as the price turned upward. This increase indicates that the appetite for leveraged positions is returning to the market. Cumulative Volume Delta (CVD) data shows that the rise is not only driven by short position closures but is also supported by strong buying from spot markets. This simultaneous positive trend in spot and futures markets highlights the solid demand base behind the upward movement.
The Chaikin Money Flow (CMF) indicator also remained in positive territory during the decline and continued its upward movement. This indicates that the net cash flow into the market is strong and that investors are viewing the declines as buying opportunities. As long as liquidity inflows continue, the price will have an advantage in terms of both speed and sustainability in its upward moves.
In the daily scenario, the 4,619 dollar level is the first critical threshold. As long as the price stays above this level, a gradual upward movement is possible. However, if it falls below 4,619, a pullback to the 4,550 dollar region is possible, and if this support fails, a decline to 4,450 dollars could come into play. Both the technical outlook and on-chain data currently indicate that buyers are in control.
Top of Form
Below the Form
Support levels: 4,550 – 4,381 – 4,084
Resistance levels: 4,857 – 5,000 – 5,350
XRP/USDT
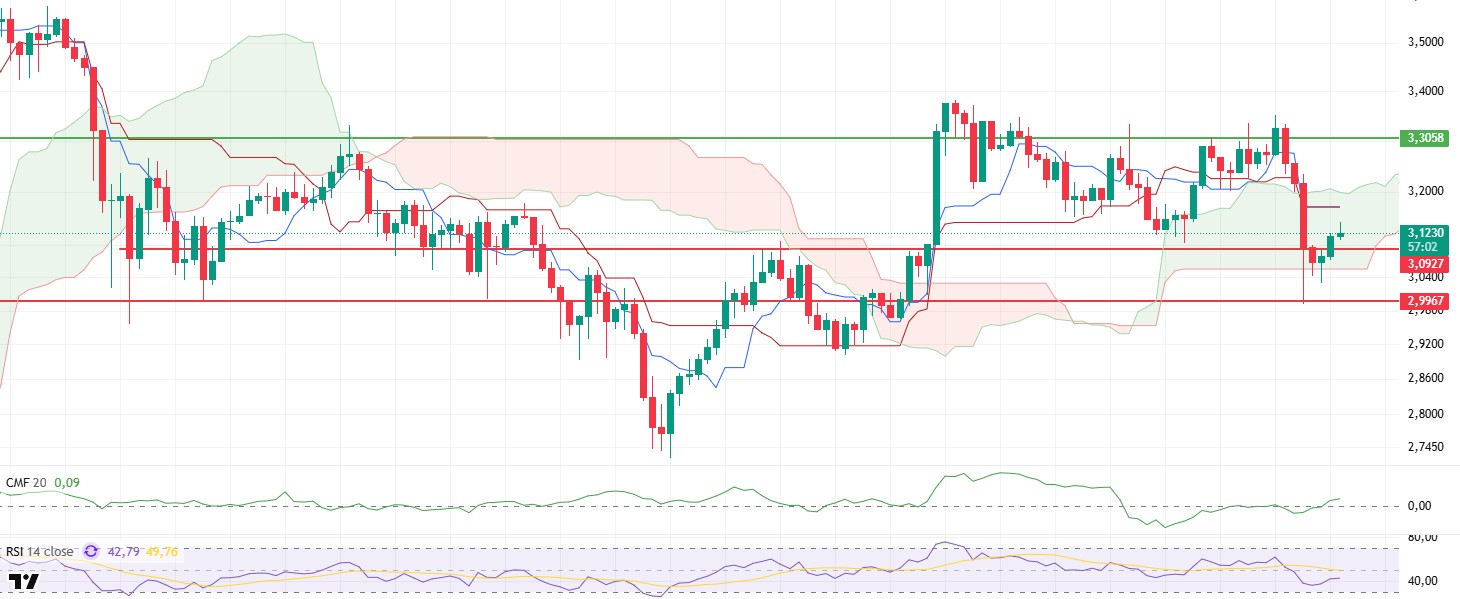
XRP fell to the main support level of $2.99 yesterday due to selling pressure, but recovered with buying at this level and settled back above $3.09. The price holding in this region is critical for the short-term outlook, while the technical structure seen in the Ichimoku indicator still contains some risk factors. The price briefly dipped below the kumo cloud during the day and traded below both the kijun and tenkan levels, indicating that buyers have not yet fully taken control and that the upward movement has not yet gained full momentum.
On the other hand, the Chaikin Money Flow (CMF) indicator, which moved back into positive territory immediately after the decline, indicates an increase in net liquidity inflows into the market. This reflects that investors are viewing the low price levels as a buying opportunity and that short-term upside expectations are strengthening.
On the Relative Strength Index (RSI) front, while the level remains below 50, the indicator’s upward momentum suggests that a structural foundation supporting price increases is beginning to form. This trend in the RSI could pave the way for accelerated momentum if prices break above critical resistance levels.
In the intraday scenario, the $3.09 level is the first key support. As long as this level holds, the price is expected to continue its upward movement gradually. However, closes below $3.09 could lead to a retest of the $2.99 support and, depending on the strength of the buying reaction in this area, the risk of a deeper pullback could come to the fore. Overall, technical indicators and liquidity flows suggest that short-term risks have not completely subsided, but buying appetite is gradually improving.
Supports: 3.0927 – 2.9967 – 2.7355
Resistances: 3.3058 – 3.6554 – 4.0055
SOL/USDT
The SEC has delayed four Solana ETF applications submitted by Bitwise, 21Shares, Canary Capital, and Marinade Finance.
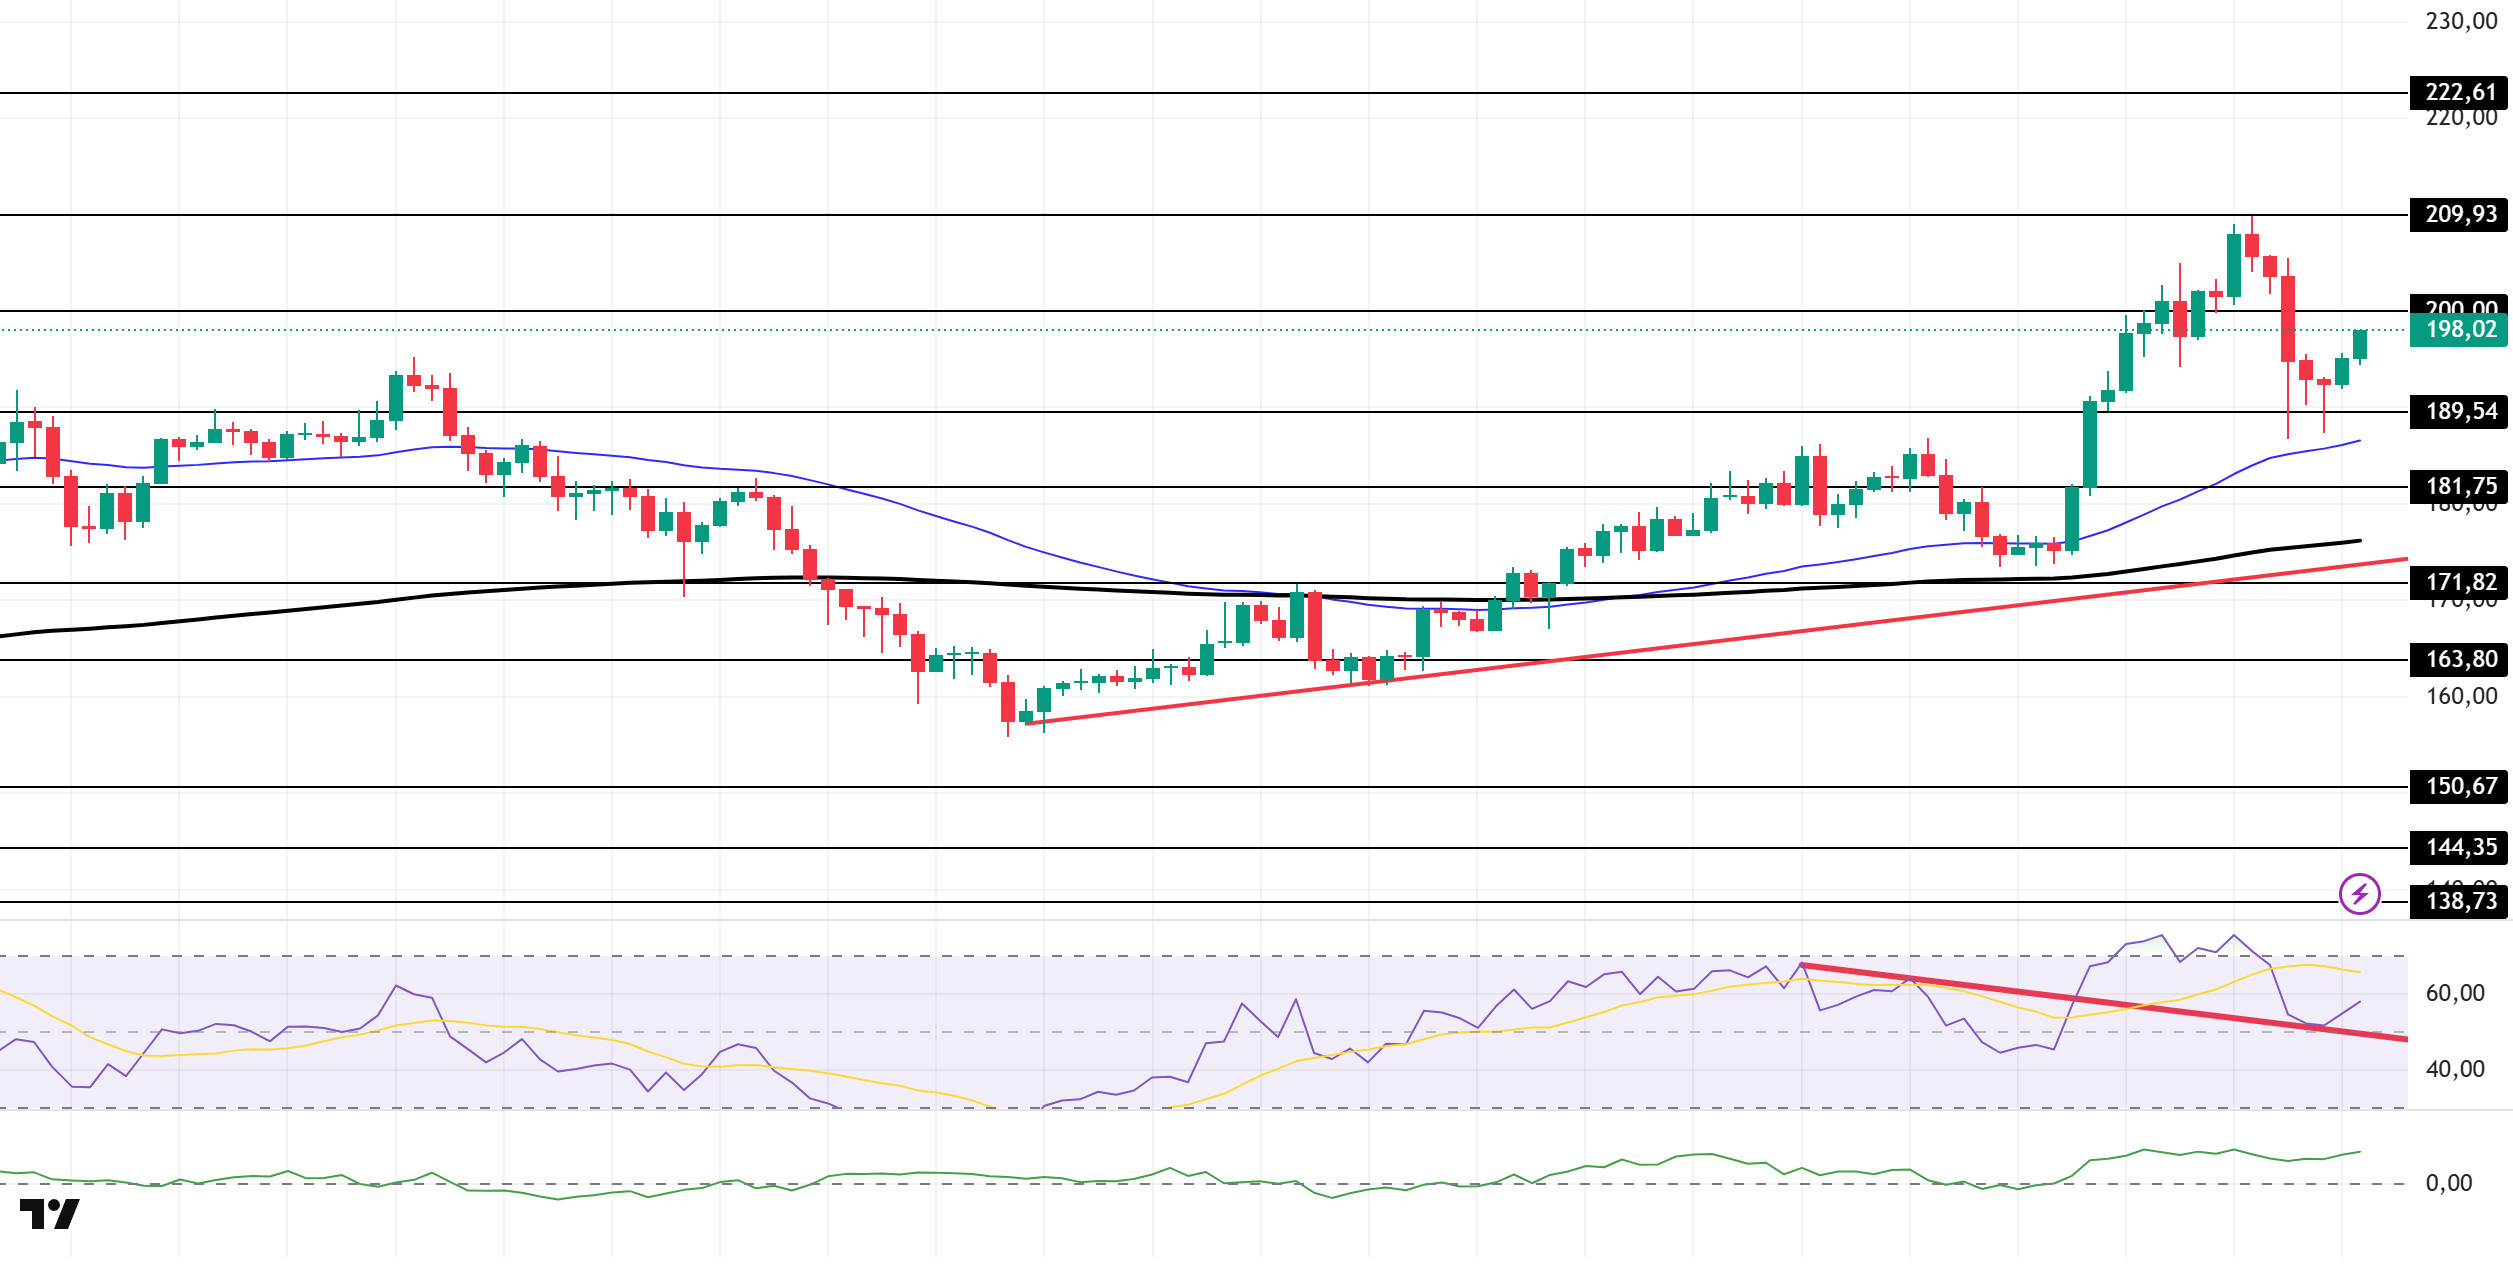
The SOL price continues to experience a pullback. The asset remained above the upward trend line that began on August 2 but fell below the strong and psychological resistance level of $200.00. The price, supported by the strong support zone at $189.54 and the 50 EMA (Blue Line) moving average, showed a slight increase. As of now, if the price manages to hold above these levels, it could test the 200.00 dollar level as resistance in the event of a continued upward movement. Otherwise, the 50 EMA moving average should be monitored.
On the 4-hour chart, the 50 EMA (Blue Line) remains above the 200 EMA (Black Line). This indicates that the upward trend may continue in the medium term. Additionally, the price being above both moving averages suggests that the market is in an upward trend in the short term. Chaikin Money Flow (CMF-20) is in the upper levels of the positive zone. However, an increase in money inflows could push the CMF to the upper levels of the positive zone. The Relative Strength Index (RSI-14) continues to remain above the downward trend that began on August 10. The indicator, which tested this trend as support, has started to rise again. This indicates that buying pressure is continuing. If there is an upward movement due to macroeconomic data or positive news related to the Solana ecosystem, the $200.00 level stands out as a strong resistance point. If this level is broken upward, the upward movement is expected to continue. In the event of a pullback due to adverse developments or profit-taking, the 181.75 dollar level could be tested. A decline to these support levels could see an increase in buying momentum, potentially presenting an opportunity for an upward move.
Support levels: 189.54 – 181.75 – 171.82
Resistance levels: 200.00 – 209.93 – 222.61
DOGE/USDT
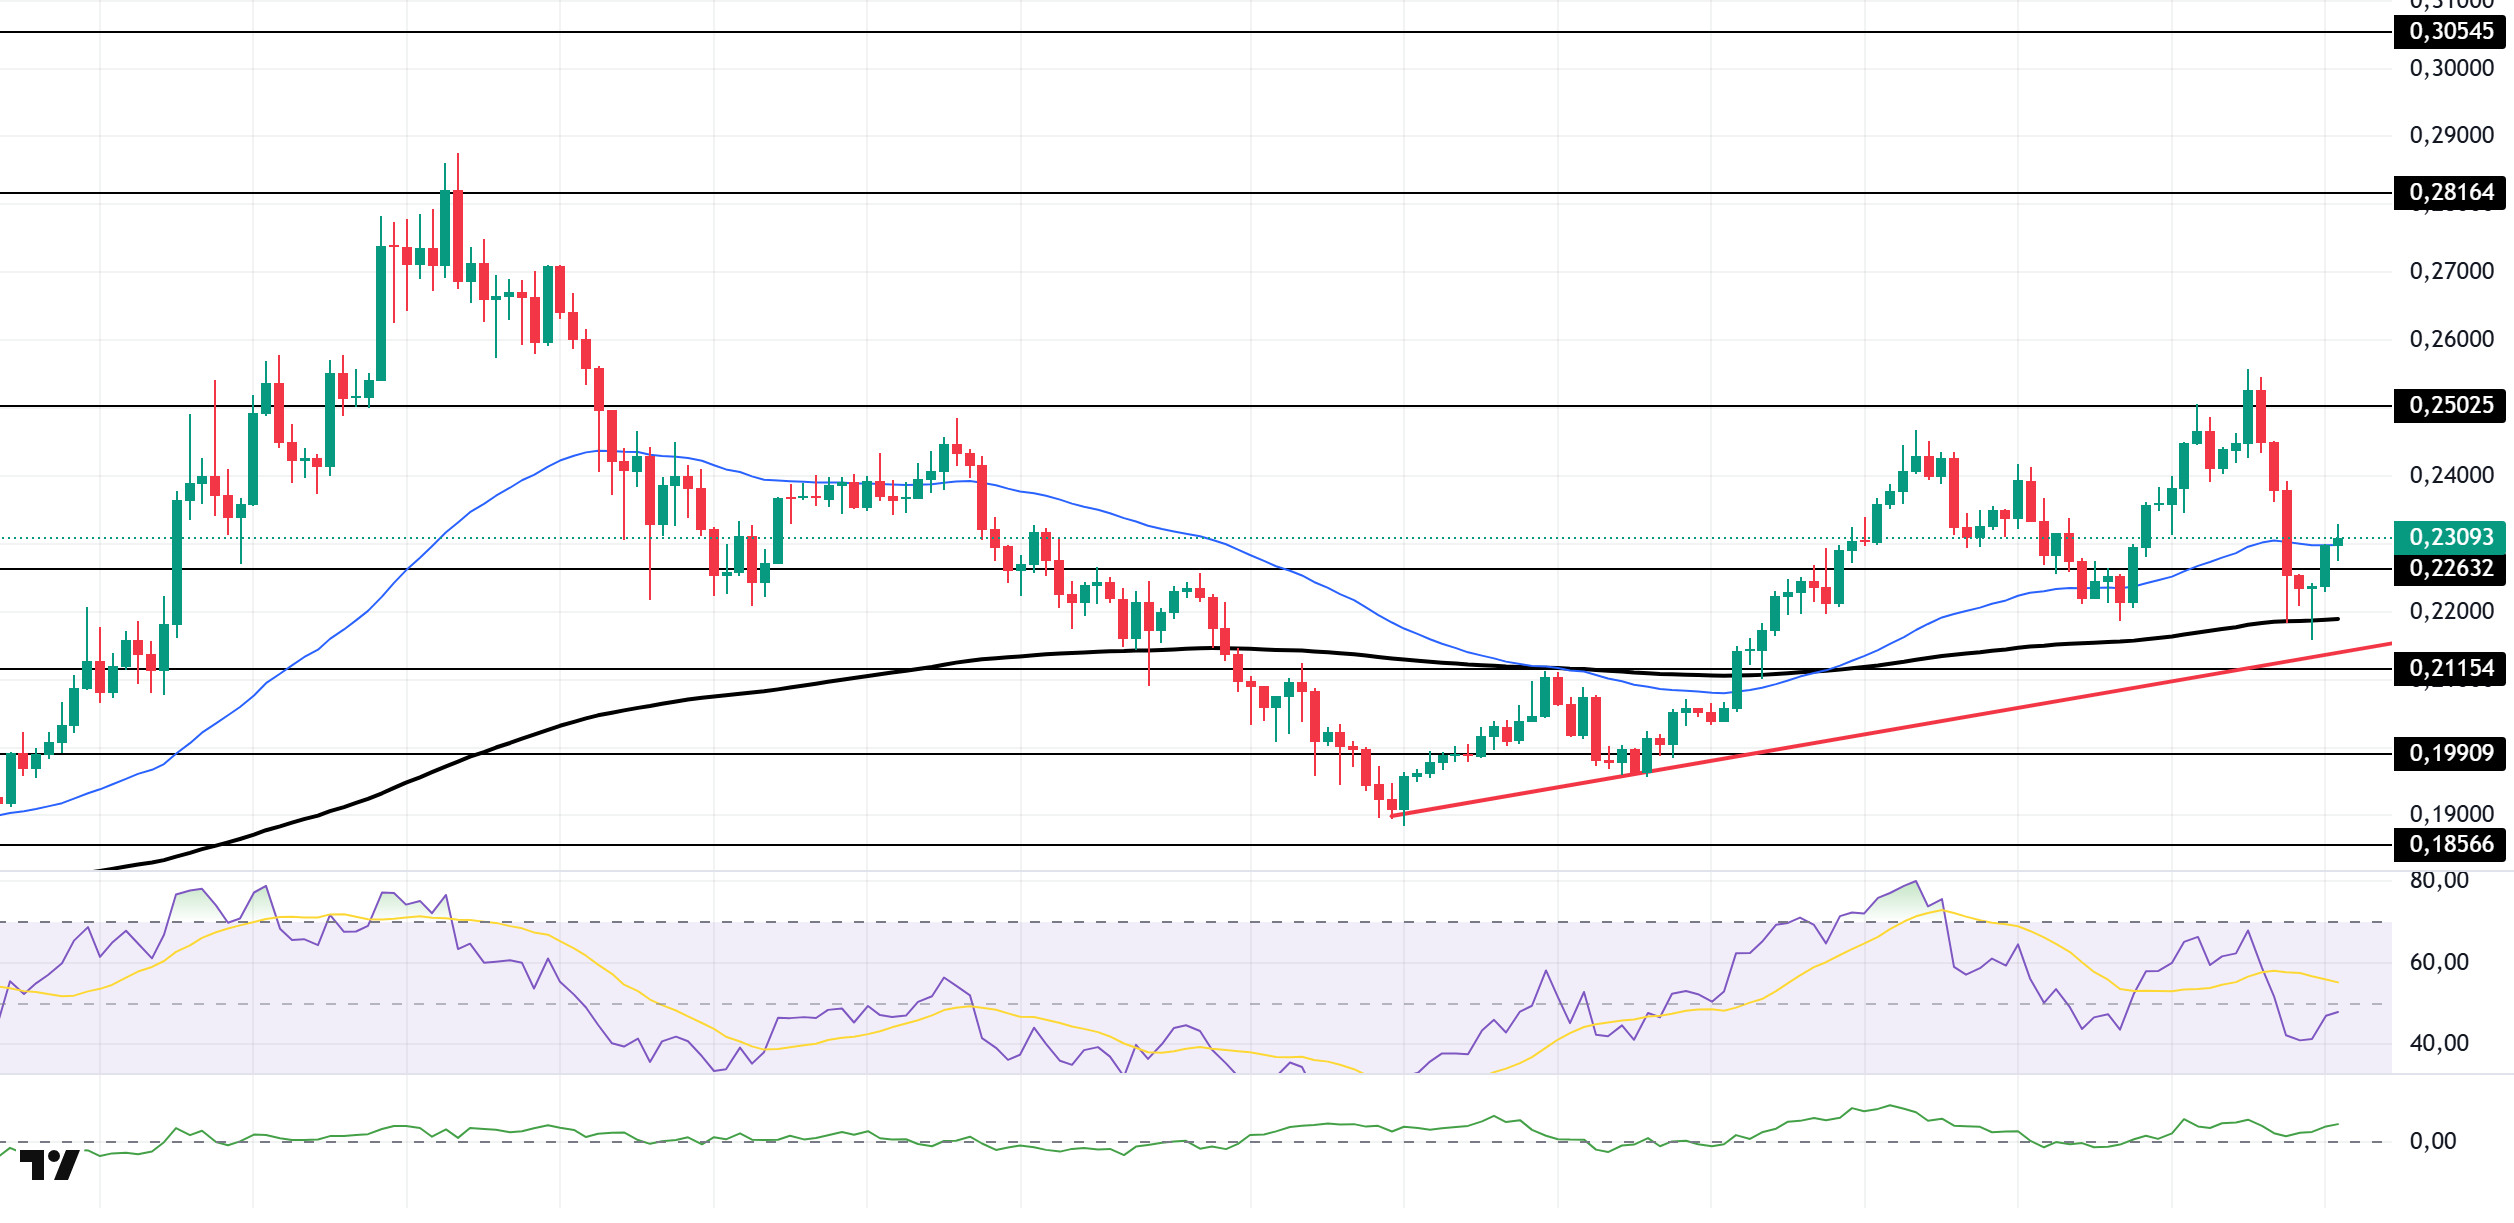
The DOGE price continued to experience a pullback. The asset remains above the upward trend that began on August 2. As of now, the price is testing the 50 EMA (Blue Line) moving average as resistance. If it closes above this level, it could test the 0.25025 dollar level. If the pullback continues, the 200 EMA (Black Line) moving average should be monitored.
On the 4-hour chart, the 50 EMA (blue line) remains above the 200 EMA (black line). This indicates that the asset is in an upward trend in the medium term. The price being between the two moving averages also indicates that the asset is in a decision-making phase in the short term. The Chaikin Money Flow (CMF-20) continues to accelerate in the positive zone. Additionally, negative cash inflows could push the CMF into the negative zone. The Relative Strength Index (RSI-14) has declined to the negative zone. In the event of potential upward movements driven by political developments, macroeconomic data, or positive news flow within the DOGE ecosystem, the $0.25025 level emerges as a strong resistance zone. In the opposite scenario or in the event of negative news flow, the 0.21154 dollar level could be triggered. A decline to these levels could increase momentum and potentially trigger a new upward wave.
Support levels: 0.22632 – 0.21154 – 0.19909
Resistance levels: 0.25025 – 0.28164 – 0.30545
SHIB/USDT
The headline making waves in the Shiba Inu ecosystem today is the urgent security warning issued by the SHIB team to the community. The team has identified a new scam tactic that has been on the rise in recent days. Malicious actors are impersonating major projects, including Shiba Inu, by reusing expired Discord invite links to create fake servers. Through these fake channels, they are stealing funds from SHIB investors by promising rewards or airdrops and asking them to share their wallet addresses. The SHIB team issued a strong warning not to use any links other than the official website and to verify invitations through verified social media channels. Additionally, Shibarium Trustwatch has cautioned the community against rushing to act on wallet links and dApp authorizations received via Discord links. It was emphasized that such awareness-raising steps continue to enhance ecosystem security and support Shibarium’s growth.
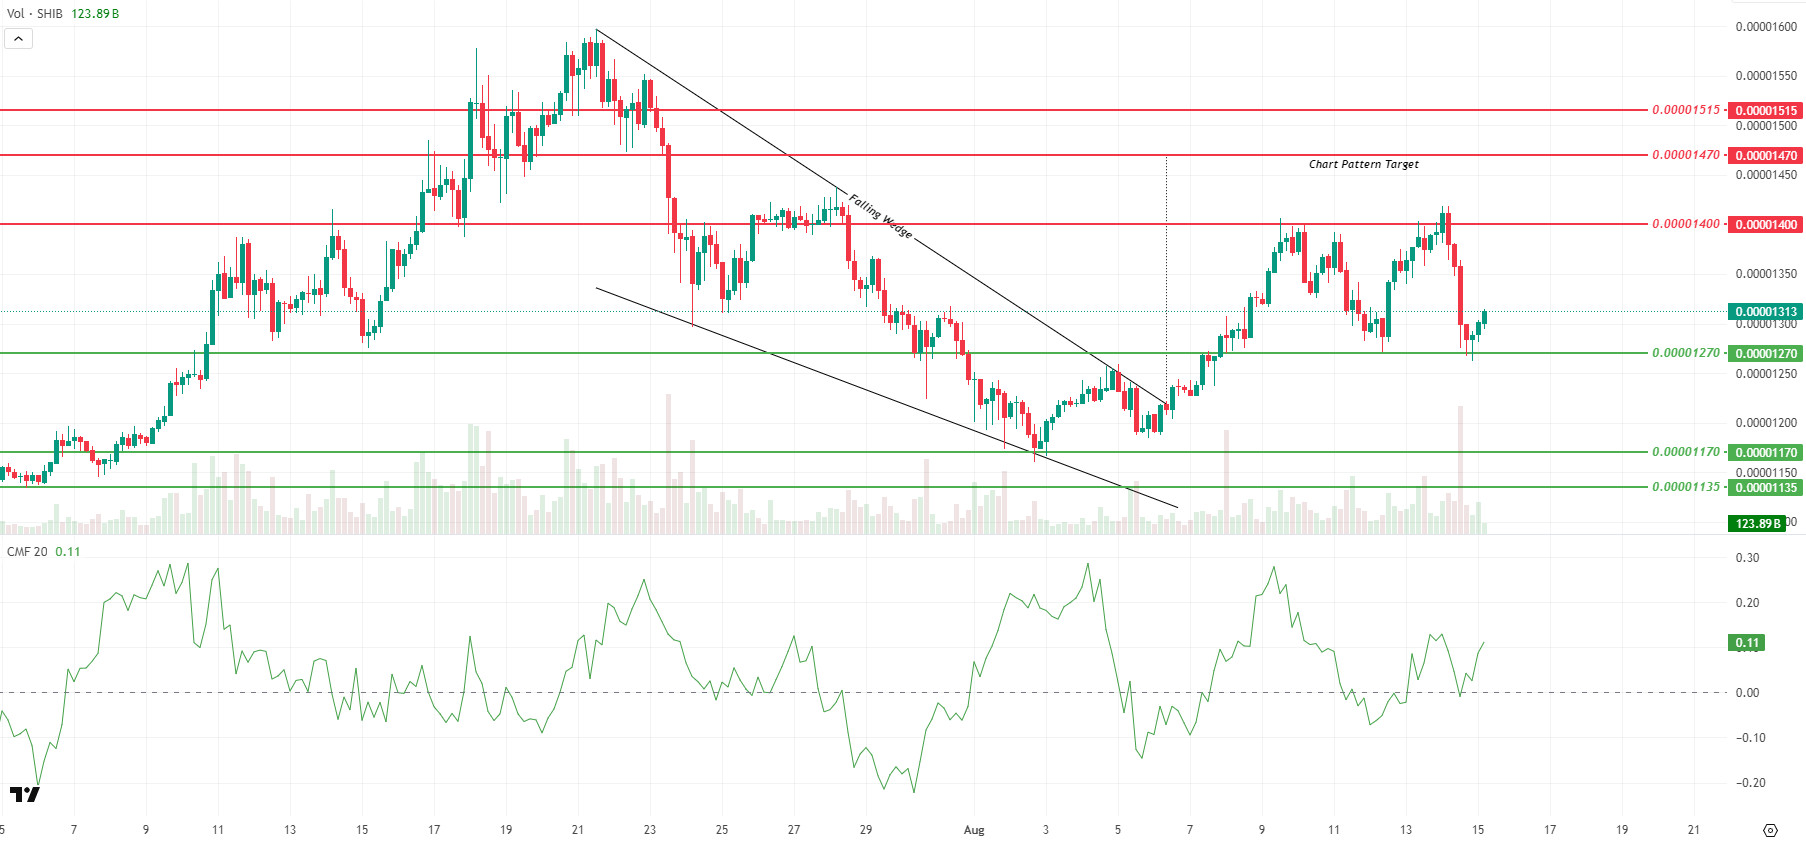
On the technical side, the price is attempting to recover from the $0.00001270 support level following yesterday’s sharp sell-off. SHIB, which was trading at $0.00001313 in the morning, may test the $0.00001350 level as an intermediate resistance in the short term. If this level is breached, the 0.00001400 dollar mark remains a critical resistance level. On the downside, the 0.00001270 dollar level continues to serve as the first key support, with closes below this level potentially bringing the 0.00001170 and 0.00001135 dollar support levels back into focus. While the recovery in trading volume indicates sustained buyer interest, a sustained move above 0.00001400 dollars is necessary for the upward movement to gain momentum.
The Chaikin Money Flow (CMF) indicator is at 0.11 in the positive zone, indicating that capital inflows have strengthened compared to yesterday’s weakness. The Falling Wedge formation that has been in place since July 21 remains valid. To reach the formation’s target of 0.00001470 dollars, strong volume support and the突破 of critical resistance levels are required.
Support levels: 0.00001270 – 0.00001170 – 0.00001135
Resistances: 0.00001400 – 0.00001470 – 0.00001515
LINK/USDT
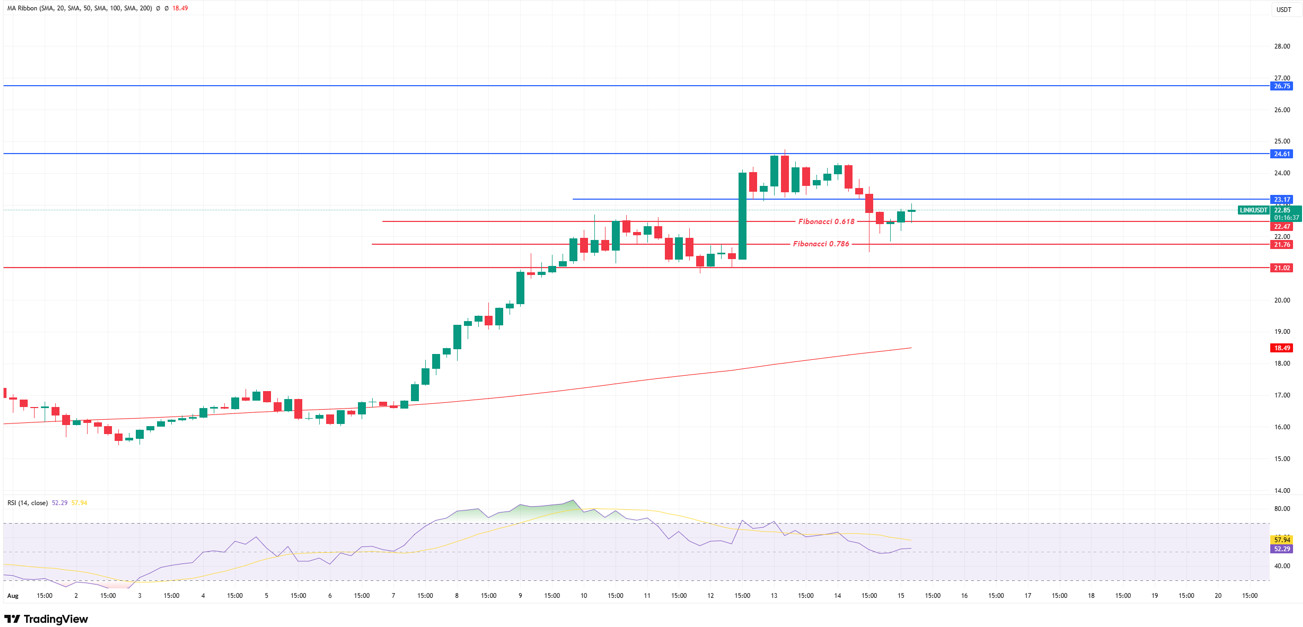
LINK is attempting a new upward movement after receiving a reaction from the Fibonacci 0.618–0.786 correction zone in the $22 range yesterday. We can interpret the fact that it did not close below the 0.786 zone as “a correction movement of the strong upward candle on August 12.” In the short term, the 23.17 dollar level stands out as an important intermediate resistance level. If the price breaks above this level, the 24.61 dollar resistance level may not be as strong as the 23.17 dollar level due to increasing momentum and could push the price to the 26.75 dollar level. However, as mentioned earlier, the 23.17 dollar level will be the most important resistance factor in determining the price’s direction.
In a downward scenario, the 22.47 dollar support level is a critical threshold. A daily close below this level could pull the price down to the Fibonacci 0.786 retracement level of 21.76. Losing the final support level at 21.02 would break the upward trend and increase the risk of a downward shift in the medium term.
On the momentum side, the Relative Strength Index (RSI) indicator is showing a flat pattern at 52–53 levels. While this indicates indecision in the short term, staying above the 50 level suggests that the price could continue its upward attempts. A rise in the RSI to the 57–60 band, especially if accompanied by sustained movement above 23.17, could pave the way for a strengthening of upward momentum.
Support levels: 22.47 – 21.76 – 21.02
Resistance levels: 23.17 – 26.61 – 26.75
Legal Notice
The investment information, comments, and recommendations contained herein do not constitute investment advice. Investment advisory services are provided individually by authorized institutions taking into account the risk and return preferences of individuals. The comments and recommendations contained herein are of a general nature. These recommendations may not be suitable for your financial situation and risk and return preferences. Therefore, making an investment decision based solely on the information contained herein may not produce results in line with your expectations.

