
Technical Analysis
BTC/USDT
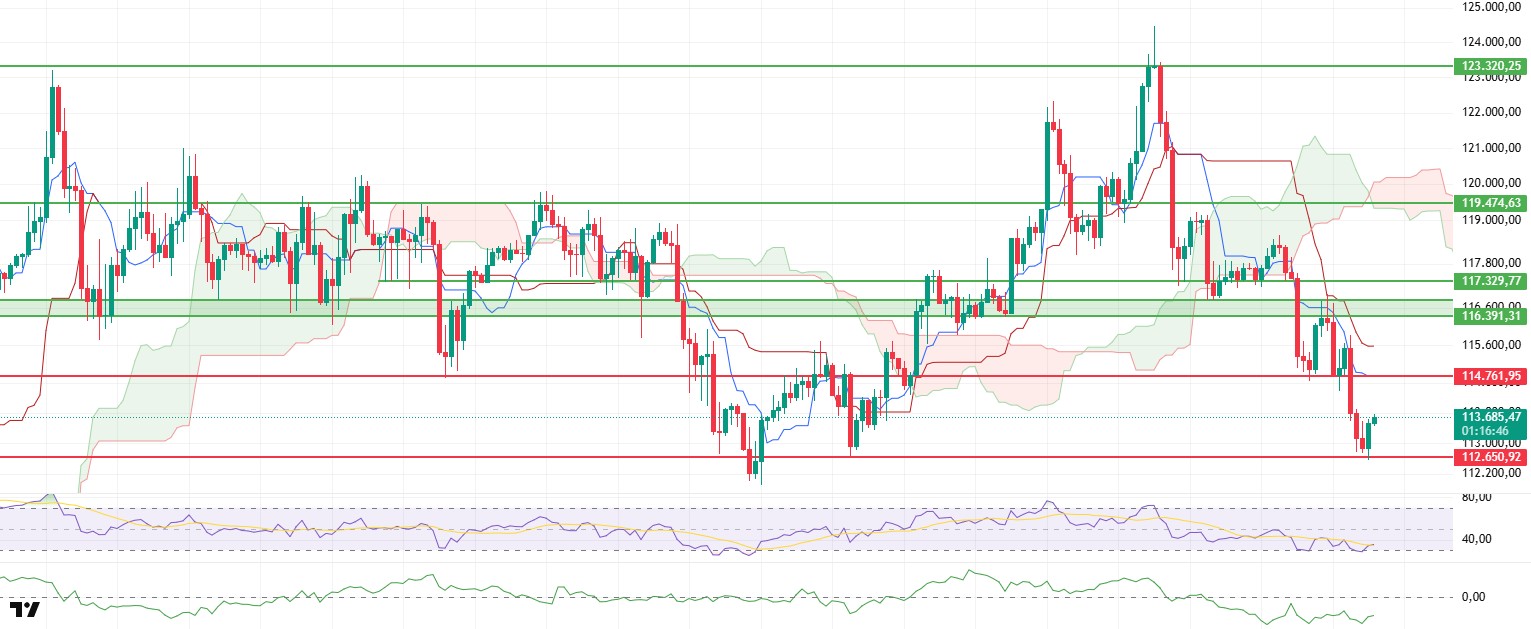
The Bitcoin price fell to 112,650 dollars after losing the support zone at 114,761 dollars in the evening hours yesterday, continuing its decline as predicted in the previous evening’s analysis. The price managed to rebound from this level, rising above the 113,500 dollar mark. While this short-term recovery indicates some buyer interest in the market, it also highlights that the overall structure remains weak.
When technical and on-chain indicators are analyzed together, Cumulative Volume Delta (CVD) data reveals that the recovery process was primarily driven by buying activity in the futures market, while spot market volume remained at low levels. This outlook raises questions about the sustainability of price movements, while the increase in the funding rate further confirms that the upward trend is largely driven by the futures market.
The Chaikin Money Flow (CMF) indicator is moving sideways in the negative zone, indicating that there is no strong liquidity inflow into the market and that current buyer appetite remains weak. The continuation of liquidity outflows is narrowing the ground for buying and making it difficult for the price to enter a sustained upward trend.
When evaluating the Ichimoku indicator, the price moving below the tenkan, kijun, and kumo cloud levels indicates that the short-term outlook remains weak and that the overall market structure continues to show a negative trend. This structure suggests that the price has not yet produced sufficient signals for a strong recovery.
The Relative Strength Index (RSI) indicator has found limited support at the oversold zone boundary following the recent decline. While a partial recovery in momentum has been observed from this level, the structurally weak outlook persists. For the RSI to generate sustained strength from this point, the price would need to close above critical resistance levels.
Looking at the overall picture, the continued weakness in indicators is making it difficult to break above the $114.761 level. If the $112.650 support level is broken again, the downtrend is likely to continue, with lower levels coming into focus. If the 114,761 dollar level is broken, the recovery process is expected to continue, with the price potentially settling back into the 116,391 – 117,329 dollar range.
Support levels: 112,650 – 110,936 – 107,886
Resistance levels: 114,761 – 117,329 – 119,474
ETH/USDT
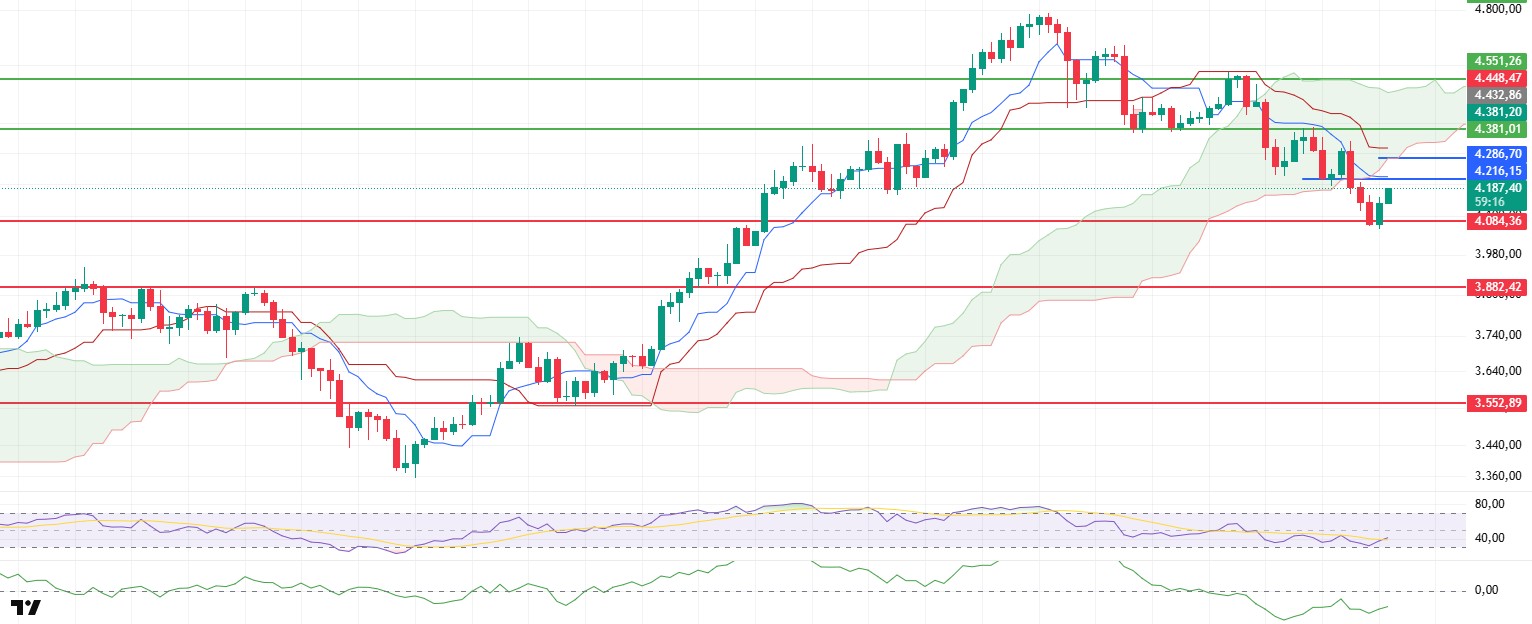
The ETH price fell to the main support zone of $4,084, as expected, after losing the lower band of the much-discussed kumo cloud at $4,216 yesterday evening. With liquidity coming in from this critical point, the price recovered to the $4,180 level in the morning, but the nature and sustainability of the recovery are still open to question.
When technical indicators are evaluated, the Chaikin Money Flow (CMF) indicator’s horizontal movement in the negative zone shows that buyer appetite has not yet strengthened and liquidity outflows are continuing. This indicates that purchases in the market are limited and upward movements are not supported by volume.
From the Ichimoku indicator perspective, the price first lost the tenkan and then the kijun levels and fell below the kumo cloud, indicating that the overall trend has turned negative again. The tenkan level being below the kijun level confirms the existence of short-term downward pressure. The Kumo cloud currently functions as both a dynamic resistance and a trend-defining zone. Reclaiming this zone would signal a meaningful change in market structure.
The Relative Strength Index (RSI) indicator has received a limited response from the oversold zone with the latest movement and has settled above the base MA line. This can be interpreted as a signal of partial recovery in momentum in the short term; however, this recovery in the RSI alone does not guarantee the sustainability of the upward trend. For positive confirmation, the price needs to close above the Kumo cloud and trading volume must increase.
The possible intraday scenarios can be summarized as follows. If the price regains the 4,286 dollar level, which is the kumo cloud region, and confirms this with closes, upward momentum and resistance tests may follow. Otherwise, closes below the kumo cloud will maintain the risk of a short-term decline, and selling pressure will increase. A break below the 4,084 dollar support level could trigger more severe corrections from a technical perspective. During this process, volume, daily closes, and the alignment between the CMF and RSI should be monitored, as these indicators will be decisive in determining whether the upward trend is sustainable.
Support levels: 4,084 – 3,882 – 3,552
Resistance levels: 4,286 – 4,381 – 4,551
XRP/USDT
After reaching $3.10, the price of XRP “froze” at $3.00 with zero trading volume, and this unusual situation, as reported by CoinDesk, raised the possibility of a technical glitch or liquidity gap in the market. The incident once again highlighted the critical psychological threshold of the $3 level for investors and contributed to heightened volatility. On the same day, the U.S. banking regulator OCC announced new regulations allowing banks to collaborate with stablecoin projects. The streamlining of such partnerships, which previously required written approval, is seen as a step toward accelerating Ripple’s integration of its RLUSD stablecoin into the traditional banking system. The regulation is expected to strengthen the role of stablecoins in the U.S. financial system.
Meanwhile, details of the Gemini-Ripple credit line agreement, which began in July, have also been clarified. While an initial credit limit of $75 million was set, it was announced that this amount could be increased to $150 million. The fact that borrowings exceeding $75 million will be made using the RLUSD stablecoin demonstrates that Ripple’s stablecoin strategy has begun to be used in practice on a major US exchange and that RLUSD has been accepted as a medium of exchange.
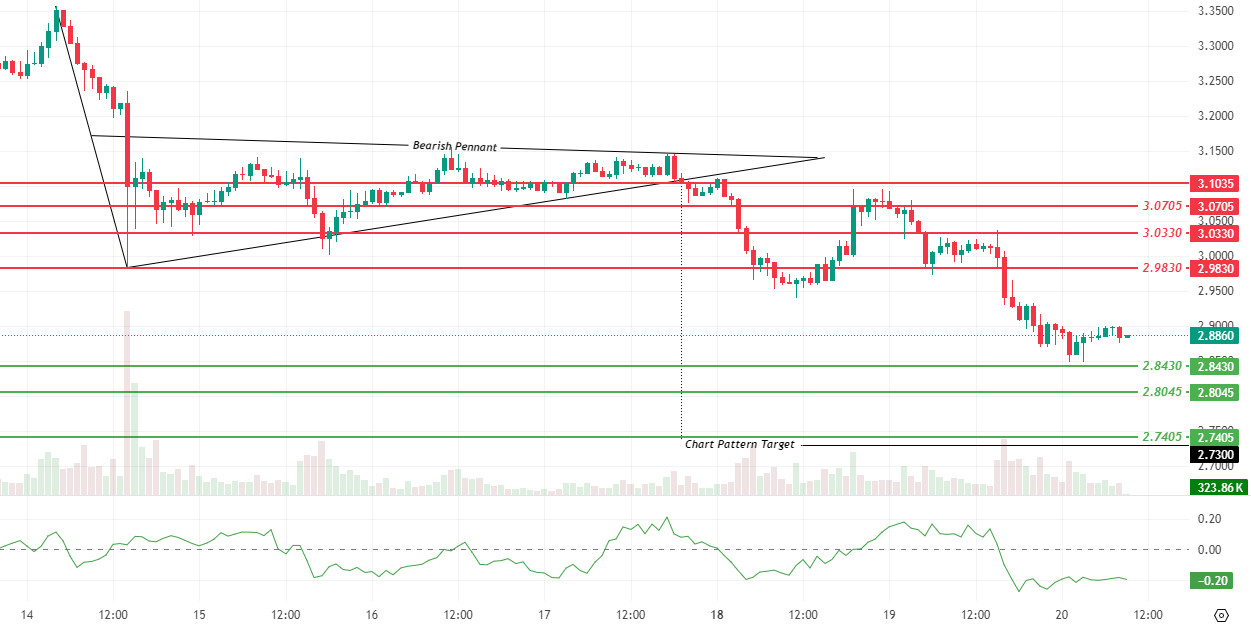
On the technical side, the selling pressure that began after the breakout of the Bearish Pennant formation deepened as expected toward the lower support levels, with the 2.9585 and 2.9175 dollar levels being broken downward. The price entered a short-term stabilization attempt with a reaction from the 2.8430 dollar support level, but the current movement remained limited. While efforts to hold above this level continue, the first resistance area to the upside is at $2.9830, followed by $3.0330. As long as these areas are not sustained, upward attempts are likely to remain weak.On the downside, a break below the $2.8430 level could bring the $2.8045 and $2.7405 levels back into focus. In particular, if there are closes below $2.7405, selling pressure could accelerate and deepen towards the $2.70 band.
Trading volume increased during the sharp decline but remains low during the rebound. This indicates that buyers are still weak and that short-term recovery attempts are at risk. The Chaikin Money Flow (CMF) indicator is at -0.17 and remains in negative territory. This confirms that capital outflows are continuing and that the downside risk for the price remains high.
Support levels: 2.9585 – 2.9175 – 2.8430
Resistance levels: 3.0330 – 3.0705 – 3.1035
SOL/USDT
1inch has introduced Solana integration for cross-chain swaps.
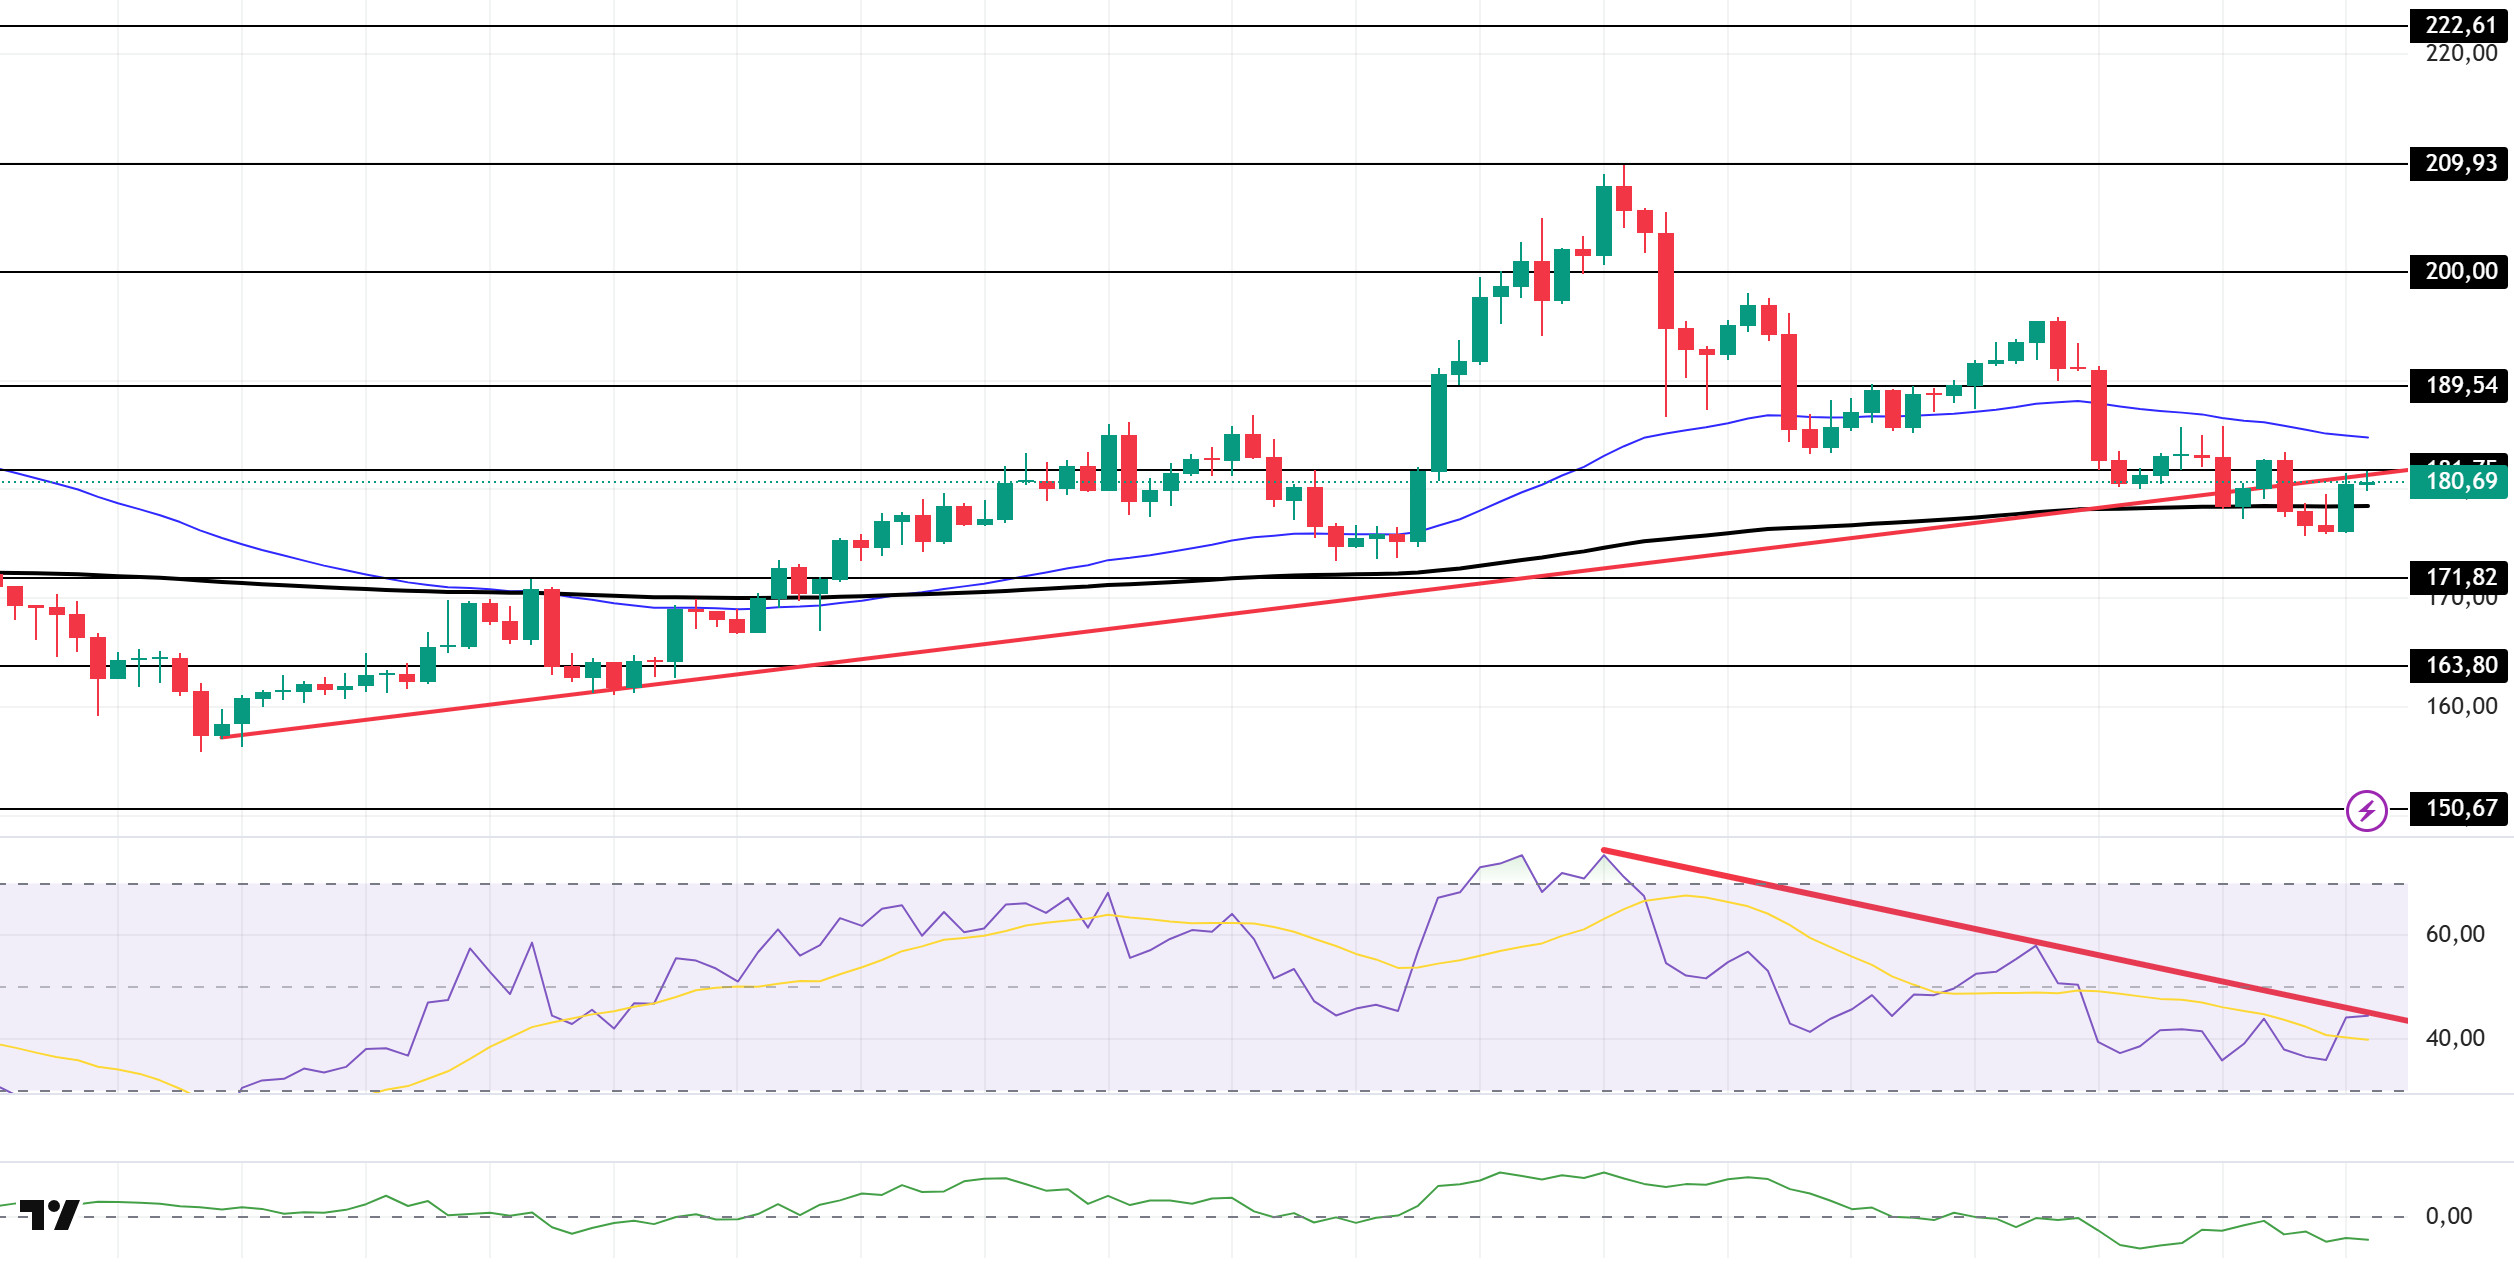
The SOL price has started to move sideways. The asset crossed below the upward trend line that began on August 2 and has remained there. This could increase selling pressure. The price, which broke below the $181.75 level, is currently testing the upward trend line as resistance. A break above this level could trigger an uptrend. If the pullback continues, the 171.82 dollar level should be monitored.
On the 4-hour chart, the 50 EMA (Blue Line) remained above the 200 EMA (Black Line). This indicates that the upward trend may continue in the medium term. At the same time, the price being between the two moving averages shows that the market is in a decision phase in the short term. The Chaikin Money Flow (CMF-20) remains in the negative zone. However, an increase in money inflows could push the CMF into the positive zone. The Relative Strength Index (RSI-14) remains below the downward trend that began on August 14. This indicates that selling pressure continues. In the event of an upward movement driven by macroeconomic data or positive news related to the Solana ecosystem, the $189.54 level emerges as a strong resistance point. If this level is broken to the upside, further upward movement is expected. In the event of a pullback due to adverse developments or profit-taking, the $171.82 level could be tested. If this support holds, a decline to the $ levels could see an increase in buying momentum, potentially presenting a buying opportunity.
Support levels: 171.82 – 163.80 – 150.67
Resistance levels: 181.75 – 189.54 – 200.00
DOGE/USDT
Thumzup plans to acquire Dogehash through a stock deal expected to be finalized by the end of this year.
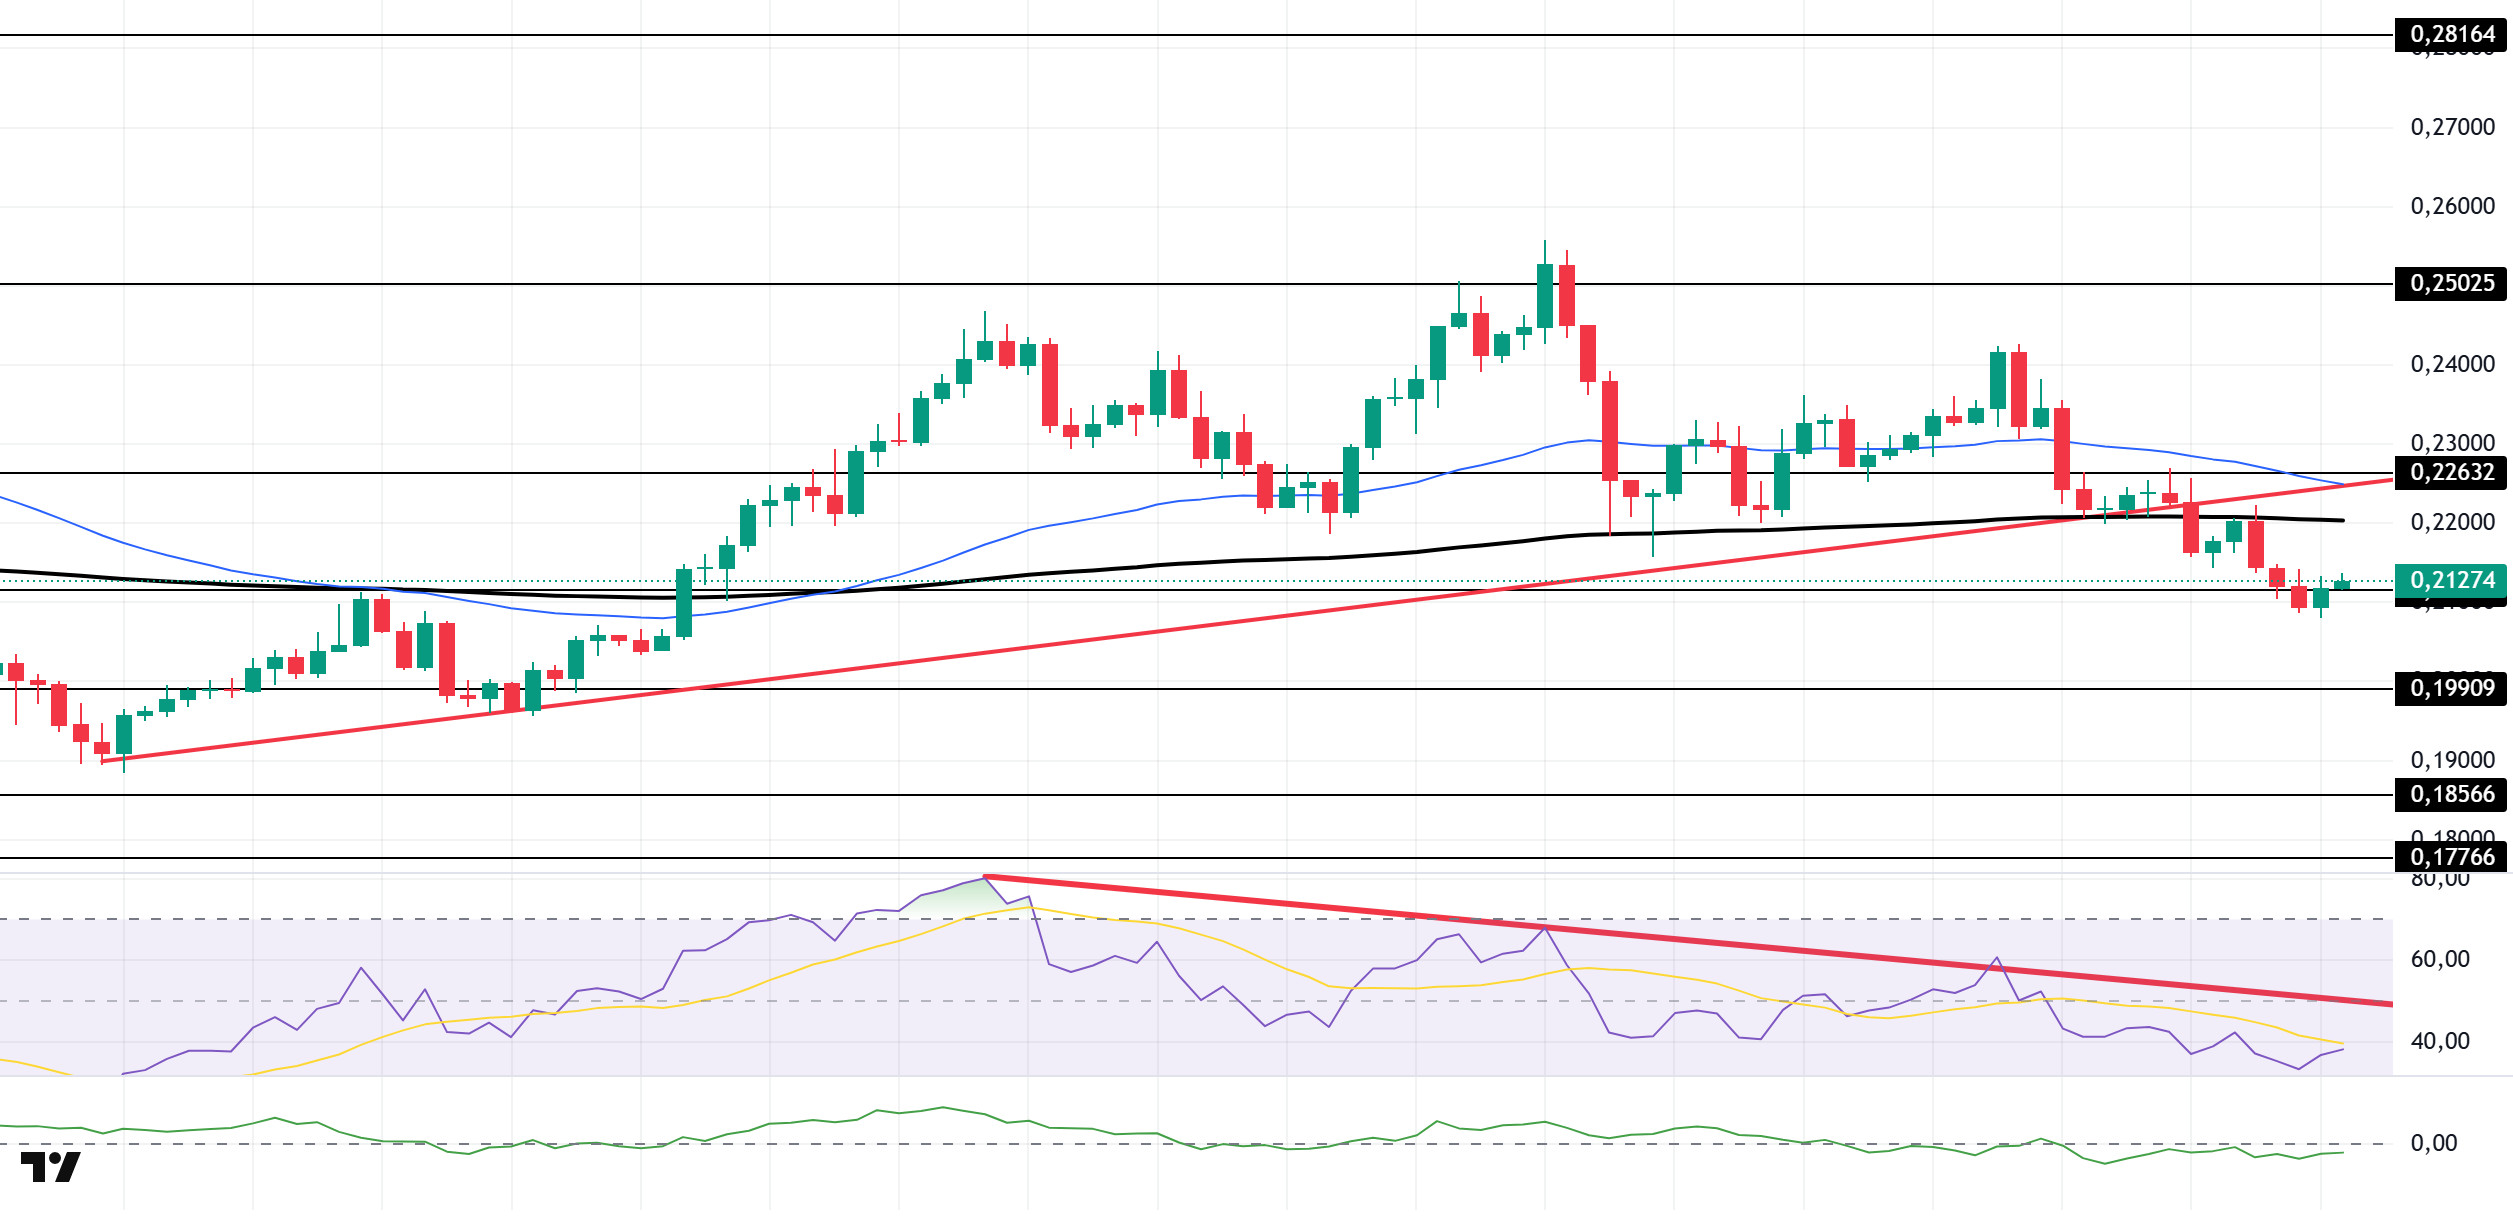
DOGE continued its downward trend. The asset broke below the upward trend that began on August 2 and the 200 EMA (Black Line) moving average and remained there. These could increase selling pressure. As of now, it is testing the $0.21154 level as support. If the price closes below this level, the $0.19909 level should be monitored. In an upward movement, the 200 EMA (Black Line) moving average should be tracked.
On the 4-hour chart, the 50 EMA (Blue Line) remains above the 200 EMA (Black Line). This indicates that the asset is in an upward trend in the medium term. The price being below both moving averages also signals a downward trend in the short term. The Chaikin Money Flow (CMF-20) continues to remain in the negative zone. Additionally, an increase in money inflows could push the CMF into positive territory. The Relative Strength Index (RSI-14) remains in the negative zone. It also continues to stay below the downward trend that began on August 9, indicating that selling pressure persists. In the event of potential increases driven by political developments, macroeconomic data, or positive news flow within the DOGE ecosystem, the $0.22632 level emerges as a strong resistance zone. In the opposite scenario or in the event of negative news flow, the 0.19909 dollar level could be triggered. A decline to these levels could increase momentum and potentially trigger a new upward wave.
Support levels: 0.21154 – 0.19909 – 0.18566
Resistance levels: 0.22632 – 0.25025 – 0.28164
SHIB/USDT
One of the most notable developments in the Shiba Inu ecosystem recently occurred on the burn side. On-chain data showed that the burn rate dropped to 98.89%, with only approximately 223,914 SHIB being removed from circulation. This dramatic decrease indicates a weakening of transaction activity on the network while revealing a significant reduction in the deflationary pressure that has supported SHIB for an extended period.
Concurrently, approximately $255 million was withdrawn from Ethereum-based exchange-traded funds (ETFs). The scale of these fund outflows was interpreted as a signal of reduced risk appetite in the crypto market. Particularly, the activity in the institutional channel suggests that the ecosystem’s short-term liquidity conditions have become more fragile.
The sharp decline in the burn rate coinciding with ETF-driven capital outflows indicates that the Shiba Inu ecosystem is facing a weakening momentum in terms of on-chain activity and investor behavior.
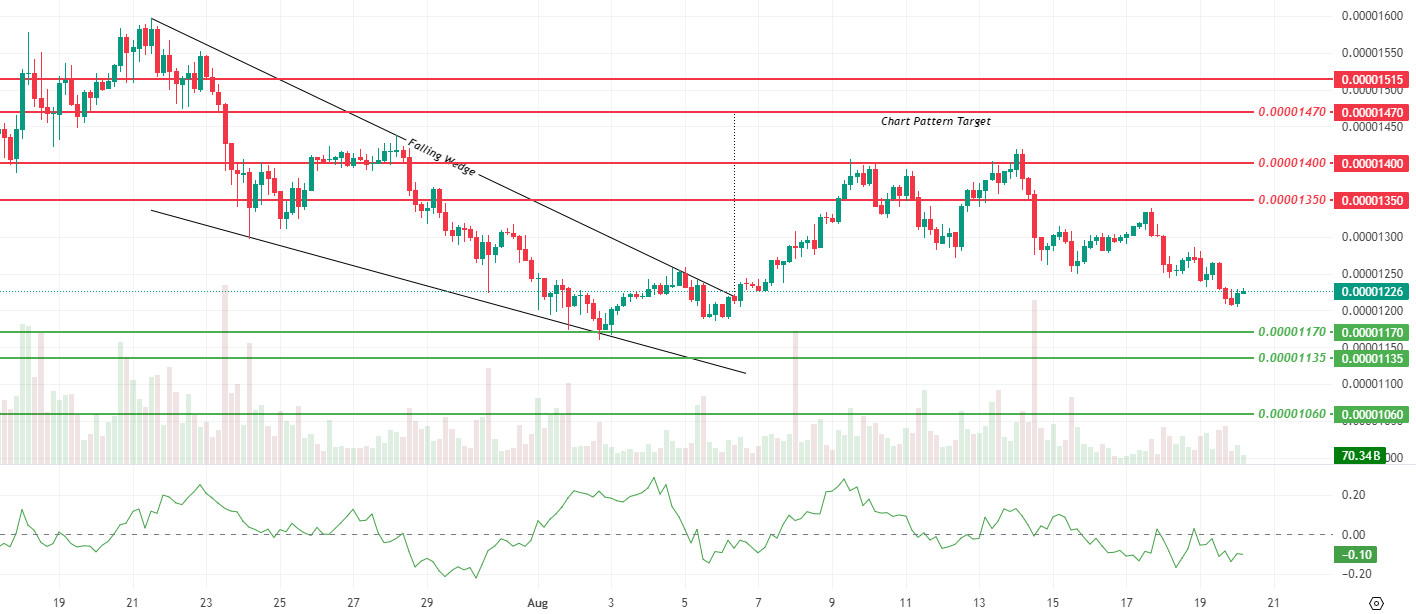
Technically, the price broke below the $0.00001240 support level and is now attempting to stabilize around the $0.00001225 level. This break confirms that selling pressure is dominant in the short term, with the 0.00001170 and 0.00001135 dollar levels emerging as the next support zones. Below that, the area extending down to 0.00001060 dollars remains a critical major support level.
In upward recovery attempts, the 0.00001240 level has now become the first important resistance level. Unless sustainability is achieved above this level, it seems difficult for buyers to gain strength. The 0.00001350 and 0.00001400 levels stand out as upper resistance zones, and a medium-term decline is expected to continue unless there are closes above 0.00001400.
The Chaikin Money Flow (CMF) indicator is at -0.10 and continues to remain in negative territory. This indicates that capital outflows are continuing and that the pressure behind the support break has not been sufficiently countered by buyers. The increase in trading volume during the recent decline also points to the continued strength of selling pressure.
Support levels: 0.00001170 – 0.00001135 – 0.00001060
Resistance levels: 0.00001350 – 0.00001400 – 0.00001470
LINK/USDT
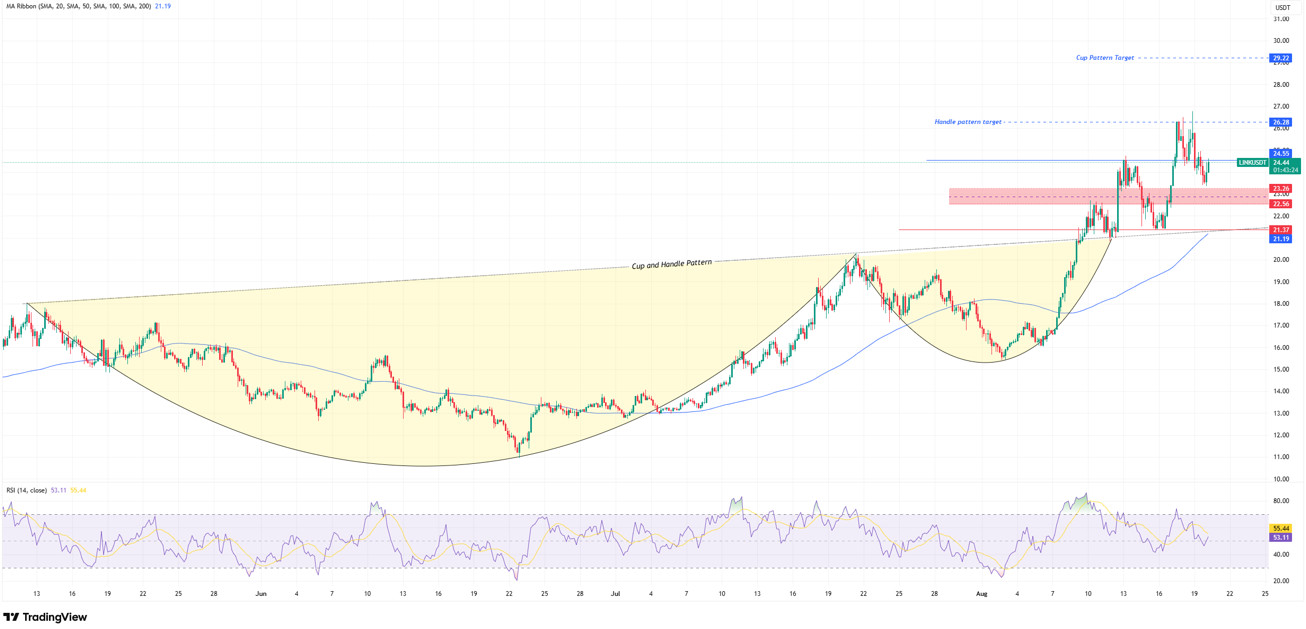
LINK, after breaking out of the long-term cup-and-handle formation, rose to the $26 level before entering a correction phase accompanied by profit-taking. Following this correction, while the price appears to be seeking support near the breakout level of the formation, the 24.55 band stands out as a critical threshold. A price trading below this level could significantly strengthen expectations of continued weakness in the short term.
As we mentioned yesterday, in the downward scenario, the first important support area stands out at the 23.26 band. If this level is lost, there is a risk that the price could retreat to the Fibonacci retracement zone at 22.50–22.60. Further down, the 21.40–21.50 band acts as both a trend support and a horizontal support, forming the main defense line. Pullbacks to this level would not break the medium-term uptrend, but closes below this level could completely turn the scenario negative.
In an upward scenario, regaining the 24.50 level would confirm the recovery trend. In such a case, the first target appears to be the 26.30 level. A break above 26.30 with high volume could potentially push the price up to the formation target of the 29 dollar band. The Relative Strength Index (RSI) remaining around 50 indicates that buyers and sellers are currently in equilibrium. However, for the trend to regain momentum, it is critical for the RSI to rise above the 60 level.
Support levels: 23.26 – 22.56 – 21.37
Resistance levels: 24.55 – 26.28 – 29.22
ADA/USDT
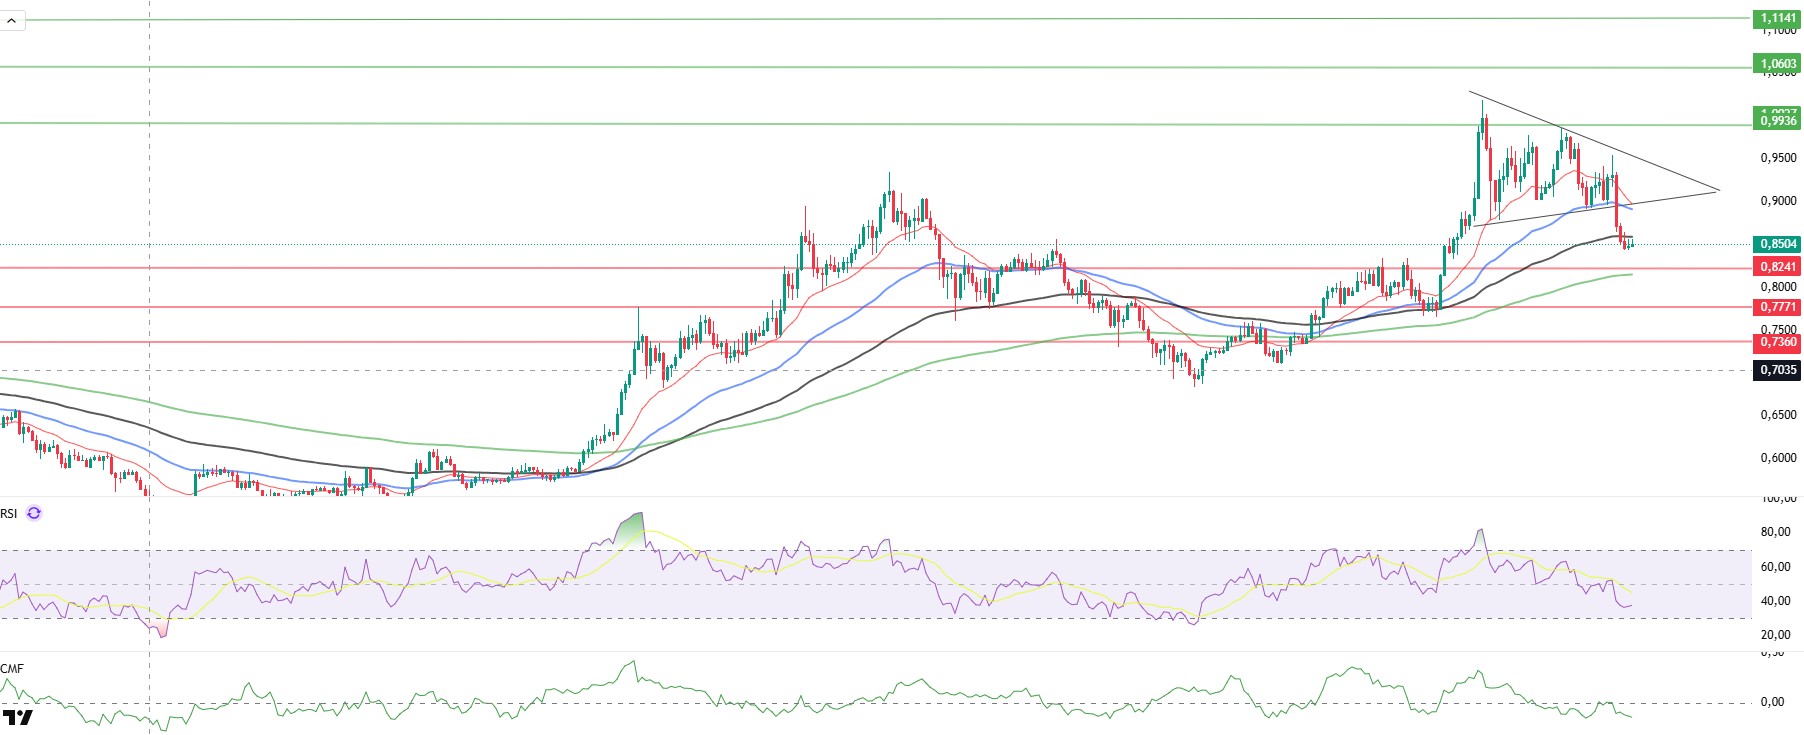
ADA broke out of the symmetrical triangle formation and returned to the support level due to the impact of institutional sales and low trading volume yesterday. It tested the 0.8798 support level from last week and managed to stay above the 0.9017 level. As of today, downward reactions have started from the support zone. The price continues to trade within the 0.8241 – 0.8798 range during the day. If it breaks above the triangle formation again on the 4-hour chart, it is expected to maintain its position above the 0.9936 level.
The price remains below the 50 (Blue Line), 20 (Red Line), and 100 (Black Line) daily Exponential Moving Averages (EMA) on the 4-hour chart, indicating that sellers are gaining strength. The Relative Strength Index (RSI-14) has dropped to 36 levels and continues to move in the sell zone, while the Chaikin Money Flow (CMF-20) has fallen to -0.15 levels, indicating the continuation of the downtrend signal. The decline in capital inflows may keep the CMF in the sell zone and exert a downward pressure on the price. In the event of positive macroeconomic data or news related to the Cardano ecosystem, the 1.0255 dollar level could emerge as a strong resistance point. In the event of a decline, the 0.8241 level will be the key support level to monitor.
Support levels: 0.8241 – 0.7771 – 0.7360
Resistance Levels: 1.1141 – 1.0603 – 0.9936
Legal Notice
The investment information, comments, and recommendations contained herein do not constitute investment advice. Investment advisory services are provided individually by authorized institutions taking into account the risk and return preferences of individuals. The comments and recommendations contained herein are of a general nature. These recommendations may not be suitable for your financial situation and risk and return preferences. Therefore, making an investment decision based solely on the information contained herein may not produce results in line with your expectations.


