
Technical Analysis
BTC/USDT
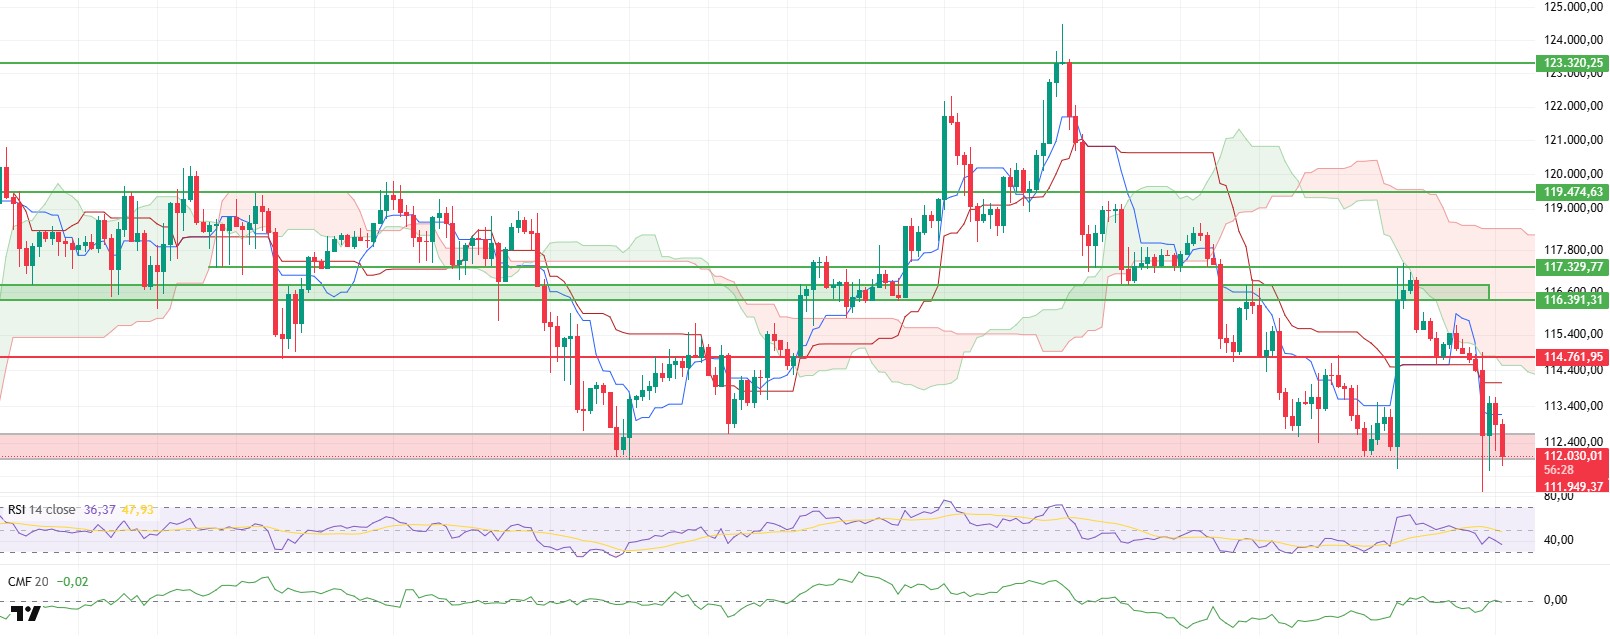
The BTC price surged sharply following positive market reactions to remarks made by Federal Reserve Chair Jerome Powell at the Jackson Hole meeting, climbing to the critical resistance level of $117,329. One of the main factors supporting this movement was the strengthening of investors’ expectations for an interest rate cut decision. However, increased selling pressure in this region and, in particular, the shift of liquidity toward ETH caused the price to quickly retreat to the important support level of $110,936. Currently, BTC is attempting to hold its ground in this region, with technical indicators continuing to show a weak trend.
When examining the Ichimoku indicator, it can be seen that the price rose to the kumo cloud boundaries before being rejected in this region and then retreating below the tenkan and kijun levels. This indicates that the short-term technical outlook has turned negative and that downward pressure is likely to increase. The strong rejection from the kumo cloud boundary highlights the need for more intense buying liquidity for the price to achieve a sustained breakout in this area.
The Chaikin Money Flow (CMF) indicator, despite rising to the zero line, was rejected from this level and began producing weak signals again. This outlook confirms that the liquidity entering the market has not reached sufficient strength and that the upward movement cannot be sustained. This lack of liquidity suggests that the price may come under selling pressure again in the short term.
The support zone at the $110.936 level retains its critical importance. If the price receives a strong reaction from this zone, a short-term recovery and slight upward movements may be observed. However, if this level is broken downward, a deepening of sales and more severe declines may be expected. Therefore, price movements in this zone continue to be decisive in determining the direction of the market.
Support levels: 111,950 – 110,936 – 107,886
Resistance levels: 114,761 – 117,329 – 119,474
ETH/USDT
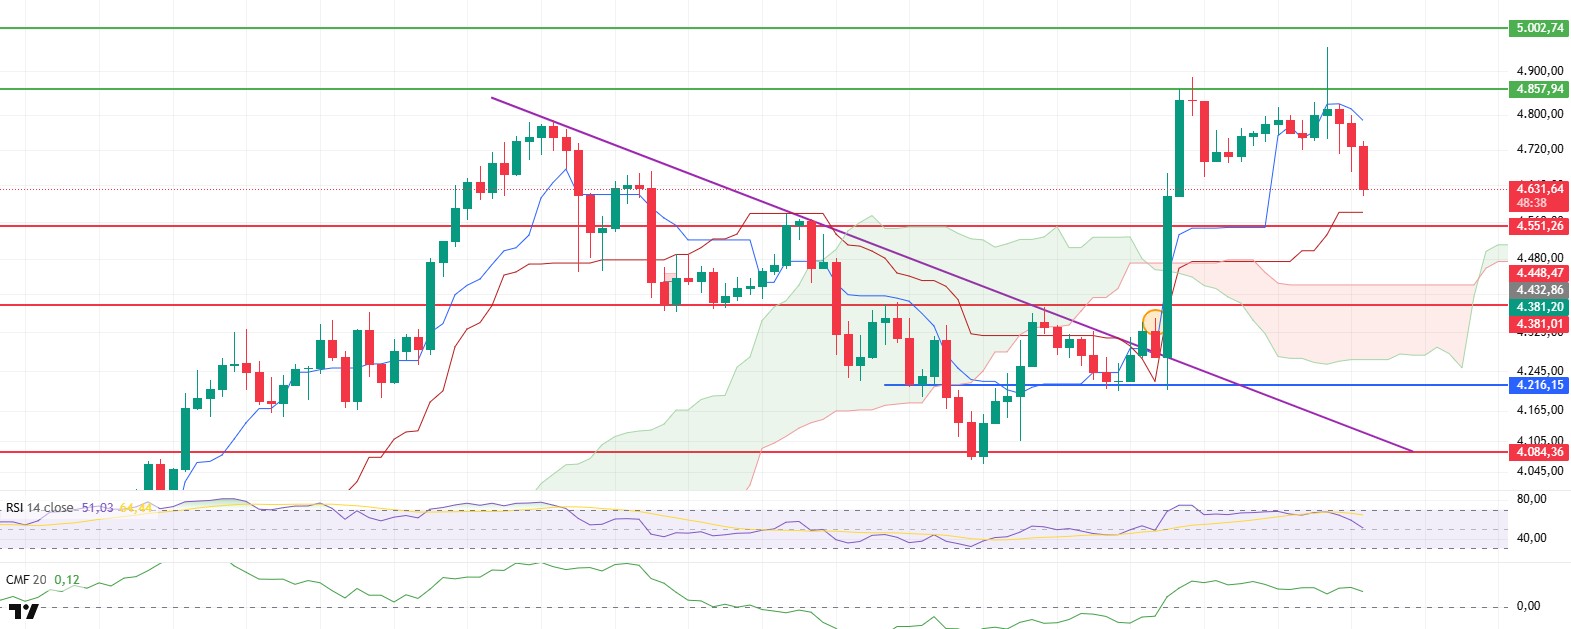
ETH gained momentum following the positive market reaction to Fed Chair Powell’s Jackson Hole speech, breaking through the $4,551 resistance level and reaching $4,956, setting a new all-time high (ATH). Despite the limited pullback seen after the weekly close, the overall price trend remains upward. Structural signals indicating that buying appetite has not weakened are being maintained.
The Chaikin Money Flow (CMF) is continuing its horizontal movement in positive territory, indicating that net inflows are continuing. The flattening of the slope opens the door to a consolidation phase in the short term, but there is no sign of a breakdown yet. Although there is a limited pullback on the momentum side, efforts to remain above the threshold values are continuing. This outlook is interpreted as a trend-based consolidation.
In the Ichimoku indicator, the price settling above the kumo cloud and the cloud’s slope turning upward support the transition to a positive regime in the overall structure. Closings above the Kijun strengthen the trend’s backbone and increase the likelihood of a rebound from this level in pullbacks. The maintenance of the gap between Tenkan and Kijun indicates that the short-term rhythm is still in favor of buyers. A clear break above the price by the Chikou Span would further confirm the upward trend.
In the intraday scenario, the Kijun level around $4.585 is likely to act as the first line of defense. A rebound from this area could bring the $4.857 resistance level back into focus, and a successful breakout could open the door for another attempt at the $4.956 all-time high (ATH) region. Hourly and four-hour closes below $4.585 could trigger a stronger-than-expected correction. In such a break, the $4.551 level would first be monitored to see if it acts as a converted support. As long as pullbacks deepening toward the upper band of the Kumo cloud remain within the trend, the medium-term positive scenario remains intact.
Top of Form
Below the Form
Support levels: 4,551 – 4,381 – 4,084
Resistance levels: 4,381 – 4,551 – 4,857
XRP/USDT
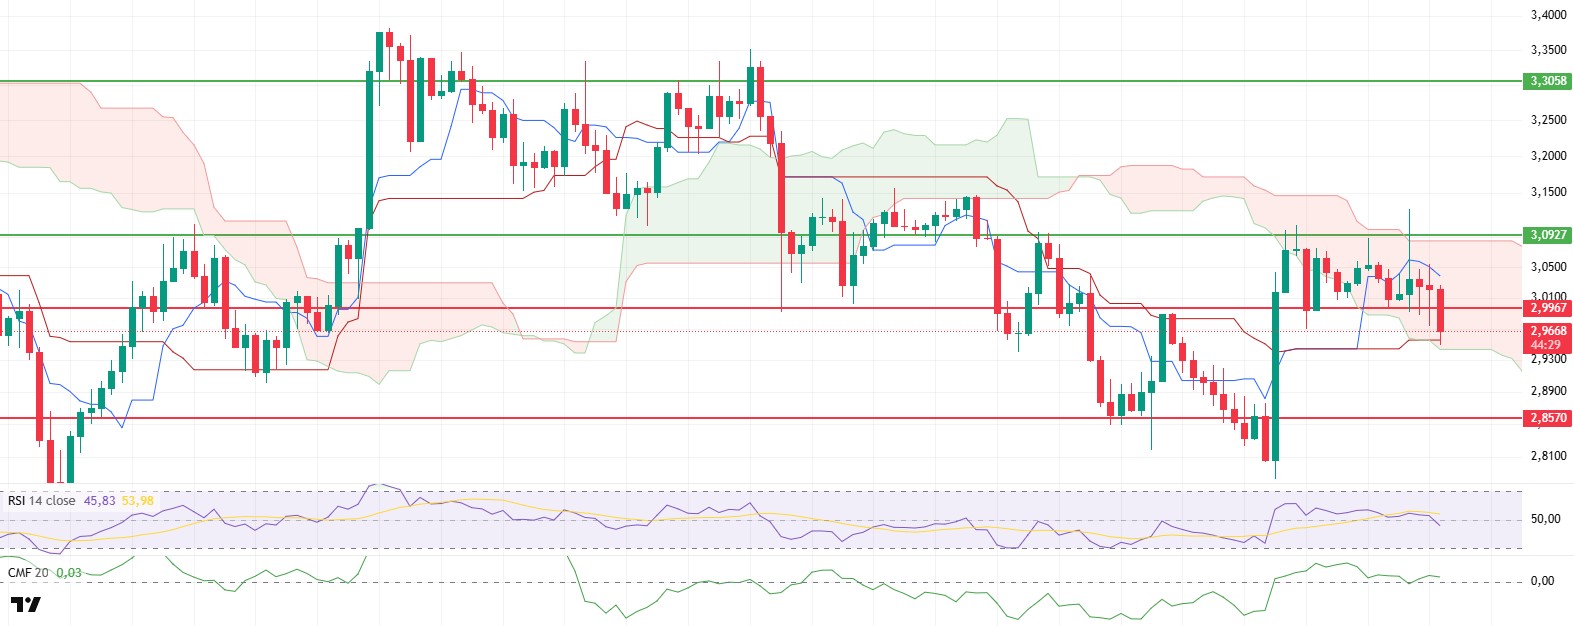
XRP failed to break above the 2.99–3.00 range again and continued its decline under selling pressure. The price is currently showing a weak outlook around the 2.96 level. , the upper band of the formation has been tested, but no breakout has occurred, so sellers remain in control in the short term. Therefore, we can say that the 2.99–3.00 band remains a critical threshold for direction confirmation.
In the downside scenario, the red zone (2.85–2.74) retains its importance. Although the price is currently moving towards this zone, we cannot see any developments that would support this rise in momentum, and we are seeing increased pressure from sellers. This range is a strong defense line as it coincides with both horizontal support and the lower trend line of the wedge. However, a sustained move below this level could bring a pullback towards the 2.6565 support level.
In the upward scenario, the price must break above the 2.99–3.00 band for a recovery. Unless there are closes above this region, the upward momentum may remain weak. If this breakout occurs, first 3.1521 and then the formation target zone of 3.29 could come into focus. On the Relative Strength Index (RSI) side, momentum remains weak compared to yesterday’s analysis, and a move above the 45–50 band is needed to signal a recovery. In short, the critical threshold for XRP remains unchanged. The 2.85–2.74 range below and the 2.99–3.00 band above continue to be the main levels that will determine the price direction.
Support levels: 2.8502 – 2.7452 – 2.6565
Resistance levels: 2.9920 – 3.1521 – 3.2923
SOL/USDT
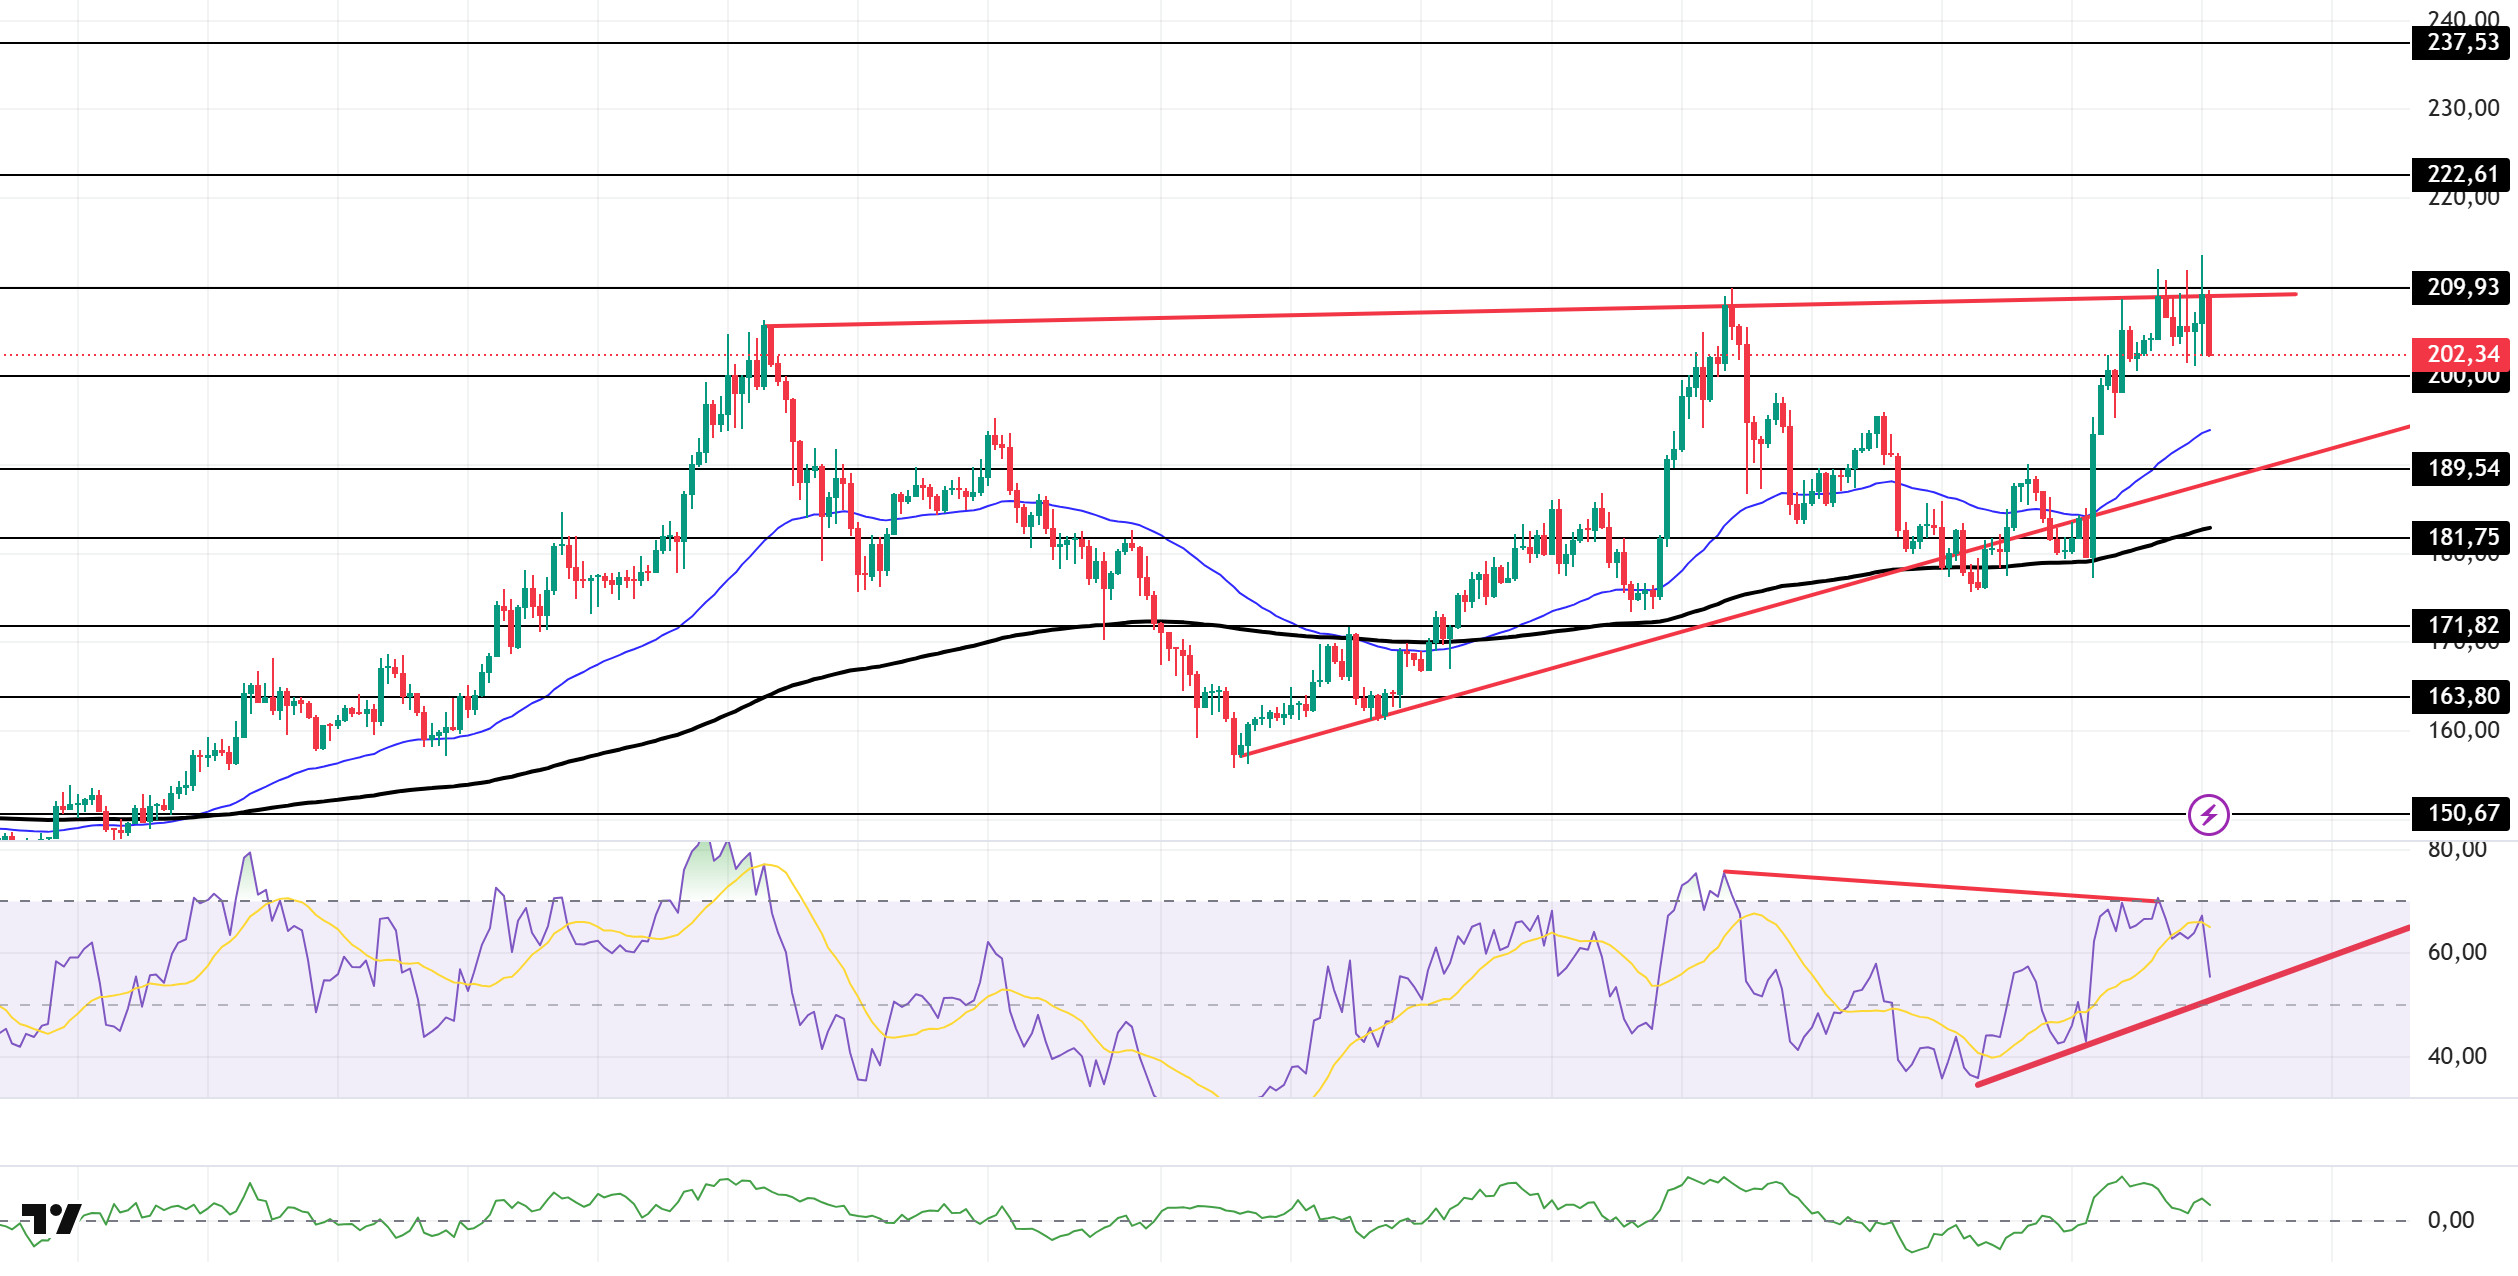
VanEck filed an S-1 application for the JitoSOL ETF. A hacker who stole over $300 million from users of a centralized exchange purchased 38,126 Solana tokens worth $7.95 million at $209 each.
The SOL price experienced an uptrend. The asset found support at the 200 EMA (Exponential Moving Average – Black Line) moving average and accelerated to the resistance level of the ascending wedge formation that began on August 2. As of now, the price is testing this ceiling level as resistance. If it experiences a pullback, the 200.00 dollar level should be monitored. If the upward trend continues, it could test the 222.61 dollar level as resistance.
On the 4-hour chart, the 50 EMA (Blue Line) remains above the 200 EMA. This indicates that the upward trend may continue in the medium term. Additionally, the price being above both moving averages suggests that the market is in an upward trend in the short term. Chaikin Money Flow (CMF-20) has risen to a positive level. However, a decrease in money inflows could push CMF back into negative territory. The Relative Strength Index (RSI-14) has remained above the upward trend that began on August 19, but its position in the overbought zone could trigger profit-taking. On the other hand, negative divergence could cause a pullback. If there is an uptrend due to macroeconomic data or positive news related to the Solana ecosystem, the $222.61 level stands out as a strong resistance point. If this level is broken upward, the uptrend is expected to continue. In the event of a pullback due to adverse developments or profit-taking, the 200.00 dollar level could be tested. A decline to these support levels could see an increase in buying momentum, potentially presenting an opportunity for an upward move.
Support levels: 200.00 – 189.54 – 181.75
Resistance levels: 209.93 – 222.61 – 237.53
DOGE/USDT
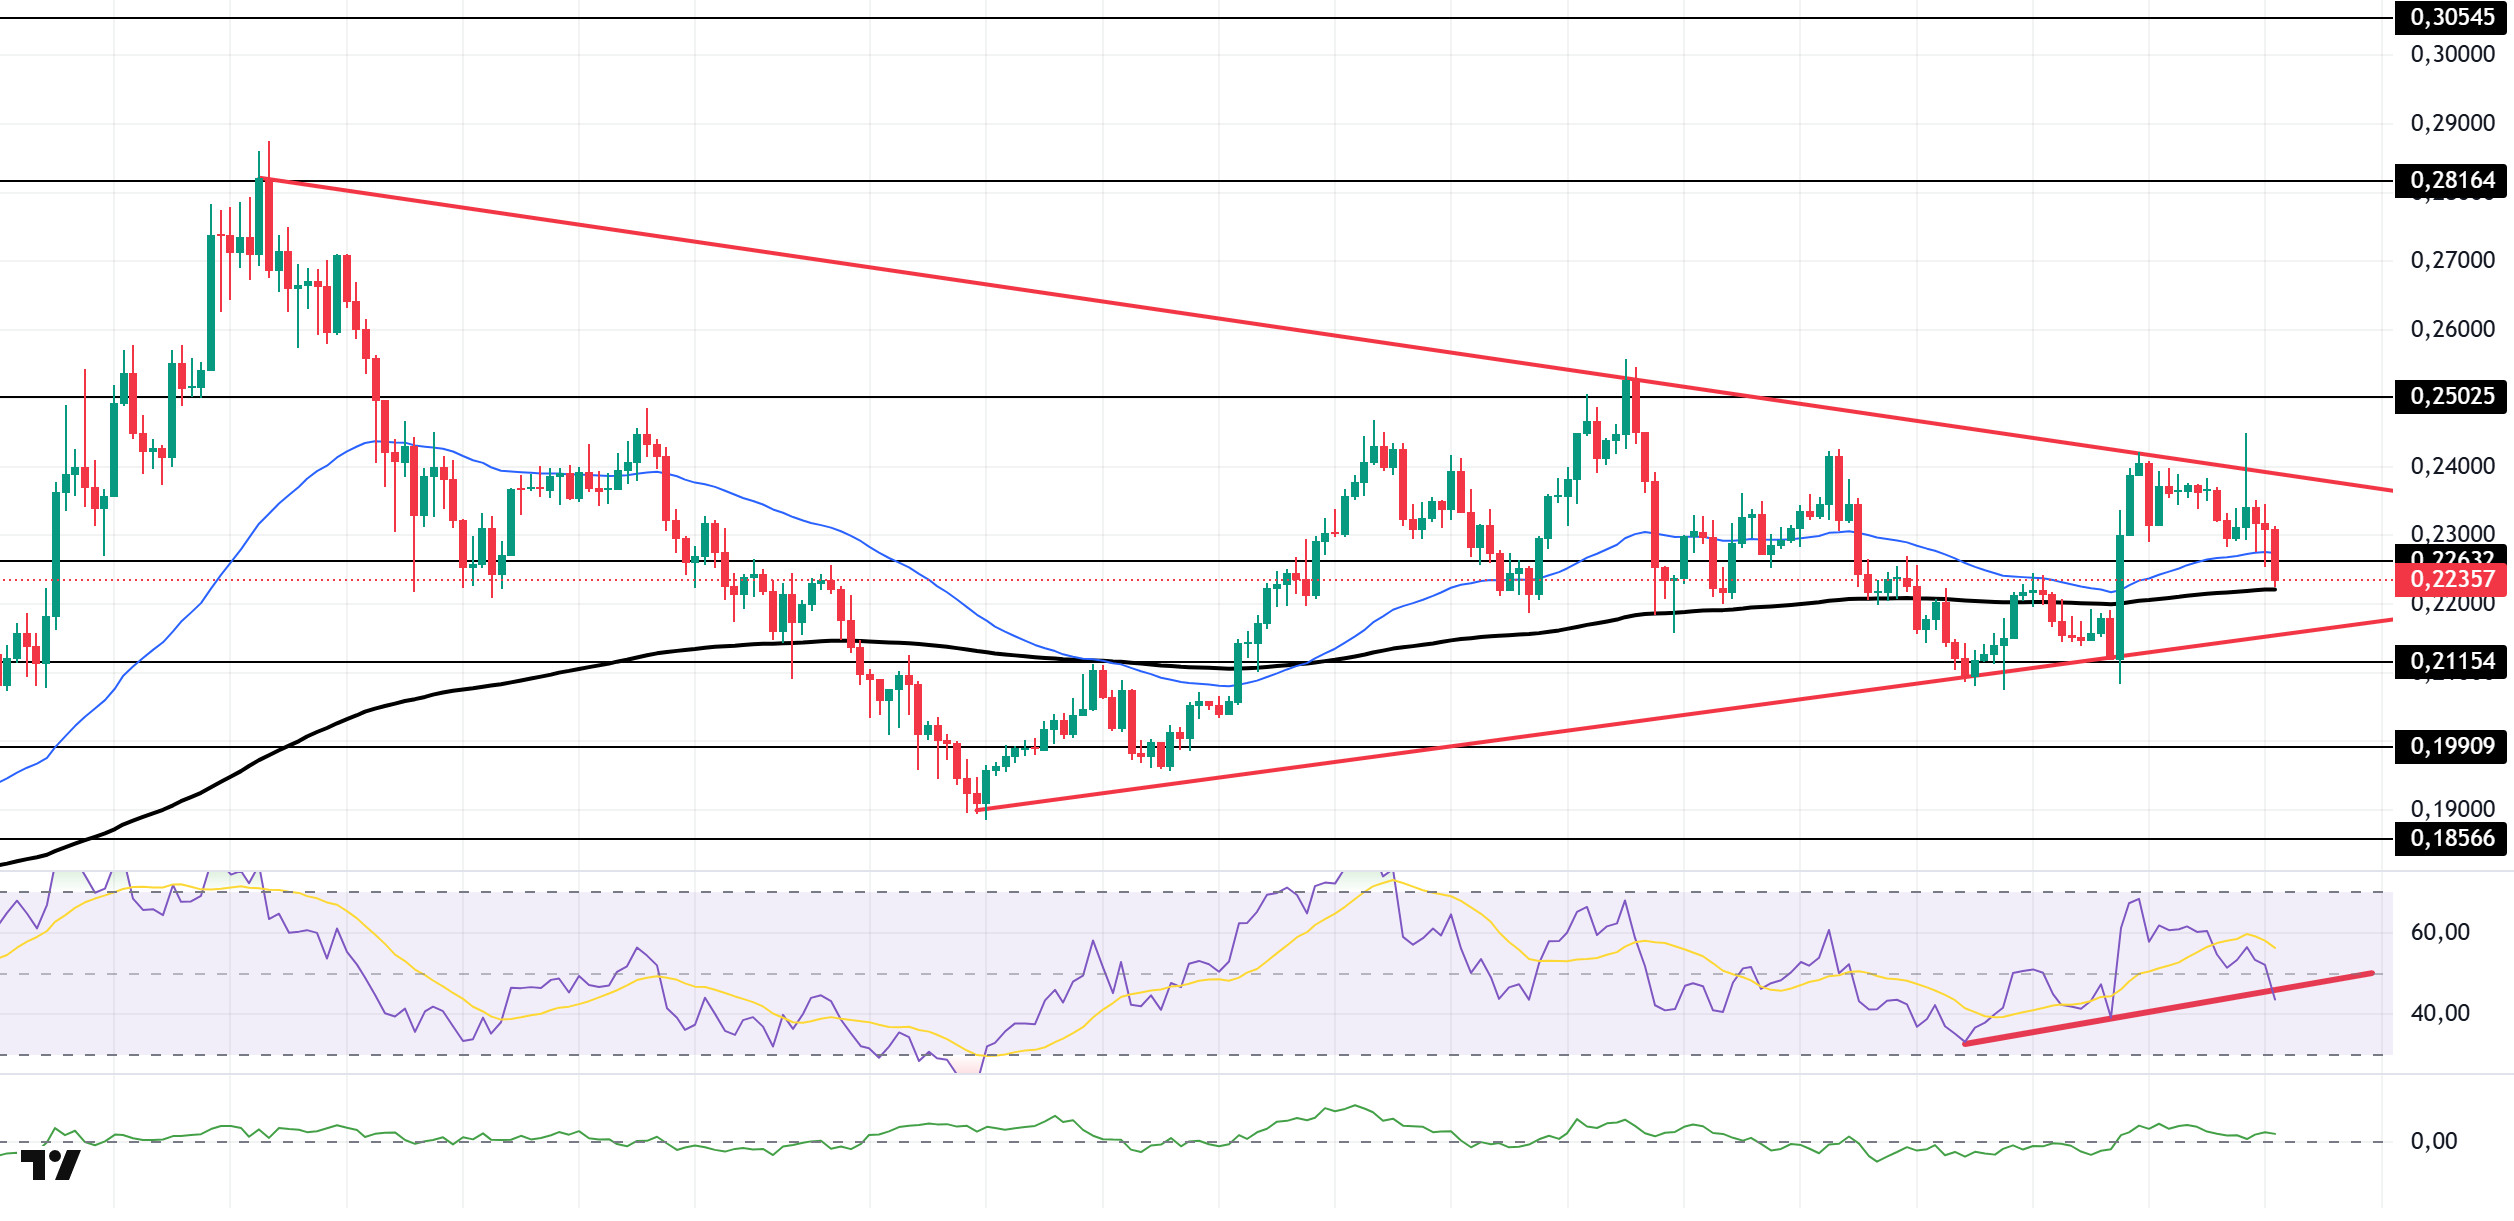
The DOGE price has been moving sideways. The asset continued to price within the symmetrical triangle formation that began on August 2. The price, which accelerated from the base level of the symmetrical triangle formation, tested the top level of the formation and experienced a pullback from there. As of now, it is testing the 50 EMA (Exponential Moving Average – Blue Line) moving average as support. If the price closes below this level, the 200 EMA (Black Line) moving average should be monitored. In the event of an upward movement, the $0.25025 level should be monitored.
On the 4-hour chart, the 50 EMA continues to remain above the 200 EMA. This indicates that the asset is in an upward trend in the medium term. The fact that the price is above both moving averages also indicates that the asset is in an upward trend in the short term. Chaikin Money Flow (CMF-20) continues to remain in positive territory. Additionally, a decrease in money inflows could push the CMF into the negative ( ) zone. The Relative Strength Index (RSI-14) remains in the negative zone. It is currently testing the rising trend that began on August 19 as support. A break below this level could increase selling pressure. In the event of potential increases driven by political developments, macroeconomic data, or positive news flow within the DOGE ecosystem, the $0.25025 level emerges as a strong resistance zone. In the opposite scenario or in the event of negative news flow, the 0.21154 dollar level could be triggered. A decline to these levels could increase momentum and potentially initiate a new upward wave.
Support levels: 0.22632 – 0.21154 – 0.19909
Resistance levels: 0.25025 – 0.28164 – 0.30545
LTC/USDT
Litecoin started the day at 118.18 and experienced its second consecutive negative day. In the first 8 hours of the day, it lost 3.64% in value, marking another negative start. With a market value of 8.7 billion dollars, it maintains its 20th position in the rankings. In futures trading, funding rates are positive, with a total open position of 1.06 billion dollars.
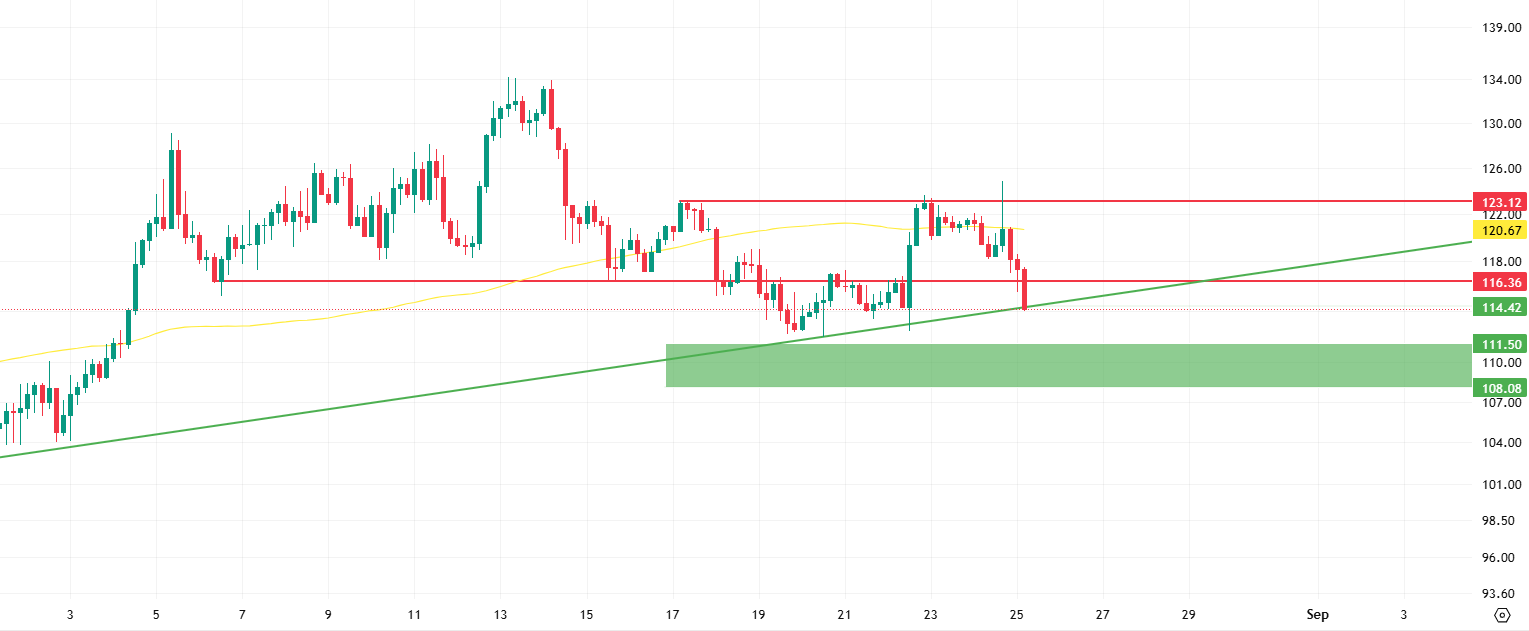
Technically, LTC, which is just above the rising minor trend, is expected to rebound from the 114.42 level. If the decline cannot be sustained within the minor trend, it is expected to find support in the green zone between the Fibonacci support levels of 111.50 and 108.08 and move upward.
If we break above the minor trend, the horizontal resistance at 116.36 could create intense selling pressure. Following that, the 100-period moving average (yellow line) at 120.67 could be one of the levels where breaking above may be challenging. Finally, the 123.12 level could act as a major resistance level.
Support levels: 114.42 – 111.50 – 108.08
Resistances: 116.36 – 120.67 – 123.12
TRX/USDT
According to a study conducted last week, TRON was determined to be the most widely used blockchain for stablecoin transfers in 35 of the 50 countries examined (including countries in Asia, Africa, and Latin America).
As of August 24, 2025, the total amount of TRX staked reached 45,434,424,701, accounting for 47.99% of the circulating supply. The high staking rate reflects investors’ confidence in the security and long-term sustainability of the TRON network.
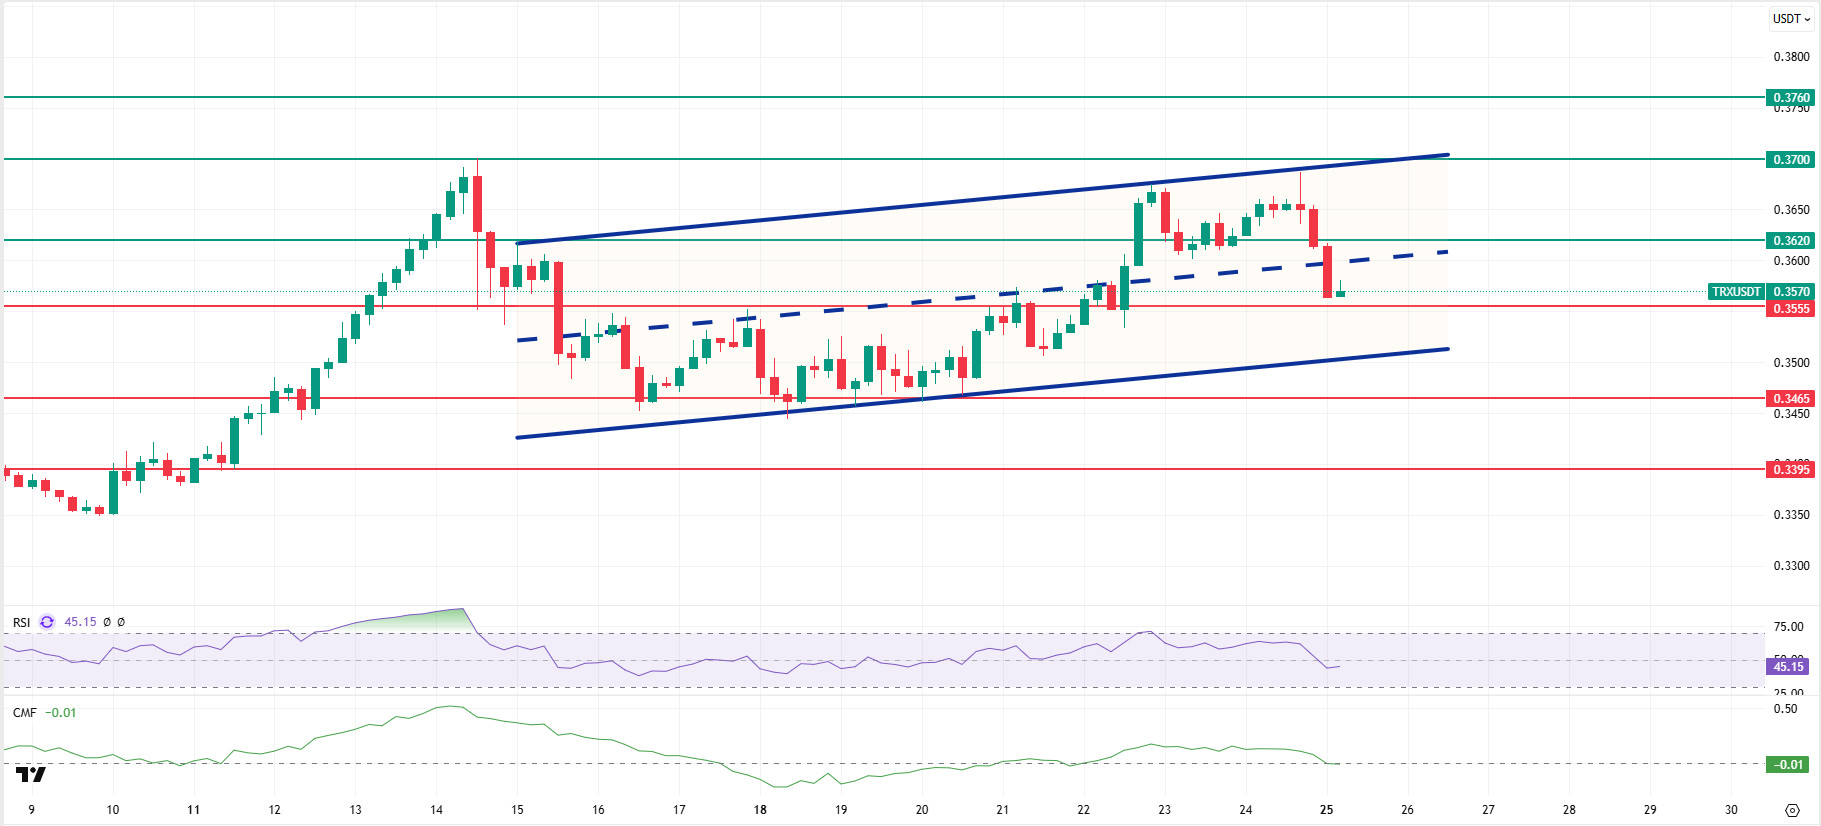
TRX closed last week at 0.3614 after a sudden drop in the market and is currently trading at 0.3570. TRX, which is below the middle band of the bullish channel, is trading close to the 0.3555 support level on the 4-hour chart. The Relative Strength Index (RSI) value is at 45, indicating that it is in the sell zone. Additionally, the Chaikin Money Flow (CMF) indicator has dropped below the zero level, entering the negative zone. The CMF remaining in the negative zone serves as confirmation of a downtrend signal and also indicates a decrease in capital inflows.
In light of all these indicators, TRX may continue its movement within the bullish channel today and test the 0.3555 support level. If it closes below this support level, it may continue its downward movement and test the 0.3465 support level by moving towards the lower band of the channel. If it cannot close below the 0.3555 support level, it may move toward the channel’s middle band with a buying reaction that could form as the CMF moves into positive territory, testing the 0.3620 resistance level.
On the 4-hour chart, 0.3465 is an important support level, and as long as it remains above this level, the upward momentum is expected to continue. A break below this support level could increase selling pressure.
Supports 0.3555 – 0.3465 – 0.3395
Resistance levels: 0.3620 – 0.3700 – 0.3760
SUI/USDT
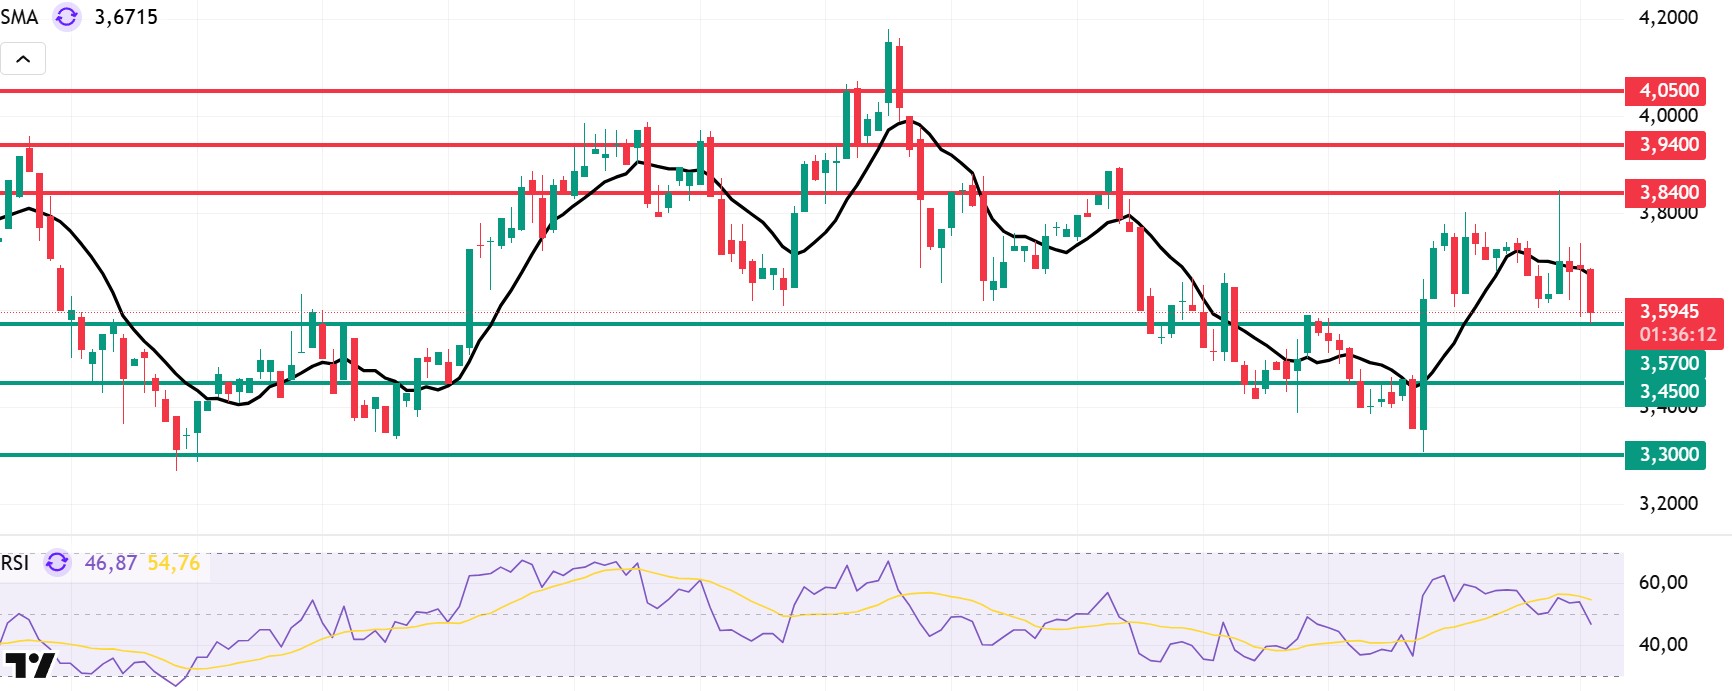
Looking at Sui’s technical outlook, the price has declined on a weekly basis to around 3.59 dollars, influenced by fundamental developments. The Relative Strength Index (RSI) is currently in the 46.87 – 54.76 range. This value range indicates that the market is close to the selling zone; a weakening of the RSI to the 35.00 – 40.00 range could signal a potential buying point. If the price moves upward, the resistance levels of $3.84, $3.94, and $4.05 can be monitored. However, if the price falls to new lows, it could indicate that selling pressure is intensifying. In this case, the $3.57 and $3.45 levels stand out as strong support zones. In particular, in the event of sharp sell-offs, a pullback to 3.57 dollars is technically possible.
According to Simple Moving Averages (SMA) data, Sui’s average price is currently at the 3.67 dollar level. If the price remains below this level, it could signal that the current downtrend may continue technically. The upward trend of the SMA also supports this scenario.
Support levels: 3.30 – 3.45 – 3.57
Resistance levels: 3.84 – 3.94 – 4.05
Legal Notice
The investment information, comments, and recommendations contained herein do not constitute investment advice. Investment advisory services are provided individually by authorized institutions taking into account the risk and return preferences of individuals. The comments and recommendations contained herein are of a general nature. These recommendations may not be suitable for your financial situation and risk and return preferences. Therefore, making an investment decision based solely on the information contained herein may not produce results in line with your expectations.


