Technical Analysis
BTC/USDT
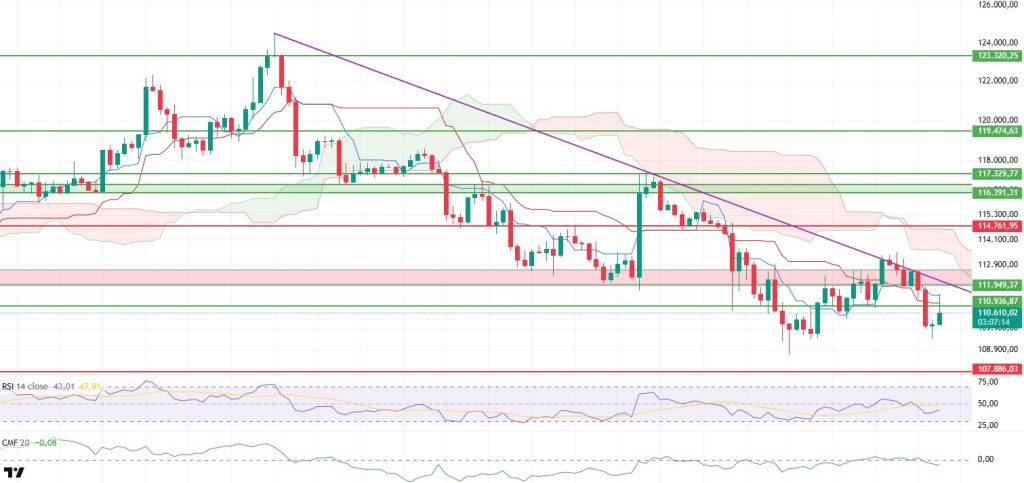
After breaking below the $110,936 support level, the BTC price experienced a pullback due to intensifying selling pressure during the day. However, this decline was limited, and the price recovered, rising back to the Tenkan level. Facing selling pressure once again from this area indicates that the market cannot sustain upward momentum in the short term. In particular, the inability of buyers to show sufficient strength at this level reveals that the market is still moving within a weak equilibrium and that there is insufficient volume for a trend reversal.
When examining technical indicators, the Relative Strength Index (RSI) turning upward is noteworthy. This movement indicates that the price is attempting to recover from the oversold zone and that momentum is gradually strengthening. However, since the RSI has not yet managed to establish a sustained structure above critical thresholds, this recovery signal alone is insufficient to create strong expectations for an upward trend. On the other hand, the Chaikin Money Flow (CMF) indicator’s slight decline back into negative territory reveals that limited liquidity outflows from the market are continuing and that buyers have not yet been able to generate a strong capital inflow. This scenario limits the price’s short-term recovery attempts.
When examining the Ichimoku indicator, the price being rejected once again from the Tenkan level and continuing to move below the Kumo cloud clearly shows that the overall trend remains weak and the negative bias in the short-term outlook is maintained. Remaining below the Kumo cloud indicates that the market is technically in a downtrend and upward movements can only be sustained with strong buyer support.
The critical threshold that will determine the direction of price movements in the short term is highlighted as the $111,949 level. If this level is breached and sustained, the BTC price is expected to continue its upward momentum, recover, and move towards higher resistance zones. However, if the price closes below this region, it could pave the way for the downtrend to continue and initiate a gradual pullback towards the $107,886 support level. Weak volume data and the CMF indicator remaining in negative territory particularly increase the likelihood of this scenario.
The overall technical outlook of the market indicates a weak short-term picture but with potential for recovery. The upward recovery signals in the RSI could turn into a stronger buyer response if the price breaks above the critical resistance level. However, until this is confirmed, the price remaining below the cloud will continue to cause the downtrend to persist.
Support levels: 107.886 – 105.332 – 103.794
Resistance levels: 110,936 – 111,949 – 114,761
ETH/USDT
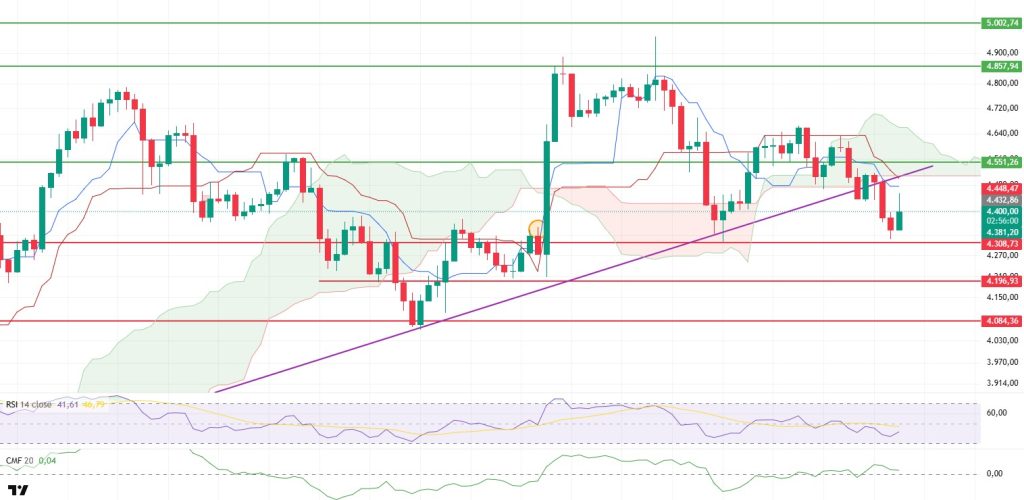
Despite yesterday evening’s upward attempts, the ETH price failed to break through the strong kijun resistance at the $4,634 level and retreated to the $4,400 region as of this morning. With the price falling below the kumo cloud, signs of a weakening technical outlook have become apparent. Continued trading below the tenkan and kijun levels indicates that the short-term trend remains under downward pressure and that buyers are losing momentum.
The Chaikin Money Flow (CMF) indicator remaining in positive territory indicates that liquidity inflows into the market have not completely dried up and that buyers are still active to a certain extent. However, the slight weakening of the indicator signals a slight decline in buyer appetite, confirming the price’s weakness in this region. This scenario suggests that rallies may remain limited unless strong support forms in the spot market.
Although the Relative Strength Index (RSI) indicator remains below both the 50 level and the underlying moving average, its slight recovery trend indicates that the price has not weakened excessively, even if it does not constitute a strong signal supporting momentum. The RSI rising above the 50 level stands out as a critical signal that would strengthen the likelihood of a recovery in the short term.
The overall technical outlook indicates that the market remains indecisive and unable to choose a strong direction. Remaining below the Kumo cloud technically indicates that the downtrend remains dominant and that upward movements may encounter selling pressure at resistance levels. The $4,551 level is the first short-term resistance point, and if the price fails to break through this area, the risk of pullbacks deepening towards the $4,310 level may increase.
On the other hand, if the price manages to stay above $4,551, it could pave the way for the decline to be limited and for a short-term recovery to begin. However, for a clear trend reversal, the price needs to rise above both the Tenkan and Kijun levels. The resurgence of liquidity flow and the acceleration of the recovery in the , and RSI are emerging as the most critical factors that could pave the way for an upward breakout.
Support levels: 4,308 – 4,196 – 4,084
Resistance levels: 4,551 – 4,857 – 5,000
XRP/USDT
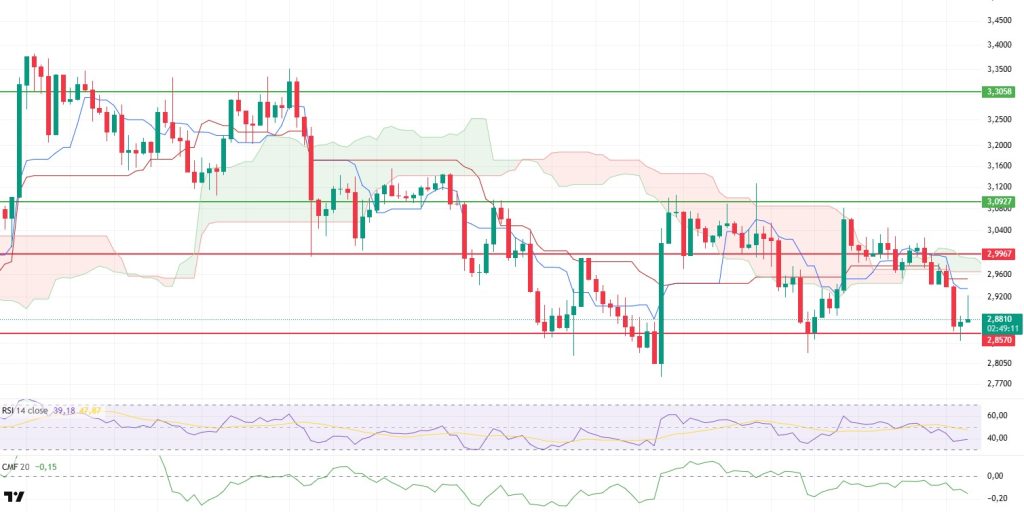
The XRP price failed to hold at the $2.99 level and fell to $2.87. The price falling below the Kumo cloud and trading below both the Tenkan and Kijun levels indicates that the downtrend is becoming more pronounced from a technical perspective and that buyers are losing their influence in the market. Additionally, the sell signal formed by the Tenkan cutting below the Kijun further strengthens the short-term negative outlook.
The Chaikin Money Flow (CMF) indicator remaining in negative territory clearly indicates that liquidity is continuing to flow out of the market and buyer appetite is weakening. This situation makes it difficult for the price to find strong support during upward reaction attempts and increases the risk of deeper declines.
Although the Relative Strength Index (RSI) indicator remains below the 50 level and the short-term average, its slight recovery trend indicates that the downward momentum has weakened somewhat for now. However, since this weak recovery in the RSI is not strong enough to change the price direction, it seems more likely that selling pressure will be maintained in the short term.
In the Ichimoku indicator, the price moving below the kumo cloud, remaining below the tenkan and kijun levels, and a negative crossover signal clearly indicate that the market is technically continuing its downtrend. This structure suggests that the price may encounter selling pressure from resistance zones during upward attempts.
In the short term, the $2.85 level has become a critical support zone for price movements. If this level cannot be maintained, selling pressure could intensify further, and the price could drop deeper toward the $2.80 range. In upward reaction attempts, the first resistance point is at the $2.99 level. However, if the price fails to rise above the tenkan and kijun levels again, recoveries will remain limited.
The overall outlook indicates that XRP has a weak technical picture in the short term and that the downward trend is likely to continue unless there is a strong buyer reversal. For momentum to recover, the RSI needs to rise above the 50 level and the CMF needs to move back into positive territory. Until these signals are confirmed, downward pressure will continue to weigh on the market.
Support levels: $2.8570 – $2.7462 – $2.6513
Resistance levels: 2.9967 – 3.0927 – 3.3058
SOL/USDT
Solana has pledged $500,000 to the Tornado Cash developer.
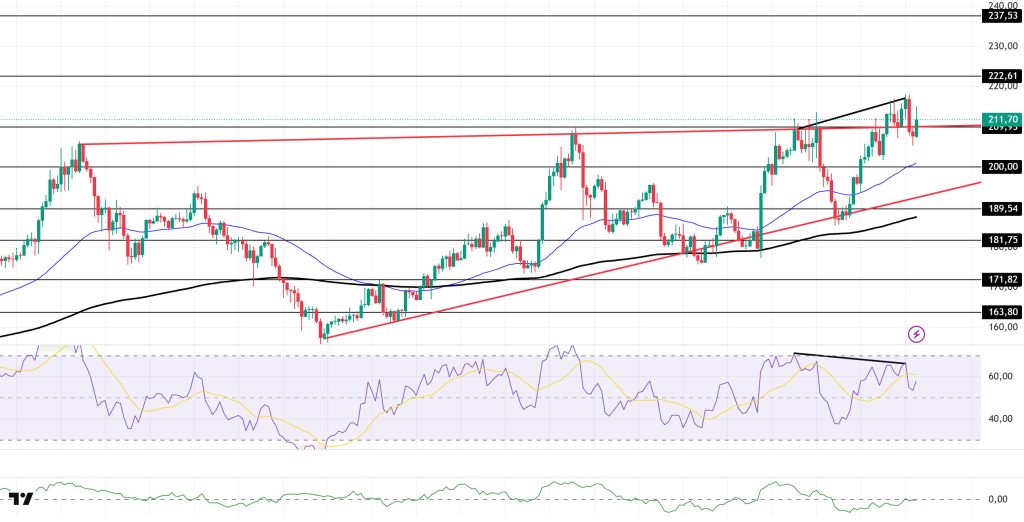
SOL experienced a pullback during the day and failed to find support at the ceiling level of the rising wedge formation that began on August 2, returning to within the formation. If the upward trend continues, the $222.61 level could be monitored. If the pullback deepens, the $200.00 level and the 50 EMA (Exponential Moving Average – Blue Line) could be tested again as support.
On the 4-hour chart, the 50 EMA (Exponential Moving Average – Blue Line) remained above the 200 EMA (Black Line). This indicates that the medium-term upward trend may continue. At the same time, the price being above both moving averages shows us that the market is trending upward in the short term. The Chaikin Money Flow (CMF-20) also remained at a neutral level. However, a decrease in money inflows could push the CMF into negative territory. The Relative Strength Index ( -14) remained in positive territory. This signaled that buying pressure was continuing. However, a bearish divergence could prolong the pullback. In the event of an uptrend driven by macroeconomic data or positive news related to the Solana ecosystem, the $222.61 level stands out as a strong resistance point. If this level is broken upwards, the uptrend is expected to continue. In the event of pullbacks due to developments in the opposite direction or profit-taking, the $200.00 level could be tested. A decline to these support levels could increase buying momentum, presenting a potential opportunity for an uptrend.
Supports: 200.00 – 189.54 – 181.75
Resistances: 209.93 – 222.61 – 237.53
DOGE/USDT
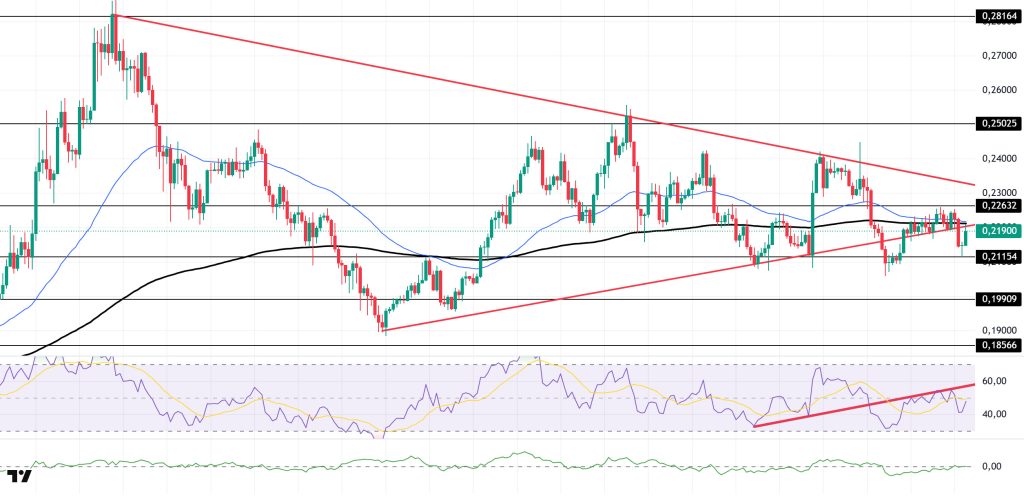
The DOGE price experienced a decline during the day. The asset broke below the base level of the symmetrical triangle formation that began on August 2 and tested the strong support level of $0.21154, experiencing a slight increase. Currently, the price, which has gained slight momentum, is testing the base level of the symmetrical triangle formation as resistance. If the pullback continues, the $0.19909 level should be monitored.
The 50 EMA (Exponential Moving Average – Blue Line) and 200 EMA (Black Line) being very close to each other on the 4-hour chart indicates that the market is in a decision-making phase. The price being below both moving averages also indicates that the asset is trending downward in the short term. The Chaikin Money Flow (CMF-20) has retreated to a neutral level. Additionally, a decrease in money inflows could push the CMF into negative territory. The Relative Strength Index (RSI-14) remains in negative territory. At the same time, it continues to trade below the upward trend that began on August 19. A break above this level could trigger buying pressure. In the event of an uptrend driven by political developments, macroeconomic data, or positive news flow in the DOGE ecosystem, the $0.25025 level stands out as a strong resistance zone. Conversely, in the event of negative news flow ( ), the $0.19909 level could be triggered. A decline to these levels could increase momentum and potentially initiate a new upward wave.
Supports: 0.21154 – 0.19909 – 0.18566
Resistances: 0.22632 – 0.25025 – 0.28164
TRX/USDT
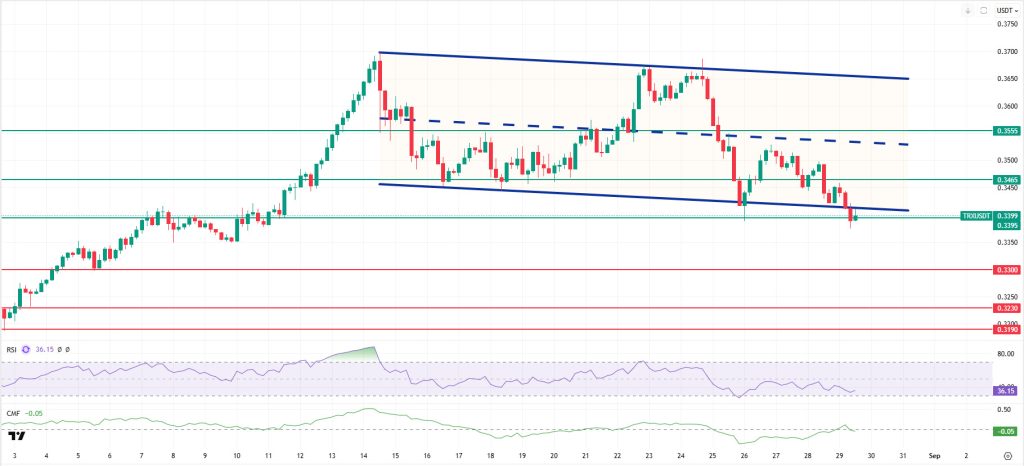
As mentioned in this morning’s analysis, TRX failed to stay above the 0.3395 support level after the decline and is currently trading at 0.3399, as there was no buying reaction from the lower band of the bearish channel. TRX, which has broken below the bearish channel, is currently trading near the 0.3395 resistance level on the 4-hour chart. The Relative Strength Index (RSI) value is very close to the oversold zone at 36. In addition, the Chaikin Money Flow (CMF) indicator remains below zero at -0.05, indicating continued money outflows. The CMF remaining in negative territory can be seen as an indicator that the decline may continue.
In light of all these indicators, TRX may rise slightly to test the 0.3465 resistance level in order to continue its movement within the bearish channel in the second half of the day. A candle close above this resistance could allow it to continue its upward movement and move towards the channel’s middle band, potentially testing the 0.3555 resistance level. If it fails to close above the 0.3465 resistance level, it may continue to move away from the channel due to the continuation of capital outflows that may occur with the CMF remaining in negative territory. As a result, it may test the 0.3300 and 0.3230 support levels in sequence.
On the 4-hour chart, 0.3190 is an important support level, and as long as it remains above this level, the upward trend is expected to continue. If this support is broken, selling pressure is expected to increase.
Supports: 0.3300 – 0.3230 – 0.3190
Resistances 0.3395 – 0.3465 – 0.3555
SUI/USDT
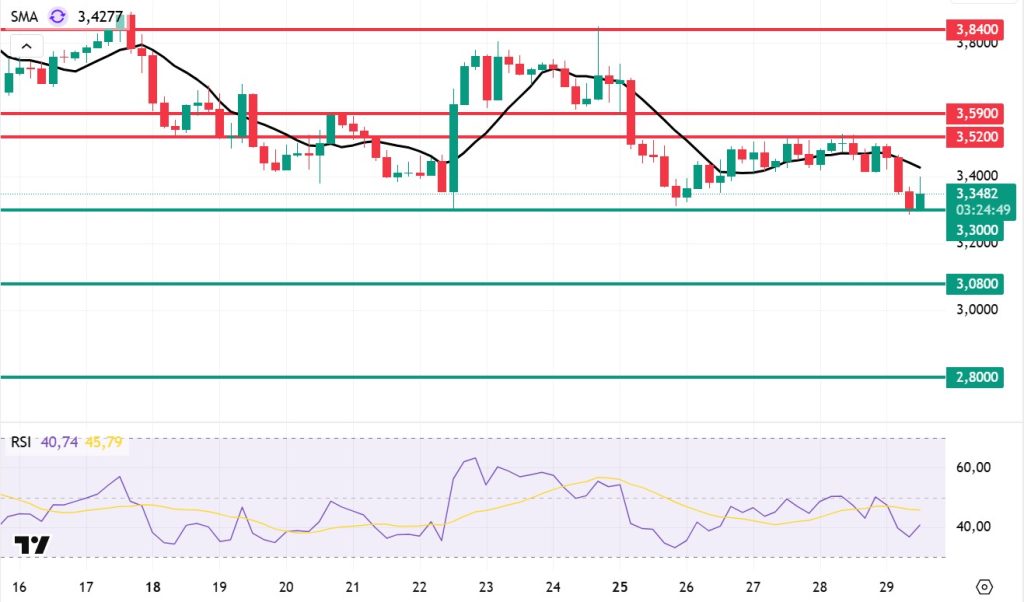
Looking at Sui’s technical outlook, we see that the price has declined on a weekly basis to around $3.34, influenced by fundamental developments. The Relative Strength Index (RSI) is currently in the 40.74 – 45.79 range. This range indicates that the market is trading close to the sell zone; however, if the RSI weakens and falls to the 30.00 – 35.00 range, it could signal a potential buying point. If the price moves upward, the $3.52 – $3.59 – $3.84 levels can be monitored as resistance points. However, if the price falls to new lows, it could indicate that selling pressure may deepen. In this case, the $3.30 and $3.08 levels stand out as strong support zones. In particular, in the event of a sharp sell-off, a pullback to $2.80 appears technically possible.
According to Simple Moving Averages (SMA) data, Sui’s average price is currently at $3.42. The price remaining below this level indicates that the current downtrend could technically continue. The downward trend of the SMA also supports this situation.
Supports: 2.80 – 3.08 – 3.30
Resistances: 3.52 – 3.59 – 3.84
Legal Notice
The investment information, comments, and recommendations contained herein do not constitute investment advice. Investment advisory services are provided individually by authorized institutions taking into account the risk and return preferences of individuals. The comments and recommendations contained herein are of a general nature. These recommendations may not be suitable for your financial situation and risk and return preferences. Therefore, making an investment decision based solely on the information contained herein may not produce results in line with your expectations.


