
Technical Analysis
BTC/USDT
U.S. President Donald Trump stated that there is almost no inflation in the country and that prices are falling, adding that the tariffs imposed have brought trillions of dollars in revenue to the U.S. It was reported that if Stephen Milan is confirmed to the Fed Board of Governors, the number of Trump’s supporters would increase to three, and if Cook is removed from office, a majority could be secured on the board. Japan-based Metaplanet purchased an additional 1,009 BTC, increasing its total holdings to 20,000 BTC. Strategy President Michael Saylor shared a message on his social media account saying, “Bitcoin is still on sale,” hinting at new Bitcoin purchases.
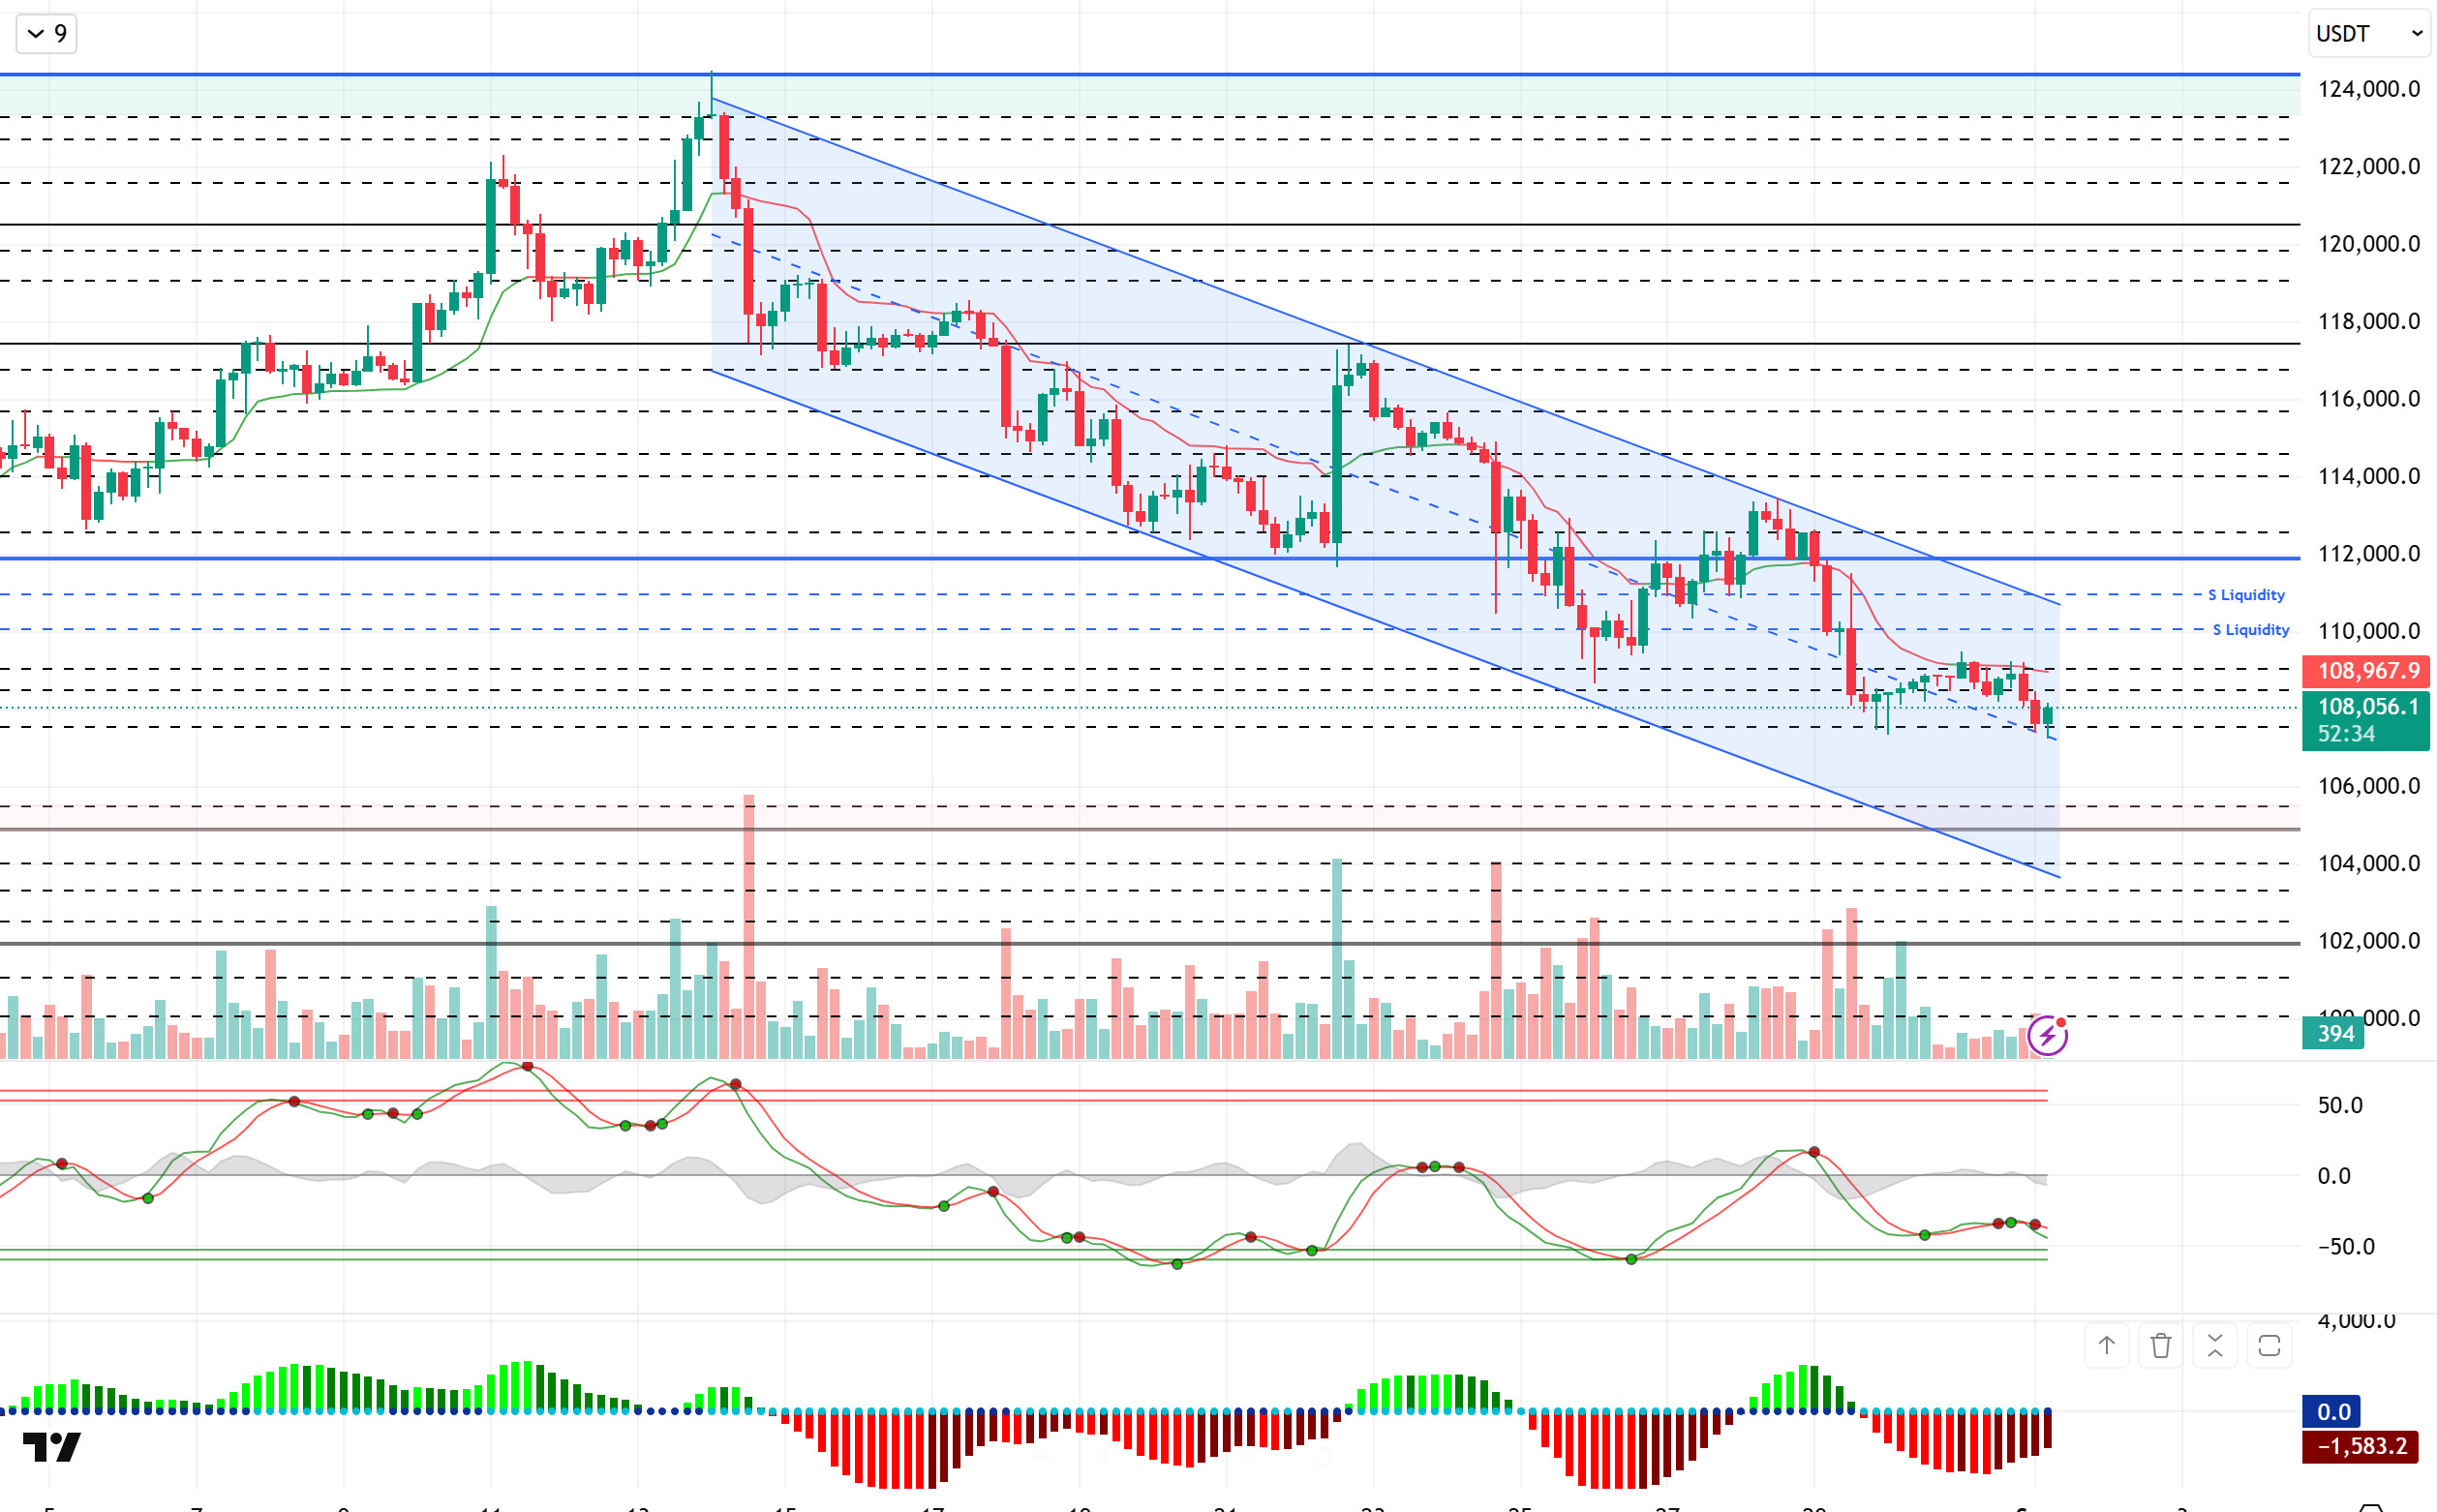
Looking at the technical picture, the downtrend recorded since the 124,000 ATH level tested on August 14 continues to deepen. BTC, which occasionally makes upward attacks within the parallel trend channel, is unable to hold above the 110,000 level. The price, which fell back to the 107,400 level it tested, is trying to rebound from there. BTC, which shows an indecisive picture in price movements, continues to trade around 108,000 at the time of writing.
Technical indicators reveal the price’s indecisive nature, with the Wave Trend oscillator (WT) giving buy/sell signals in the oversold zone, while the Squeeze Momentum (SM) indicator’s histogram is attempting to gain strength in the negative zone. The Kaufman moving average is currently trading above the price at the 109,000 level.
Looking at liquidity data, we see that short-term sell-side transactions have accumulated intensively within the 109,000-110,000 band, while buy-side transactions have been liquidated at the 107,000 level.
In summary, the disappearance of the recent optimistic mood due to fundamental developments, despite expectations of a Fed rate cut, Fed Chairman Powell’s failure to make a definitive statement, and renewed pressure on the market regarding tariffs are the main factors causing prices to retreat. Technically, the formation of a suitable ground for a new upward movement, supported by sell positions in liquidity data, could initiate a new upward trend for BTC following the bottoming movement. In this context, the re-emergence of catalysts in the market is expected to create a driving force on prices. In a possible upward movement, the 110,000 level stands out as a liquidity area, and we will follow the 112,000 level along with momentum. If the decline deepens, 105,000 stands out as a reference area that has been tested many times before.
Supports: 107,400 – 105,000 – 103,000
Resistances: 108,500 – 110,000 – 112,000
ETH/USDT
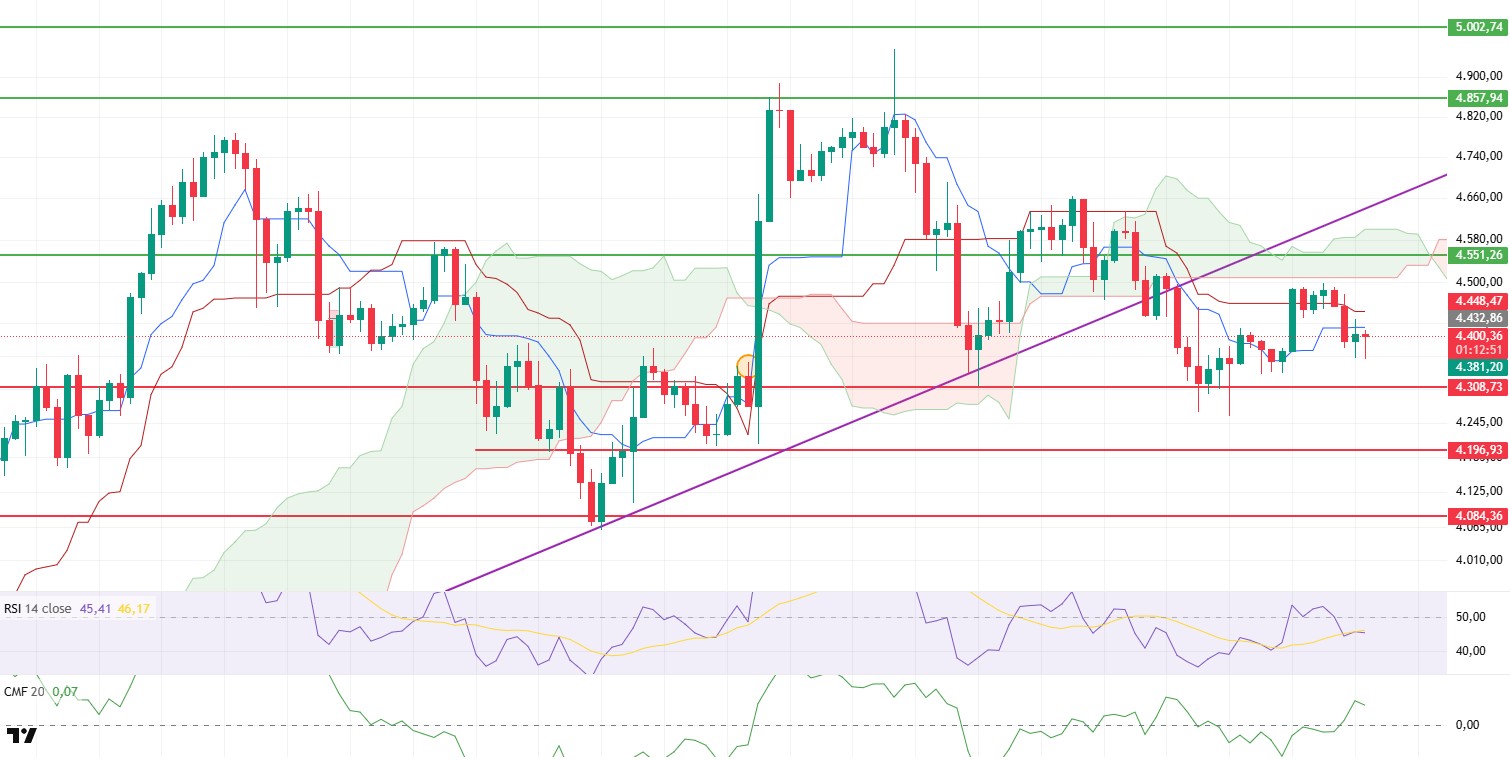
The ETH price, which fell below the $4,308 support level on Friday, showed a strong recovery over the weekend due to buying pressure, rising to the $4,500 region, which is the lower band of the cloud. However, after the weekly close, the price retreated again amid increased selling pressure and currently appears to be stabilizing around the $4,400 level.
The Chaikin Money Flow (CMF) indicator quickly moved into positive territory after the recent decline, signaling strong liquidity inflows into the market and that buyers continue to take positions in this area.
The fact that the price is trading below both the tenkan and kijun levels on the Ichimoku indicator shows that the downtrend is still dominant in the short term and that upward movements may remain limited. However, breaking above the middle band of the kumo cloud at $4,551 stands out as the most critical signal that could reverse this negative picture. Such a breakout could pave the way for momentum to gain strength and for the price to retest resistance levels above $4,600.
On the Relative Strength Index (RSI) side, momentum shows a slight strengthening with the price rising above the MA line. However, the RSI still hovering below the 50 level does not provide a strong signal that the trend has fully turned positive. This indicates that the price may follow a volatile course in the short term.
In the intraday view, breaking above the $4,446 kijun resistance could push the price towards the $4,551 region. However, the fact that the Ichimoku and RSI indicators are still producing weak signals suggests that selling pressure could intensify again if the $4,400 support level is broken. In such a scenario, the price could retreat to the $4,308 support level first, and then to the $4,250 region.
Top of Form
Below the Form
Support levels: 4,369 – 4,277 – 4,084
Resistance levels: 4,551 – 5,857 – 5,000
XRP/USDT
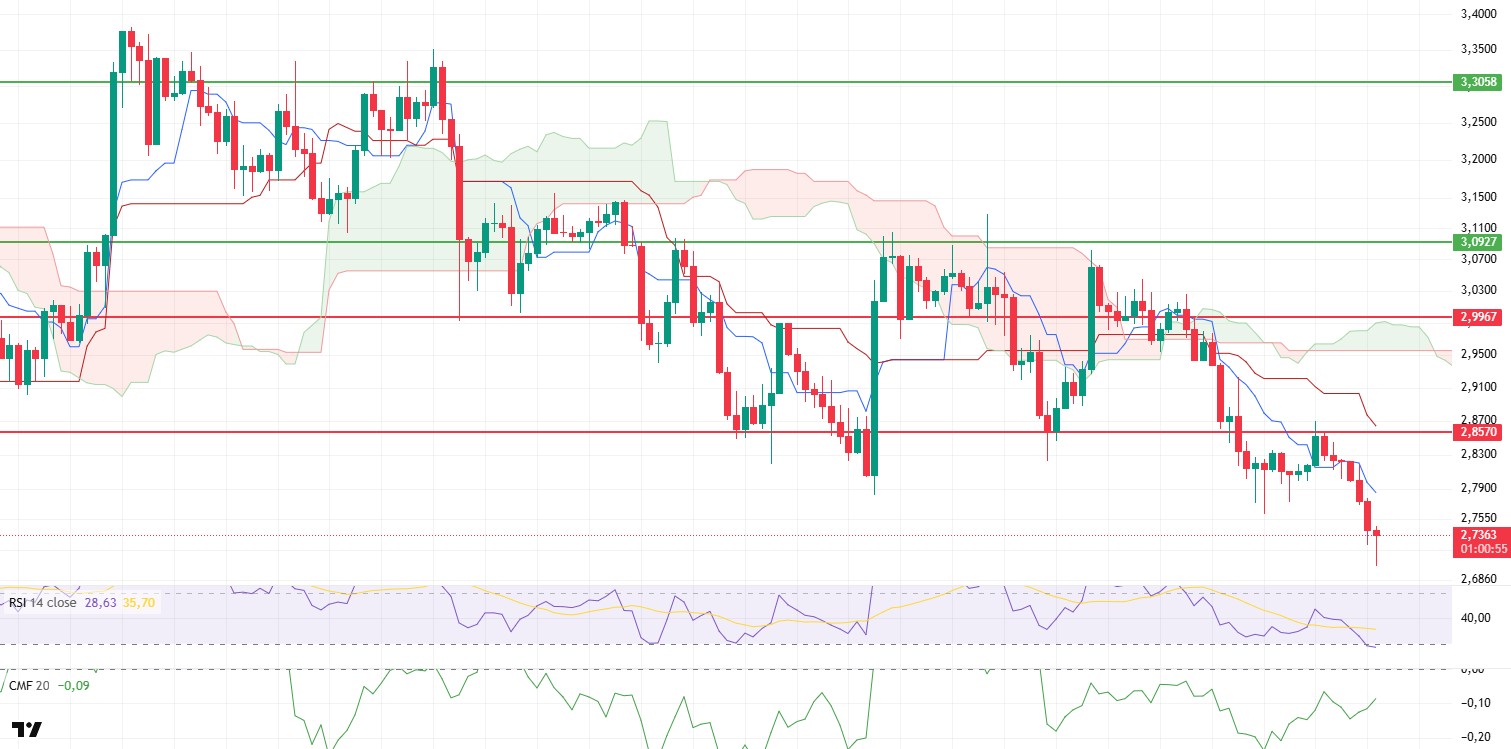
XRP continued the downtrend it started last Tuesday, losing critical support levels one by one. The price fell below the $2.99 support level, then quickly lost the $2.85 level as well, and after a weak retest of this area on Sunday, it fell to the $2.70 level. This movement indicates that selling pressure remains strong and buyers have been unable to mount a sufficient response in the defense zones.
Technical indicators maintain a weak outlook. The Relative Strength Index (RSI) has lost momentum throughout the downtrend, falling into oversold territory. Although this structure, where momentum is quite weak, signals that the downward trend may continue, the RSI being in the oversold zone could pave the way for a short-term rebound from these levels. The strength of this rebound will depend largely on liquidity flow.
The Ichimoku indicator confirms that the price remains in negative territory. The price movement, which is moving away from both the tenkan and kijun levels of the Kumo cloud, shows that the trend has clearly turned negative and that upward movements are limited for now. Unless this structure breaks, a sustained uptrend seems unlikely to begin.
Although the Chaikin Money Flow (CMF) indicator is in negative territory, it is giving a partial recovery signal. This suggests that limited liquidity inflows, albeit low, have begun and that these inflows could provide short-term support for the price.
In the daily view, the price’s attempt to form a bottom at the $2.70 level is noteworthy. With potential buying from this level, the price could retest the $2.85 resistance. However, failure to sustainably regain this region could lead to a deepening of the downtrend. In such a scenario, the possibility of the price retreating first to the $2.65 region and then to the $2.50 levels remains on the table.
Support levels: 2.8430 – 2.8045 – 2.7405
Resistance levels: 2.9830 – 3.0330 – 3.0705
SOL/USDT
Canary files updated the amended S-1 form for the Solana ETF. Over 99% of votes cast for Solana’s Alpenglow protocol were in favor.
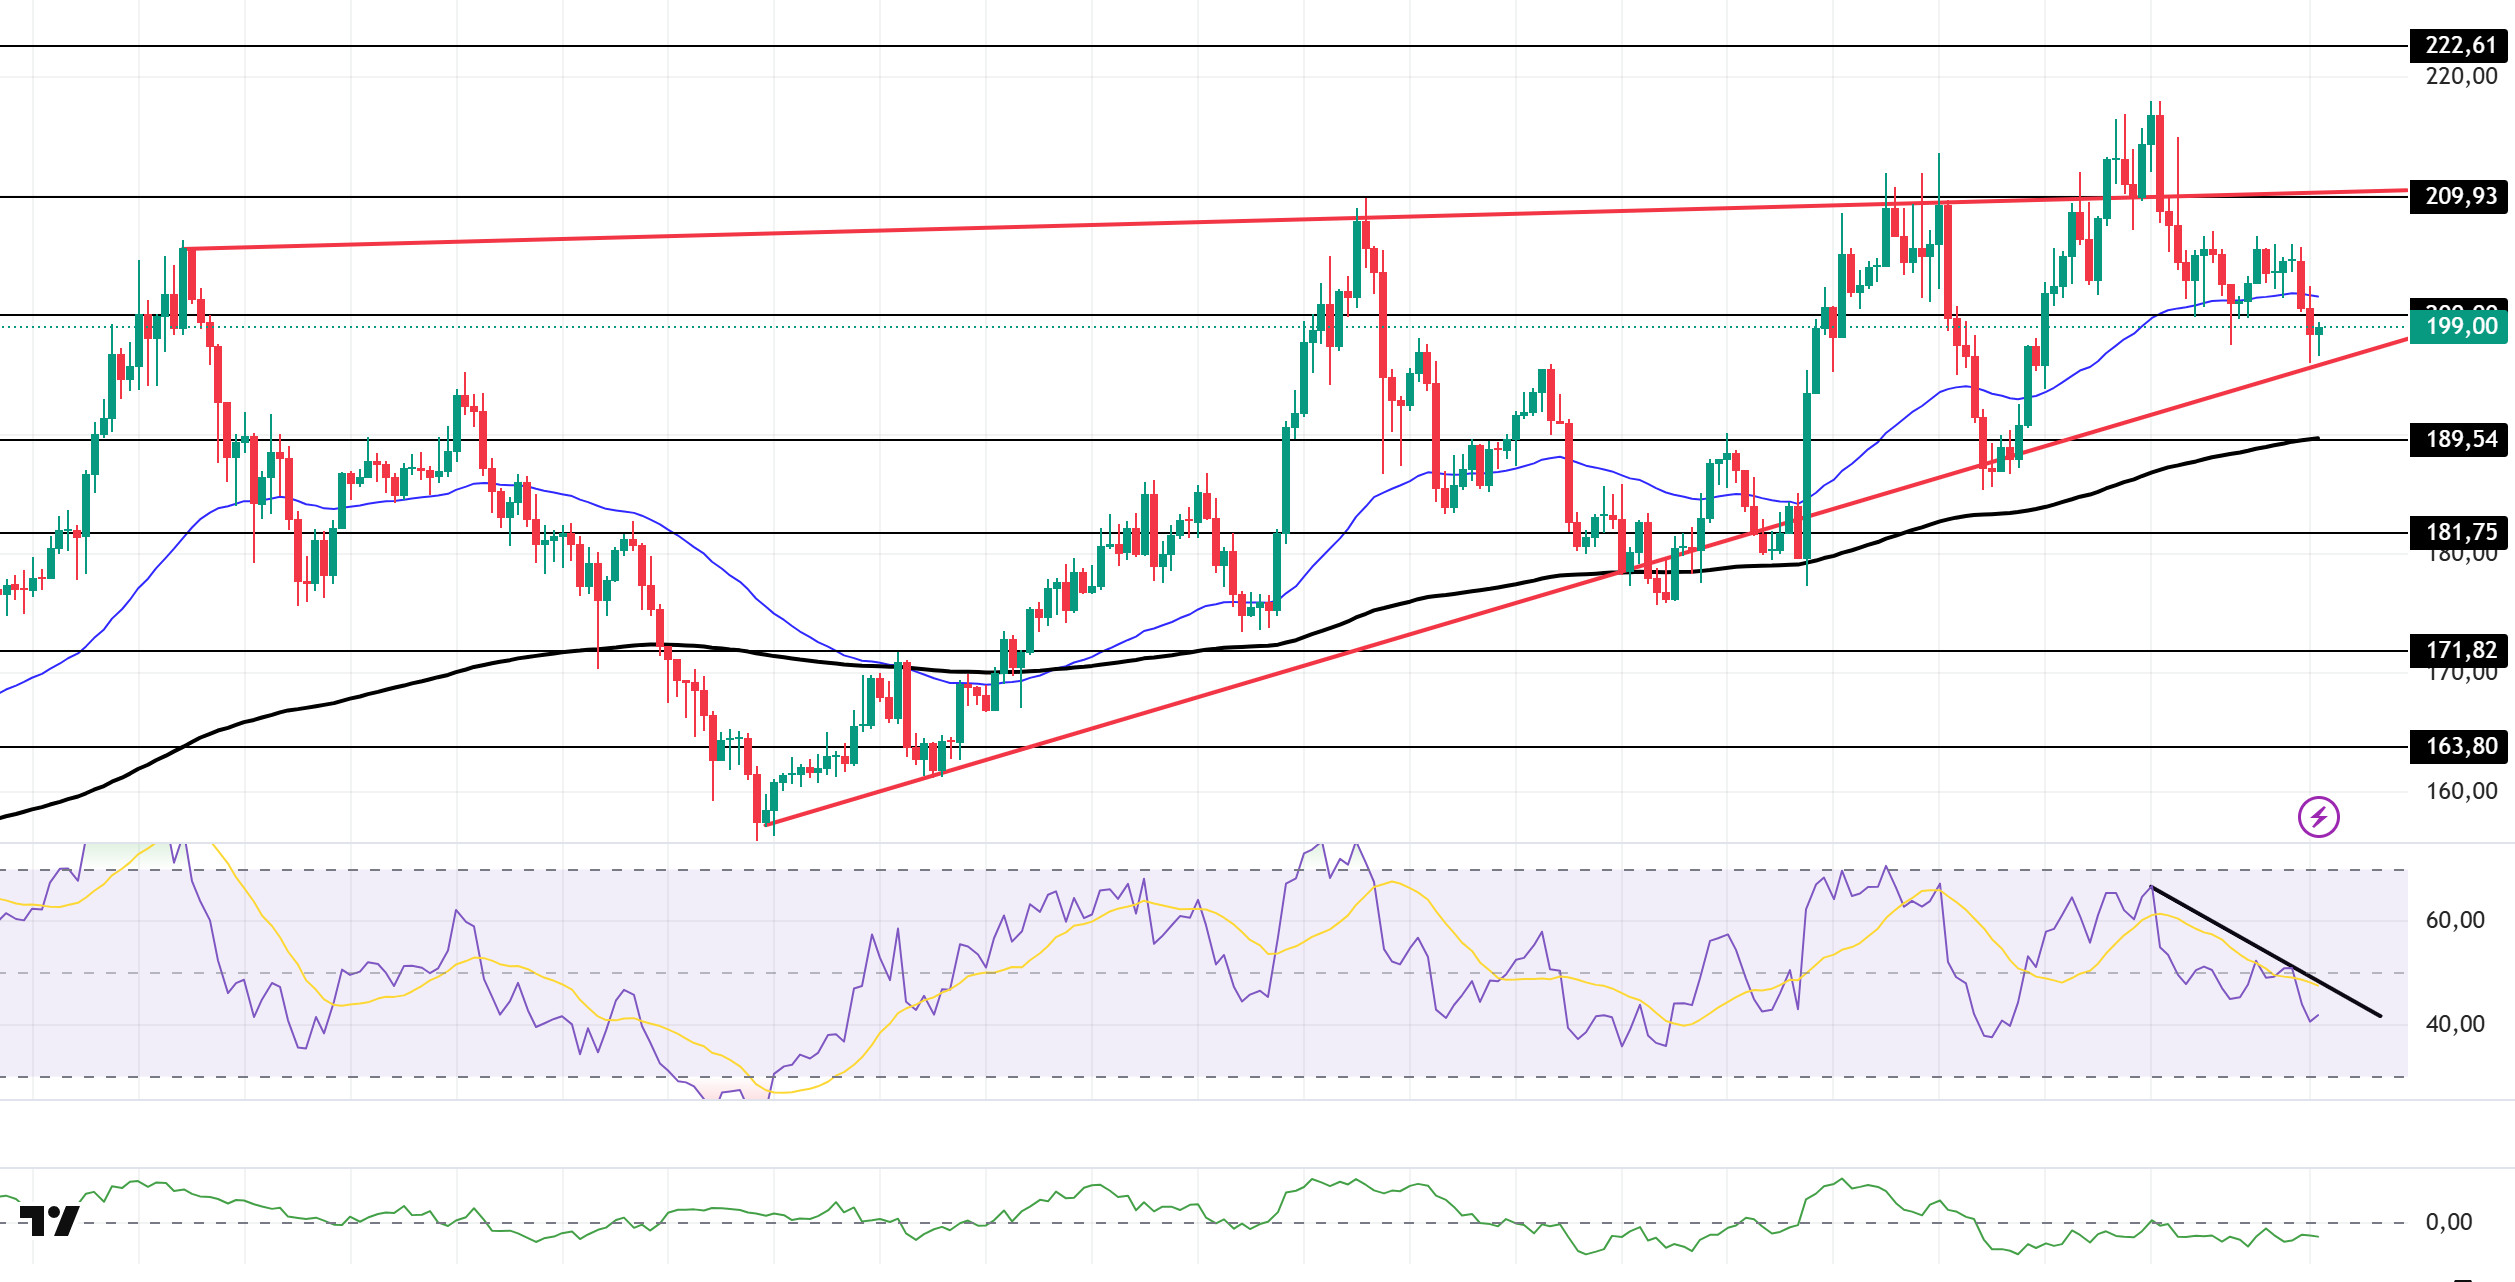
The SOL price experienced a pullback. The asset remained within the ascending wedge formation that began on August 2. The price, which tested the 50 EMA (Exponential Moving Average – Blue Line) moving average twice as support, failed to hold here and continued its decline. As of now, the price, which has retreated to the base level of the formation, is testing the base level of the formation. If it breaks this level, it may test the 200 EMA (Black Line) moving average as support. If the uptrend begins, the $209.93 level can be monitored.
On the 4-hour chart, the 50 EMA (Blue Line) remained above the 200 EMA (Black Line). This indicates that the medium-term upward trend may continue. At the same time, the price being between the two moving averages shows us that the market is in a decision-making phase in the short term. The Chaikin Money Flow (CMF-20) has moved into negative territory. A decrease in money inflows could push the CMF deeper into negative territory. The Relative Strength Index (RSI-14) has retreated from positive to negative territory. This indicates that selling pressure is continuing. It also remains below the downtrend that began on August 29. In the event of an upturn driven by macroeconomic data or positive news regarding the Solana ecosystem, the $209.93 level stands out as a strong resistance point. If this level is broken upwards, the uptrend is expected to continue. In the event of pullbacks due to developments in the opposite direction or profit-taking, the $189.54 level could be tested. A decline to these support levels could increase buying momentum, presenting a potential opportunity for an uptrend.
Supports: 189.54 – 181.75 – 171.82
Resistances: 200.00 – 209.93 – 222.61
DOGE/USDT
Elon Musk’s lawyer will oversee a $200 million Dogecoin treasury.
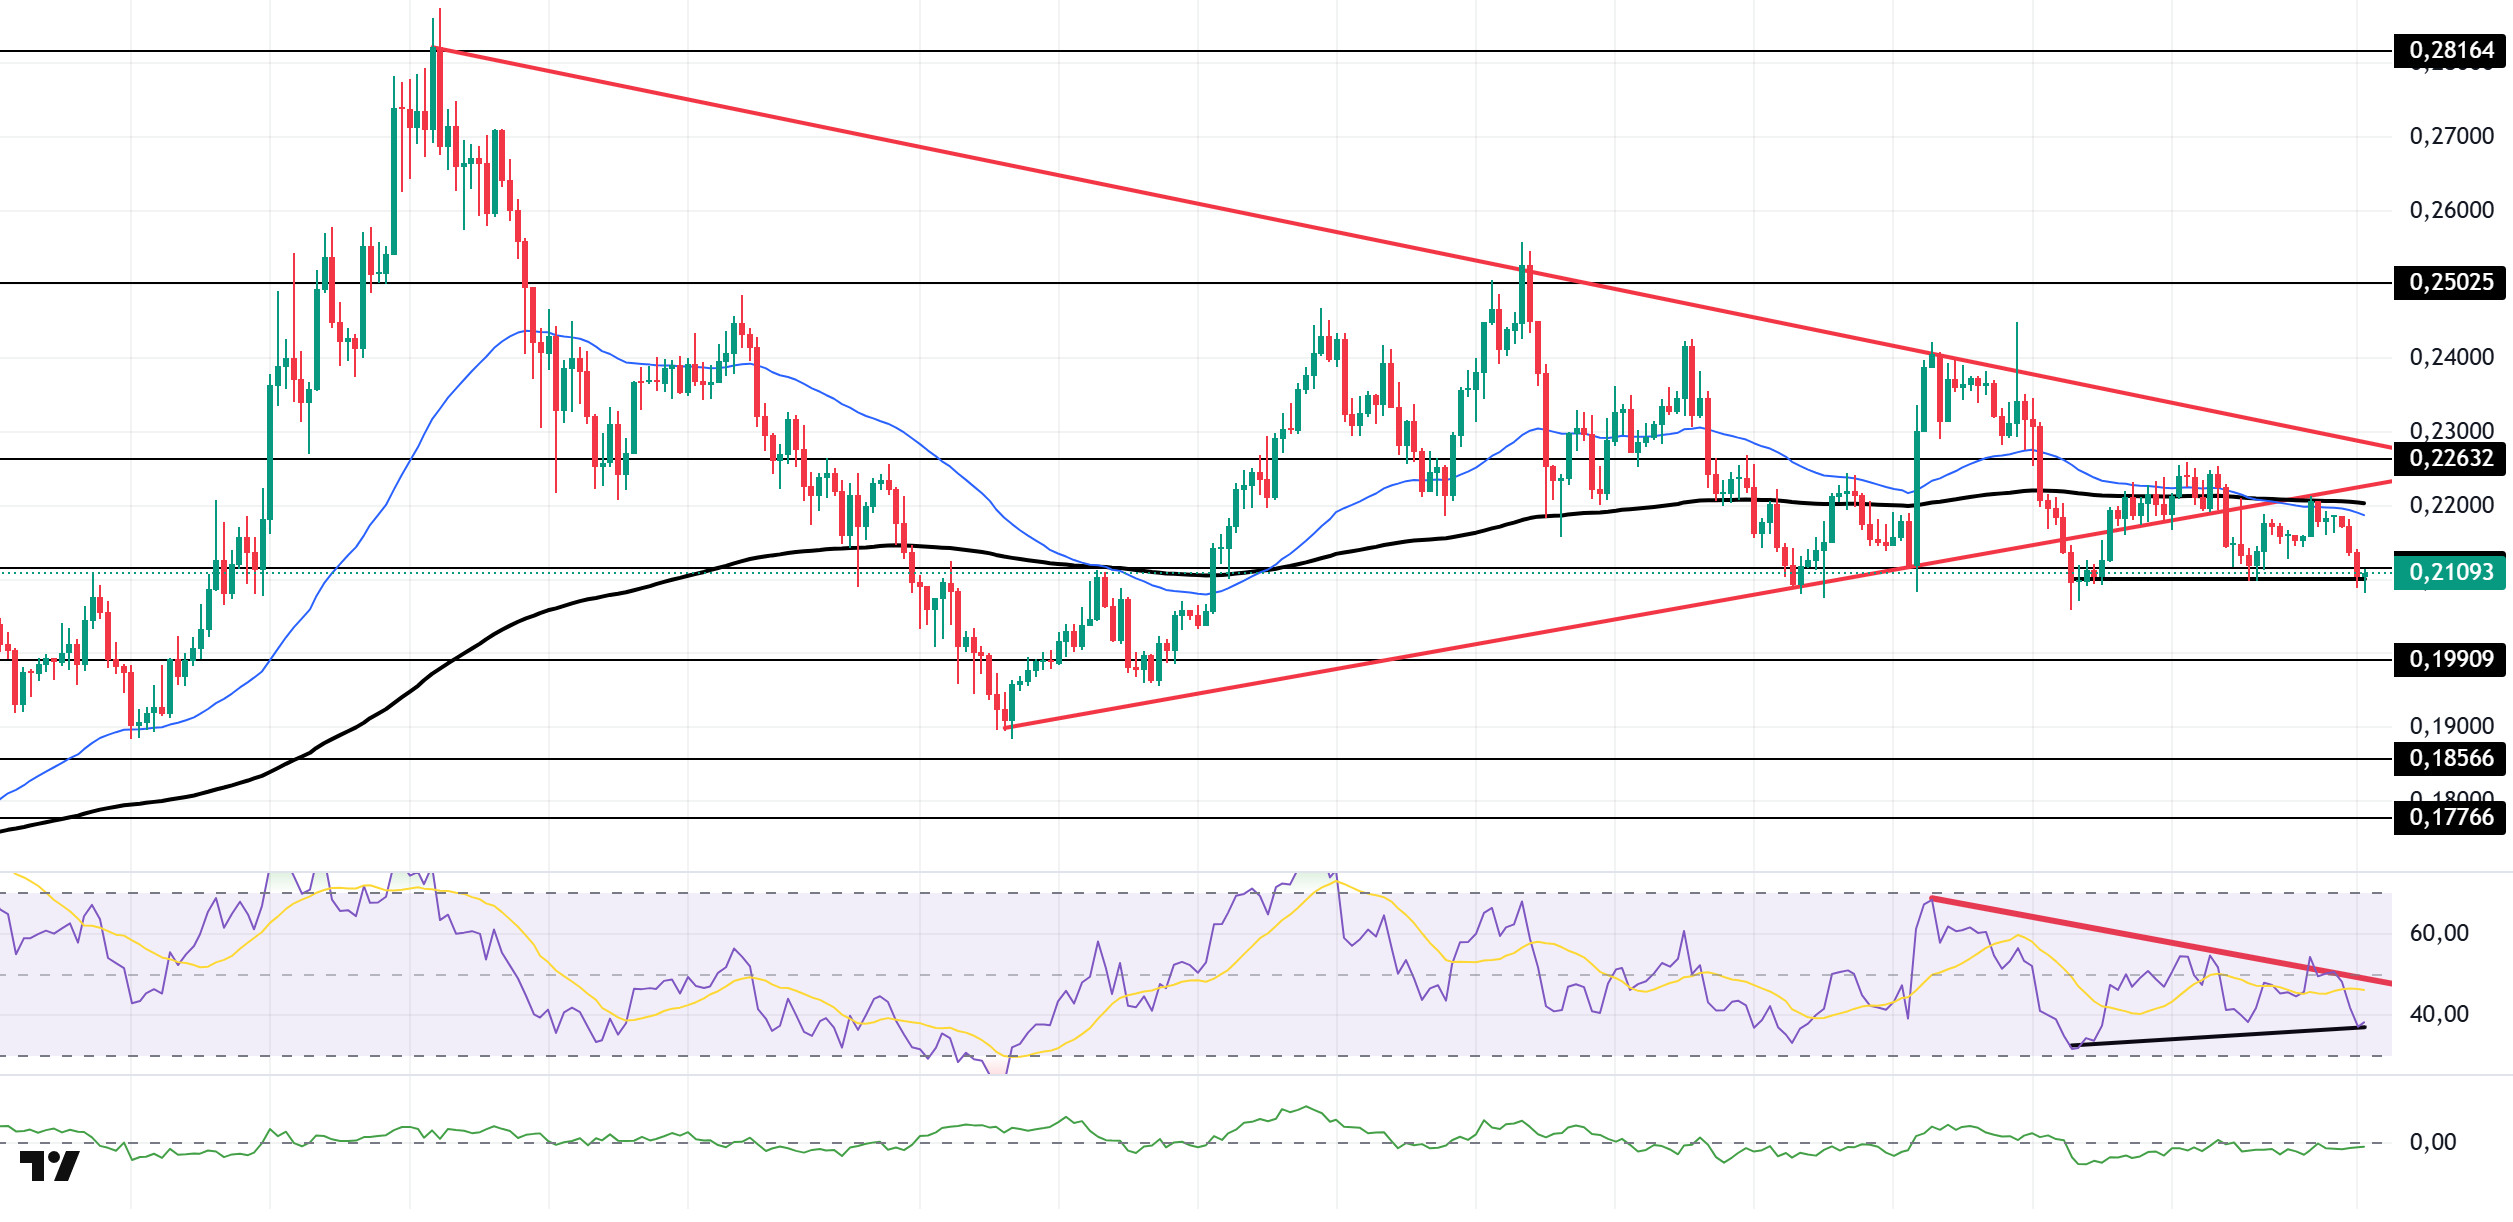
The DOGE price continued its decline. The asset broke below the base level of the symmetrical triangle formation that began on August 2 and tested the strong support level of $0.21154, experiencing a slight rise. Facing resistance from the 50 EMA (Exponential Moving Average – Blue Line) and 200 EMA (Black Line) moving averages, the price retreated again and remained below the symmetrical triangle formation. It is currently testing the strong support level of $0.21154. If the price closes below this level, the pullback may continue. If an uptrend begins, the moving averages can be monitored.
On the 4-hour chart, the 50 EMA (Blue Line) has started to fall below the 200 EMA (Black Line). This indicates that a medium-term downward trend has begun. The price being below both moving averages also shows that the asset is in a downward trend in the short term. The Chaikin Money Flow (CMF-20) remained at a neutral level. Additionally, a decrease in money inflows could push the CMF into negative territory. The Relative Strength Index (RSI-14) continues to be in negative territory. It also remains below the downward trend that began on August 22. This indicates that selling pressure continues. Furthermore, bullish divergence could bring an uptrend. In the event of an uptrend driven by political developments, macroeconomic data, or positive news flow in the DOGE ecosystem, the $0.22632 level stands out as a strong resistance zone. Conversely, in the event of negative news flow, the $0.19909 level could be triggered. A decline to these levels could increase momentum and potentially initiate a new upward wave.
Supports: $0.19909 – $0.18566 – $0.17766
Resistances: 0.21154 – 0.22632 – 0.25025
TRX/USDT
Tron has been selected as one of nine blockchains by the U.S. Department of Commerce to record the release of the U.S. Gross Domestic Product (GDP) data for the second quarter of 2025.
As of August 31, 2025, the total amount of TRX staked is 45,689,188,193, which is 48.27% of the circulating supply. Compared to the previous day, there has been an increase of approximately 0.01% in the amount staked.
Additionally, a total of 3,915,576 TRX was burned yesterday, permanently removing 2,380,966 TRX from the circulating supply. This contributes to reducing inflationary pressure on the Tron network.
Technically speaking, TRX closed at 0.3410 yesterday after a decline near the close, and fell further in the morning hours to currently trade at 0.3378. Currently trading near the lower band of the bearish channel, TRX is priced just below the 0.3395 resistance level on the 4-hour chart. The Relative Strength Index (RSI) value is very close to the oversold zone at 38. In addition, the Chaikin Money Flow (CMF) indicator is also in negative territory at -0.17, indicating a decrease in cash inflows. This situation signals that the pressure from buyers in the market has weakened and that selling movements may gain short-term strength.
In light of all these indicators, TRX may rise slightly in the first half of the day, testing the 0.3395 resistance level based on its current position and RSI value. If it closes above this resistance level, it may continue to rise and move towards the middle band by entering the bearish channel. It may then attempt to test the 0.3465 resistance level. If it fails to close above the 0.3395 resistance level and the CMF continues its negative trend, it may decline further due to potential selling pressure and test the 0.3300 support level.
On the 4-hour chart, 0.3190 is an important support level, and as long as it remains above this level, the upward momentum is expected to continue. If this support is broken, selling pressure may increase.
Supports: 0.3300 – 0.3230 – 0.3190
Resistances: 0.3395 – 0.3465 – 0.3555
LTC/USDT
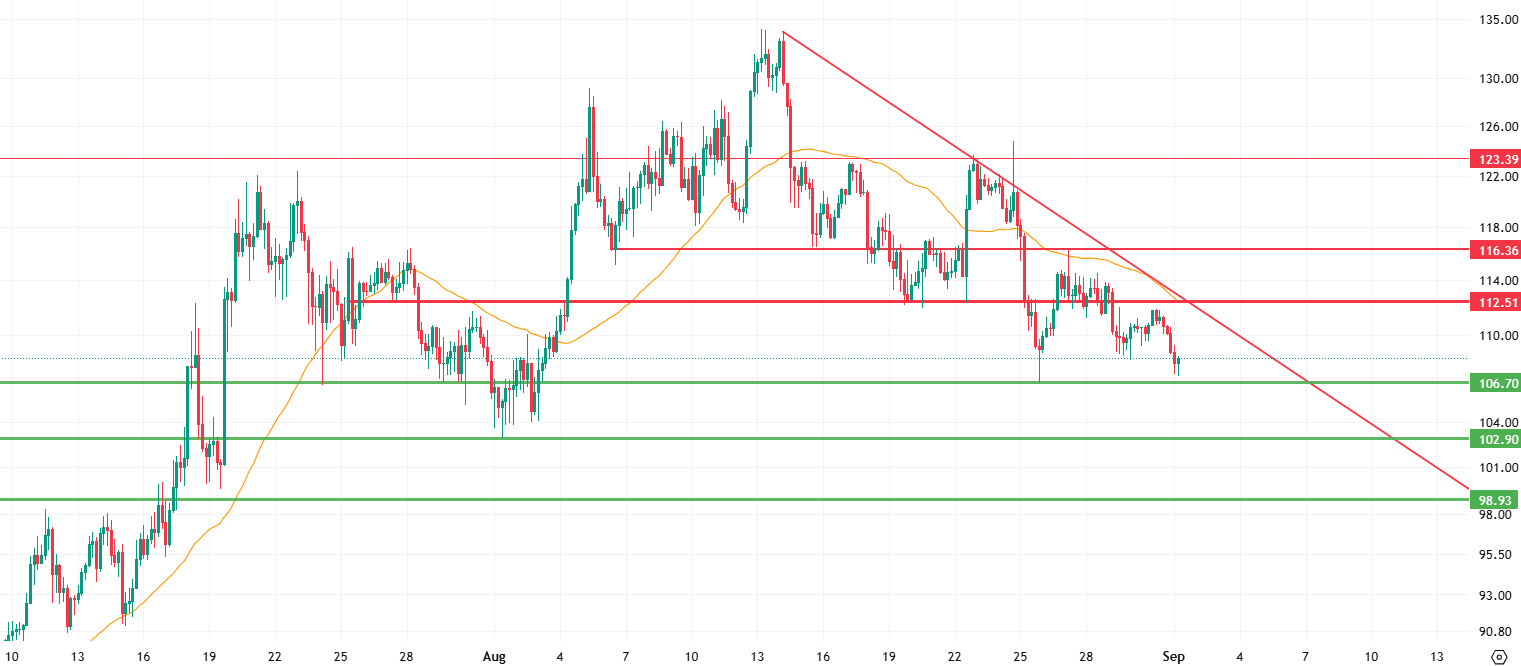
LTC started the day at 108.84, with a limited 0.65% pullback against USDT and a 0.40% decline against Bitcoin. LTC’s current situation shows a classic short-term downward trend. It continues to break through horizontal support levels under a falling trend within a horizontal support-resistance range.
Firstly, the 112.45 level is the most important threshold for a potential uptrend to begin, as it is the intersection point of both the falling trend line and the 50-period moving average (orange line). Sustained closes above this area would be the first confirmation that buyers are gaining strength. If resistance is broken with high volume, the short-term target will be 116.36, which will be a critical test for the sustainability of the uptrend; the price reaction here could determine the direction of the trend. If a strong hold is achieved above this level, the next focus will be the 123.39 level, and this area will stand out as a zone where buyer intensity may weaken and selling pressure may re-emerge.
If the 106.70 level is broken downwards, the probability of selling pressure gradually increasing and pulling the price back to the next support point at 102.90 will rise. The most critical factor to consider at this point will be the direction of the reaction from the 102.90 level; the reaction will play an important role in determining the short-term market trend. However, if a permanent break occurs below this band, the technical outlook will weaken significantly, and the possibility of selling deepening to the 98.93 level will increase.
Supports: 106.70 – 102.90 – 98.93
Resistances 112.45 – 116.36 – 123.39
SUI/USDT
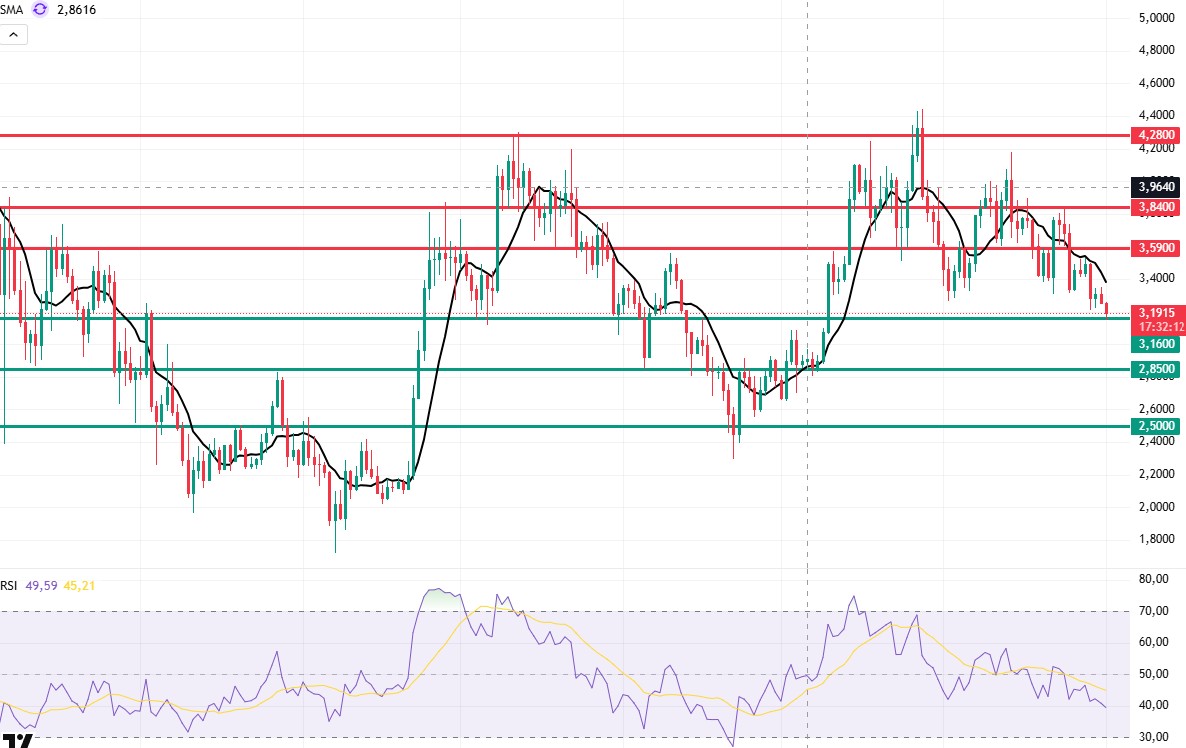
Looking at Sui’s technical outlook, we see that the price has declined on a weekly basis to around $3.19, influenced by fundamental developments. The Relative Strength Index (RSI) is currently in the range of 49.59 – 45.21. This range indicates that the market is trading close to the sell zone; however, if the RSI weakens and falls to the 30.00 – 35.00 range, it could signal a potential buying point. If the price moves upward, the resistance levels of $3.59, $3.84, and $4.28 can be monitored. However, if the price falls to new lows, it could indicate that selling pressure is intensifying. In this case, the $3.16 and $2.85 levels stand out as strong support zones. In particular, in the event of sharp sell-offs, a pullback to $2.50 appears technically possible.
According to Simple Moving Averages (SMA) data, Sui’s average price is currently at $2.86. The price remaining below this level indicates that the current downtrend could technically continue. The downward trend of the SMA also supports this situation.
Support levels: 2.50 – 2.85 – 3.16
Resistances: 3.59 – 3.84 – 4.28
Legal Notice
The investment information, comments, and recommendations contained herein do not constitute investment advice. Investment advisory services are provided individually by authorized institutions taking into account the risk and return preferences of individuals. The comments and recommendations contained herein are of a general nature. These recommendations may not be suitable for your financial situation and risk and return preferences. Therefore, making an investment decision based solely on the information contained herein may not produce results in line with your expectations.

