
Weekly Ethereum Onchain Report – September 03
Active Addresses
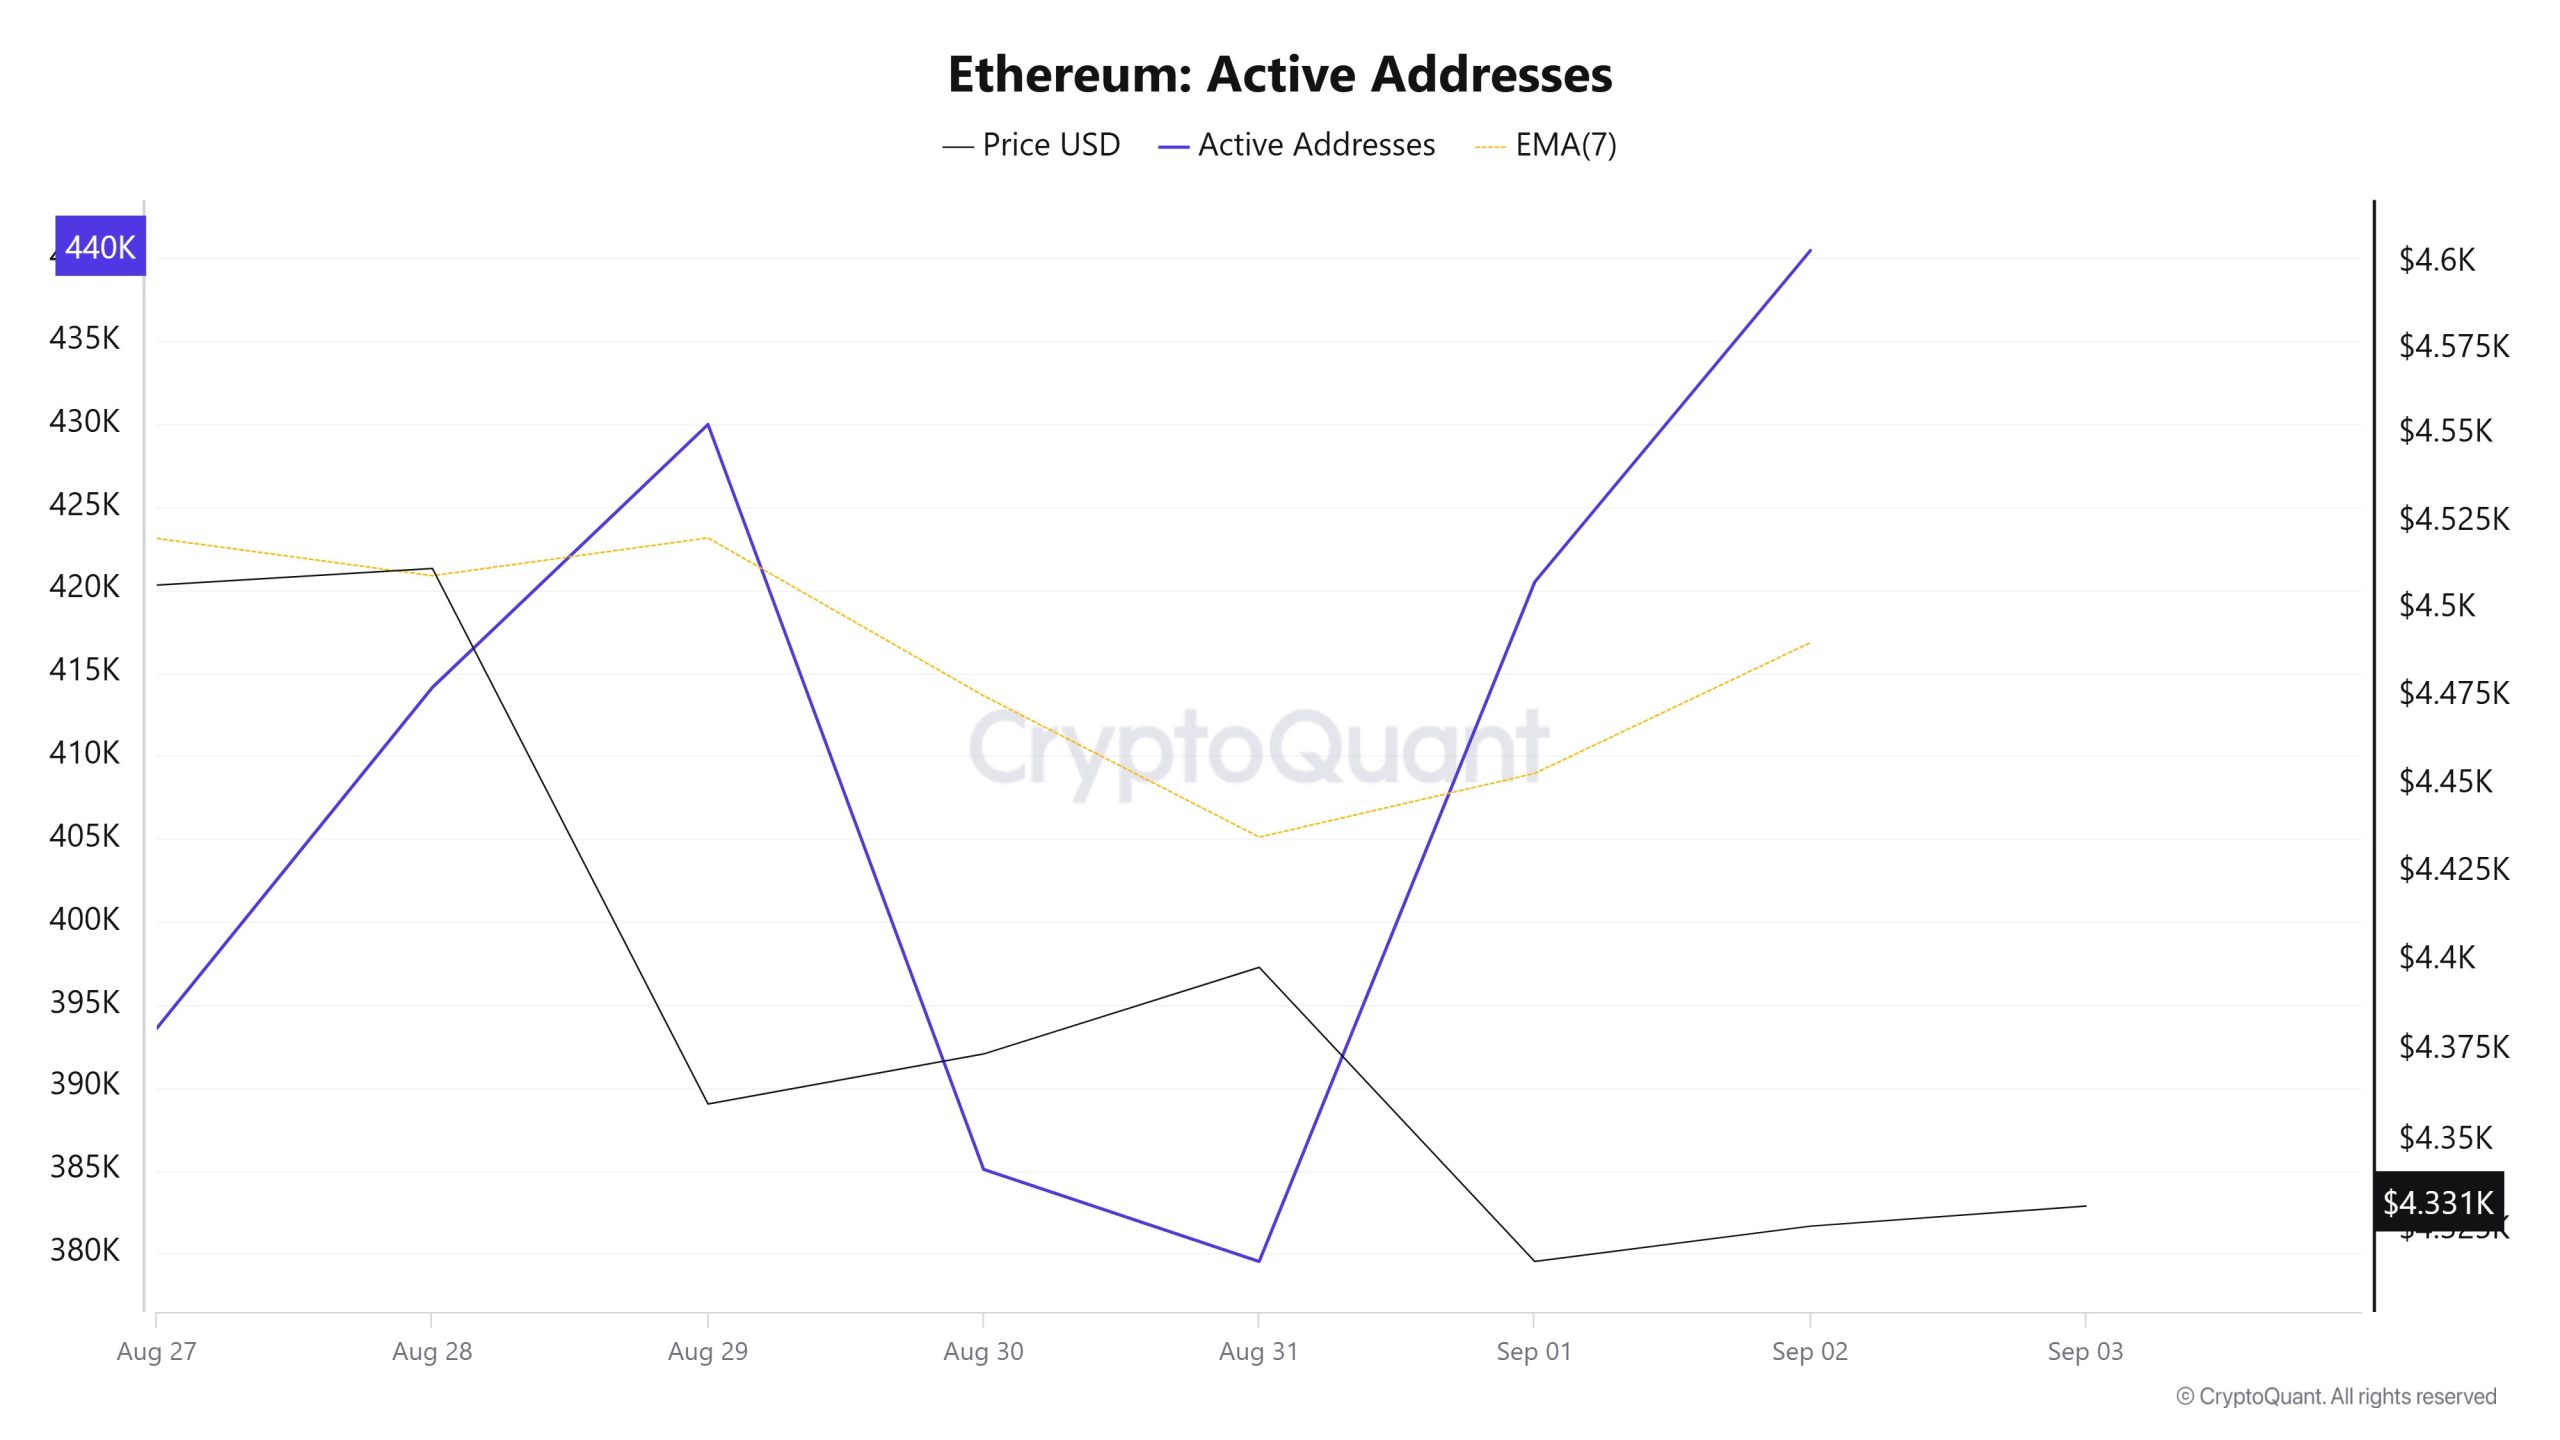
Between August 27 and September 3, a total of 440,468 active addresses entered the Ethereum network. During this period, the Ethereum price dropped from $4,511 to $4,316. Especially on August 28, at the intersection of the price and the number of active addresses, the number of active addresses increased while the price followed a downward trend. When the 7-day simple moving average (SMA) is analyzed, it is seen that a downward trend is generally dominant in the Ethereum price.
Active Sending Addresses
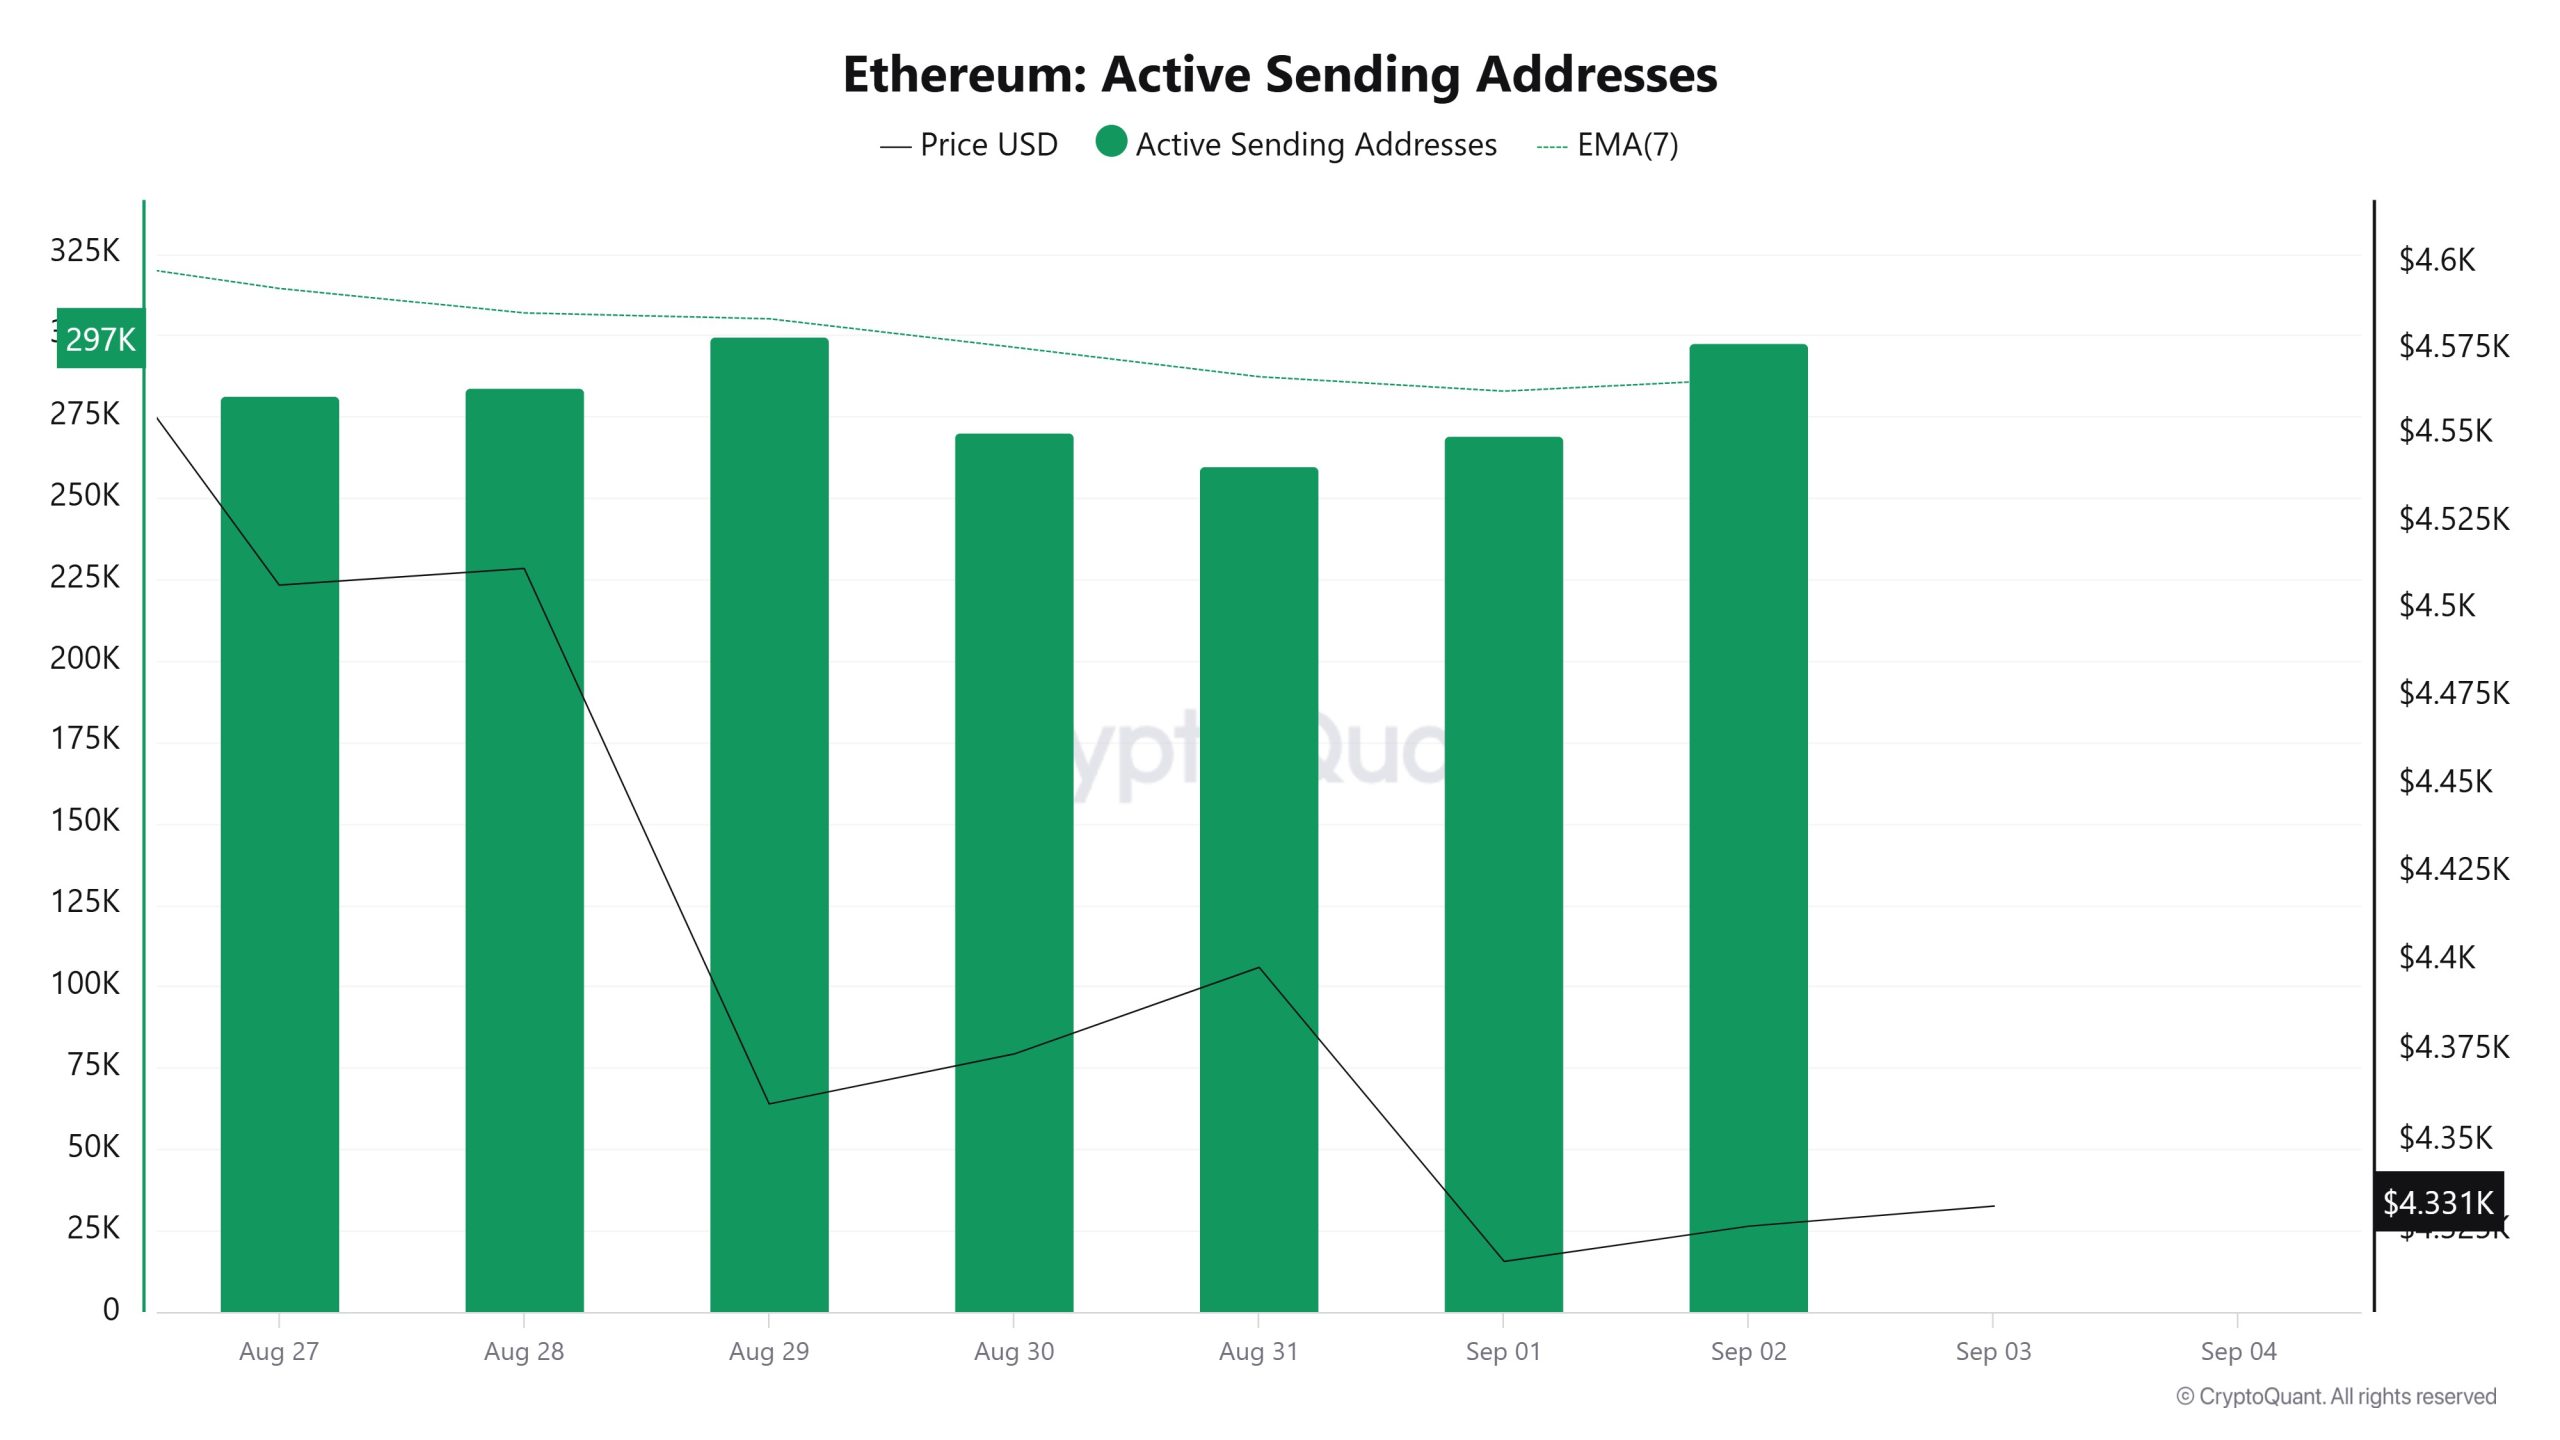
Between August 27 and September 3, a downward movement was observed in active shipping addresses with the Black Line (price line). On the day when the price reached a weekly high, active sending addresses were observed at 284,228.
Active Receiving Addresses
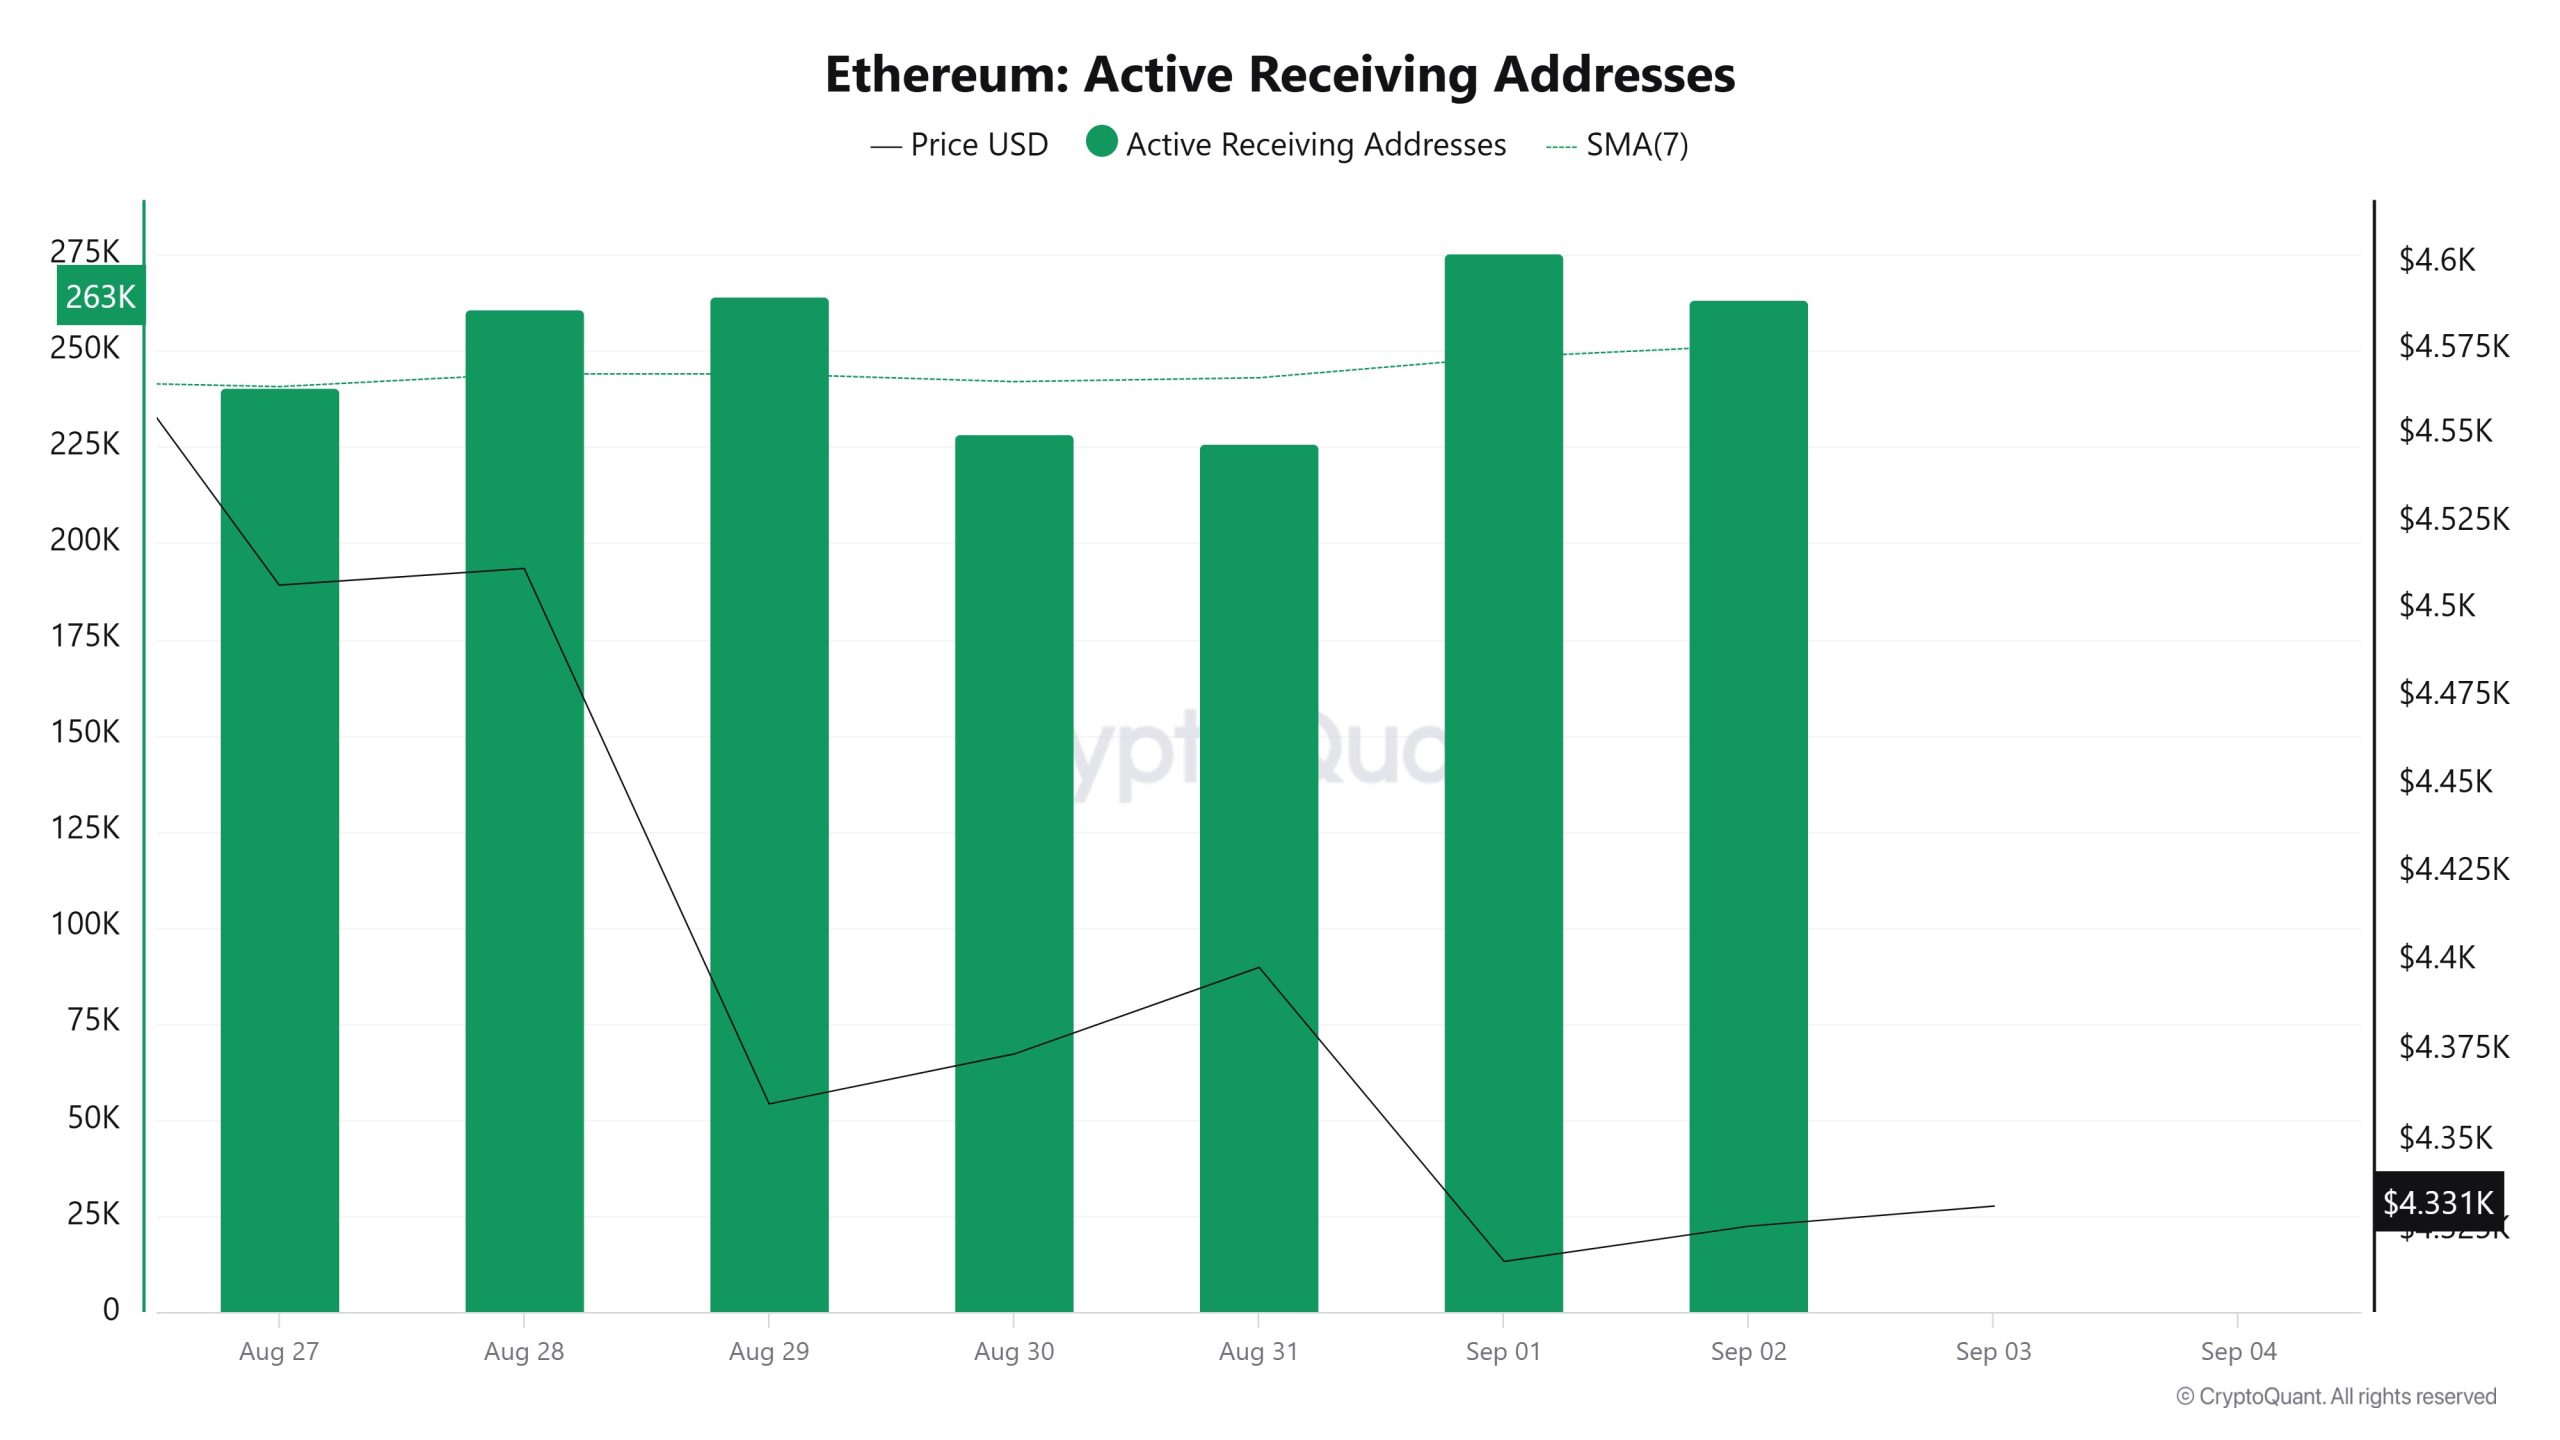
Between August 27 and September 3, there was a rise in active buying addresses and a corresponding consolidation of the price on the downside. On the day when the price reached its highest level, the active receiving addresses reached up to 261,147 levels, indicating that sales were predominant.
Total Value Staked
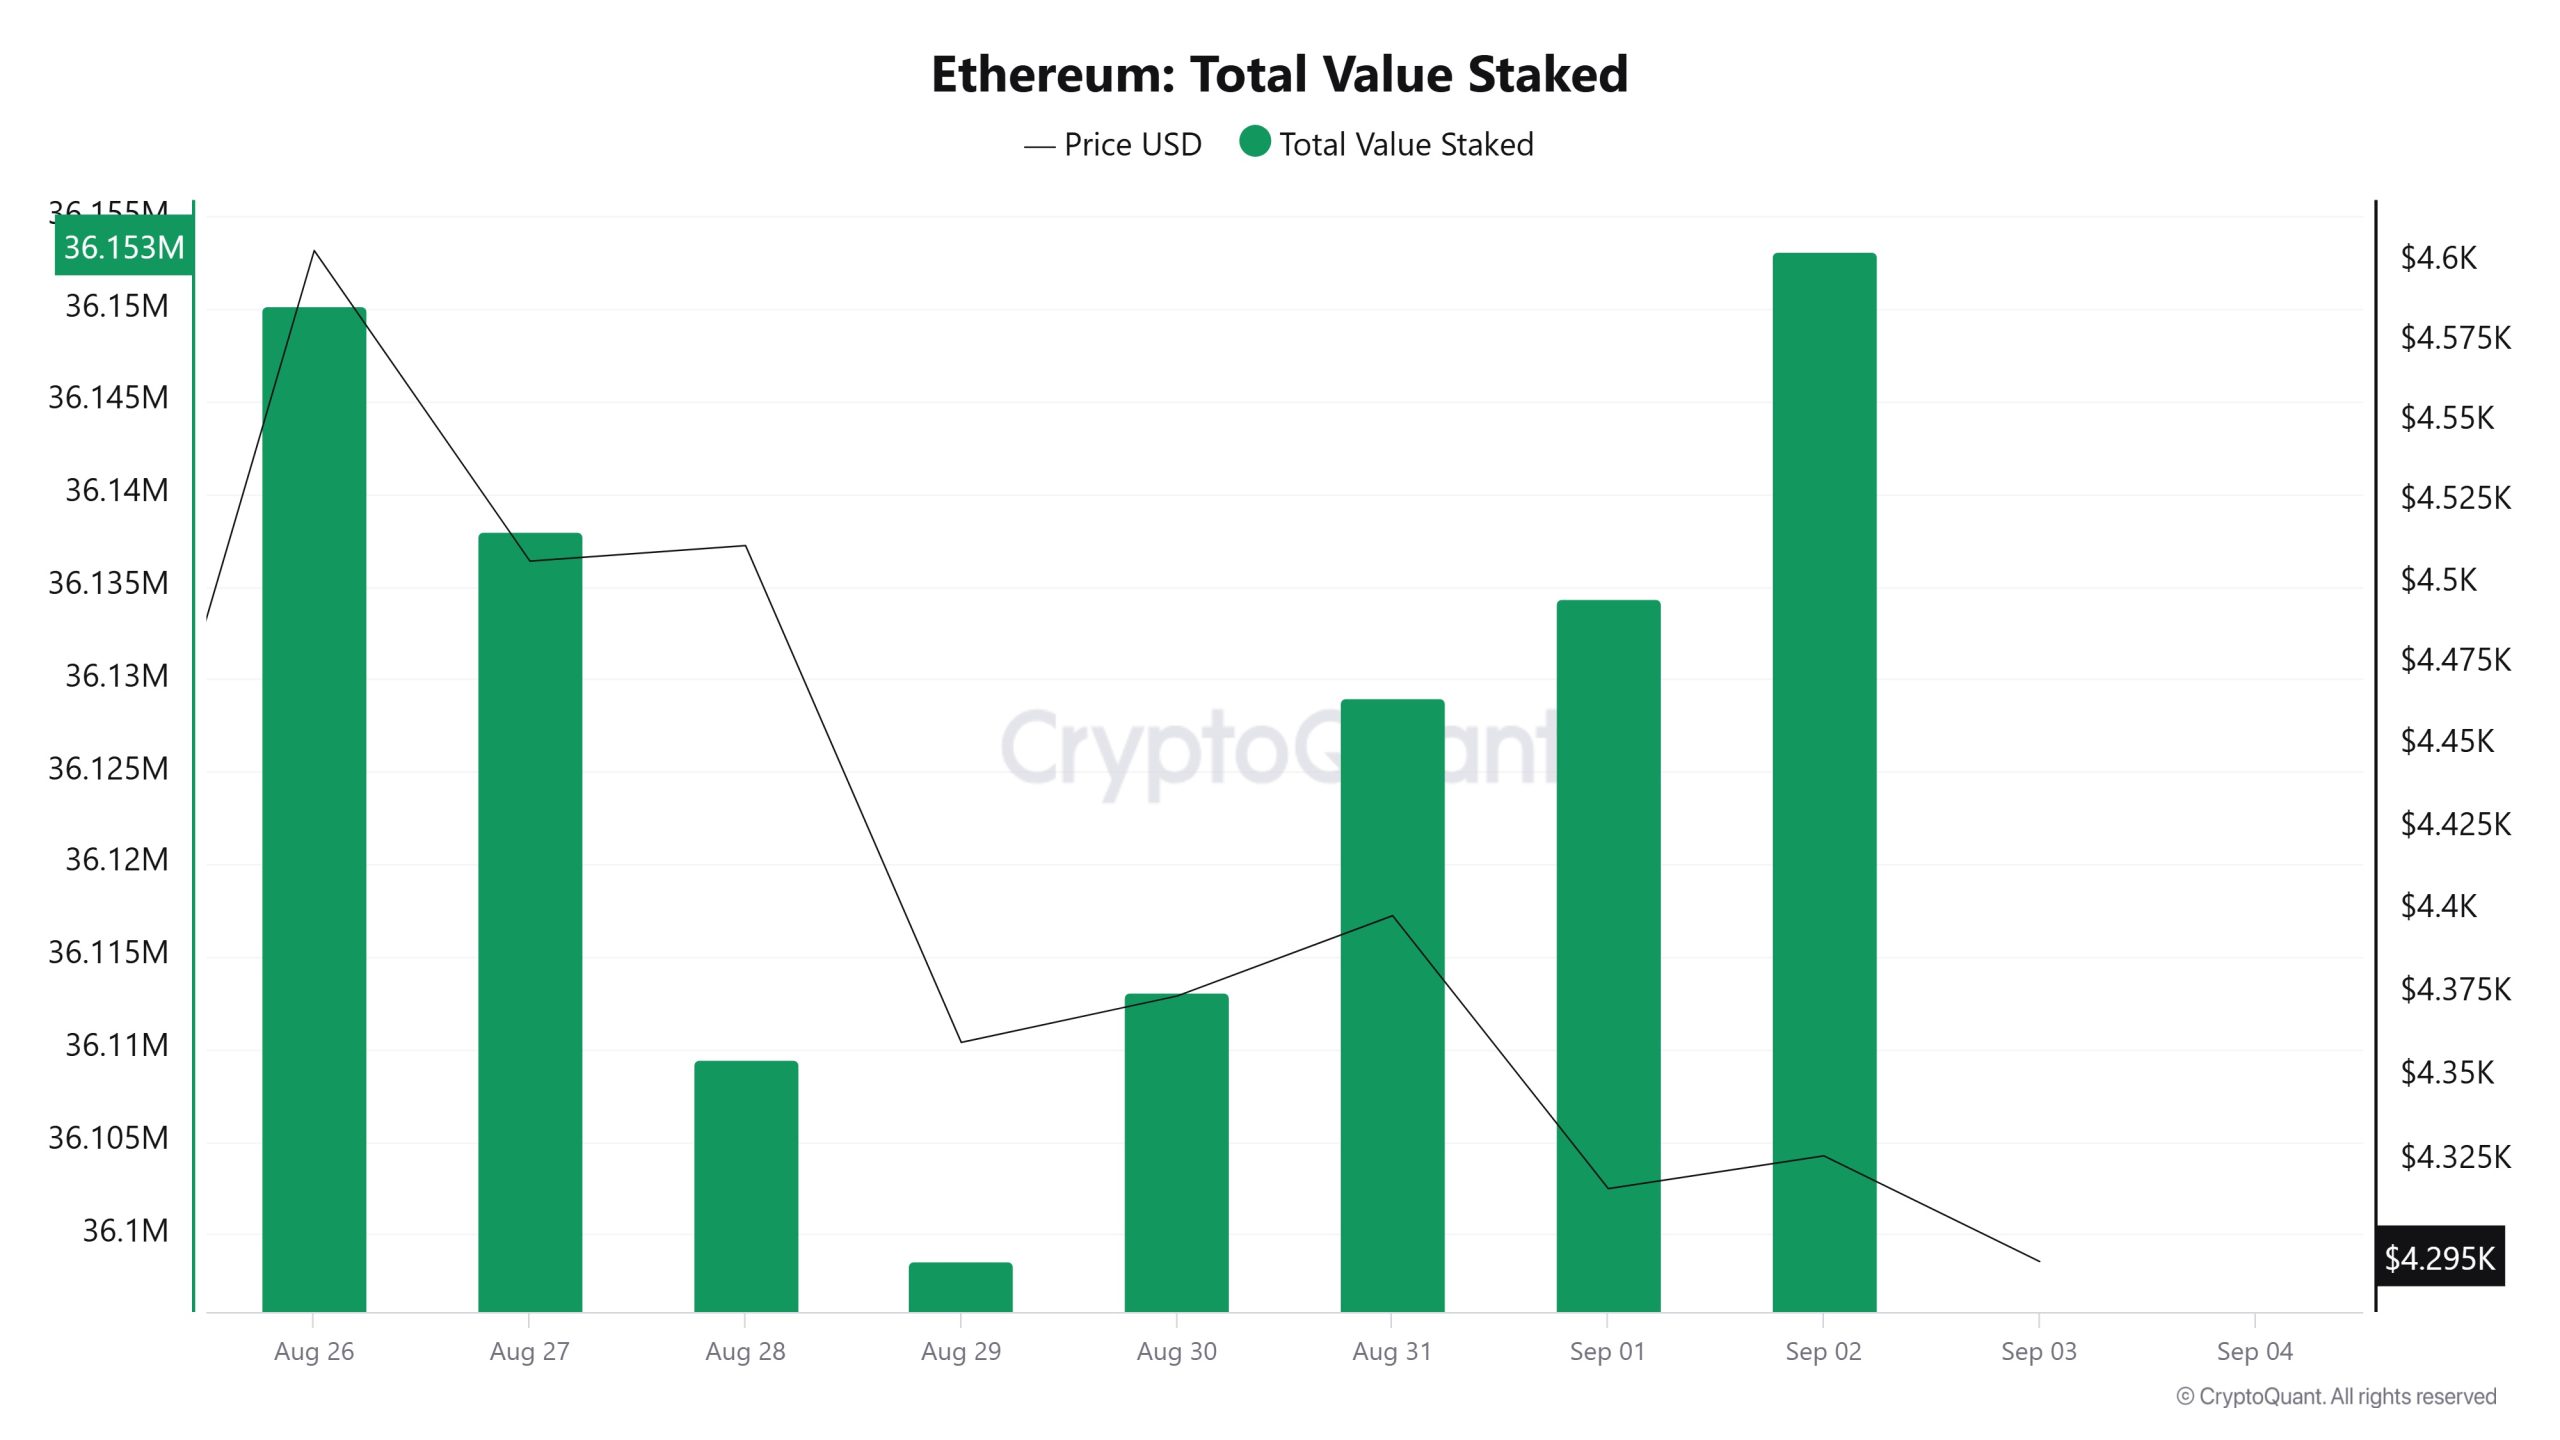
On August 27, ETH price was at $4.506 while Total Value Staked was at 36,137,969.
As of September 2, ETH price decreased by 3.99% to $4.326, while Total Value Staked increased by 0.04% to 36,153,161.
Staking Inflows
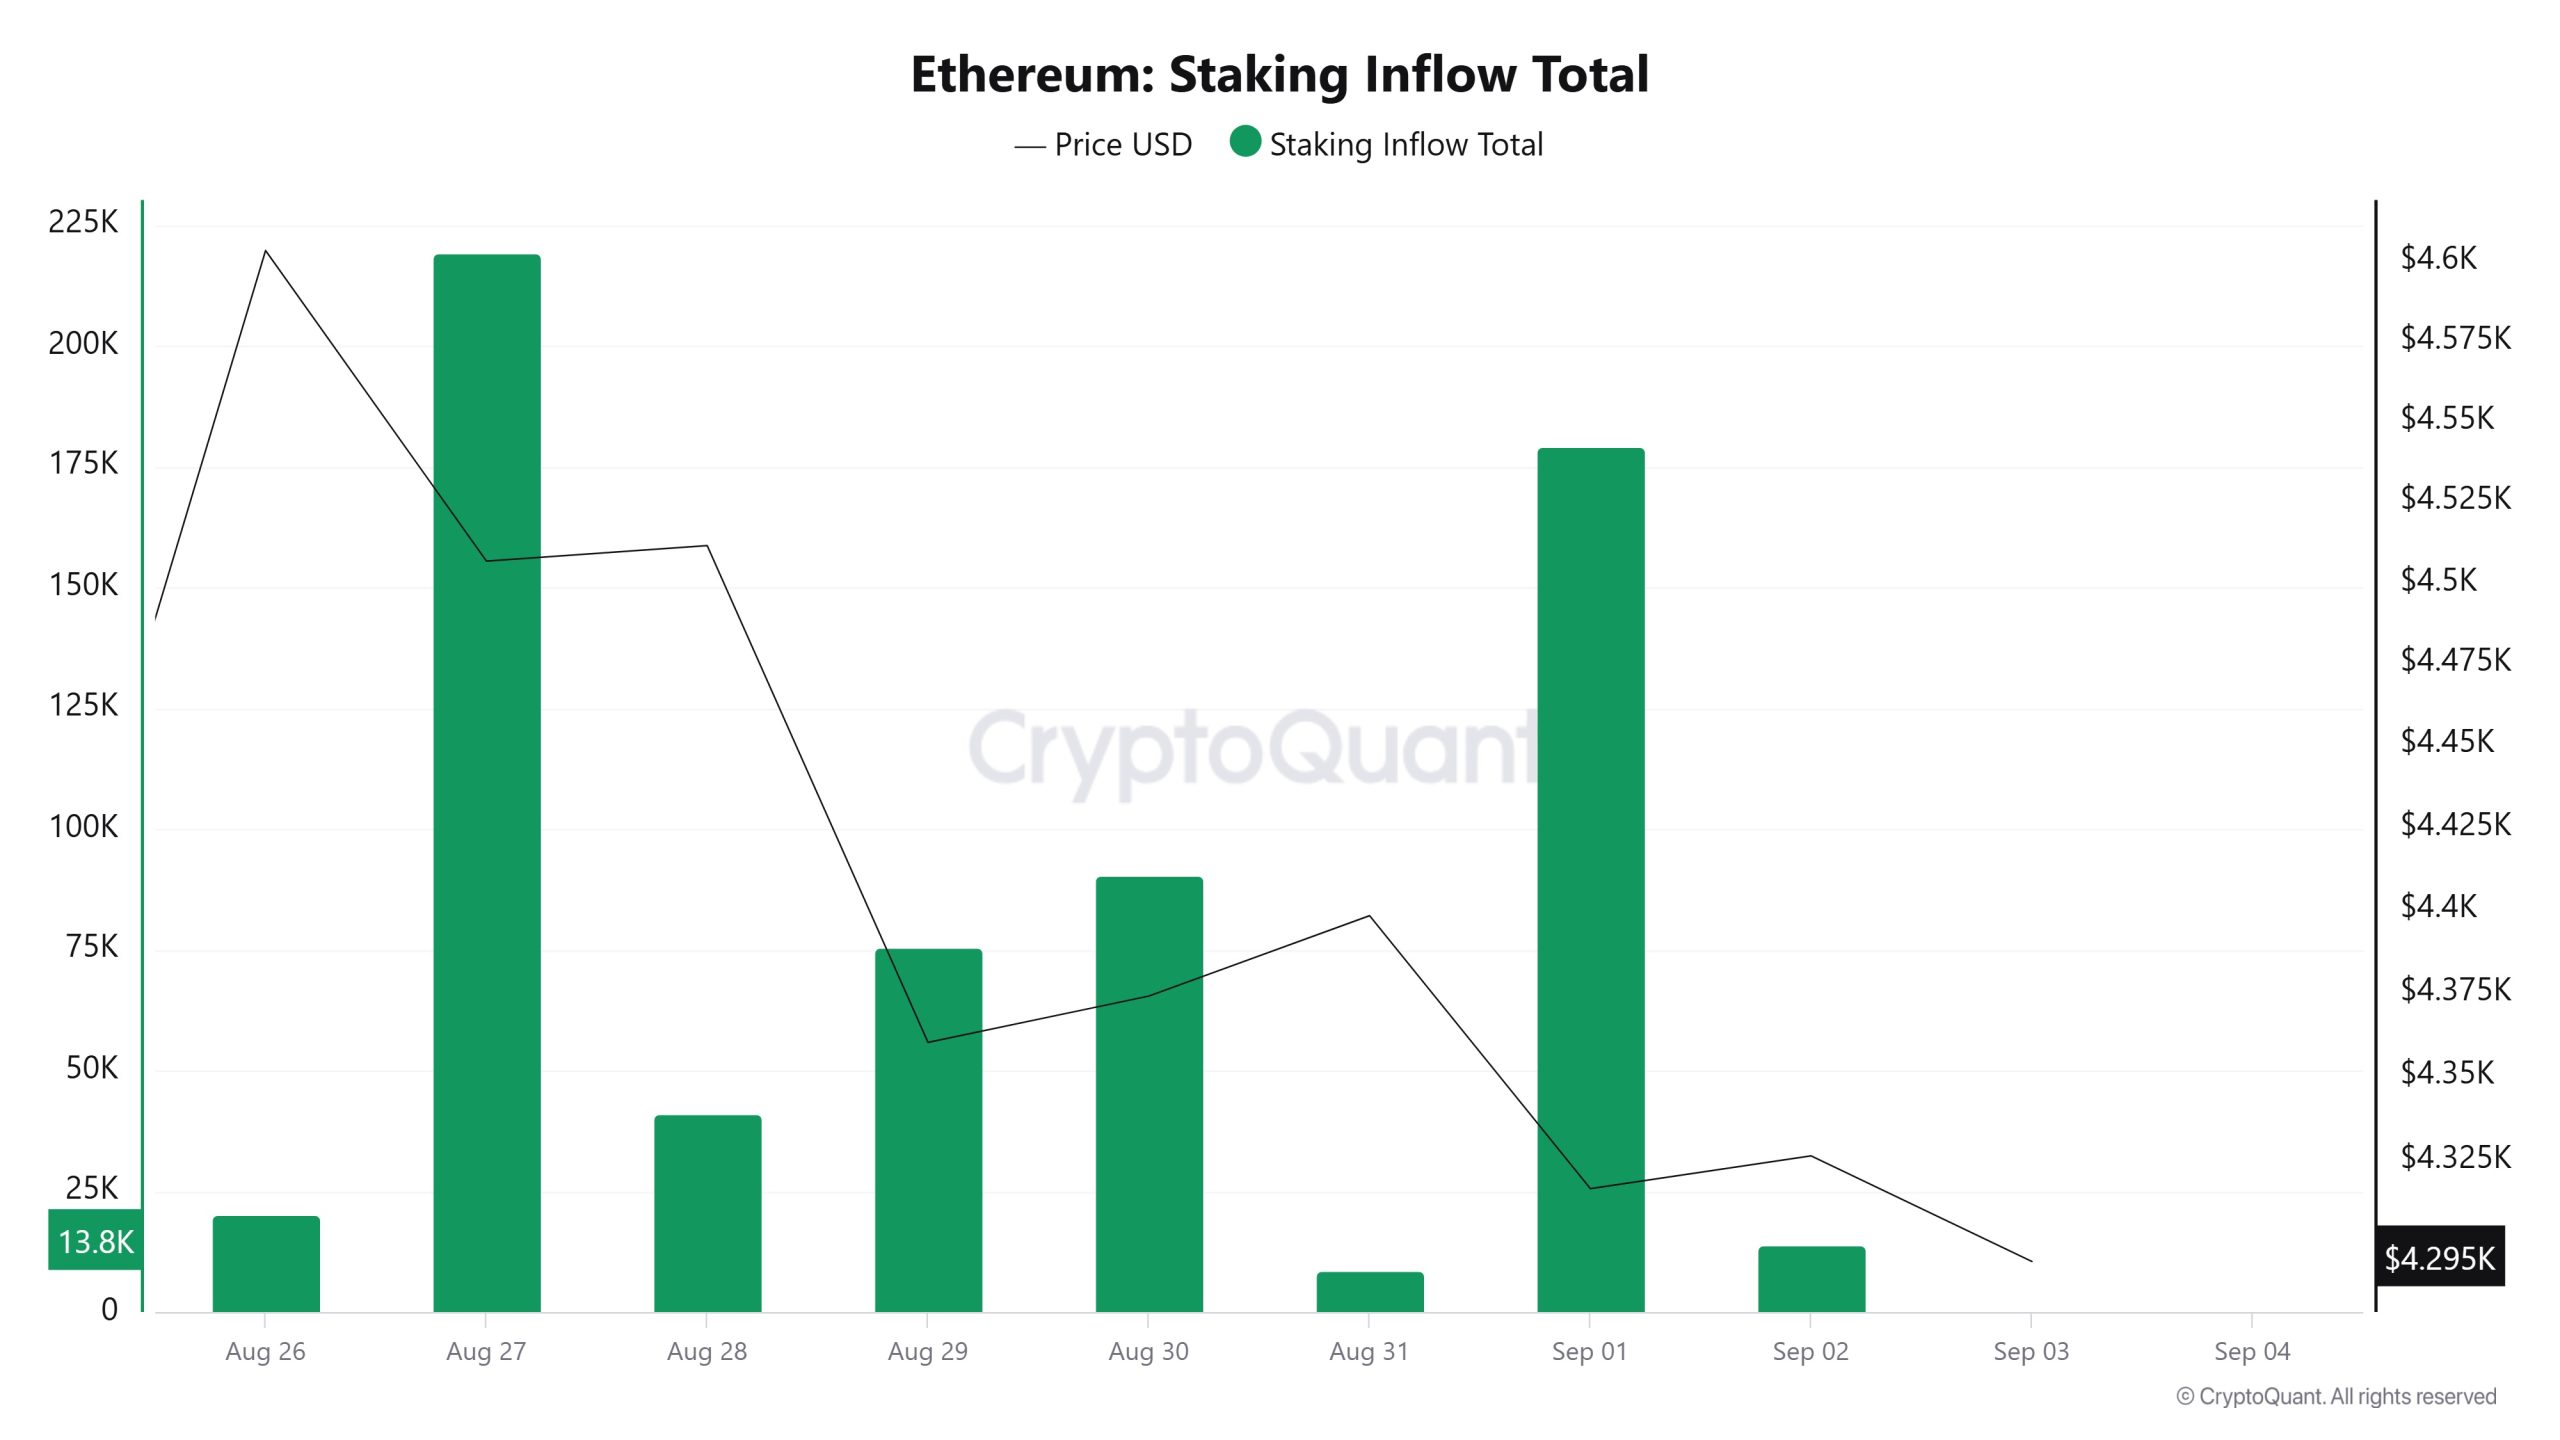
On August 27, ETH price was at $4.506 while Staking Inflow was at 219,230. As of September 2, ETH price fell 3.99% to $4,326, while Staking Inflow fell 93.69% to 13,834.
Derivatives
Open Interest
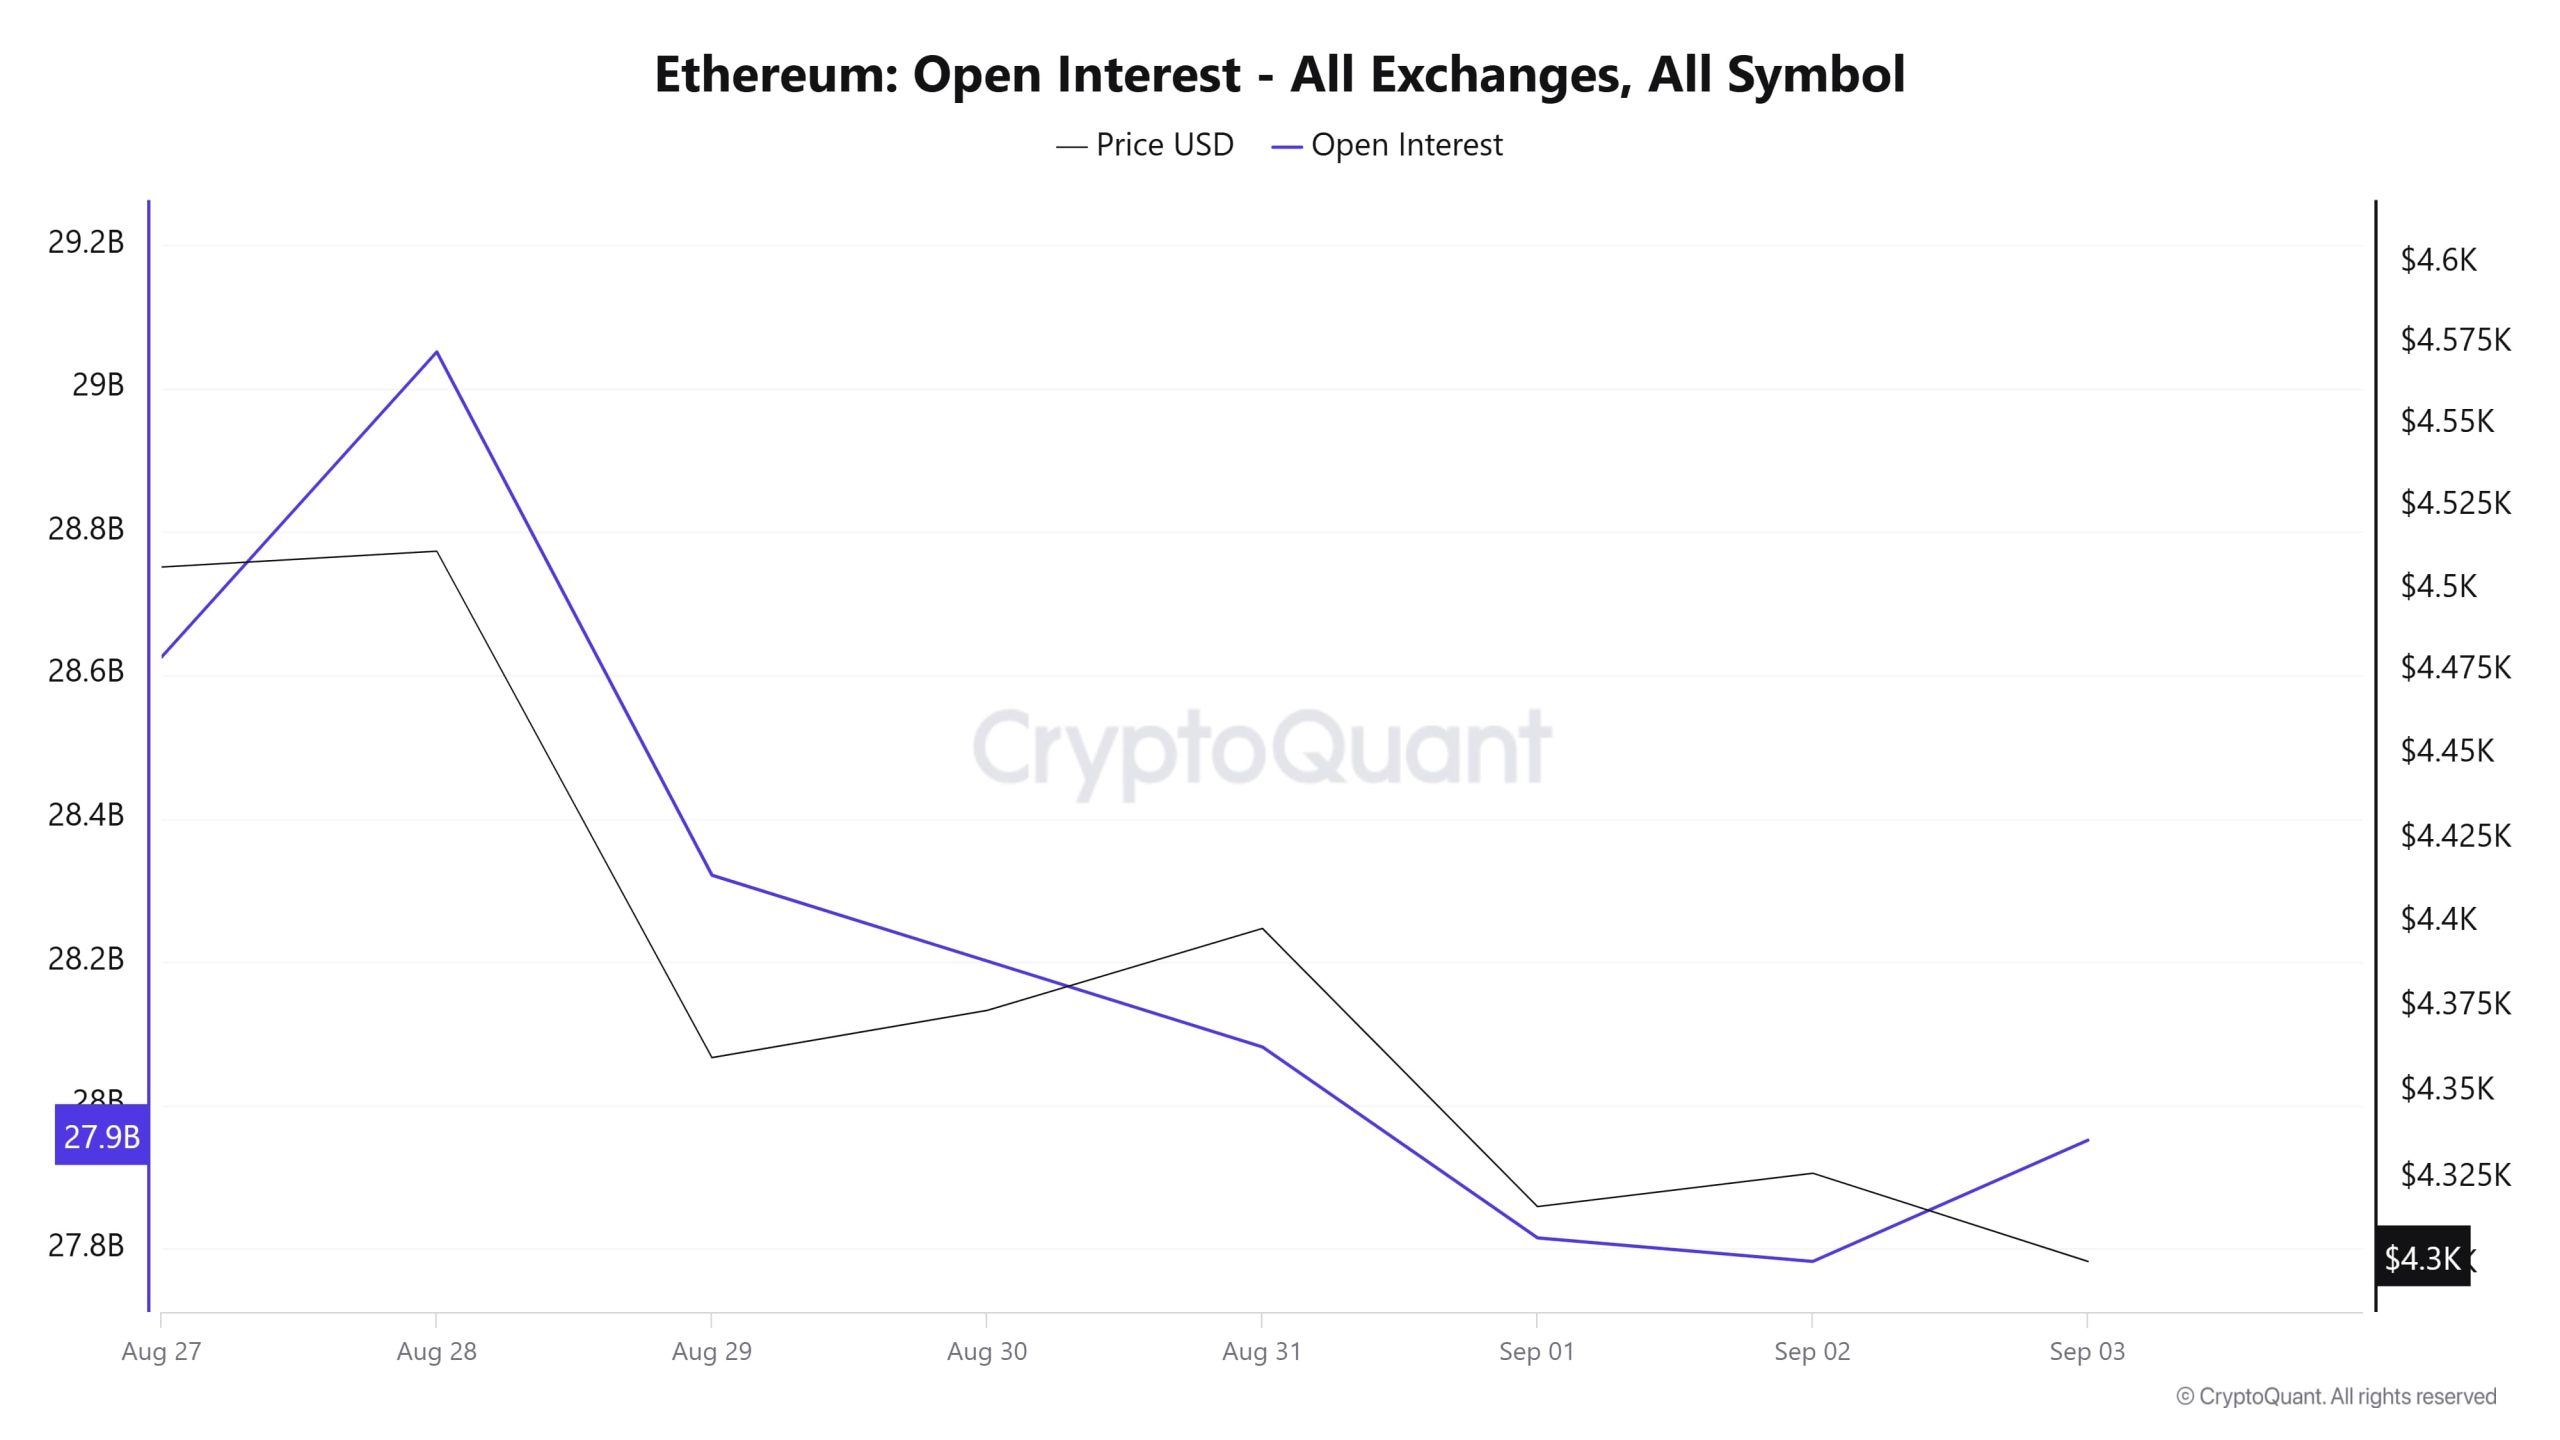
On August 27th and 28th, both open interest and the price accelerated upwards, with open interest reaching 29.1 billion and the price rising to around $4,530. However, after August 28, a significant decline begins. Open interest declines rapidly to 27.8 billion on September 1, while the price gradually falls from $4,500 to $4,300 in the same period. On September 2 and 3, the price remained flat at the lows while open interest signaled a slight recovery. This outlook suggests that investors are reducing their positions in the short term, and a cautious expectation prevails in the market.
Funding Rate
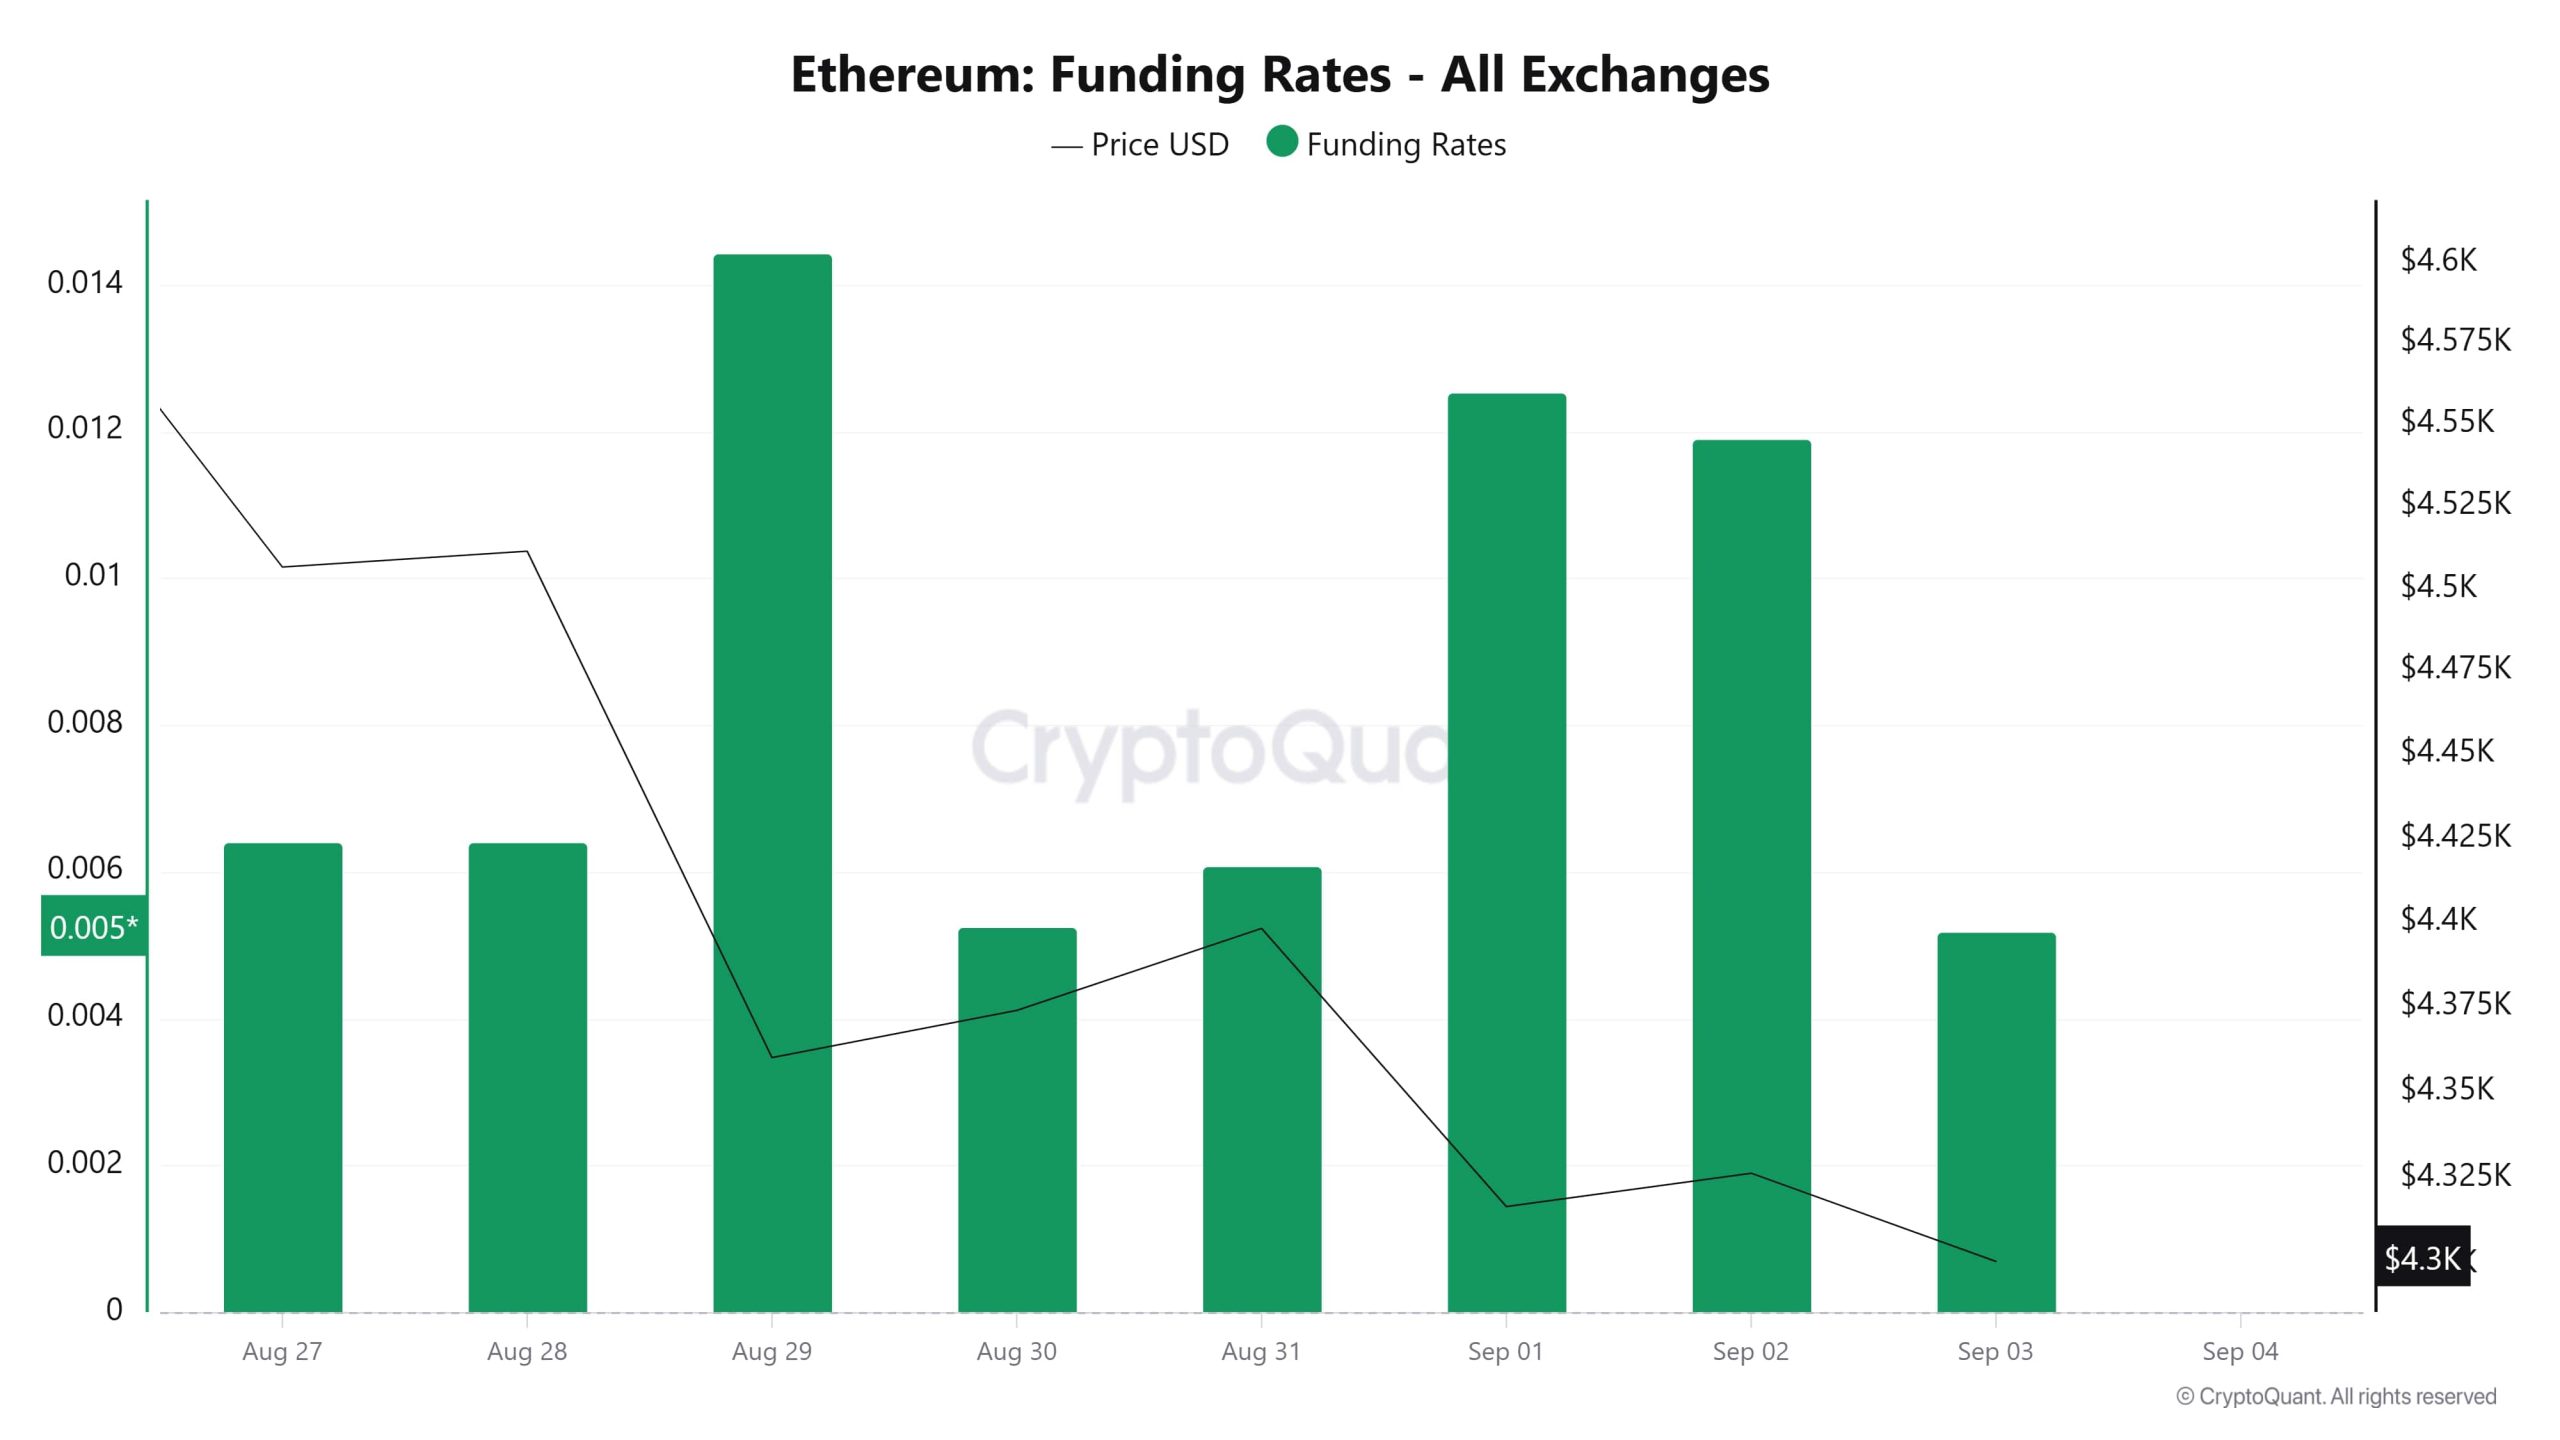
On August 27, the price hovered above $4,500 while the funding rate was in a stable positive outlook. On August 28th, a similar picture continued, but on August 29th, the funding rate rose sharply while the price fell below $4,400 and started a downtrend. During this period, leveraged long positions intensified but the price did not react at the same rate. On August 31 and September 1, the price was stuck in the $4,300-4,400 band while the funding rate rose again, indicating that the long appetite still persisted in the market. However, on September 2 and 3, the price fell back to $4,300 and the funding rate retreated slightly. This suggests that despite the dominance of long positions in the market, the price failed to gain upward momentum and there is a potential risk of a squeeze. The overall picture suggests that the positive funding rate has been maintained while the price has fallen, increasing the risk of a possible liquidation wave on the leveraged side.
Long & Short Liquidations
ETH fell sharply from $4,500 to $4,200 last week. However, about $700 million worth of long positions were liquidated. Another $292 million worth of short positions were liquidated in the same timeframe.
| Dates | Long Amount (Million $) | Short Amount (Million $) |
| August 27 | 91.53 | 46.59 |
| August 28 | 65.01 | 33.22 |
| August 29 | 177.17 | 43.52 |
| August 30 | 40.53 | 38.19 |
| August 31 | 39.61 | 26.71 |
| September 01 | 229.76 | 53.73 |
| September 02 | 56.10 | 51.00 |
| Total | 699,71 | 292,96 |
Exchange Supply Ratio
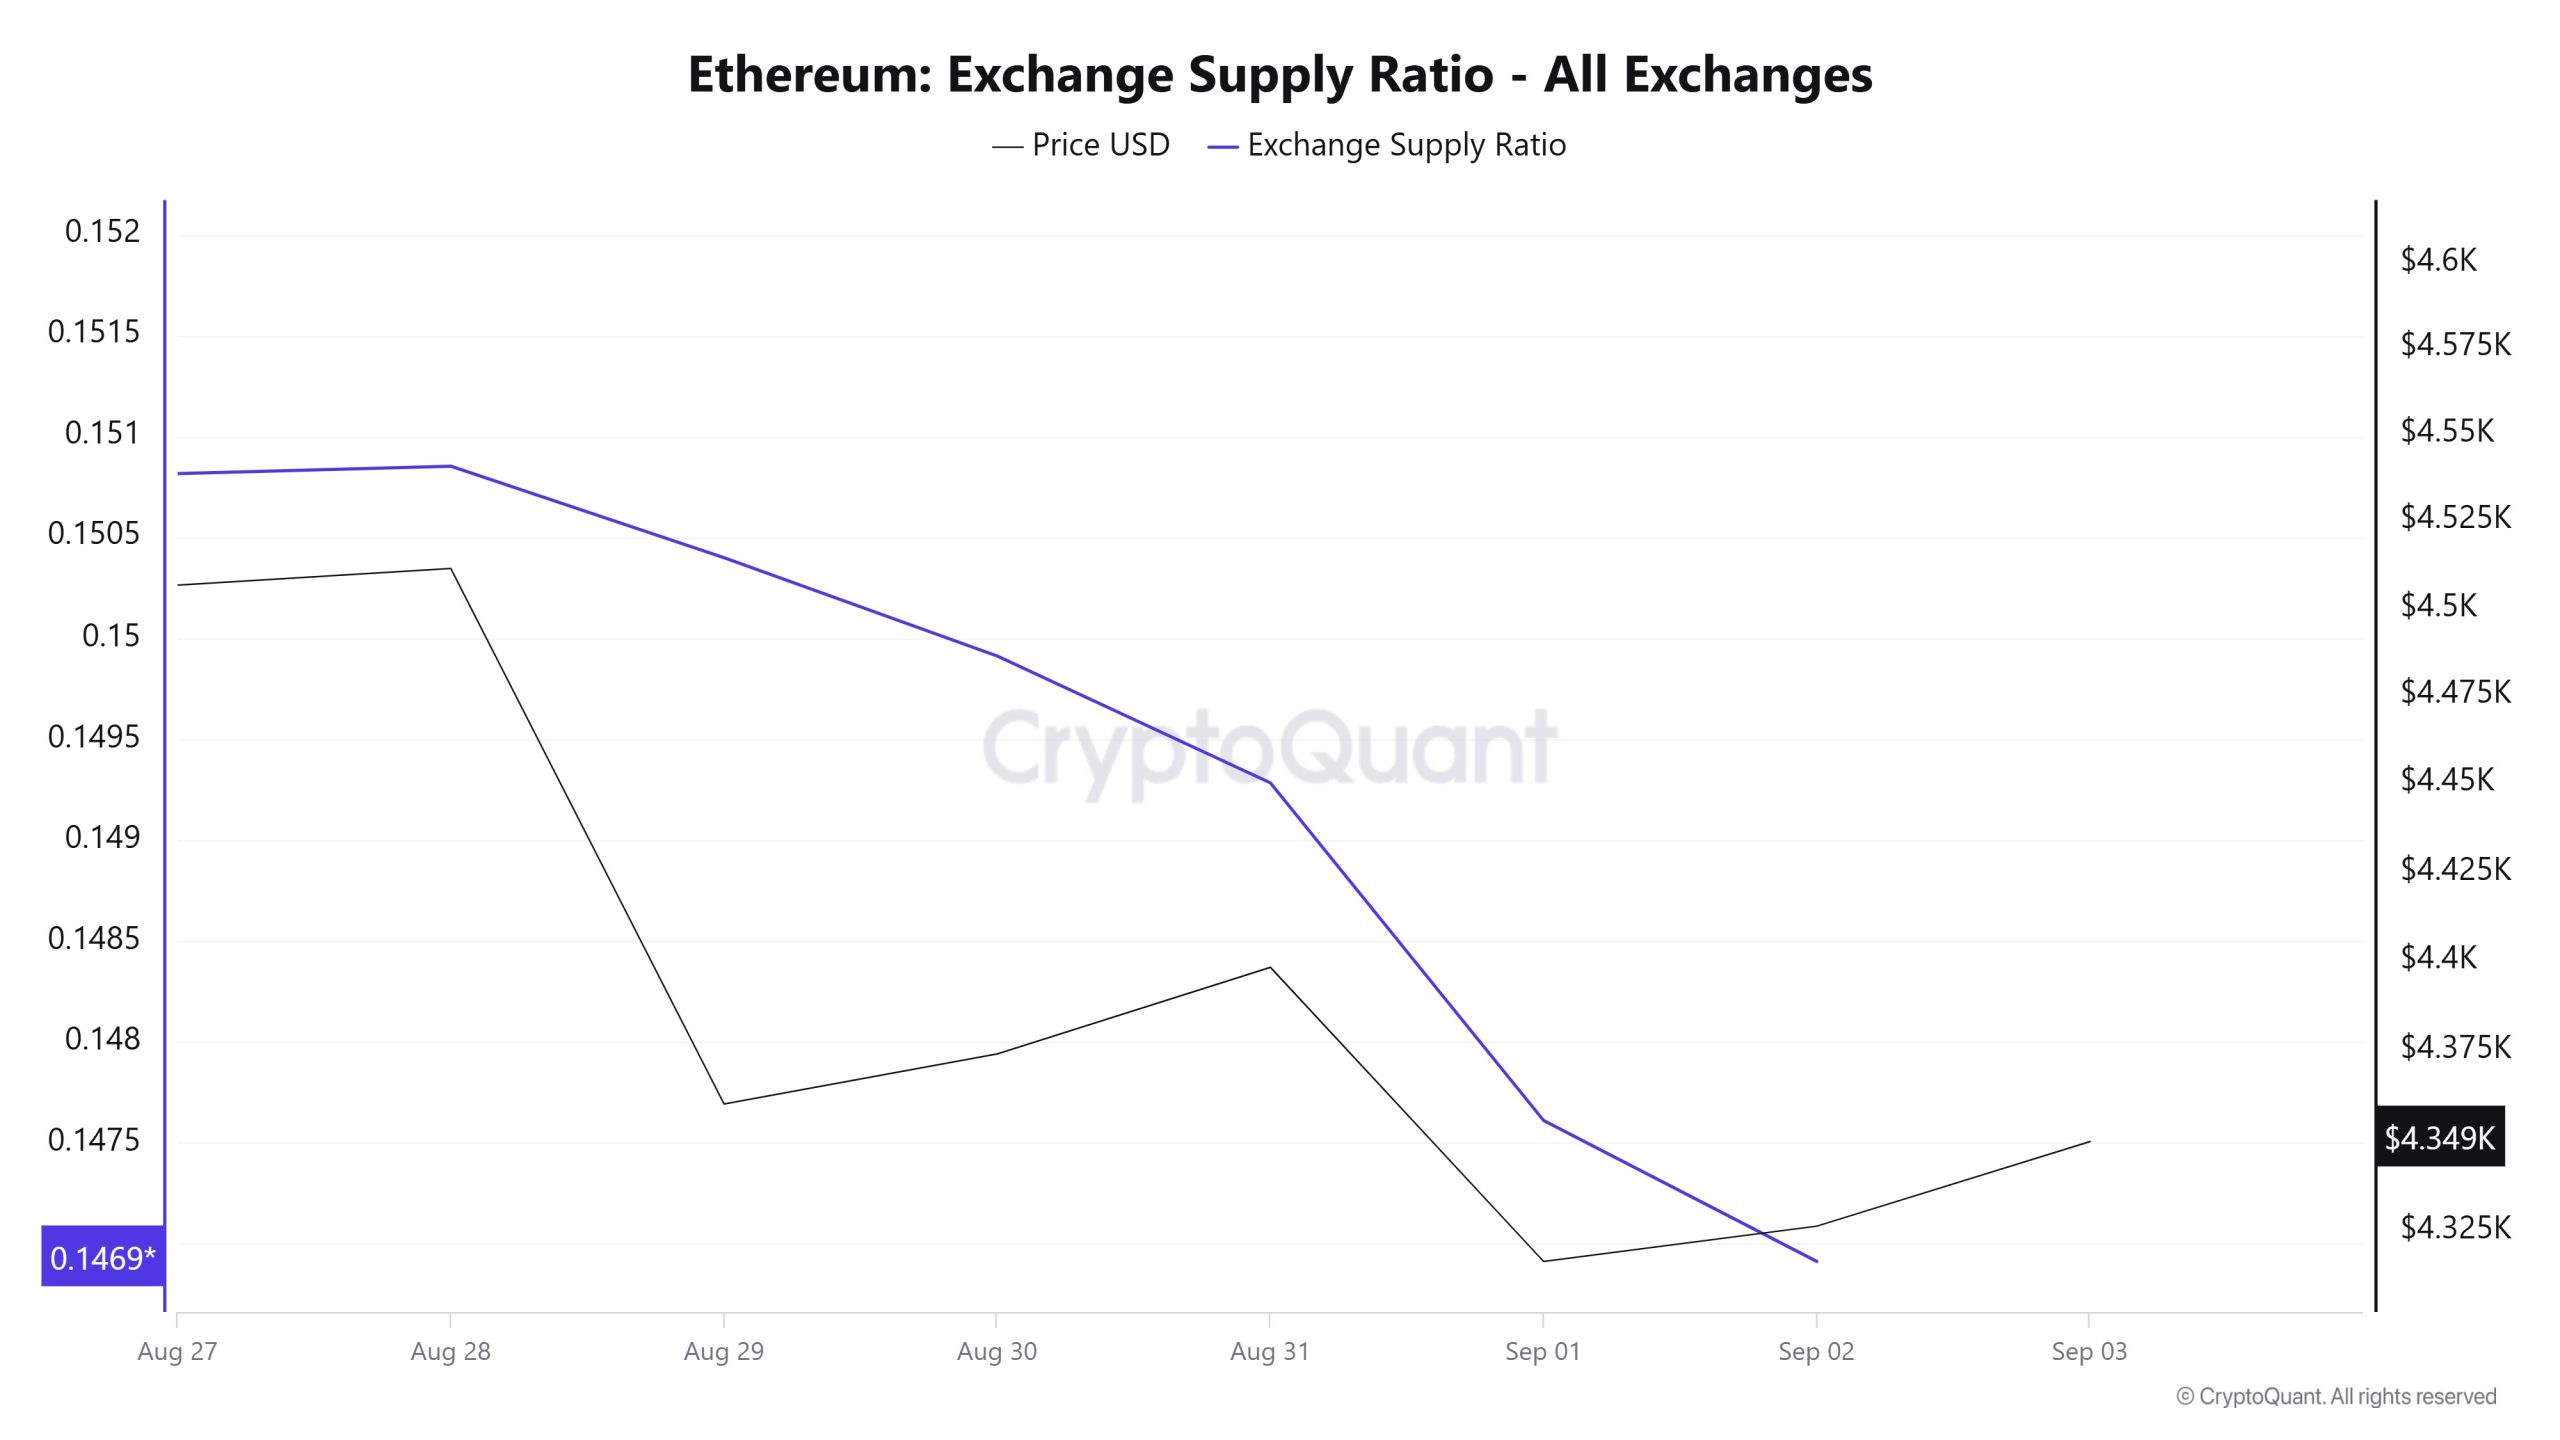
Between September 27th and September 3rd, the Ethereum Exchange Supply Ratio decreased from 0.15085378 to 0.14761081. During this period, the Ethereum price dropped from $4,501 to $4,398. At the intersection of the price and the Exchange Supply Ratio, especially on September 1, there was a significant increase in the Exchange Supply Ratio as the price continued to fall. This suggests that despite the price decline, the amount of Ethereum supplied to exchanges has increased, possibly indicating that long-term investors continue to hold their holdings. Ethereum price is generally unstable
Exchange Reserve
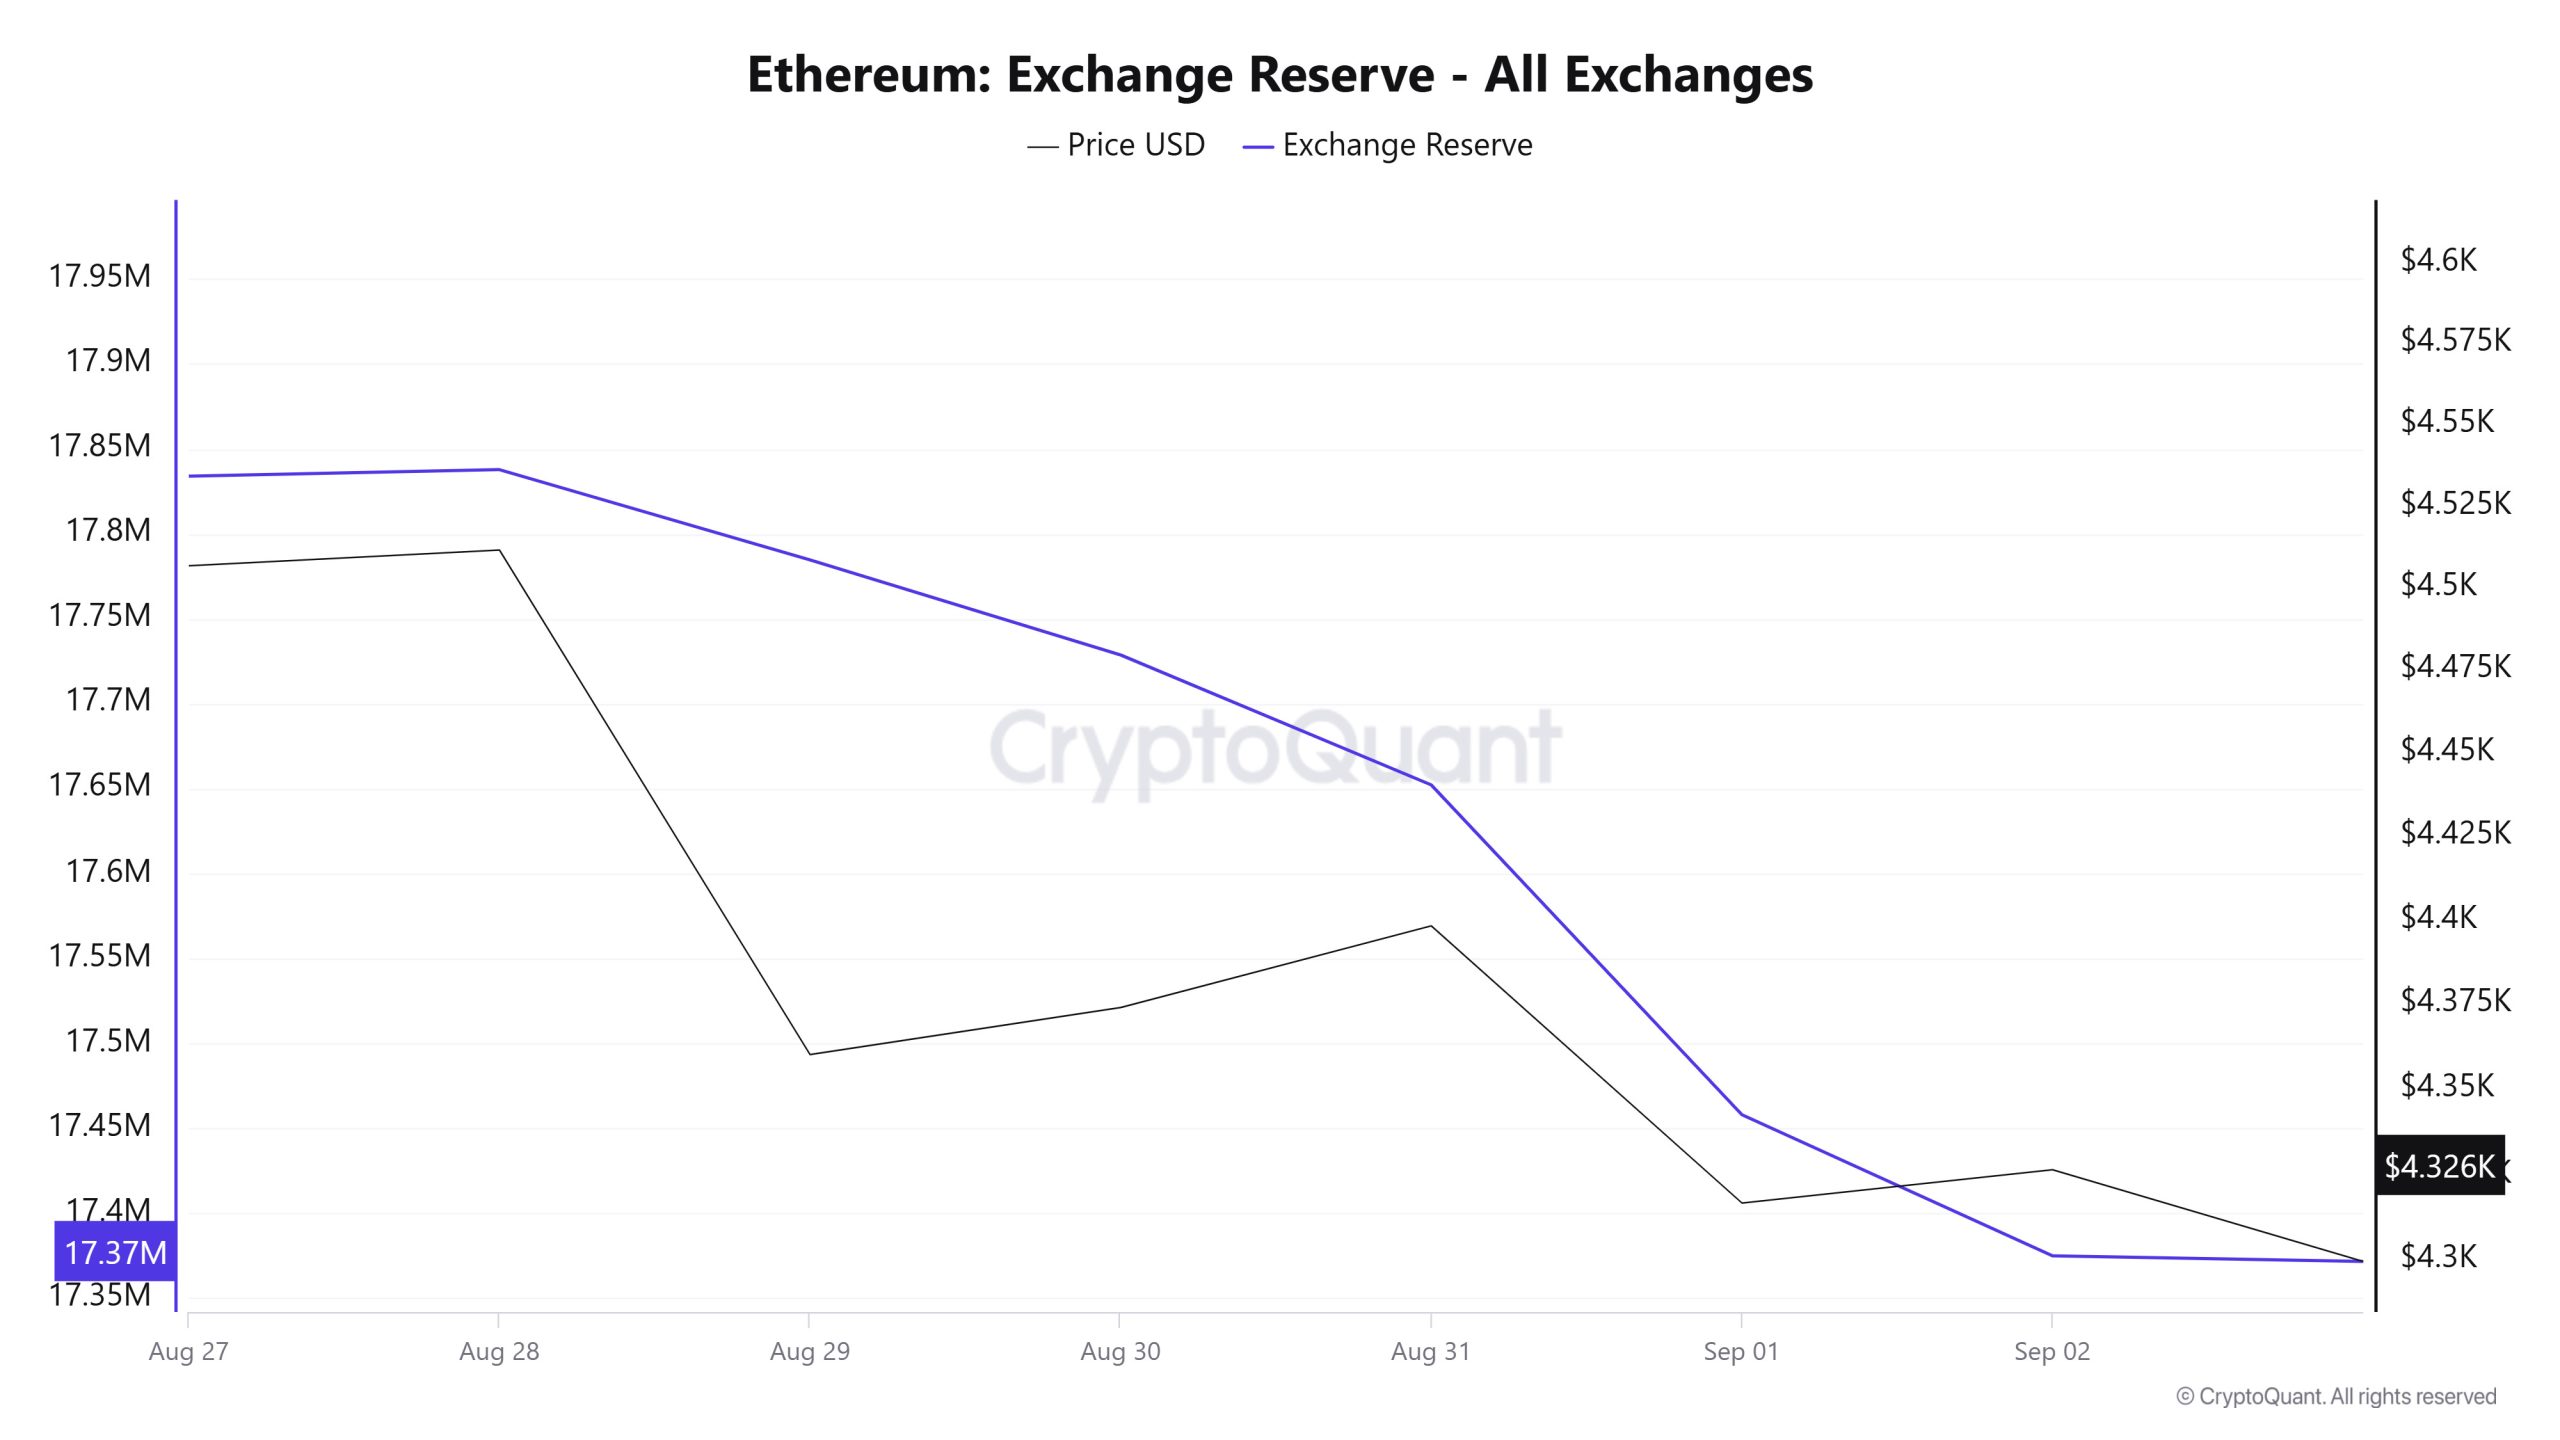
Between August 27 and September 2, 2025, Ethereum reserves on exchanges decreased from 17,833,892 ETH to 17,374,751 ETH, with a total net outflow of 459,141 ETH. During this period, reserves decreased by approximately 2.57%. In the same period, the Ethereum price fell from $4,602 to $4,326, a loss of about 6%. Despite the price decline, ETH outflows from exchanges continued, indicating that investors continue to hold for the long term. This can be interpreted as the selling pressure has subsided and investors are using the decline as a buying opportunity.
| Date | 27-Aug | 28-Aug | 29-Aug | 30-Aug | 31-Aug | 01-Sep | 02-Sep |
| Exchange Inflow | 1,598,020 | 867,389 | 1,049,386 | 414,985 | 473,773 | 884,833 | 1,145,150 |
| Exchange Outflow | 1,730,925 | 863,503 | 1,102,581 | 470,938 | 550,349 | 1,079,042 | 1,228,243 |
| Exchange Netflow | -132,905 | 3,886 | -53,195 | -55,953 | -76,576 | -194,209 | -83,093 |
| Exchange Reserve | 17,833,892 | 17,837,778 | 17,784,583 | 17,728,630 | 17,652,054 | 17,457,845 | 17,374,751 |
| ETH Price | 4,602 | 4,511 | 4,360 | 4,374 | 4,398 | 4,317 | 4,326 |
Fees and Revenues
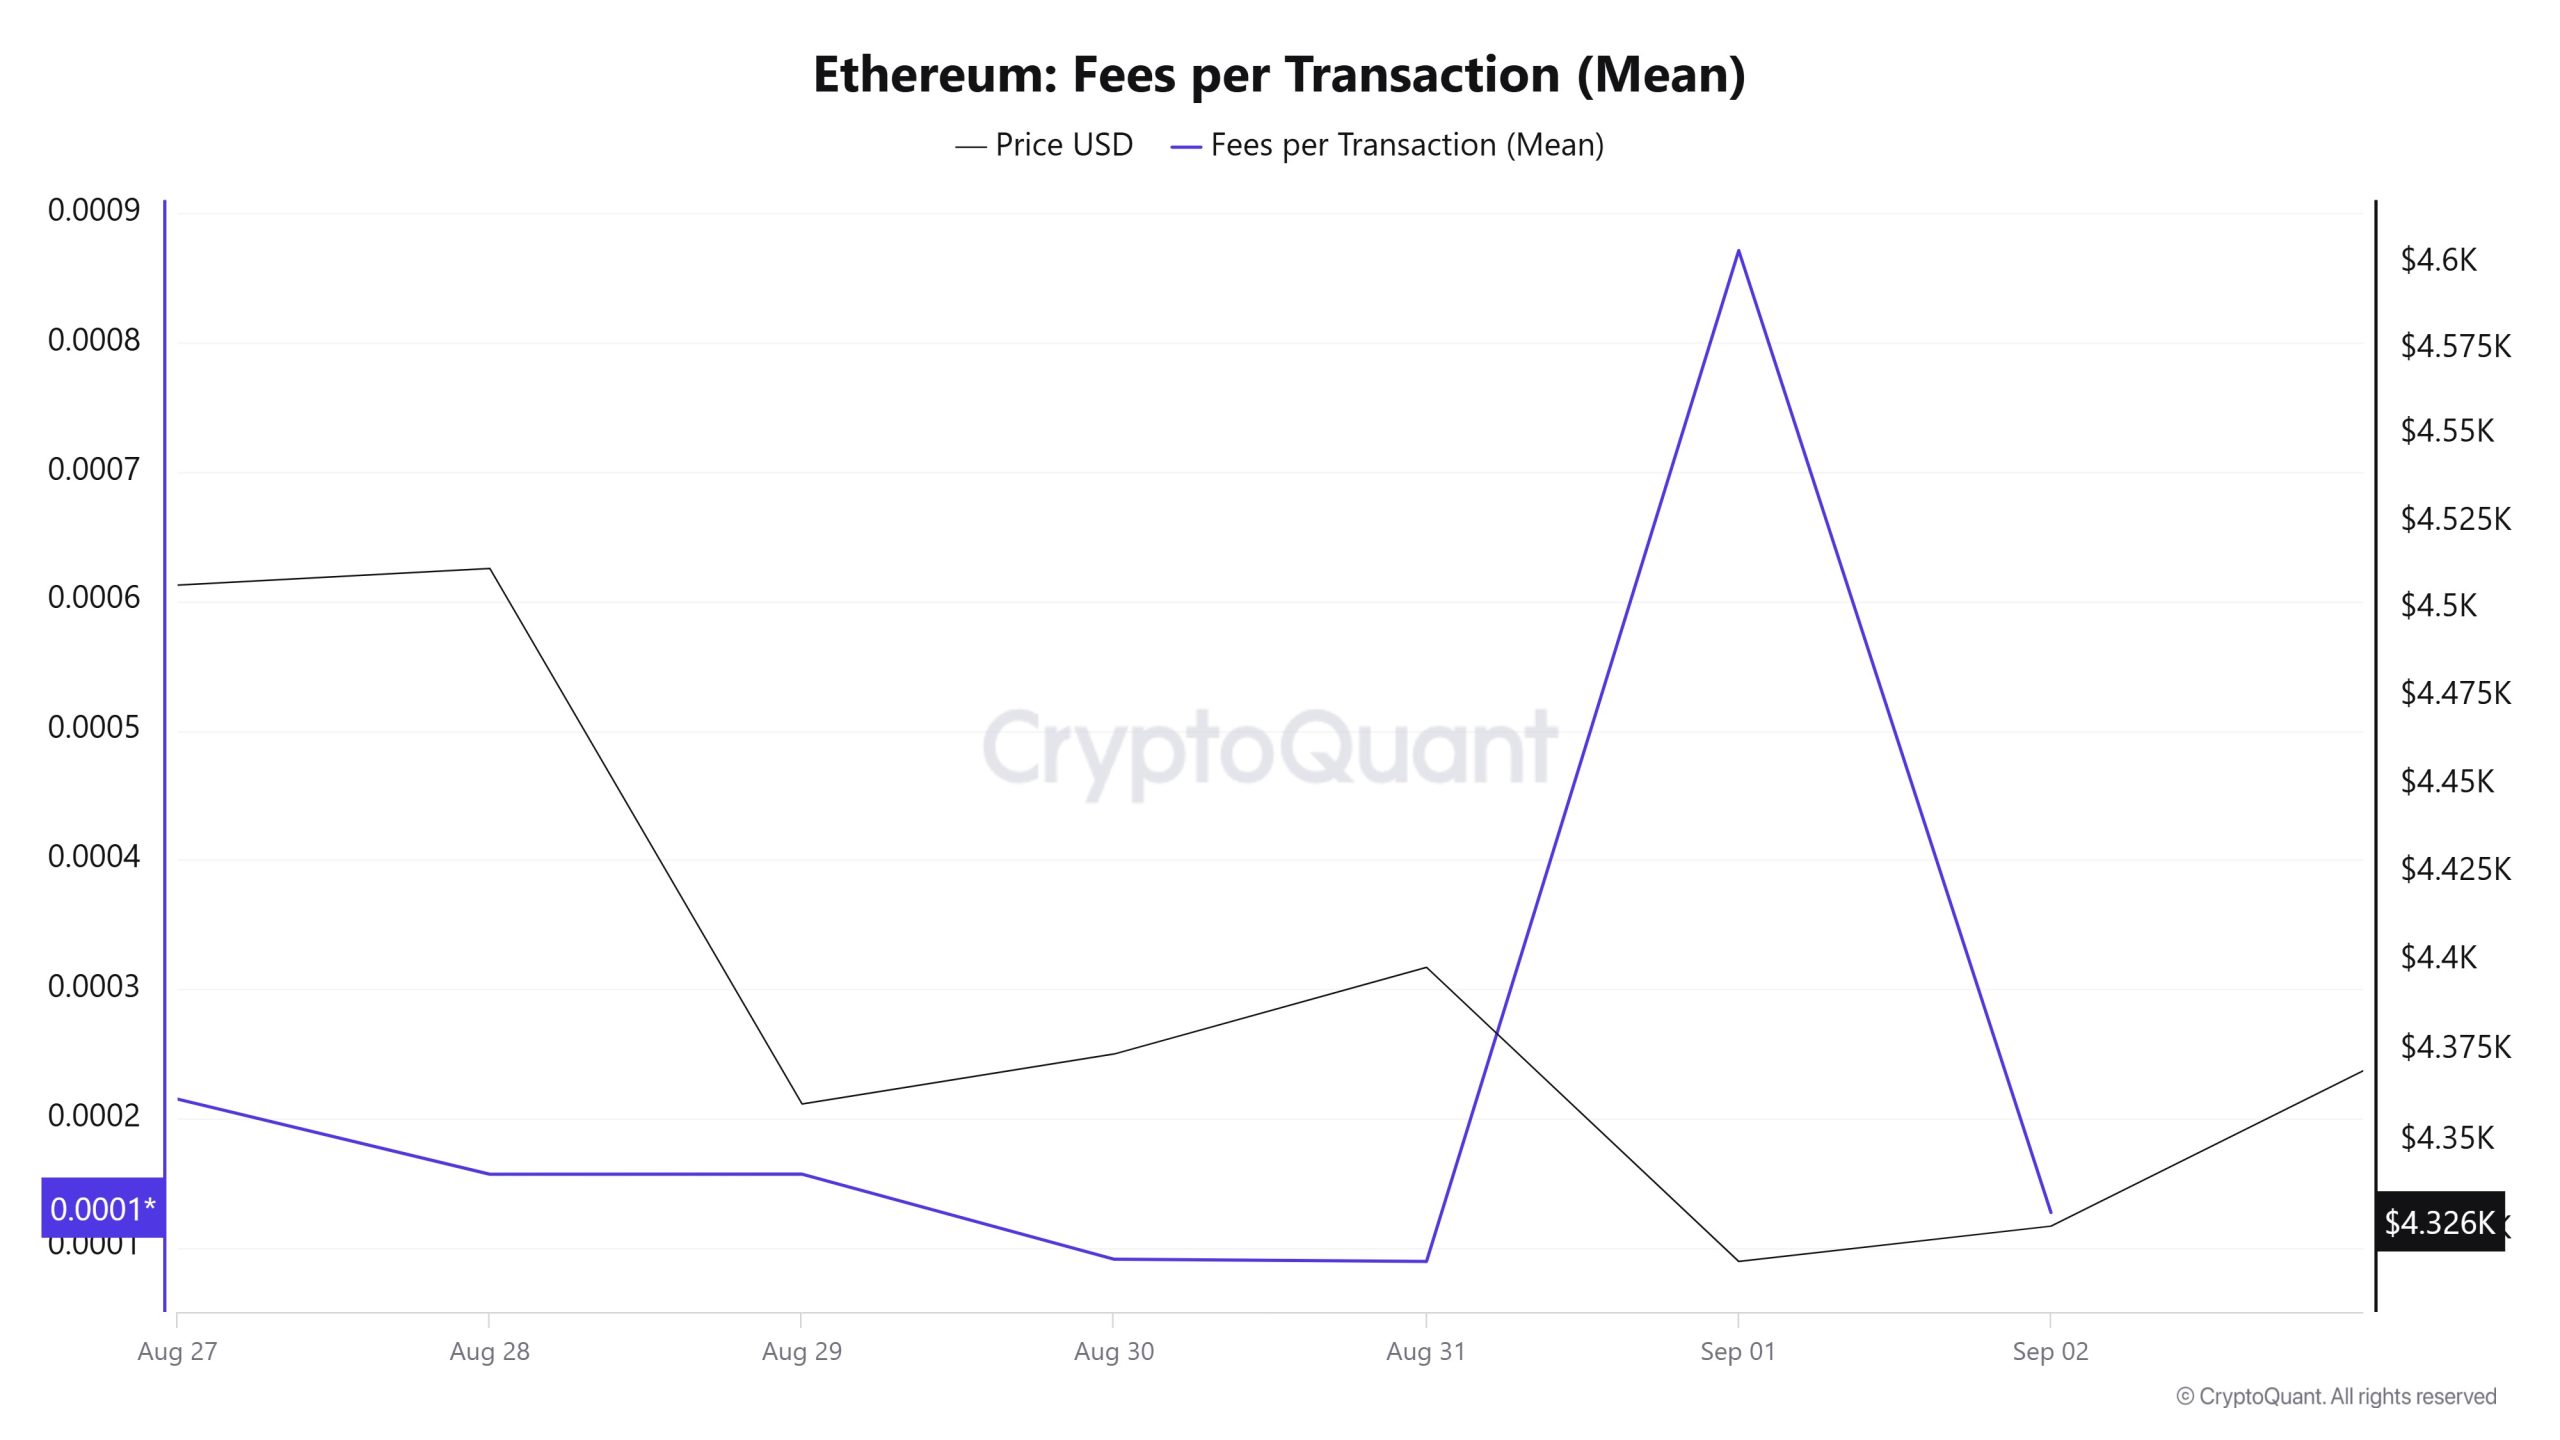
Between August 27 and September 2, Ethereum Fees per Transaction (Mean) data shows that the indicator was at 0.000214826899676961 on August 27, the first day of the week.
As of August 31, the value in question, which saw its bottom level, followed a fluctuating course due to the volatility in Ethereum price until this date. On September 1, it rose to 0.000871310719708412 and recorded the highest value of the week.
In the following days, the Ethereum Fees per Transaction (Mean) indicator resumed its downward trend and closed at 0.000127136620409184 on September 2, the last day of the week.
Ethereum: Fees (Total)
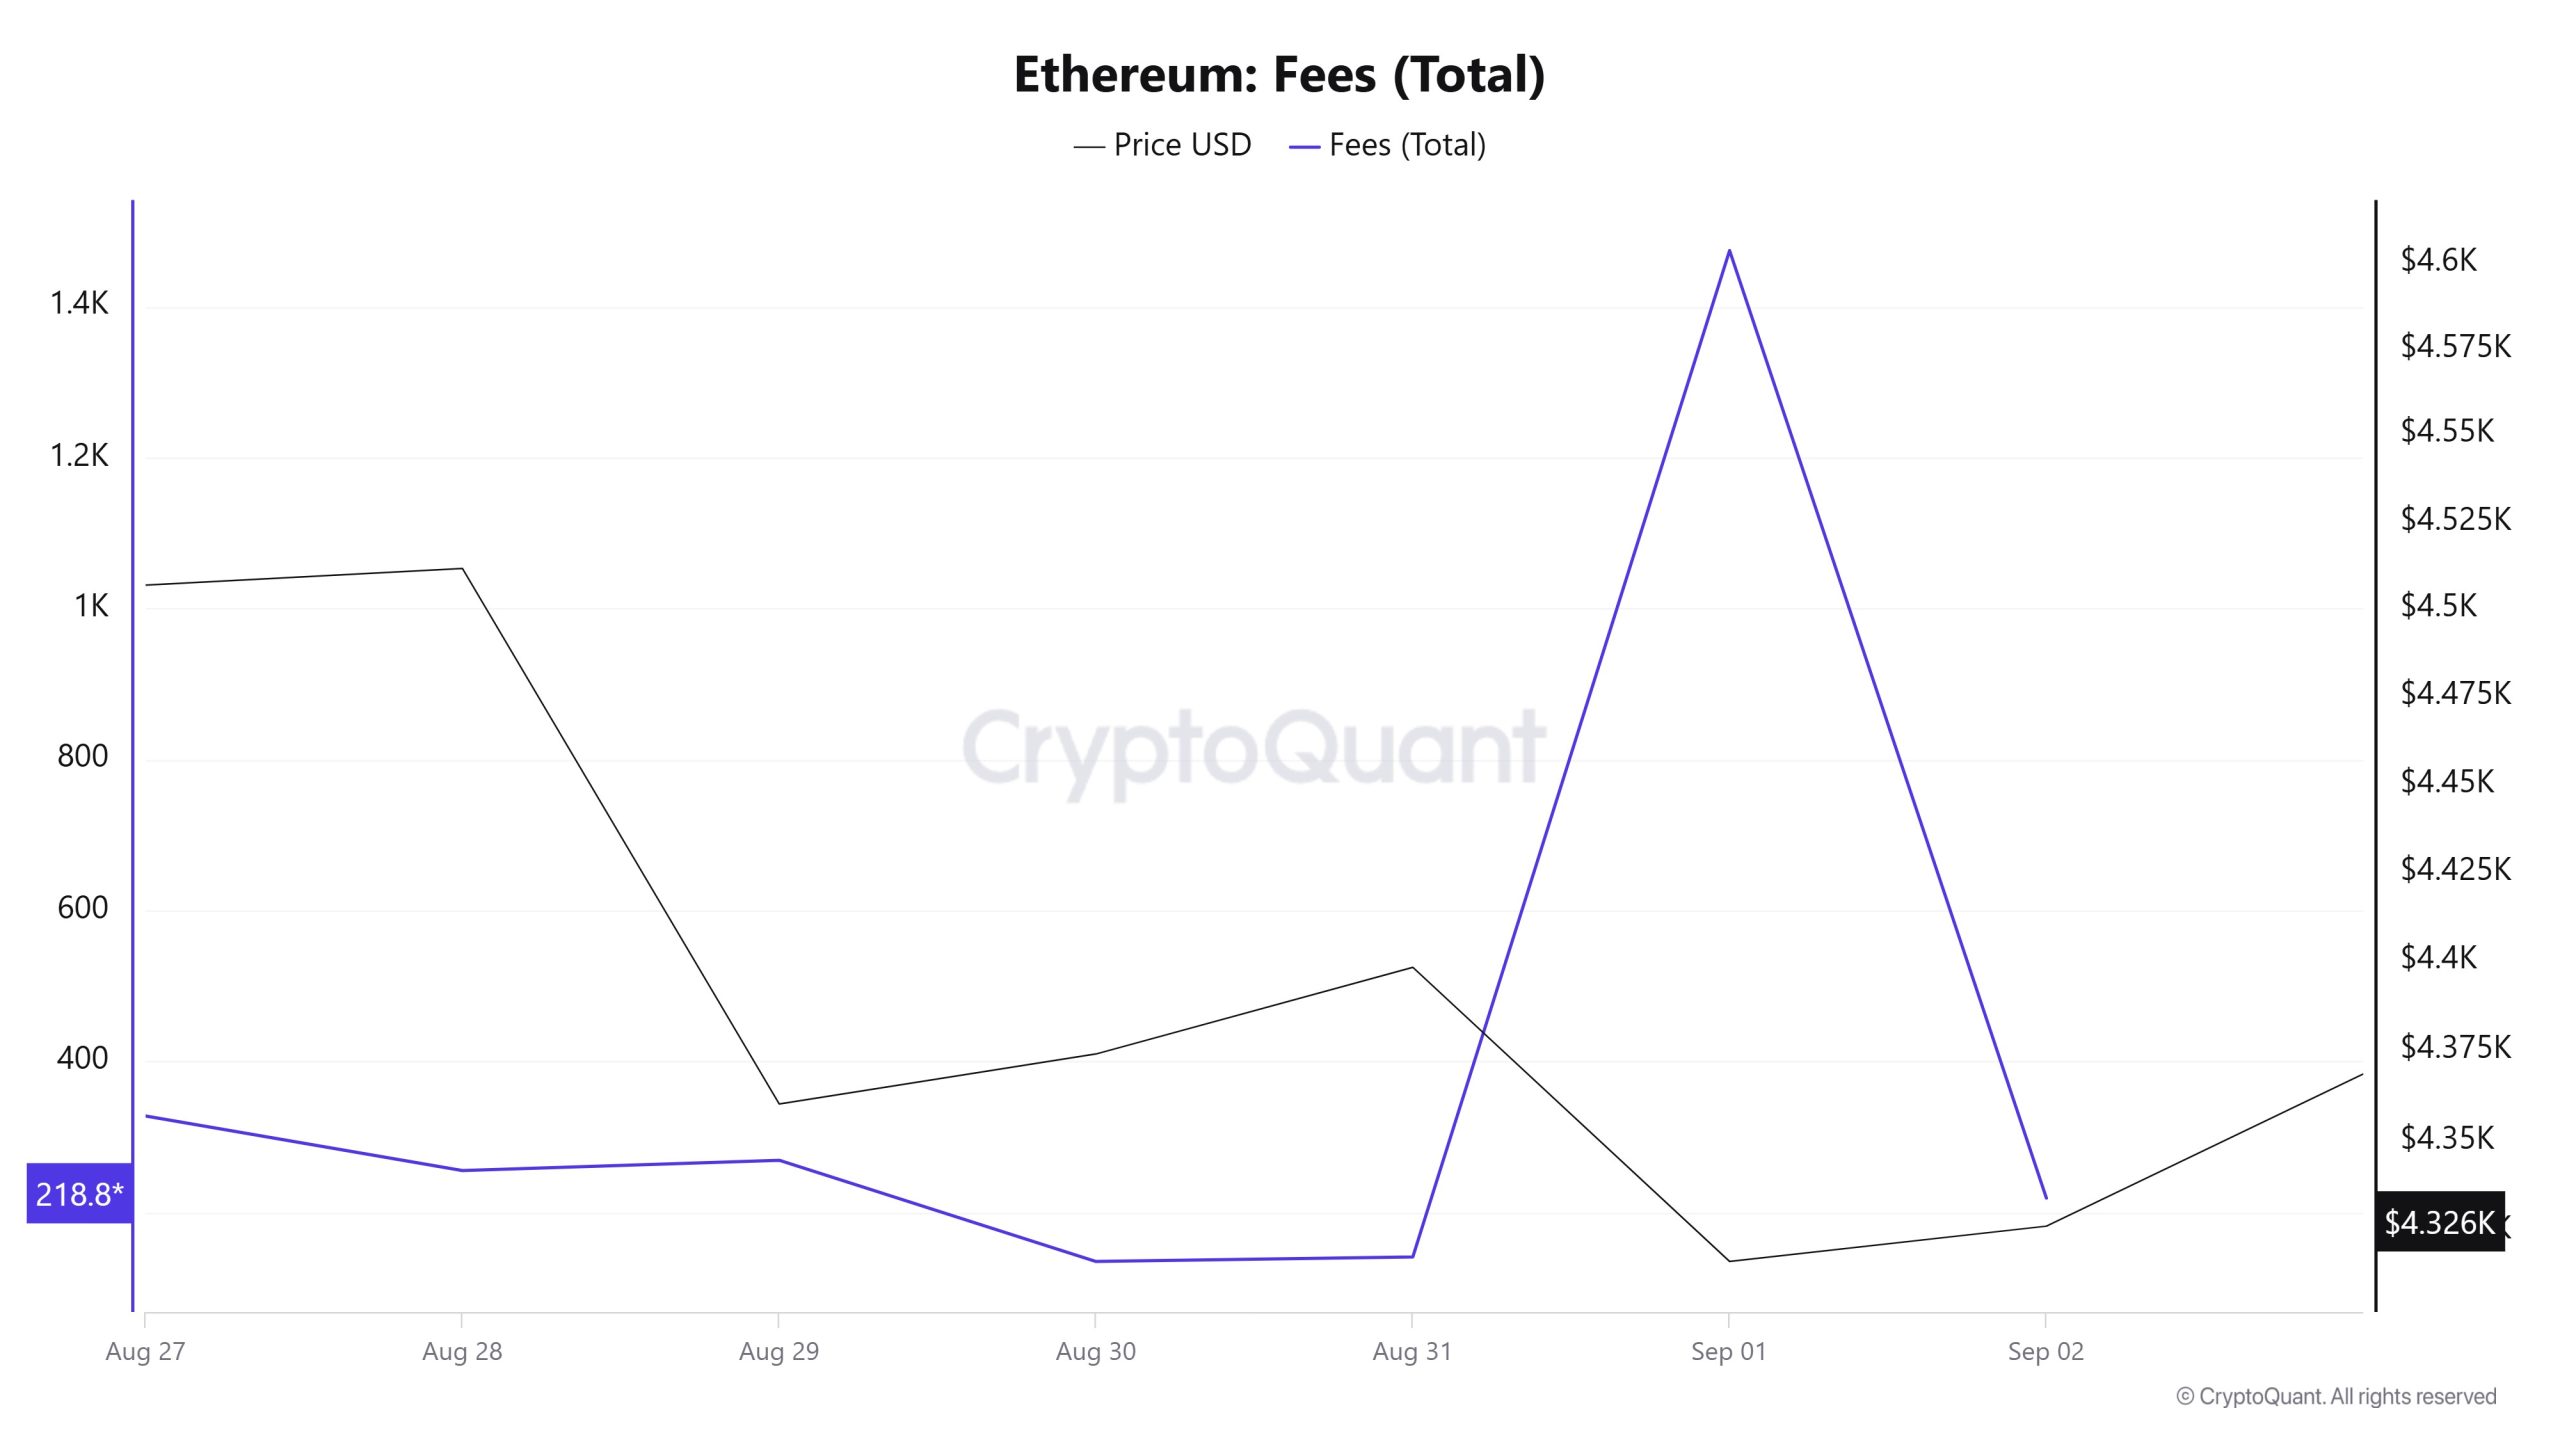
Similarly, an analysis of Ethereum Fees (Total) data between August 27 and September 2 shows that on August 27, the first day of the week, the indicator stood at 327,6600025404922.
As of August 30, the value in question, which hit its low level on August 30, followed a fluctuating course due to the volatility in Ethereum price until this date. On September 1, it rose to 1474.3387696435664, recording the highest value of the week.
In the following days, the Ethereum Fees (Total) indicator resumed its downtrend and closed at 218.86111511607587 on September 2, the last day of the week.
Blocks Mined
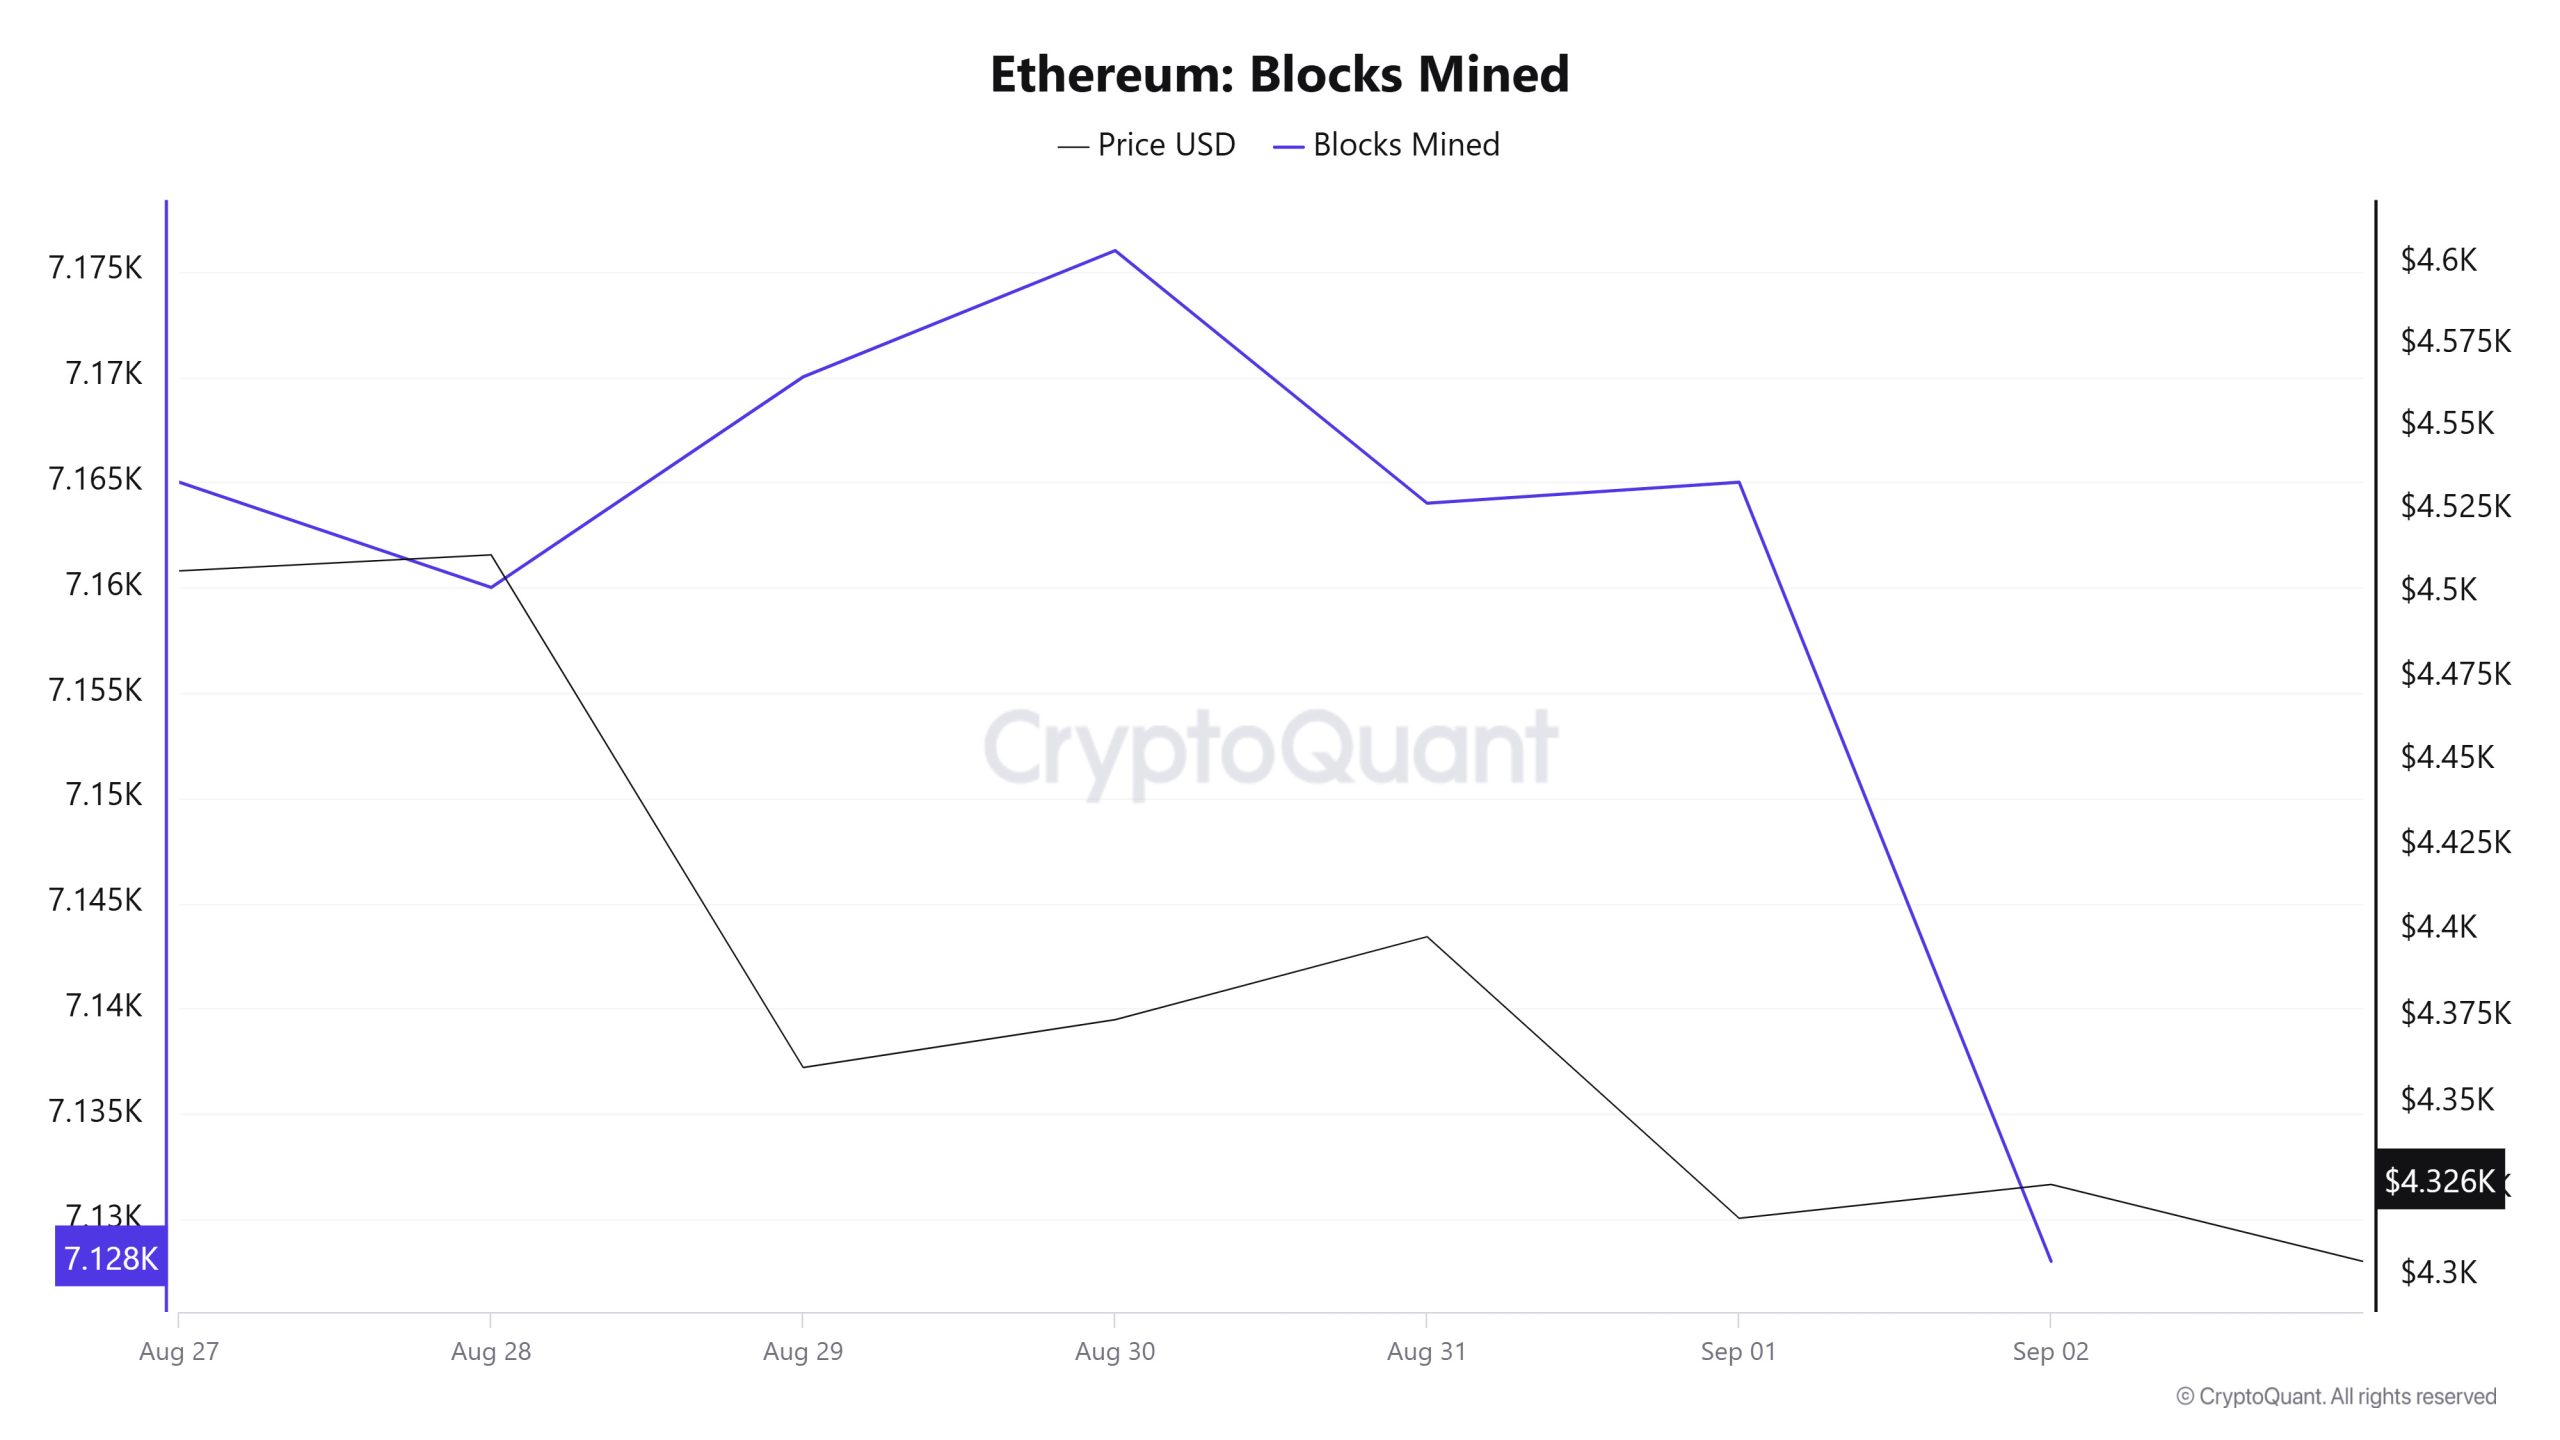
Between August 27 and September 02, Ethereum block production data showed a decline throughout the week. While 7,165 blocks were produced on August 27, this number decreased to 7,128 as of September 02. There was a negative correlation between the Ethereum price and the number of block production throughout the week.
Block Size
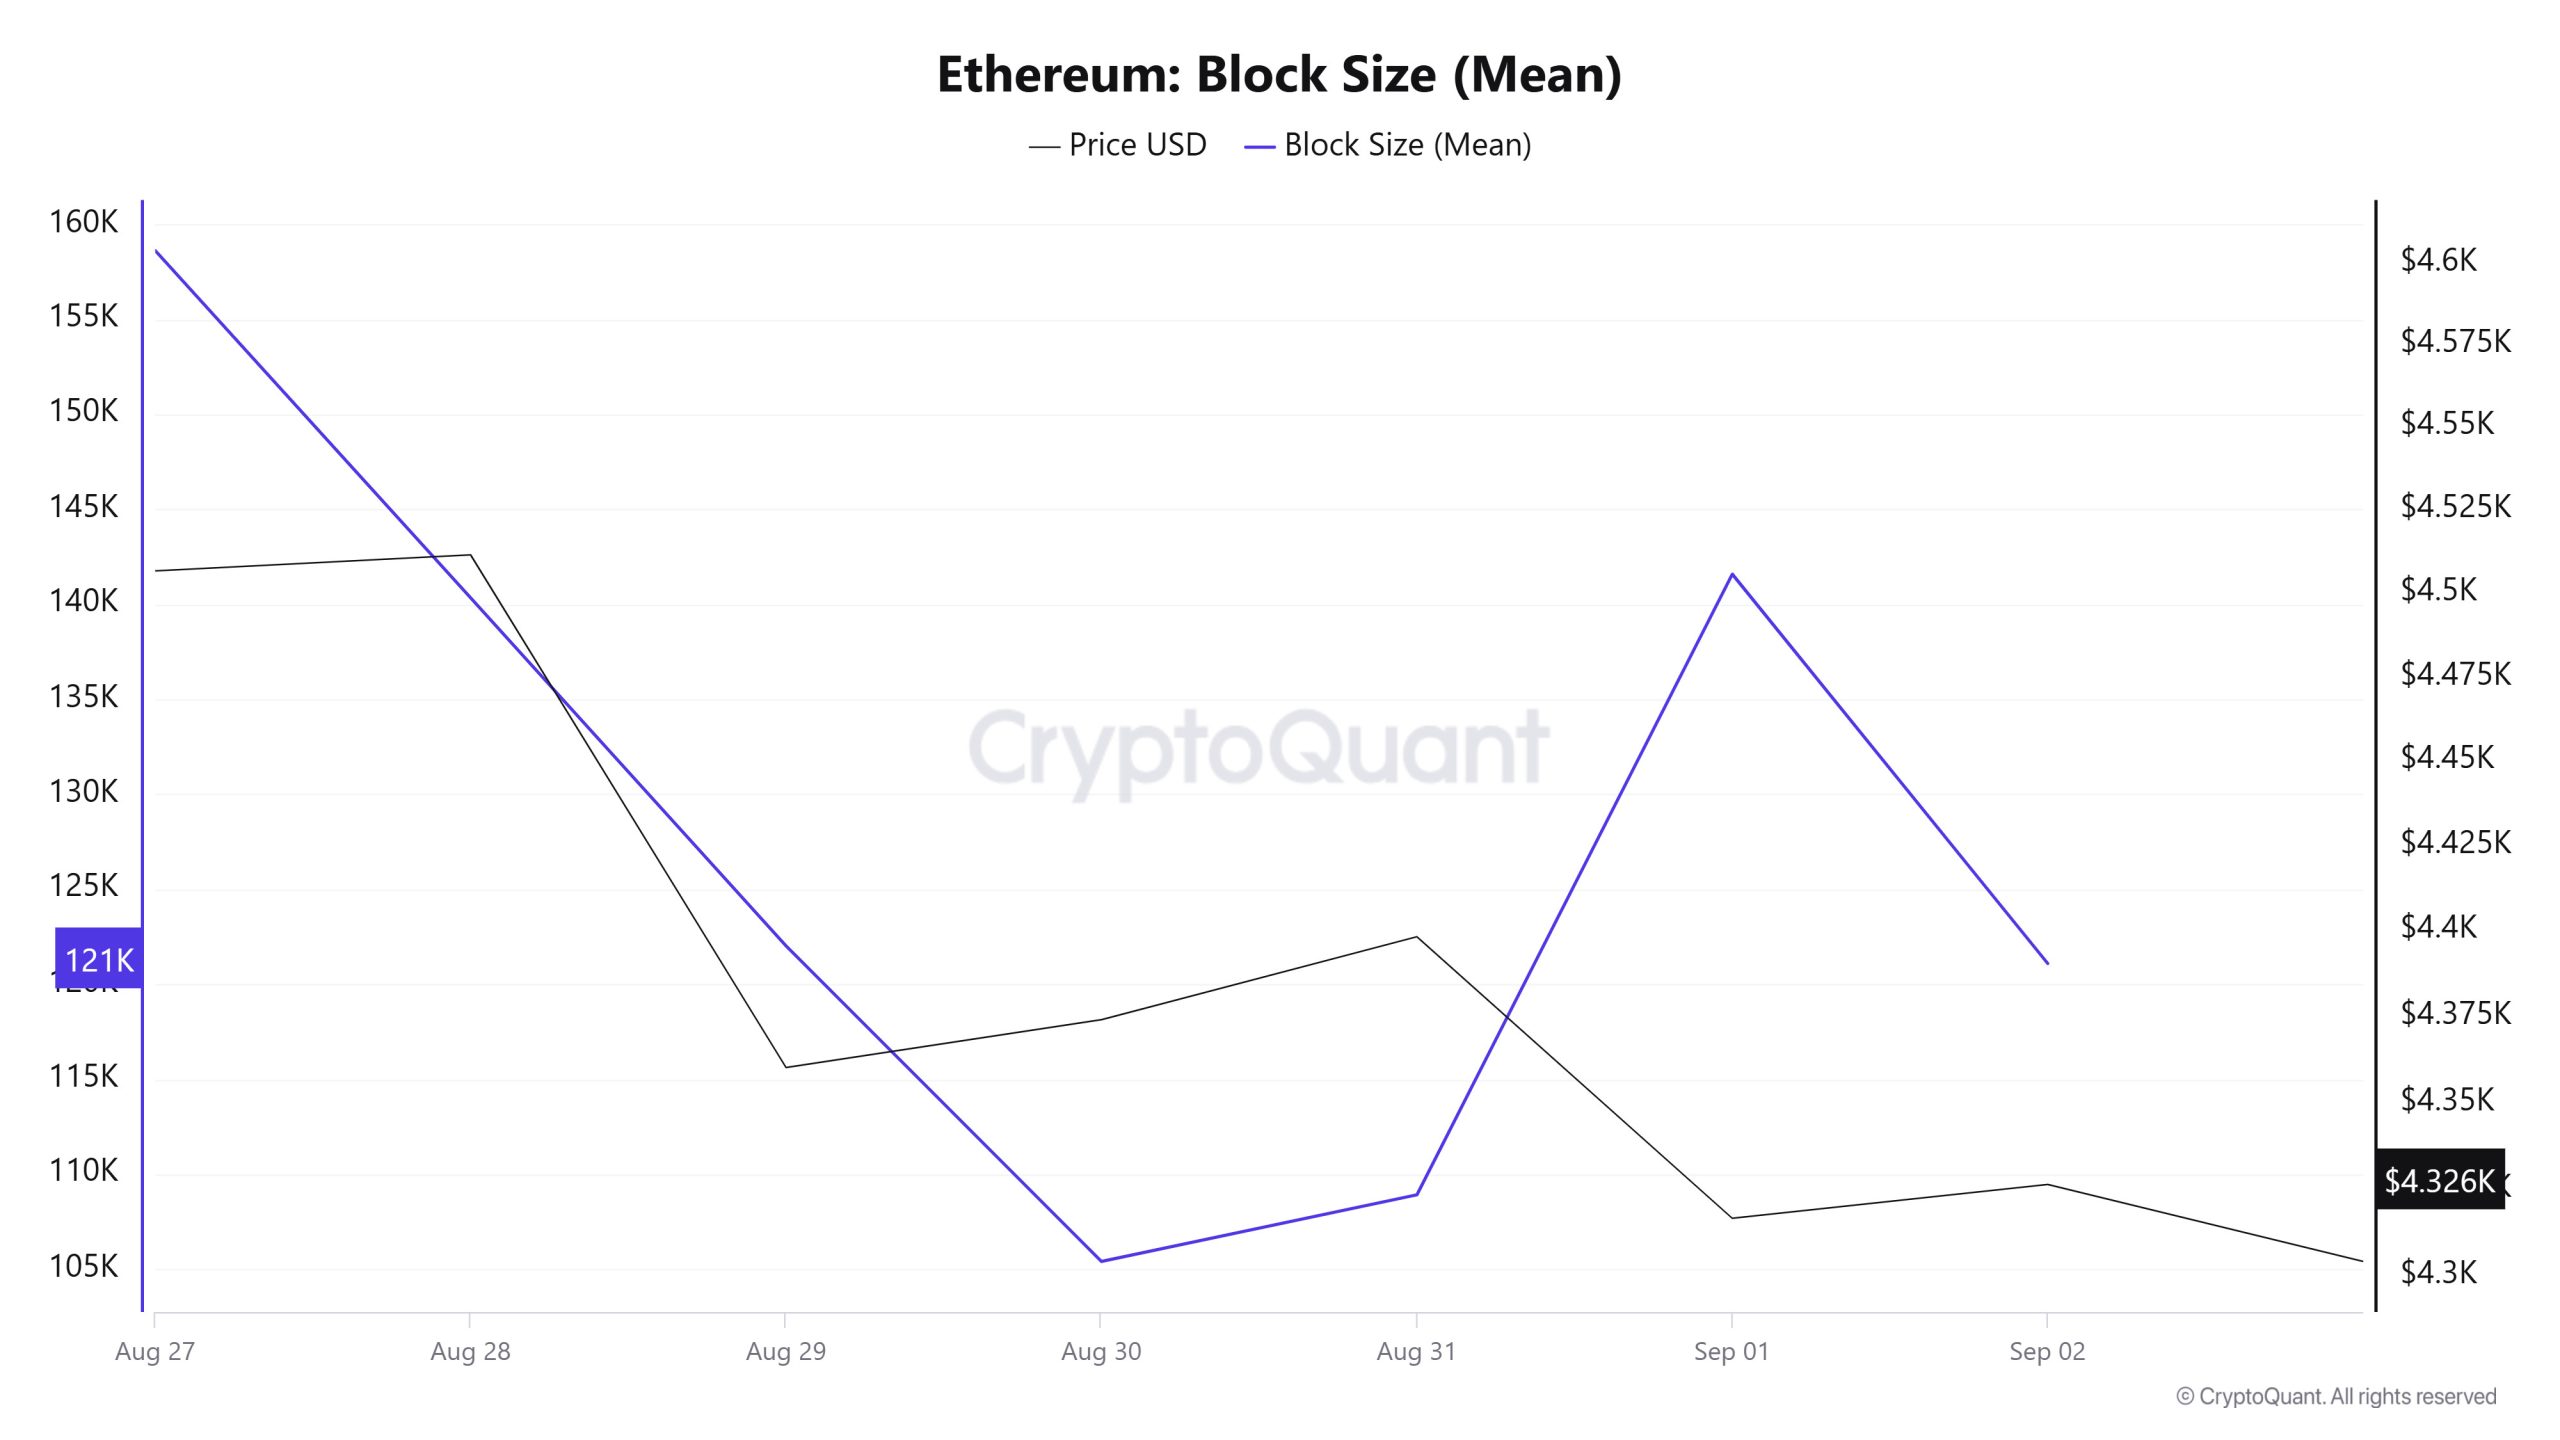
Between August 27 and September 02, Ethereum block size data shows that there was a decline throughout the week. On August 27, the average block size was 158,623 bytes, while this value increased to 121,096 bytes as of September 02.
There was a negative correlation between block size and Ethereum price during the week.
Block Interval
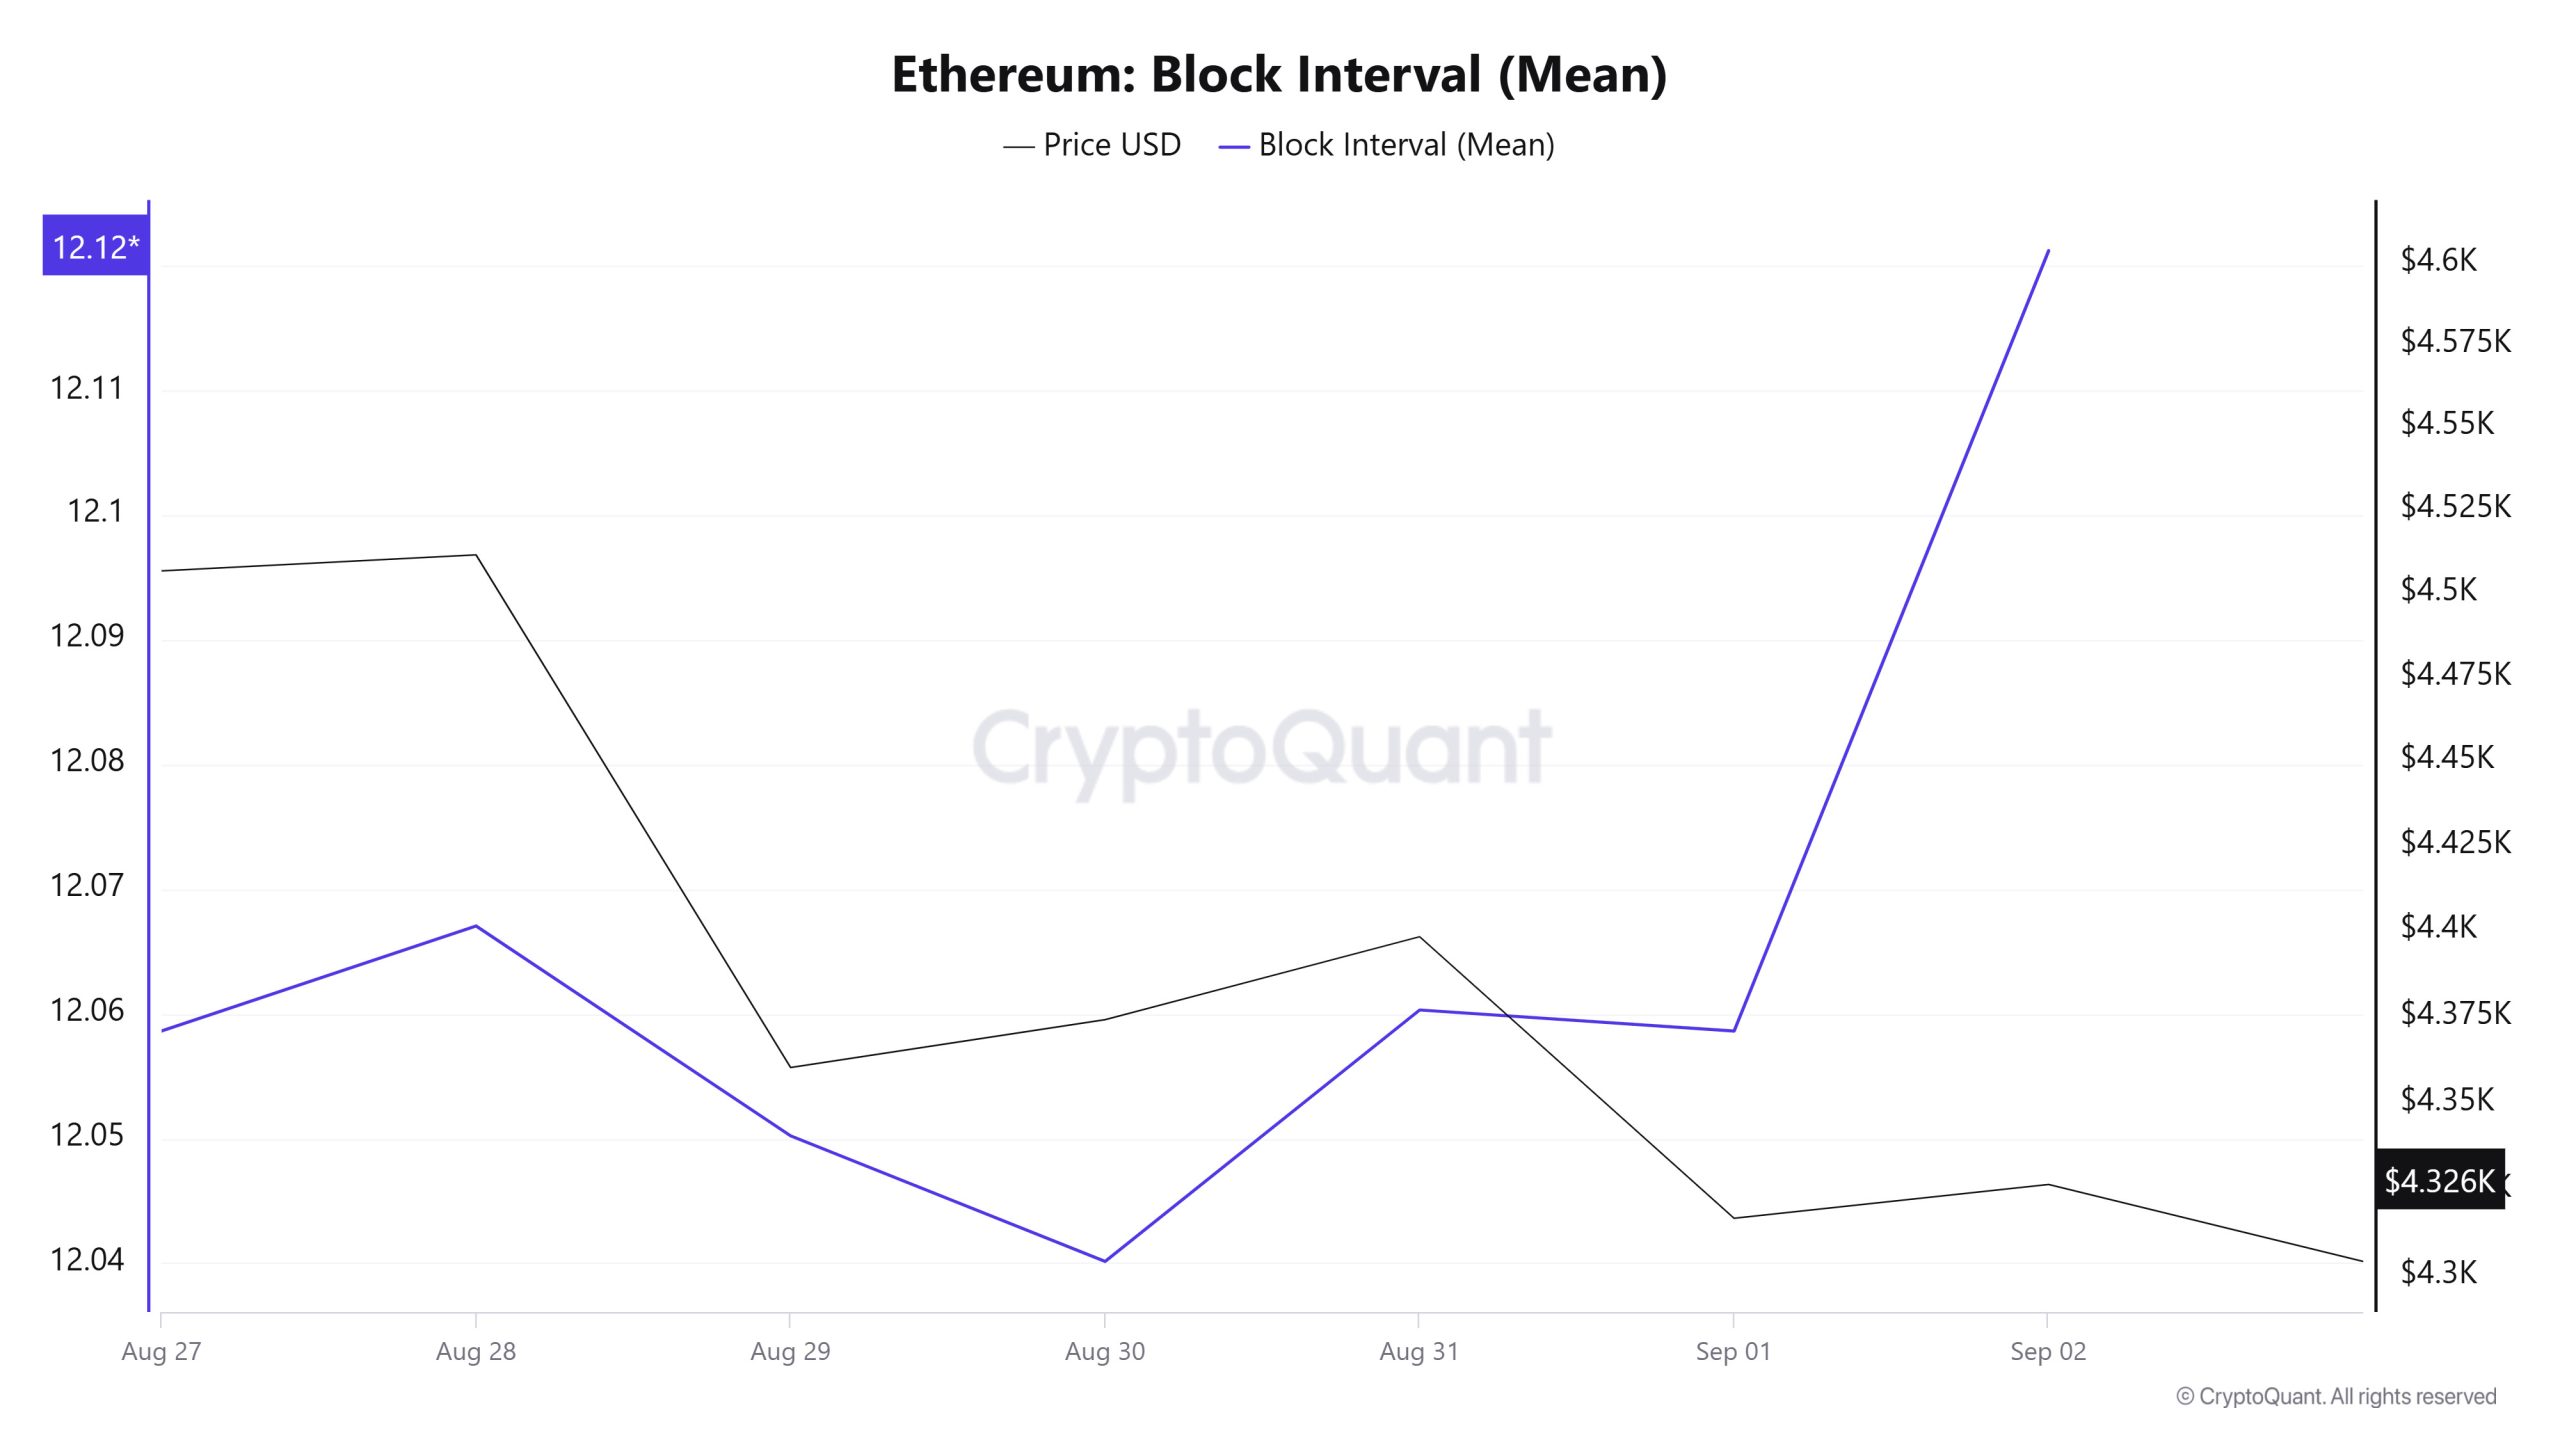
Between August 27 and September 02, Ethereum block data showed an increase throughout the week. On August 27, the average block duration was recorded as 12.05 seconds, while it increased to 12.12 seconds as of September 02.
During the period in question, Ethereum block duration and price movement were negatively correlated throughout the week.
Transaction
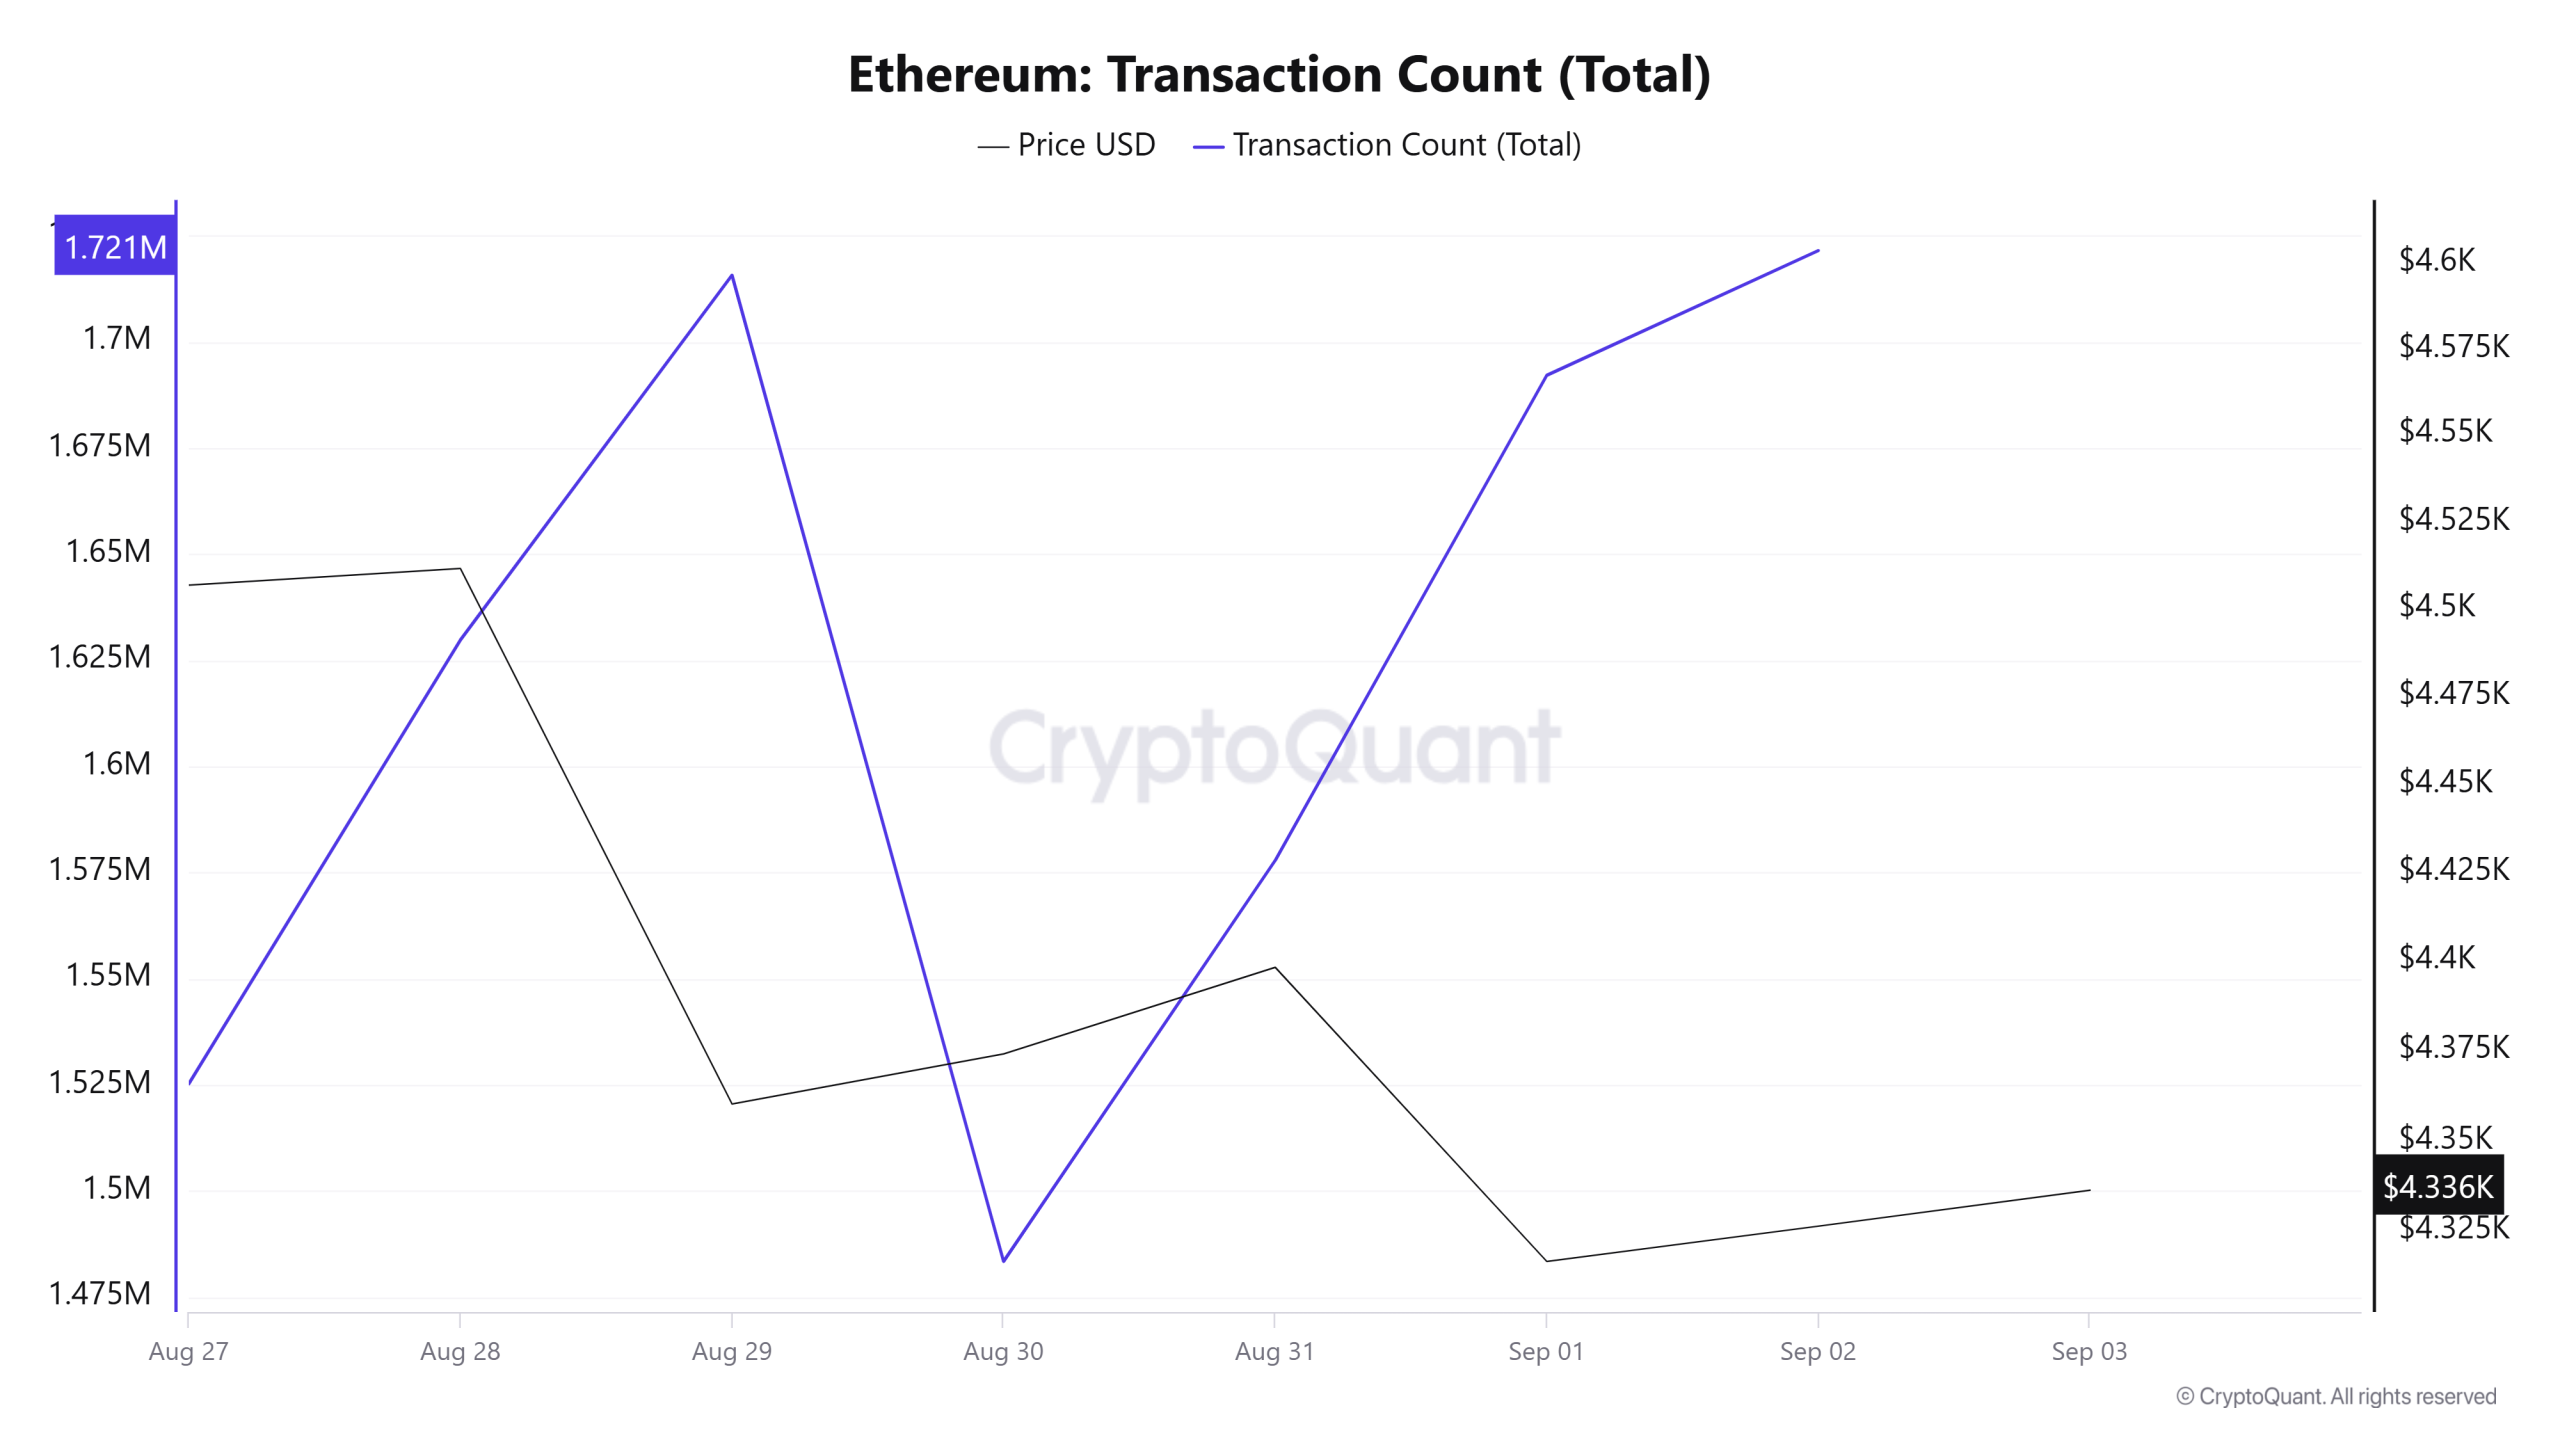
While a total of 11,461,470 transactions were made on the Ethereum network last week, it decreased by about 1.01% to 11,345,430 this week. The highest number of transactions on a weekly basis was 1,721,464 on September 2, while the lowest value was recorded as 1,483,406 on August 30. The correlation between the price and the number of transactions was negatively weighted. Although there was a slight decline in the number of transactions compared to last week, Ethereum’s all-time average transaction volume is still quite high. With high transaction volumes, Ethereum burns remain strong, providing extra strength for the network. Therefore, it seems more likely that the decline in the number of transactions is a temporary fluctuation rather than a large and permanent trend, and it should not be ruled out that this fluctuation may continue for a short time.
Tokens Transferred
Between last week and this week, the total amount of ETH transferred decreased by 39.18% from 20,927,981 to 12,727,480. While this shows a significant decrease in the amount of tokens transferred on the network, it is noteworthy that the number of transactions has not changed significantly. This suggests that major players may have frozen their positions for a short period of time and the trading phase may have been completed and the waiting period has begun. In other words, while the intensity of network utilization continues, the decline in transfer volumes can be explained more by a strategic waiting or positioning move.
On August 27, a weekly high of 3,112,977 ETH was established, indicating that the network can quickly attract trading volume during periods of high volatility. On August 30, a low of 1,202,507 ETH was reached, indicating that volatility is still evident on a daily basis. The net negative correlation between price and transfer volume this week can be interpreted as large transfer activity pressuring the price to sell. This means that the intense token movement on the network has been mostly in line with downward price action. Horizontal stability is predominant on the network, but continued sharp daily fluctuations suggest that volatility is likely to continue
Estimated Leverage Ratio
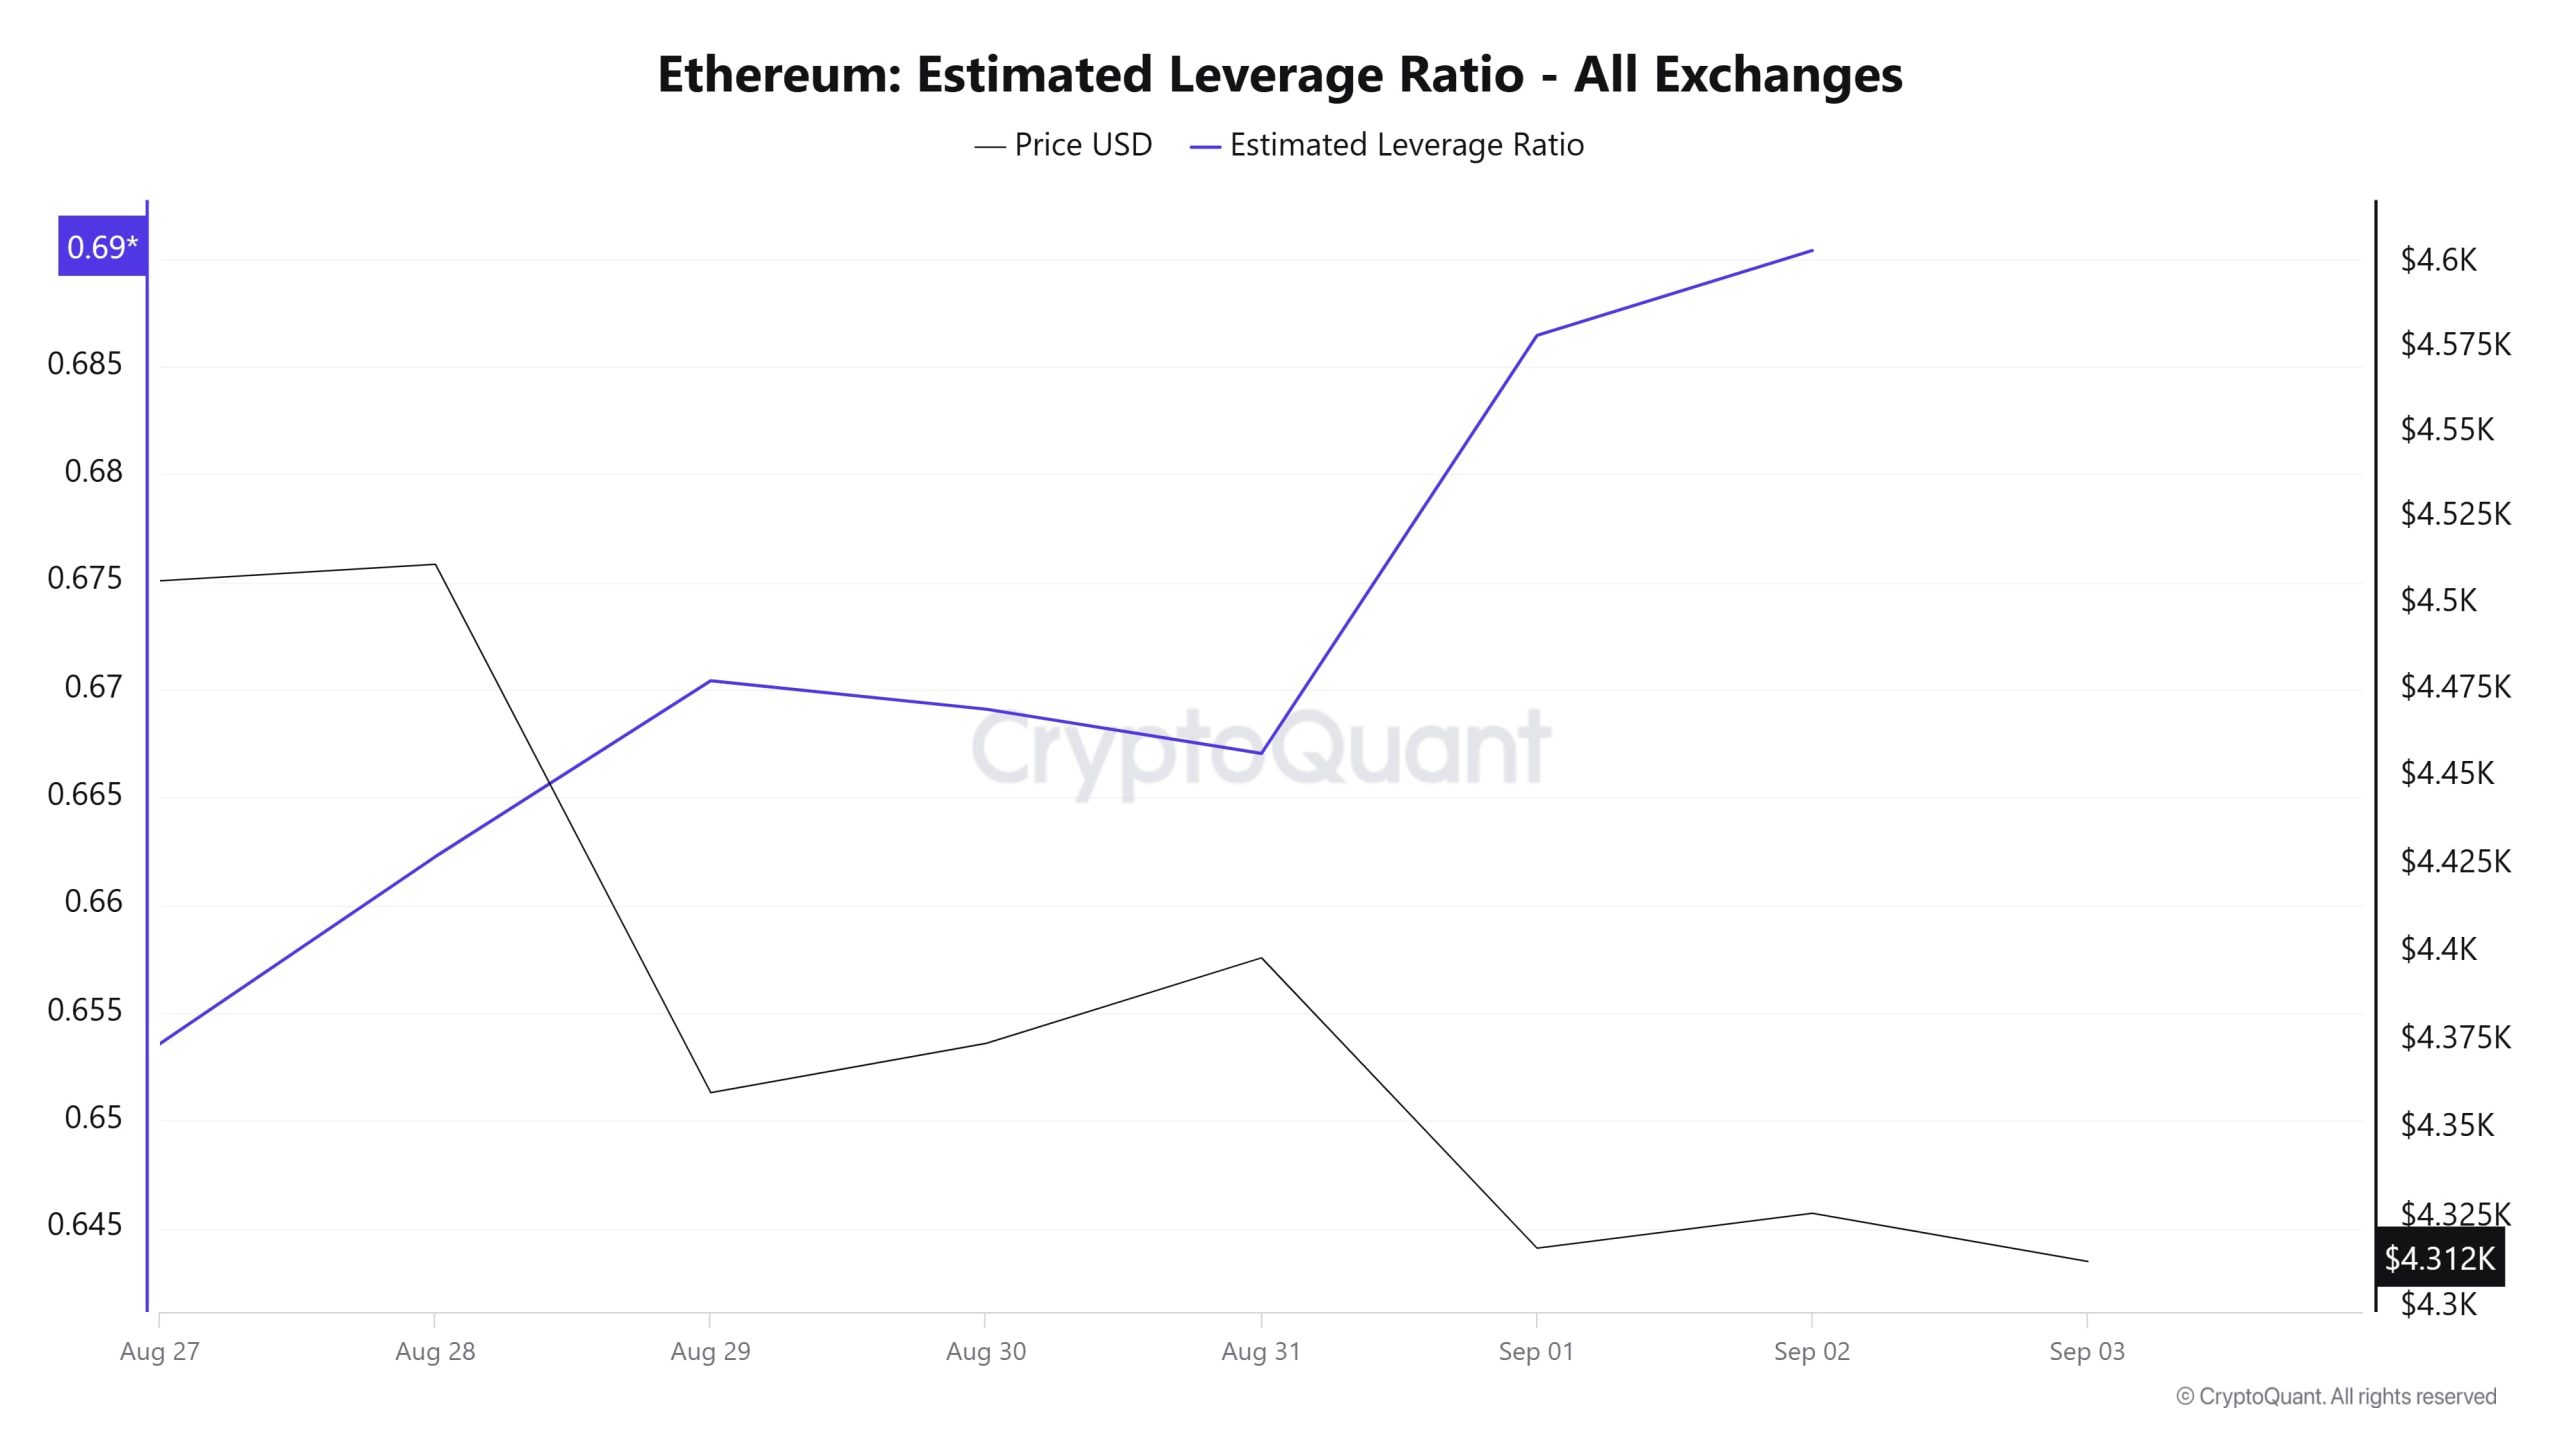 During the 7-day period, the metric displayed a steady rise throughout the entire process. ELR (Estimated Leverage Ratio), which had a value of 0.653 at the beginning of the process, also formed the lowest point of the process. As of the time of writing, it has risen to 0.690 and is at the peak of the process. A higher ELR means that participants are willing to assume more risk and generally indicates bullish conditions or expectations. It should be noted that these rises can also be caused by a decrease in reserves. When we look at Ethereum reserves, there were 17.83 million reserves at the beginning of the process, while this figure generally decreased during the rest of the process and is currently seen at 17.36 million. At the same time, Ethereum’s Open Interest is seen as 62.74 billion dollars at the beginning of the process. As of now, the volume decreased in the process and the open interest value stood out as 58.50 billion dollars. With all this data, the ELR metric increased throughout the entire process. The price of the asset was valued between $4,300 and $4,500 with all this data. At the moment, the risk appetite of investors and traders continues to be in balance and this is reflected in the price. The decrease in the open interest data that appears throughout the process and the decrease in reserves pointed to an increase in the ELR ratio, indicating an artificial rise. As a result, the fact that the reserves fell too much and the open interest did not decline so drastically caused a rise in the ELR metric. We can predict that the market is pessimistic and that the process may continue with a horizontal movement at the moment.
ETH Onchain Overall
| Metric | Positive 📈 | Negative 📉 | Neutral ➖ |
|---|---|---|---|
| Active Addresses | ✓ | ||
| Total Value Staked | ✓ | ||
| Derivatives | ✓ | ||
| Exchange Supply Ratio | ✓ | ||
| Exchange Reserve | ✓ | ||
| Fees and Revenues | ✓ | ||
| Blocks Mined | ✓ | ||
| Transaction Count | ✓ | ||
| Estimated Leverage Ratio | ✓ |
*The metrics and guidance in the table do not, by themselves, describe or imply an expectation of future price changes for any asset. The prices of digital assets may vary depending on many different variables. The onchain analysis and related guidance are intended to assist investors in their decision-making process, and making financial investments based solely on the results of this analysis may result in harmful transactions. Even if all metrics produce a positive, negative or neutral result at the same time, the expected results may not be seen according to market conditions. Investors reviewing the report would be well advised to heed these caveats.
Legal Notice
The investment information, comments and recommendations contained in this document do not constitute investment advisory services. Investment advisory services are provided by authorized institutions on a personal basis, taking into account the risk and return preferences of individuals. The comments and recommendations contained in this document are of a general type. These recommendations may not be suitable for your financial situation and risk and return preferences. Therefore, making an investment decision based solely on the information contained in this document may not result in results that are in line with your expectations.
NOTE: All data used in Ethereum onchain analysis is based on Cryptoqaunt.