
Technical Analysis
BTC/USDT
Trump emphasized that tariffs are vital for the US, stating that they are awaiting approval from the Supreme Court and may have to withdraw some trade agreements if they do not receive it. The Department of Justice requested expedited review from the Supreme Court for broad-based tariffs. Minneapolis Fed President Kashkari stated that inflation remains high but a soft landing is possible. The July JOLTS open job count fell to 7.18 million, while the Fed’s Beige Book pointed to stagnant employment. While Fed members continue to differ in tone regarding interest rate cuts, the market sees a high probability of a 25 basis point cut in September. Customs revenues hit a record $31.37 billion in August. Ukraine-Russia talks ended without results due to a disagreement over the venue, while a multilateral meeting is planned in Paris. Bitcoin hash rate reached a record level of 1,279 ZH/s on a daily basis.
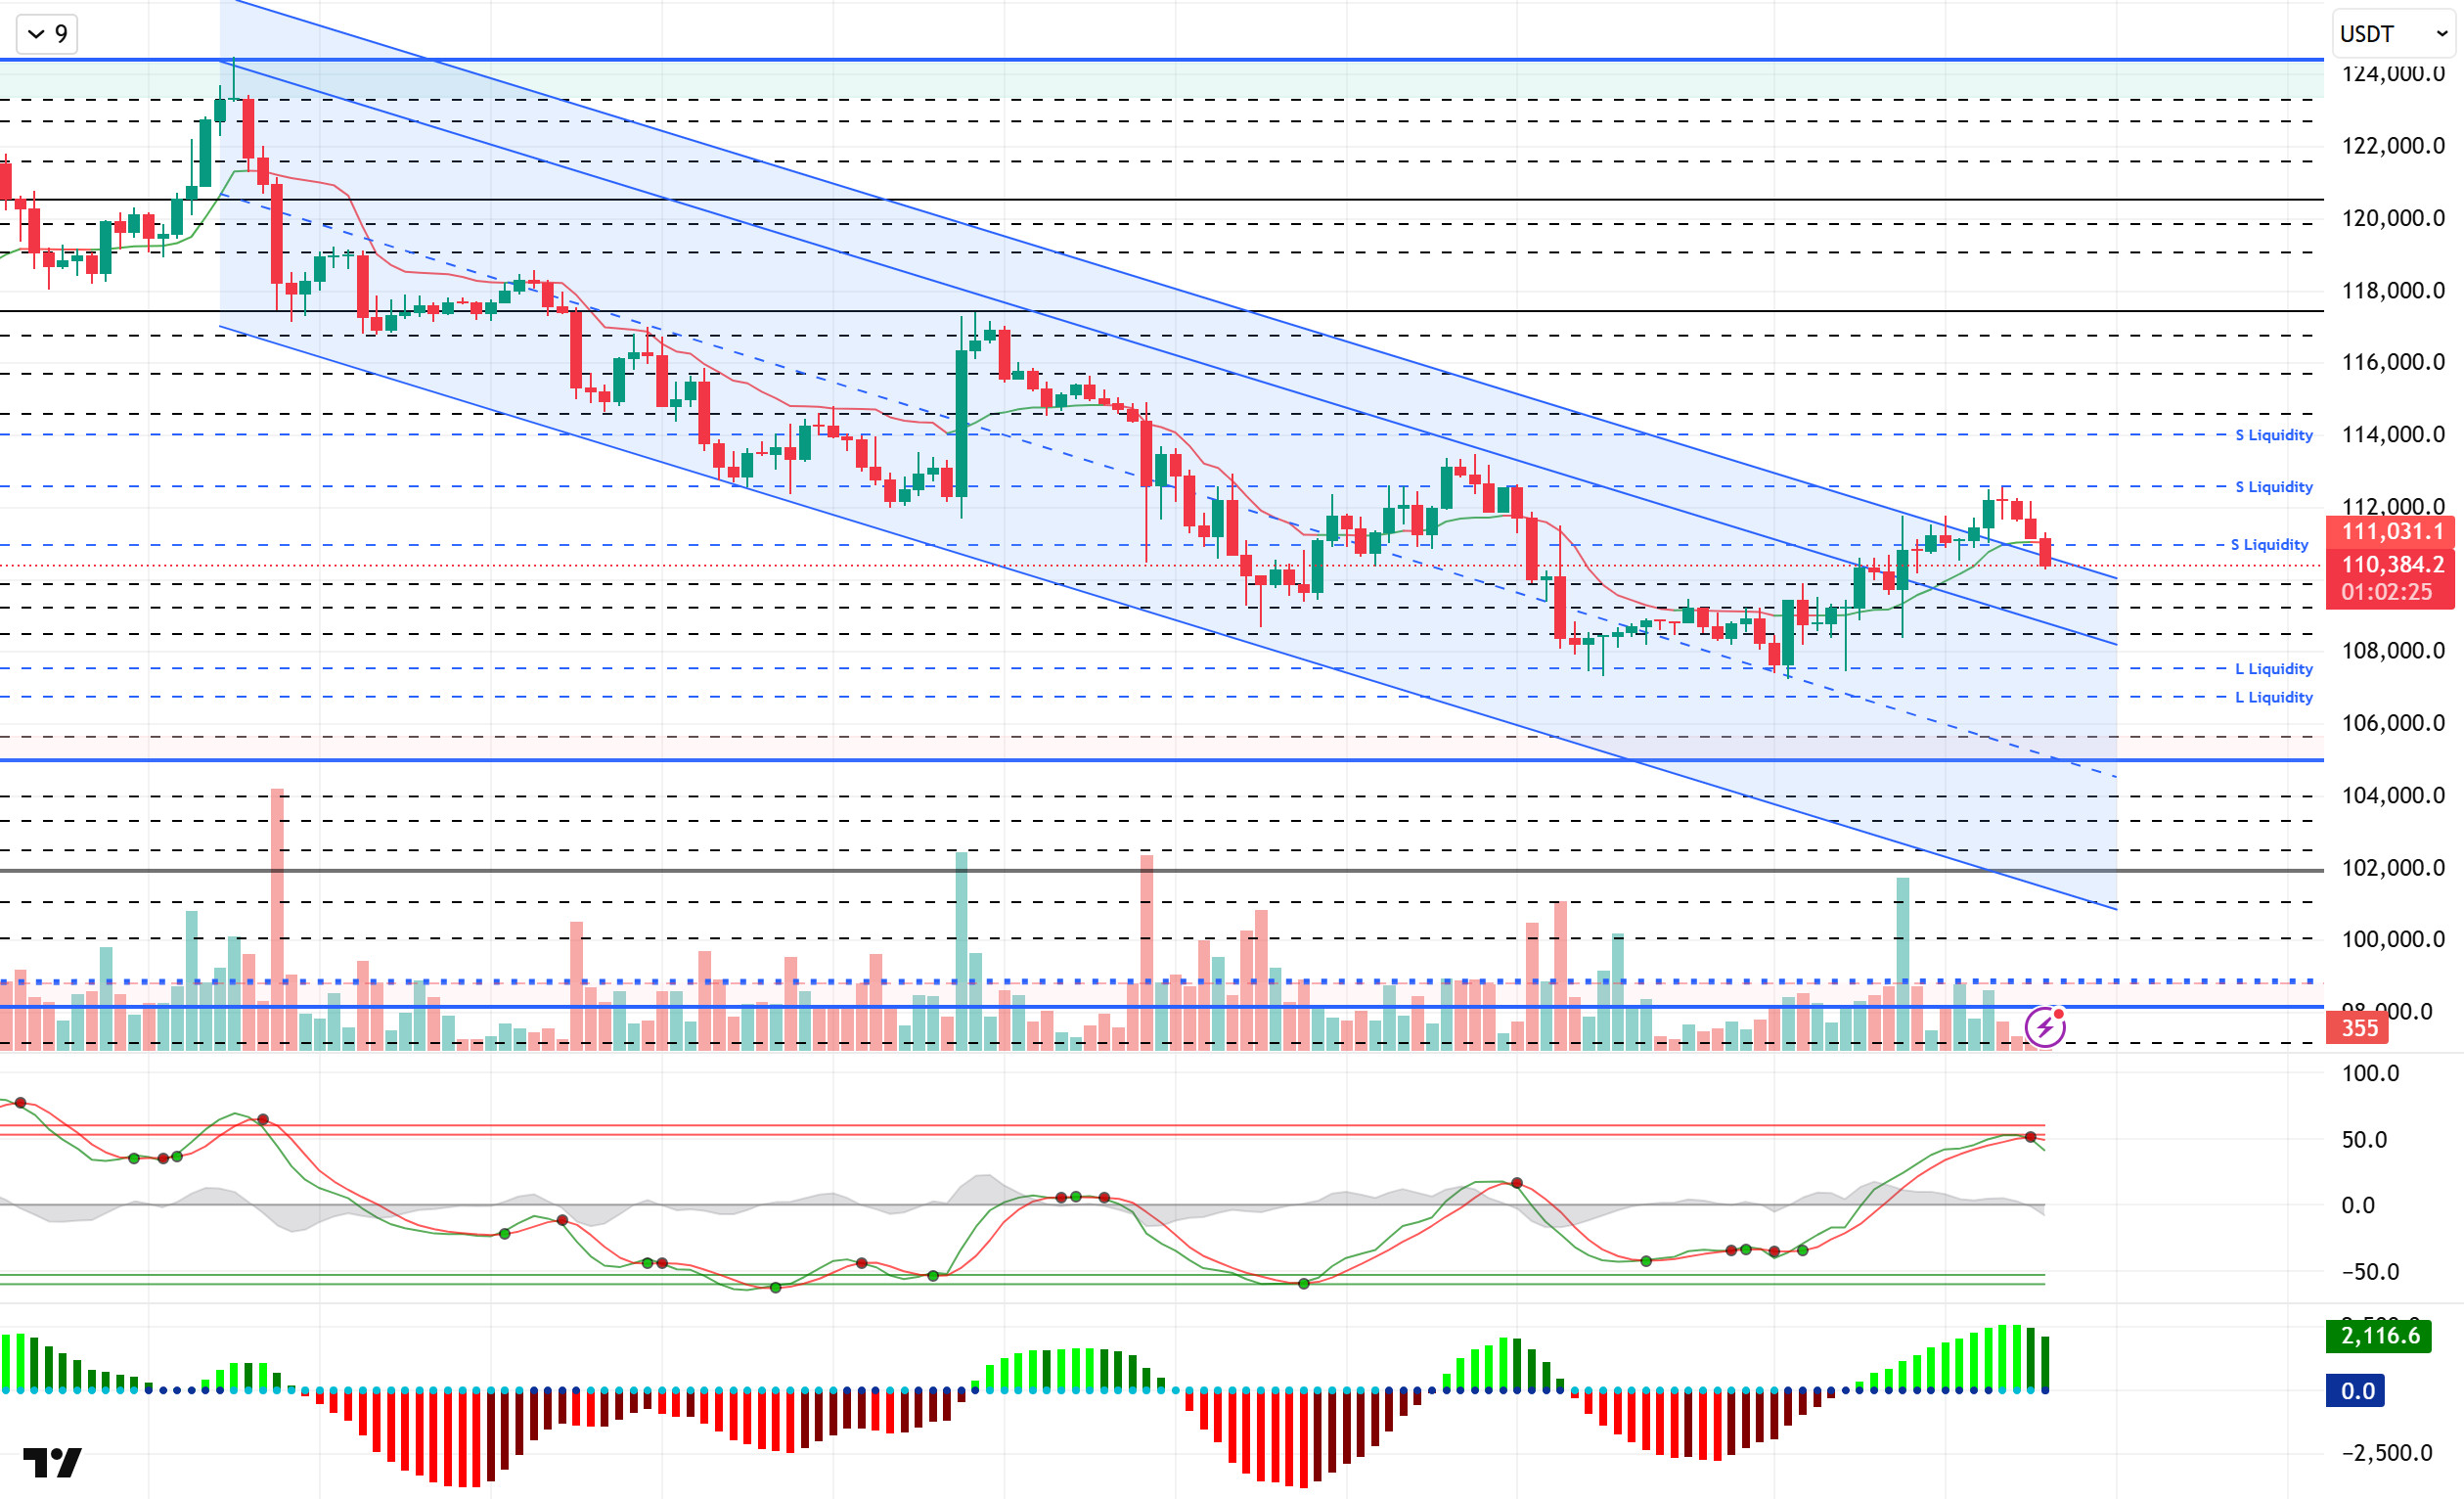
Looking at the technical picture, BTC tested the 112,500 level, breaking through the descending trend channel and the parallel trend channel extension, but failed to hold there. At the time of writing, BTC has retreated back into the channel and is trading around the 110,300 level.
Technical indicators produced a sell signal as the Wave Trend oscillator (WT) reached the overbought zone, while the Squeeze Momentum (SM) indicator began to show weakness in the positive area of the histogram. The Kaufman moving average is currently above the price, moving at the 111,000 level.
Looking at liquidity data, trades at the 112,500 level, where short-term accumulation was recorded, have been liquidated. Accumulation in the broader time frame continues at the 114,000 level. The buying level has started to accumulate at the 110,000 level in the short term, while the 106,500 – 107,500 band continues to be a more intense accumulation zone.
In summary, the disappearance of the recent optimistic mood due to fundamental developments, along with discussions among Fed members about interest rate cuts and new task allocations, and the continued focus on tariffs, are emerging as factors putting pressure on prices. Technically, although the formation of a suitable ground for a new upward movement has created some recovery, it is noteworthy that the increases remain in the form of liquidity purchases. The upward movement could turn into a trend if new catalysts reappear in the market and create a driving force on the price. In this context, the 111,000 level stands out as a resistance area for the continuation of the upward movement, and we will follow the 112,600 level along with momentum. In the event of potential selling pressure, a break below 110,000 could bring us to the 108,500 level.
Supports: 108,500 – 107,400 – 105,000
Resistances: 111,000 – 112,600 – 114,000
ETH/USDT
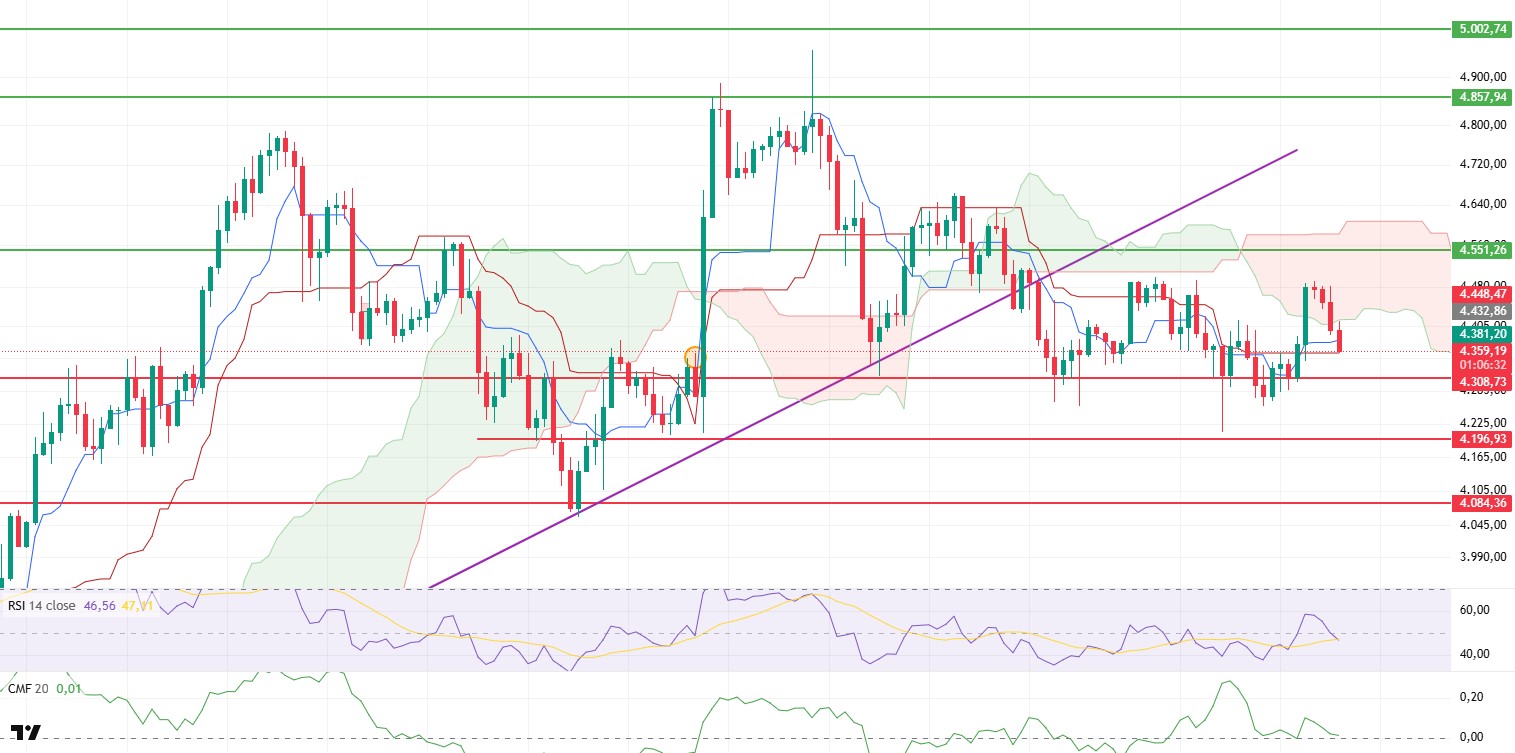
Following yesterday’s volatility, the ETH price showed a fluctuating pattern this morning. Gaining momentum after breaking through the $4,355 kijun resistance during the day yesterday, the price entered the kumo cloud and rose to the $4,490 level. However, strong selling pressure encountered in this region quickly pulled the price down, causing it to retreat to the $4,356 level. This sharp reversal indicates that buyers have lost strength and sellers have regained the upper hand in the short term.
Looking at liquidity, the Chaikin Money Flow (CMF) indicator’s horizontal movement near the zero line reveals that buyers and sellers are balanced. This outlook indicates that there is no new liquidity entering the market and that price movements are largely shaped by existing volume.
On the momentum side, the Relative Strength Index (RSI) has fallen below both its moving average and the 50 level, creating a short-term negative outlook. This picture clearly shows that the upward trend lacks the necessary strength to continue and has lost momentum.
From a technical perspective, the $4,308 support level remains critically important. A drop below this level could increase selling pressure and pull the price back to $4,196. On the upside, the $4,551 resistance level stands out. If this level is breached, buyers could re-enter strongly, potentially triggering an upward trend. Looking at the overall picture, the ETH price is searching for direction in the short term. Whether the $4,308 support holds and whether the $4,551 resistance is broken are the most critical factors that will determine the direction of the trend.
Top of Form
Below the Form
Support levels: 4,308 – 4,196 – 4,084
Resistance levels: 4,551 – 5,857 – 5,000
XRP/USDT
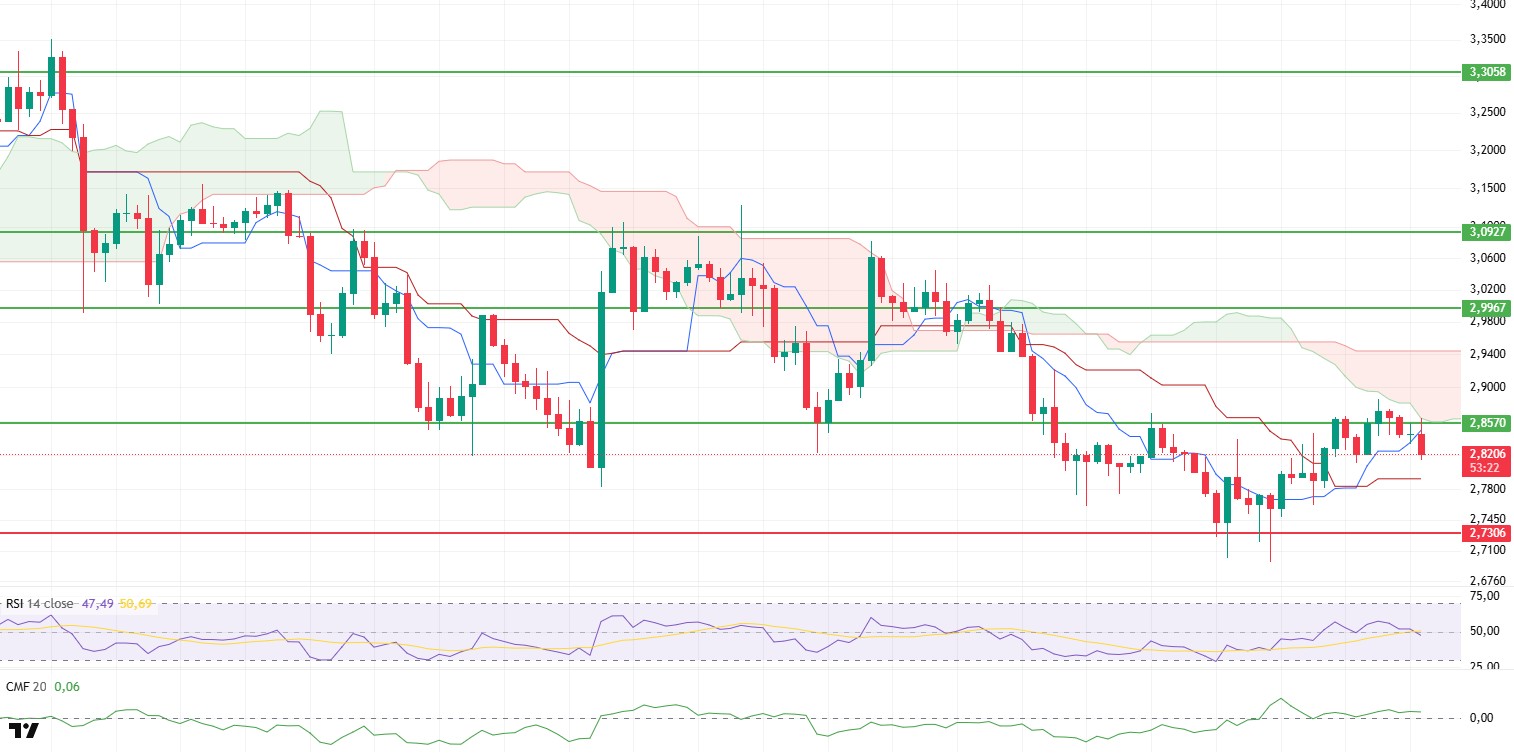
Despite rising to $2.87 yesterday evening, the XRP price failed to remain above the critical resistance level of $2.86. This morning, after reaching $2.88, it was rejected again from the lower band of the cloud and, with increasing selling pressure, breached the Tenkan level, retreating to $2.81. This movement indicates that short-term buyers are losing strength and sellers are regaining dominance.
The Ichimoku indicator, with the Tenkan level remaining above the Kijun level, continues to support the short-term positive outlook. However, the price still trading below the kumo cloud confirms that the main trend remains negative. This picture shows that stronger volume and momentum support are needed for upward movements to be sustainable.
On the liquidity side, the Chaikin Money Flow (CMF) indicator’s continued upward movement in positive territory indicates that liquidity is still entering the market, albeit at a limited rate. On the other hand, on the momentum side, the Relative Strength Index (RSI) is falling below both its moving average and the 50 level, supporting the short-term negative outlook and signaling that buyers are weakening.
Looking at technical levels, the lower band of the cloud at 2.8570 is the most critical resistance level. If this level is breached, upward momentum could gain strength. Below, the 2.7306 level stands out as strong support. If this level is breached, selling pressure could increase and the decline could deepen. Overall, the XRP price continues to search for direction in the short term. Breaking above the 2.8570 level is critical for a recovery, while maintaining the 2.7306 support is important for limiting declines.
Support levels: 2.7306 – 2.6513 – 2.4730
Resistance levels: 2.8570 – 2.9967 – 3.0927
SOL/USDT
Galaxy Digital made history as the first Nasdaq-listed company to tokenize SEC-registered shares on the Solana blockchain.
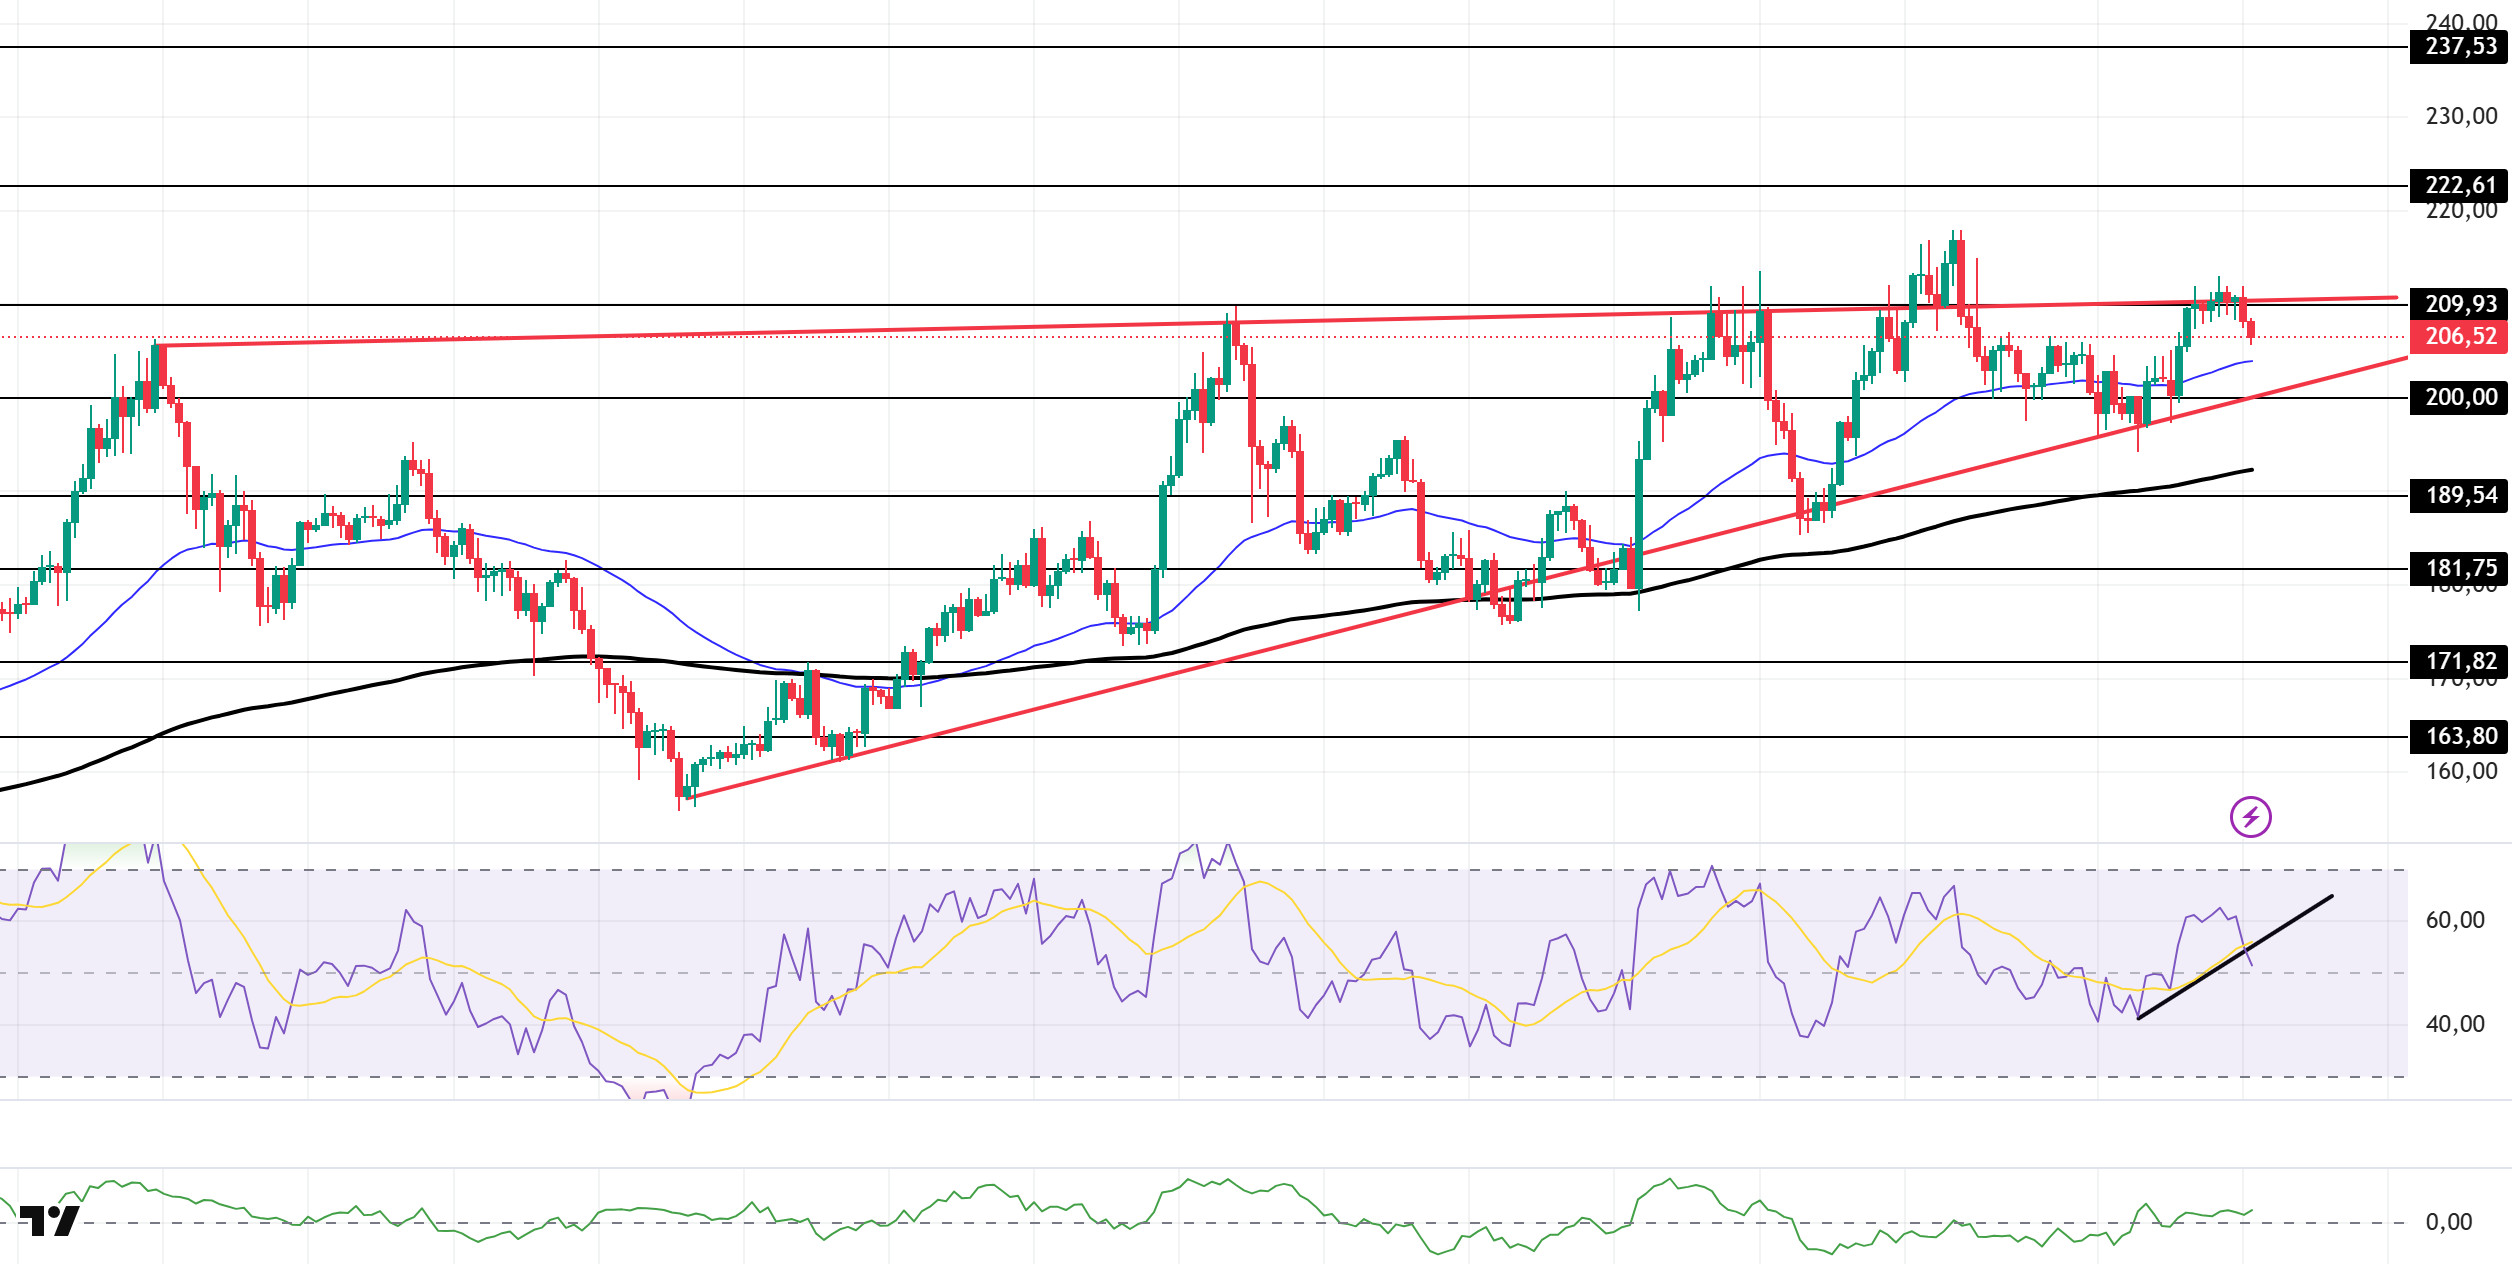
The SOL price experienced a decline. The asset continued to remain within the ascending wedge formation that began on August 2. After encountering resistance at the formation’s ceiling level and retreating, the price is currently preparing to test the 50 EMA (Exponential Moving Average – Blue Line), which is a strong support level. If the price closes below the 50 EMA, the $200.00 level could be tracked. If it experiences an uptrend, the $209.93 level could be triggered.
On the 4-hour chart, it remained above the 50 EMA (Exponential Moving Average – Blue Line) and 200 EMA (Black Line). This indicates that the medium-term upward trend may continue. At the same time, the price being above both moving averages shows us that the market is trending upward in the short term. The Chaikin Money Flow (CMF-20) remained in positive territory. However, a decrease in money inflows could push the CMF into negative territory. The Relative Strength Index (RSI-14) remained in positive territory. At the same time, it broke below the upward trend that began on September 1. This indicates that selling pressure could build. If an uptrend occurs due to macroeconomic data or positive news related to the Solana ecosystem, the $222.61 level stands out as a strong resistance point. If this level is broken upwards, the uptrend is expected to continue. If pullbacks occur due to developments in the opposite direction or profit-taking, the $200.00 level could be tested. A decline to these support levels could increase buying momentum, presenting a potential opportunity for an upward move.
Supports: 200.00 – 189.54 – 181.75
Resistances: 209.93 – 222.61 – 237.53
DOGE/USDT
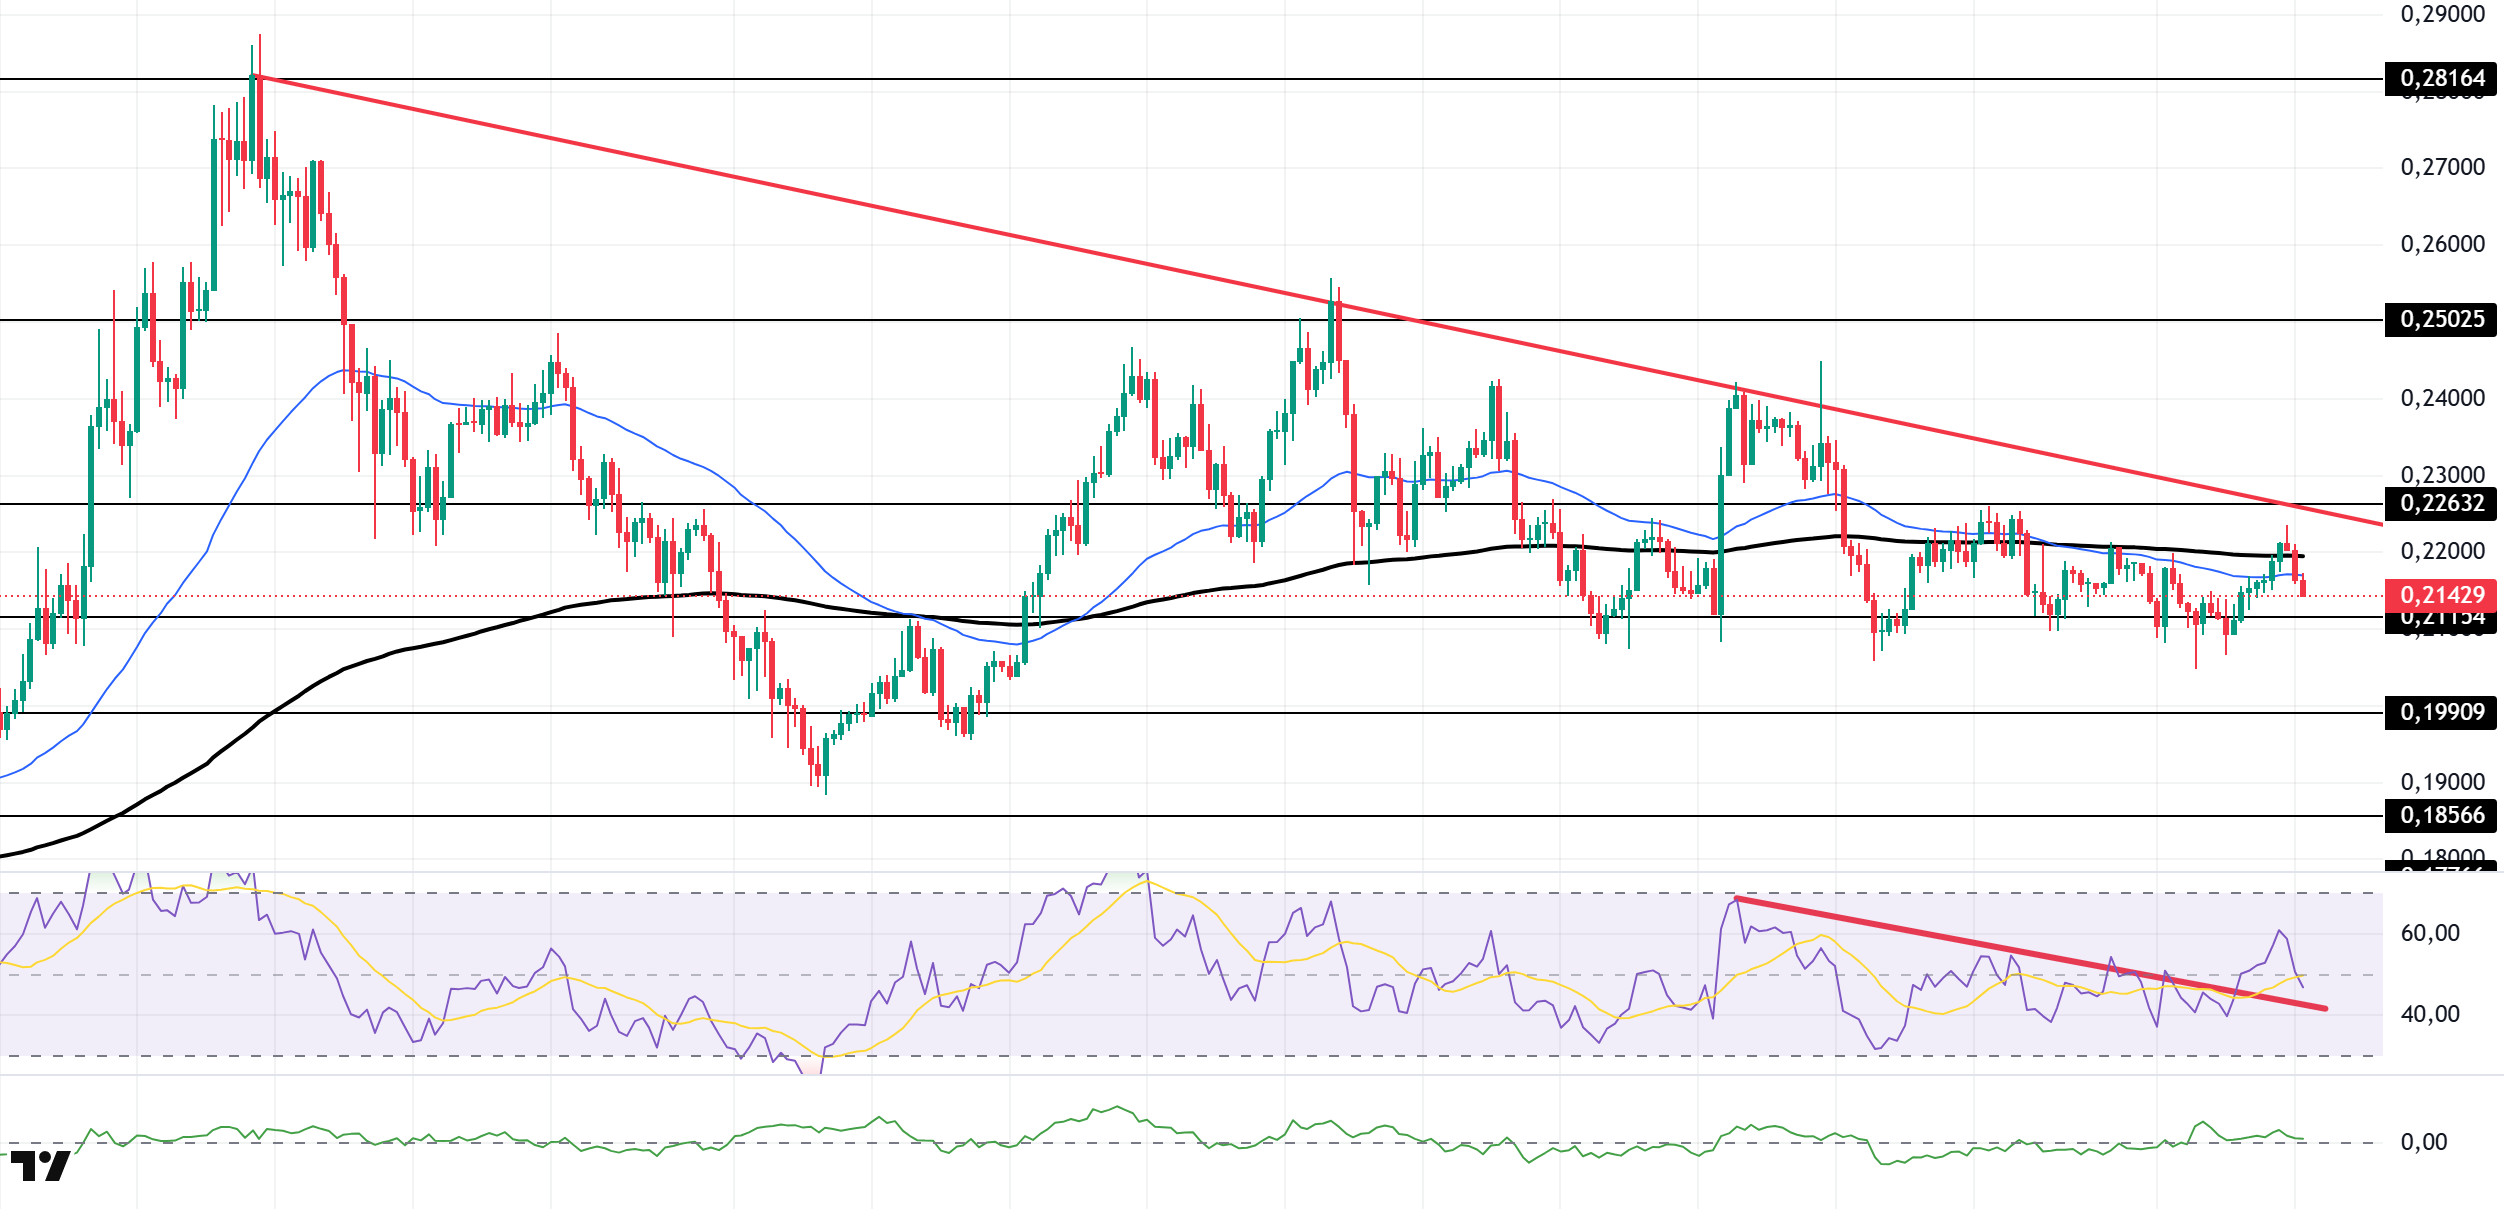
The DOGE price experienced a slight decline. The asset continued to trade below the downtrend that began on July 21. The price, facing resistance from the 50 EMA (Exponential Moving Average – Blue Line) and 200 EMA (Black Line) moving averages, experienced a slight decline and is preparing to test the strong support level of $0.21154. If the upward trend continues, the $0.22632 level should be monitored. If the downward trend continues, the $0.19909 level should be monitored.
On the 4-hour chart, the 50 EMA (Blue Line) remained below the 200 EMA (Black Line). This indicates that a medium-term downward trend has begun. The price being below both moving averages also shows that the asset is in a downward trend in the short term. The Chaikin Money Flow (CMF-20) remained in positive territory. Additionally, a decrease in money inflows could push the CMF into the negative zone. The Relative Strength Index (RSI-14) fell into negative territory. At the same time, it continues to remain in the upper region of the downward trend that began on August 22. This could trigger an upturn. In the event of an upturn driven by political developments, macroeconomic data, or positive news flow in the DOGE ecosystem, the $0.22632 level stands out as a strong resistance zone. Conversely, in the event of negative news flow, the $0.19909 level could be triggered. A decline to these levels could increase momentum and potentially trigger a new upward wave.
Supports: 0.21154 – 0.19909 – 0.18566
Resistances: 0.22632 – 0.25025 – 0.28164
LTC/USDT
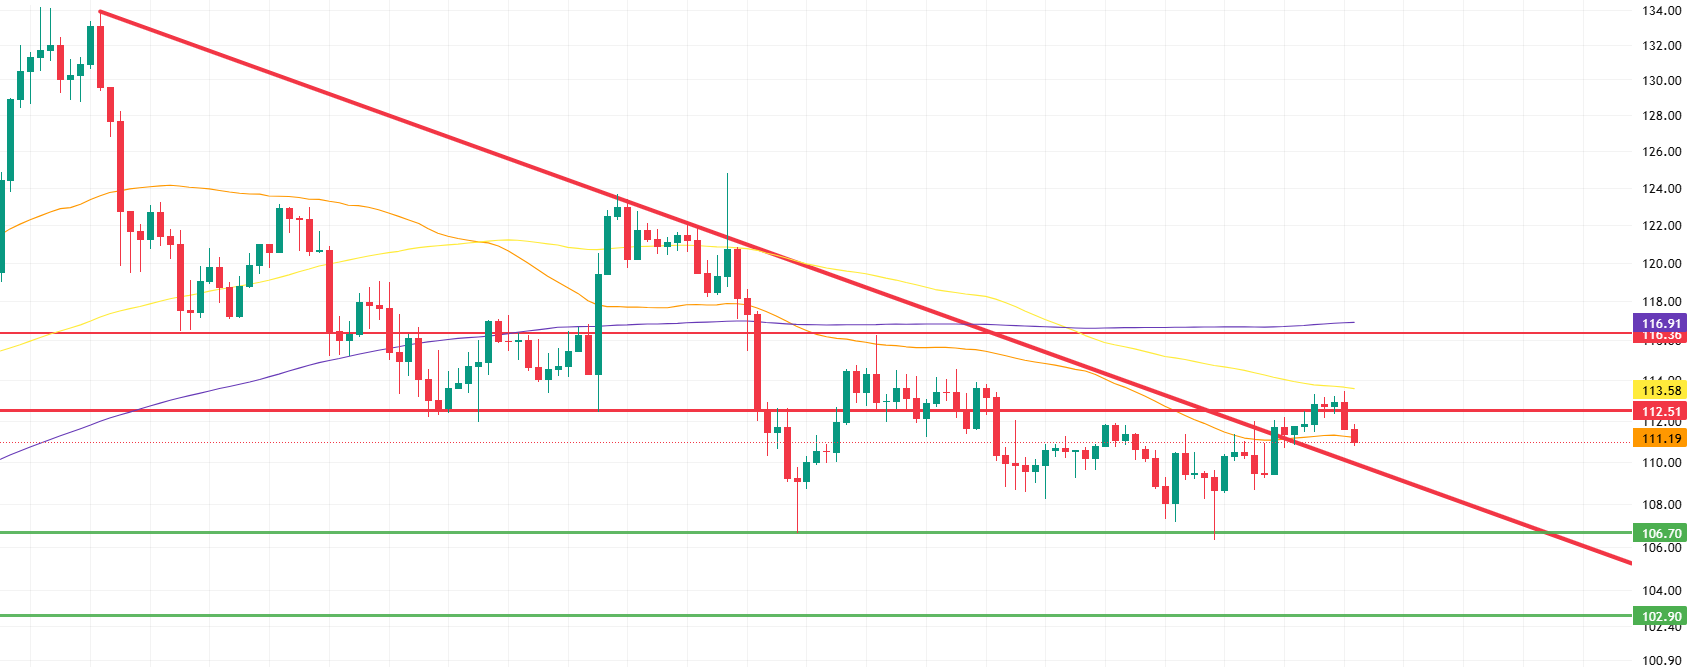
LTC closed the previous day with a 1.11% increase, recording a 0.70% increase in value against Bitcoin and starting the new day at 112.93. On the futures side, the long/short position ratio opened in the last 24 hours falling to 0.98 indicates that downward expectations are gaining weight among derivatives market participants. The decline in funding rates also confirms the increase in short positions. This outlook reveals that the upward momentum in the spot market is beginning to struggle to find support in the derivatives markets.
The upward scenario predicted in the previous evening’s analysis has materialized, with the price rising to the 100-period moving average (yellow line) before experiencing a pullback. The fact that this pullback found support at the 50-period moving average (orange line) suggests that the decline may be complete. In this scenario, renewed selling pressure can be expected at the 112.51 level, while the 100-period average at 113.58 maintains its position as a major resistance. Finally, the horizontal resistance at the 116.36 level acts as a strong barrier due to its proximity to the 200-period moving average (purple line).
On the other hand, if the upward attempts fail and the price falls below the 50-period moving average, panic could set in the market. In such a scenario, the first minor support level to watch is 106.70, while 102.90 emerges as a critical support level if the decline deepens.
Supports 111.19 – 106.70 – 102.90
Resistances 112.51 – 113.58 – 116.36
Legal Notice
The investment information, comments, and recommendations contained herein do not constitute investment advice. Investment advisory services are provided individually by authorized institutions taking into account the risk and return preferences of individuals. The comments and recommendations contained herein are of a general nature. These recommendations may not be suitable for your financial situation and risk and return preferences. Therefore, making an investment decision based solely on the information contained herein may not produce results in line with your expectations.

