
Technical Analysis
BTC/USDT
ECB President Christine Lagarde announced that the risks in the European economy have become more balanced, and the disinflation process has ended. US Secretary of Commerce Lutnick gave a message of trade agreements with India and Switzerland and reported that tariffs are generating $40 billion in monthly revenues. Unemployment claims in the US rose to 263,000, reinforcing Fed’s rate cut expectations. August inflation was realized as 2.9% in CPI and 3.1% in core CPI. According to Onchain Lens data, 232 BTC was transferred from a wallet that remained inactive for 13.1 years.
When we look at the technical outlook, BTC, which has been moving within the horizontal band range for a long time, expanded its bullish channel by testing the 116,300 level. BTC, which experienced a slight pullback after testing this region, continues to trade at 115,300.
Technical indicators came to the overbought zone once again, with the Wave Trend oscillator (WT) giving a buy signal, pointing to a trend reversal near the channel mid-band. On the Squeeze Momentum (SM) indicator, the histogram has regained momentum in the positive area, supporting the uptrend, while the Kaufman moving average is currently moving below the price at 114.100.
Looking at the liquidity data, short-term accumulating sell trades were liquidated at 113.200, while broader timeframe sell accumulation was liquidated above 114.000. With the recent rally, sell trades were liquidated once again around 115,000. On the other hand, while the buying tier provides an intense accumulation at 113,000 in the short term, the 108,000 – 109,000 band continues to be the accumulation zone in the long term.
To summarize, the optimistic sentiment, which had been lost recently due to fundamental developments, regained strength ahead of the upcoming meeting as US macro data and interest rate cut expectations became almost certain. Following the favorable backdrop provided by the technical outlook, the price completed the consolidation in the horizontal band it has been in for a long time and tested the 116,300 level with the minor bullish channel. When the liquidity data is analyzed, it is seen that the selling positions are liquidated and the buying transactions are gaining weight, which confirms the rise. In the next period, it will be critical for the price to maintain the bullish channel in terms of the sustainability of the rise. In particular, closures above the 115,000 level will be monitored as an important reference point for the continuation of the rise. In a possible selling pressure, the 113.500 – 113.000 band will be followed as the first support zone.
Supports 115,000 – 114,000 – 113,500
Resistances 116,100 – 117,400 – 119,000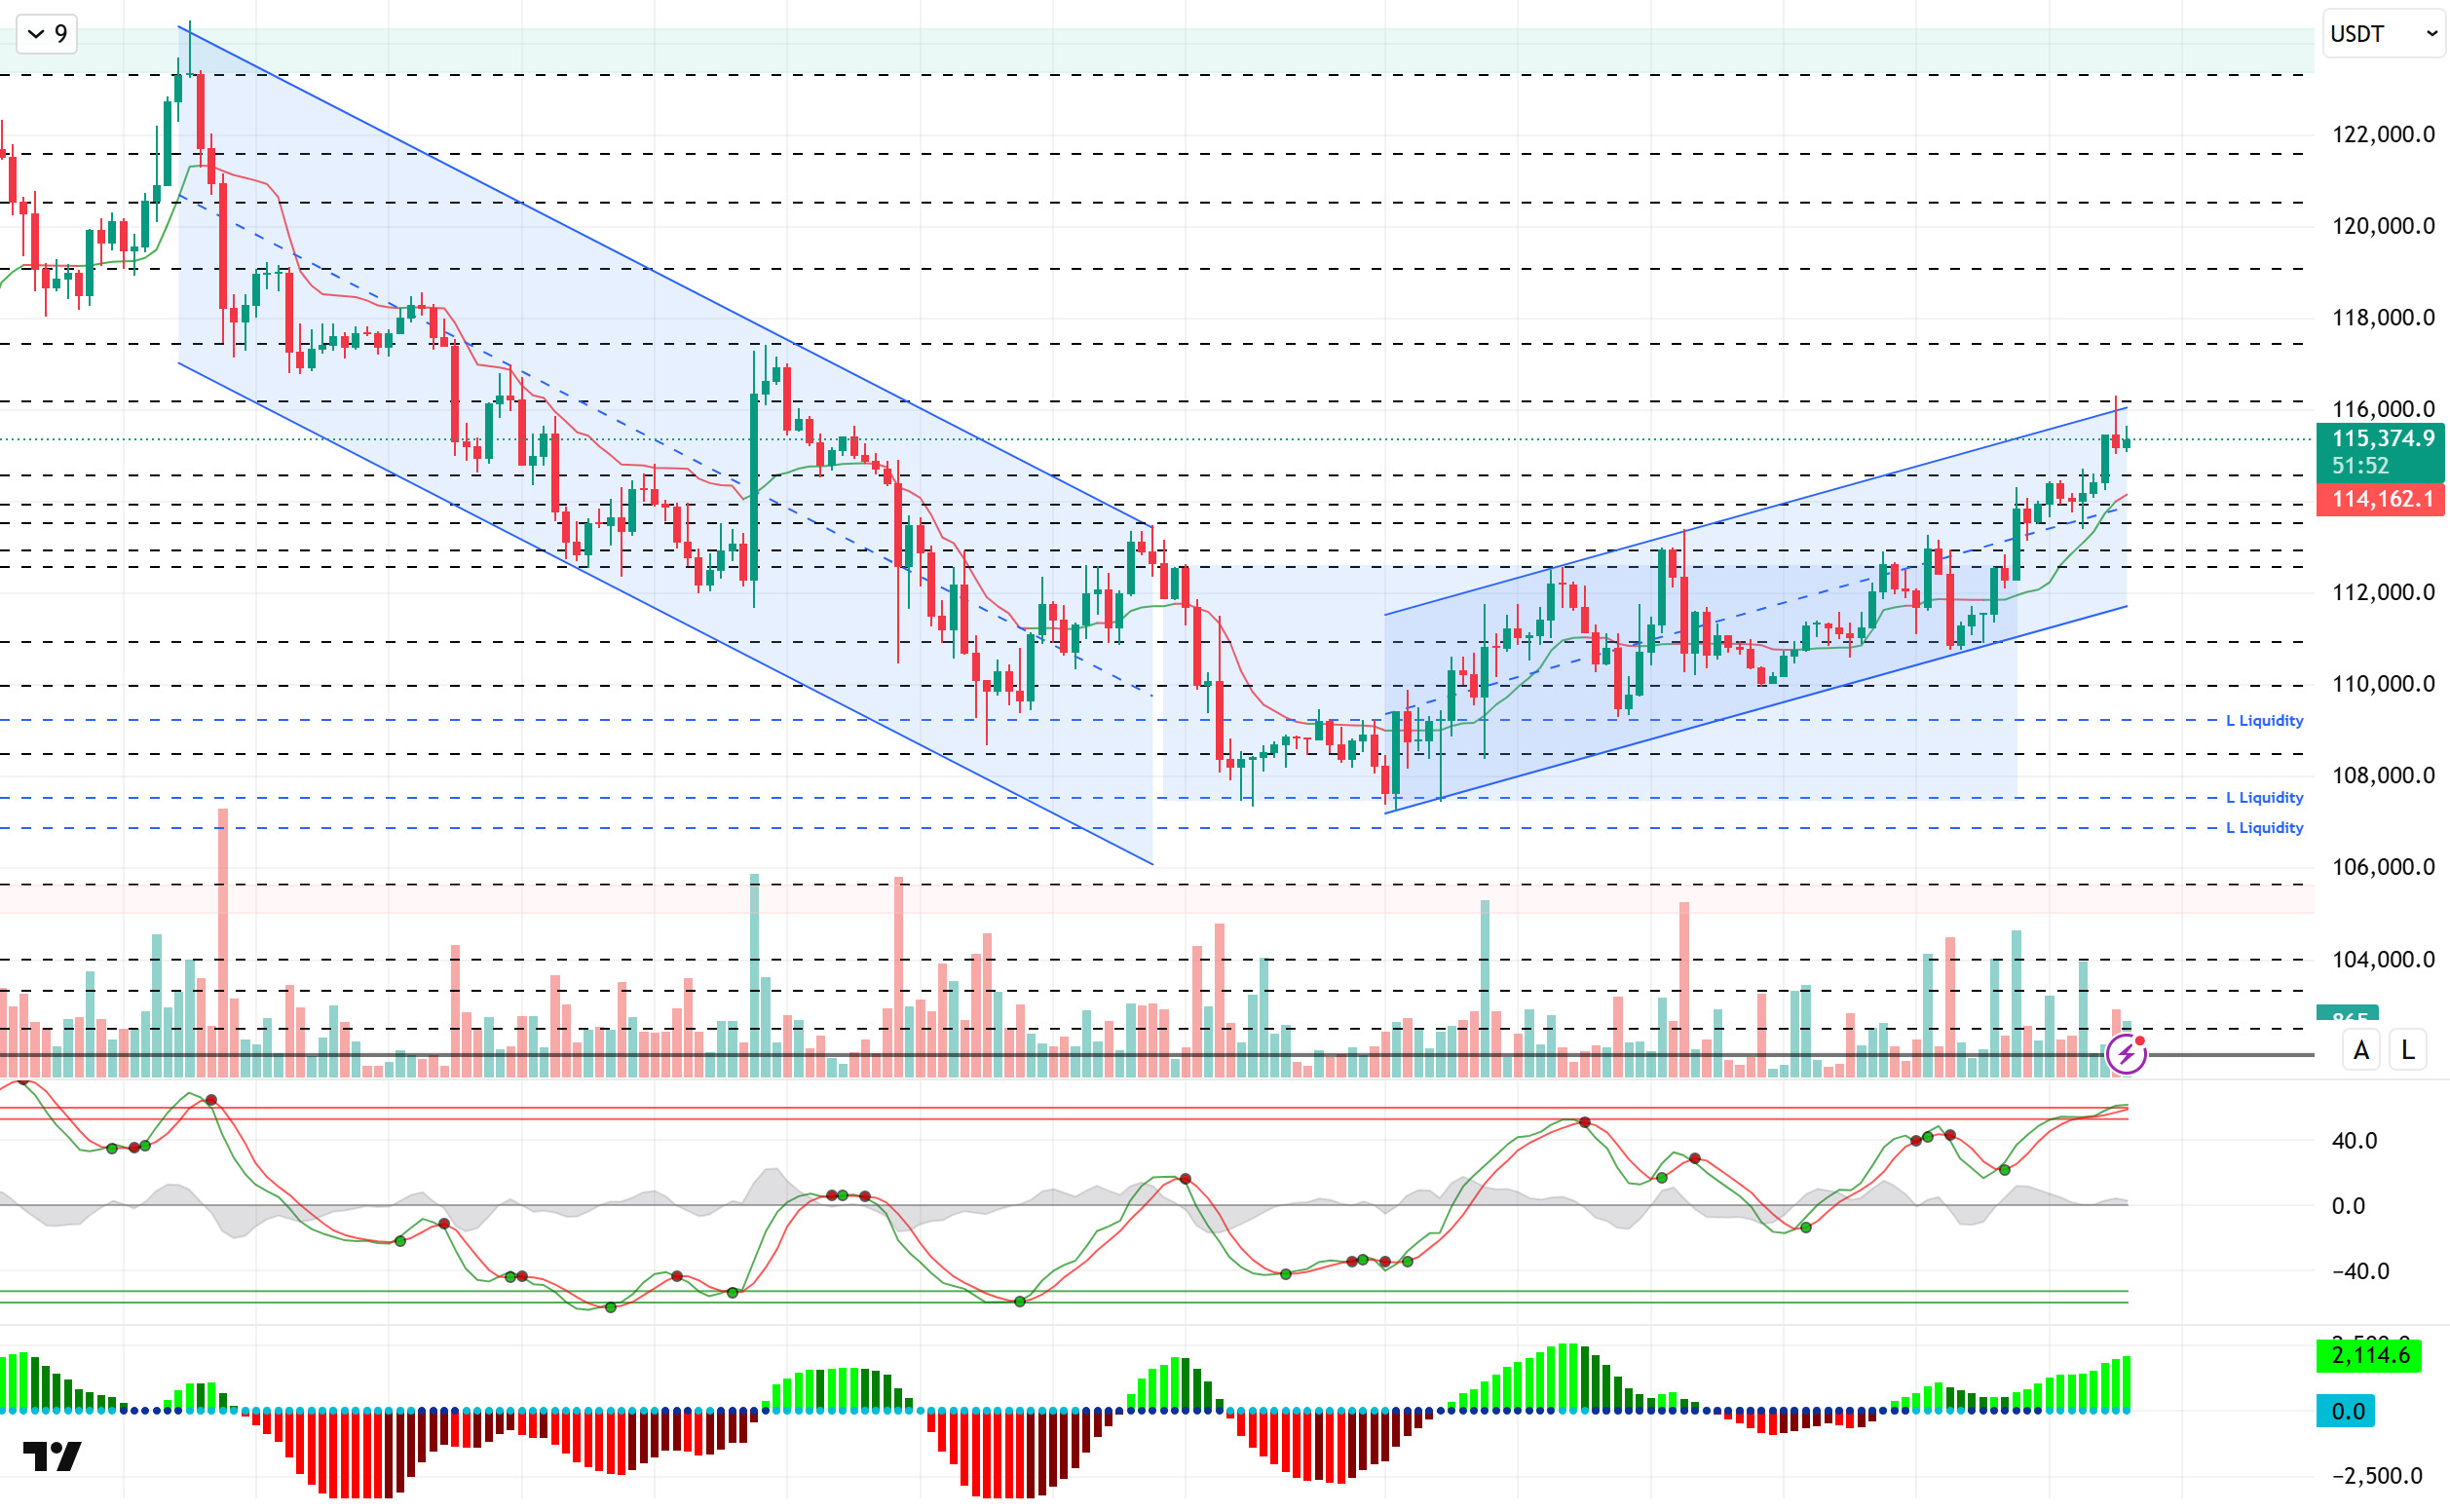
ETH/USDT
The Ethereum PoS exit queue reached 2.65 million ETH, increasing the waiting time to 46 days. Spot ETFs recorded net inflows of $113 million. Radiant Capital reported that its hacker transferred 5,933 ETH to Tornado Cash. Ethereum developers announced that the Fusaka upgrade could come to the mainnet in November. It showed that FalconX transferred a total of $200 million worth of ETH to the new wallets.
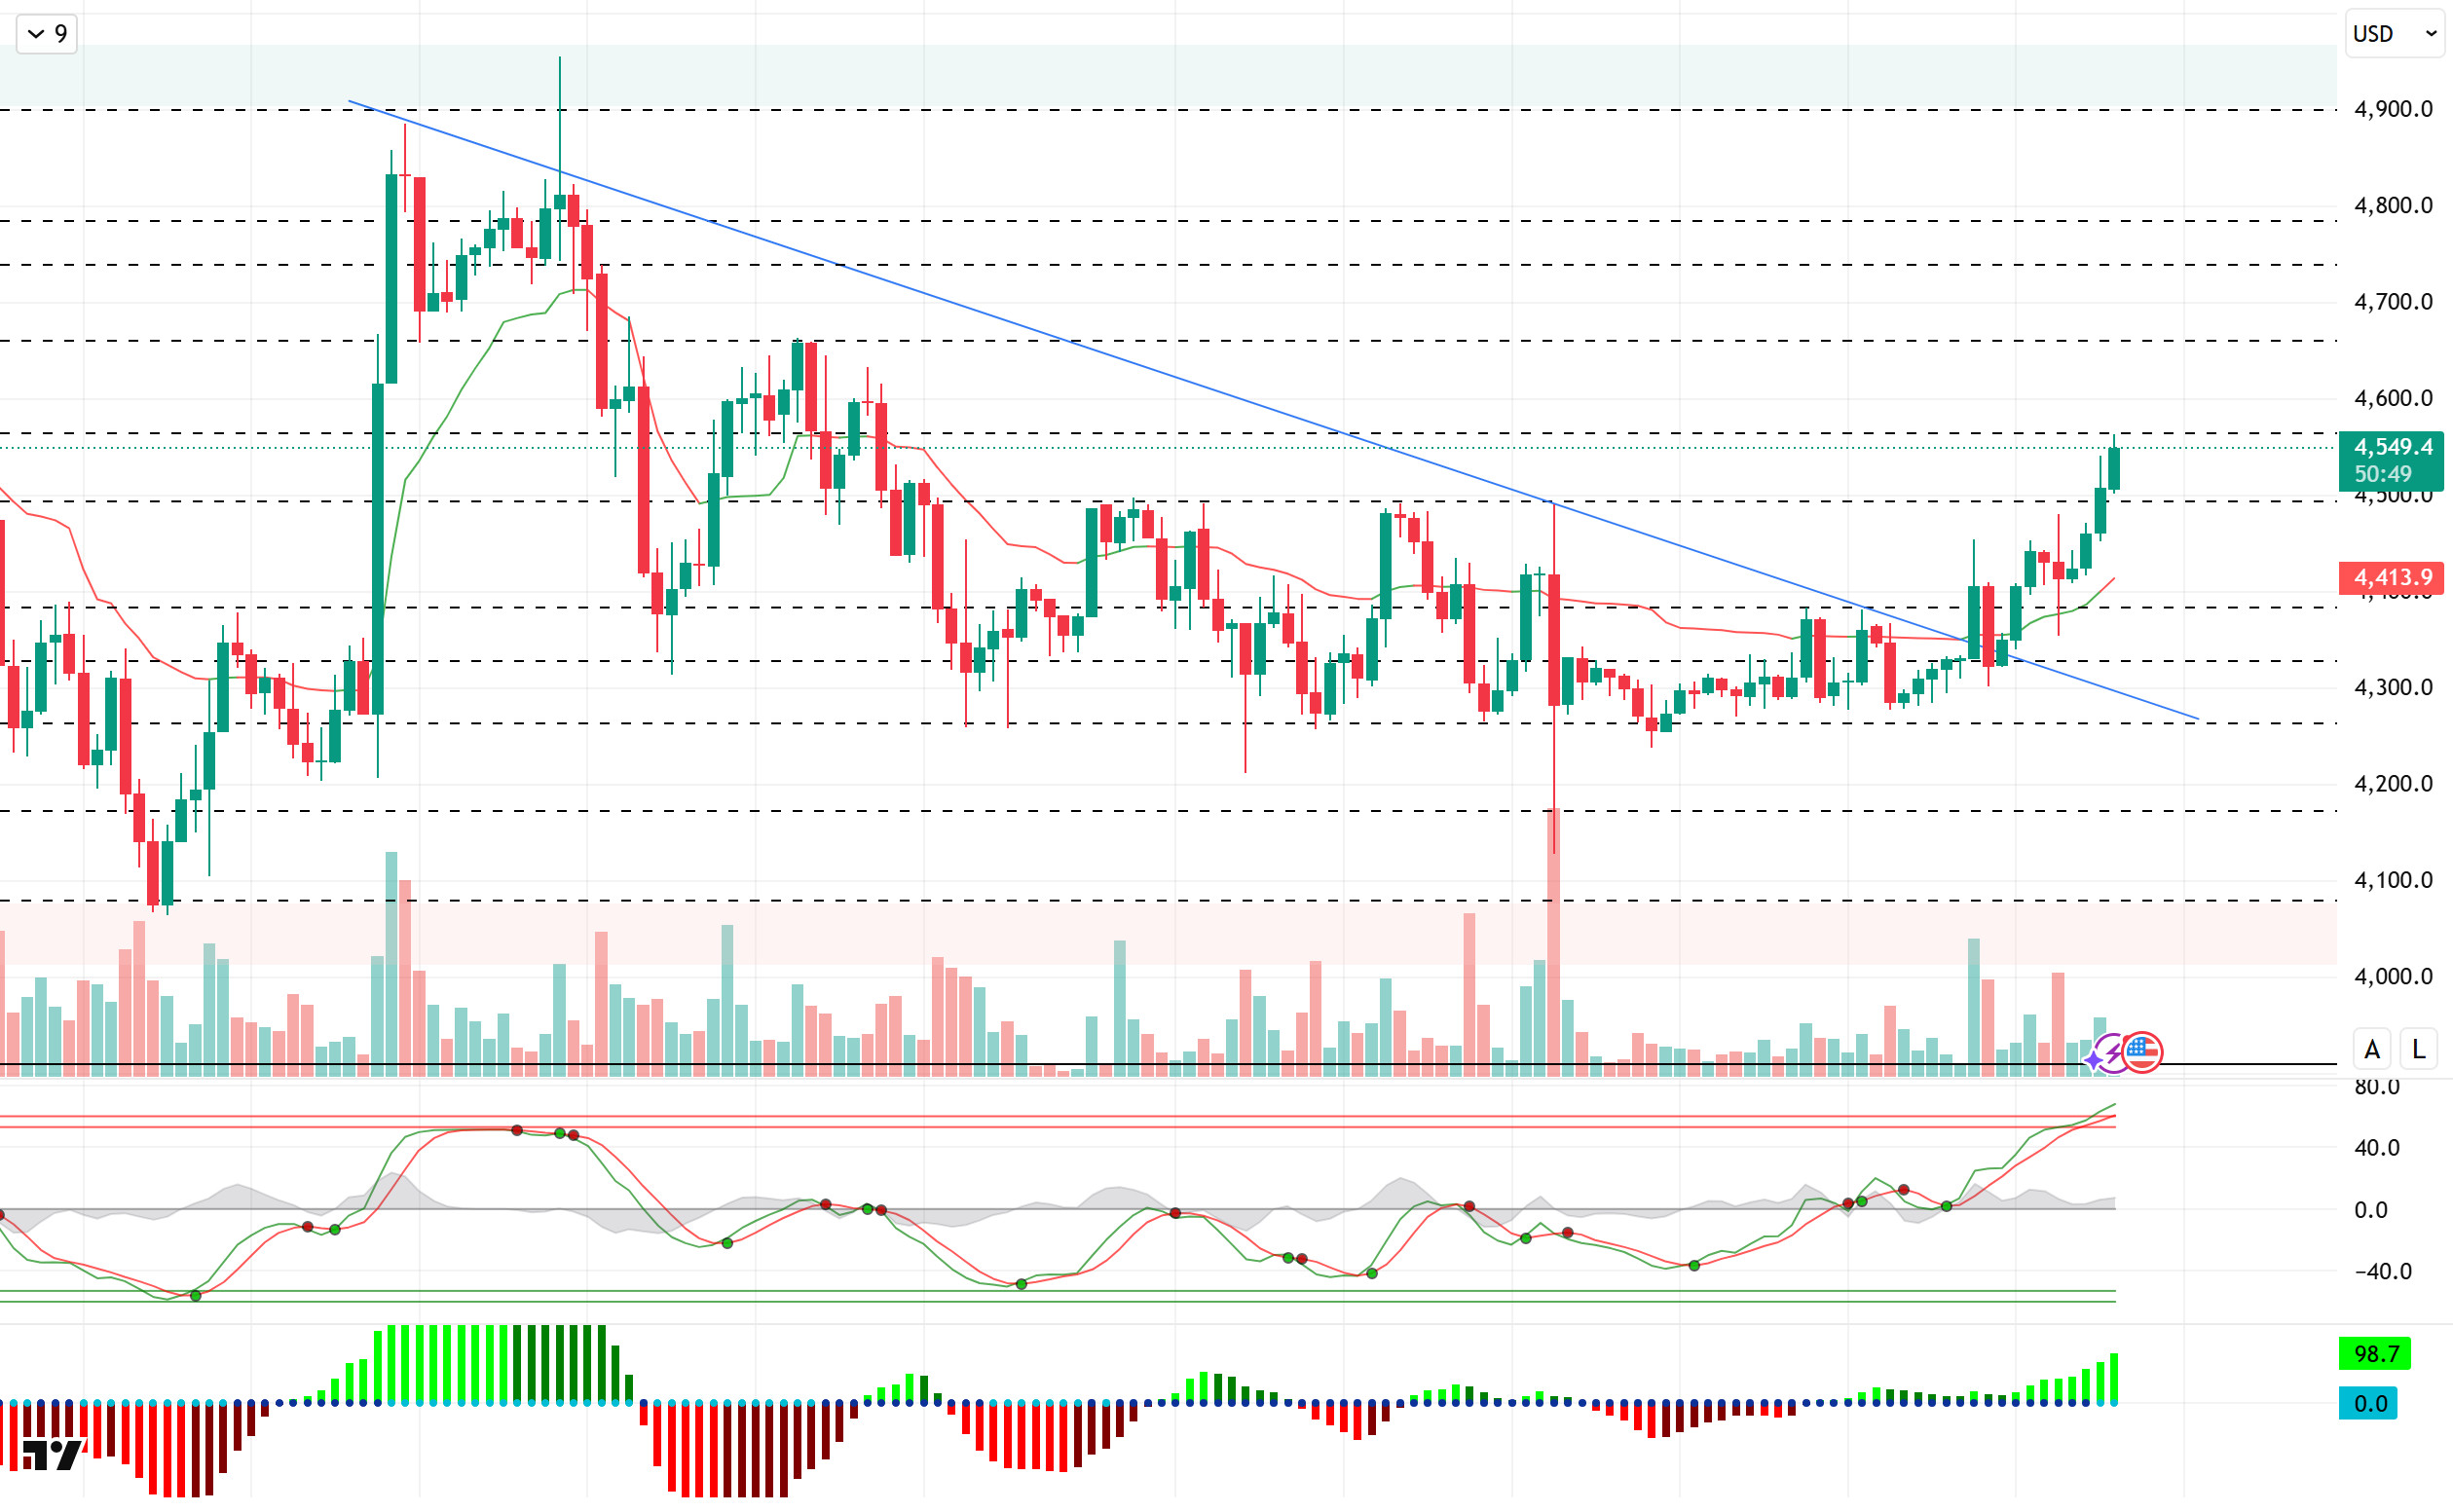
Looking at the technical outlook, ETH exceeded the falling trend structure in the previous analysis and settled above the 4,400 level. ETH, which experienced a retreat after the macro data released, fell to 4,350 levels. Then the price, which recovered again, passed the 4,490 level and tested the 4,560 level. At the time of writing, it continues to trade at 4,538.
Technical indicators, the Wave Trend oscillator (WT), after the weakening sell signal in the middle band of the channel, gave way to a buy signal and headed towards the overbought zone again. In the Squeeze Momentum (SM) indicator, the histogram is trying to regain momentum in the positive area. The Kaufman moving average is currently moving below the price at 4,412.
Looking at the liquidity data, short and long term sell trades continue to be sparse, while buy trades have accumulated heavily at the 4,260 level with the recent rise.
In summary, ETH continues to move in line with the general trends in the market. Looking at the fundamental dynamics specific to ETH, the return to positive ETF inflows keeps institutional interest alive. On the technical side, the price’s recovery effort is noteworthy, while the limited sell-side transactions in liquidity data and the increase in buy-side transactions support the rise. It is important for the price to hold above critical support levels for the sustainability of the rise in the coming period. In this context, while the 4,490 level stands out as the main support point, the 4,650 level will be followed as a target point in the continuation of the upward movement.
Supports 4,490 – 4,385 – 4,330
Resistances 4,560 – 4,650 – 4,735
XRP/USDT
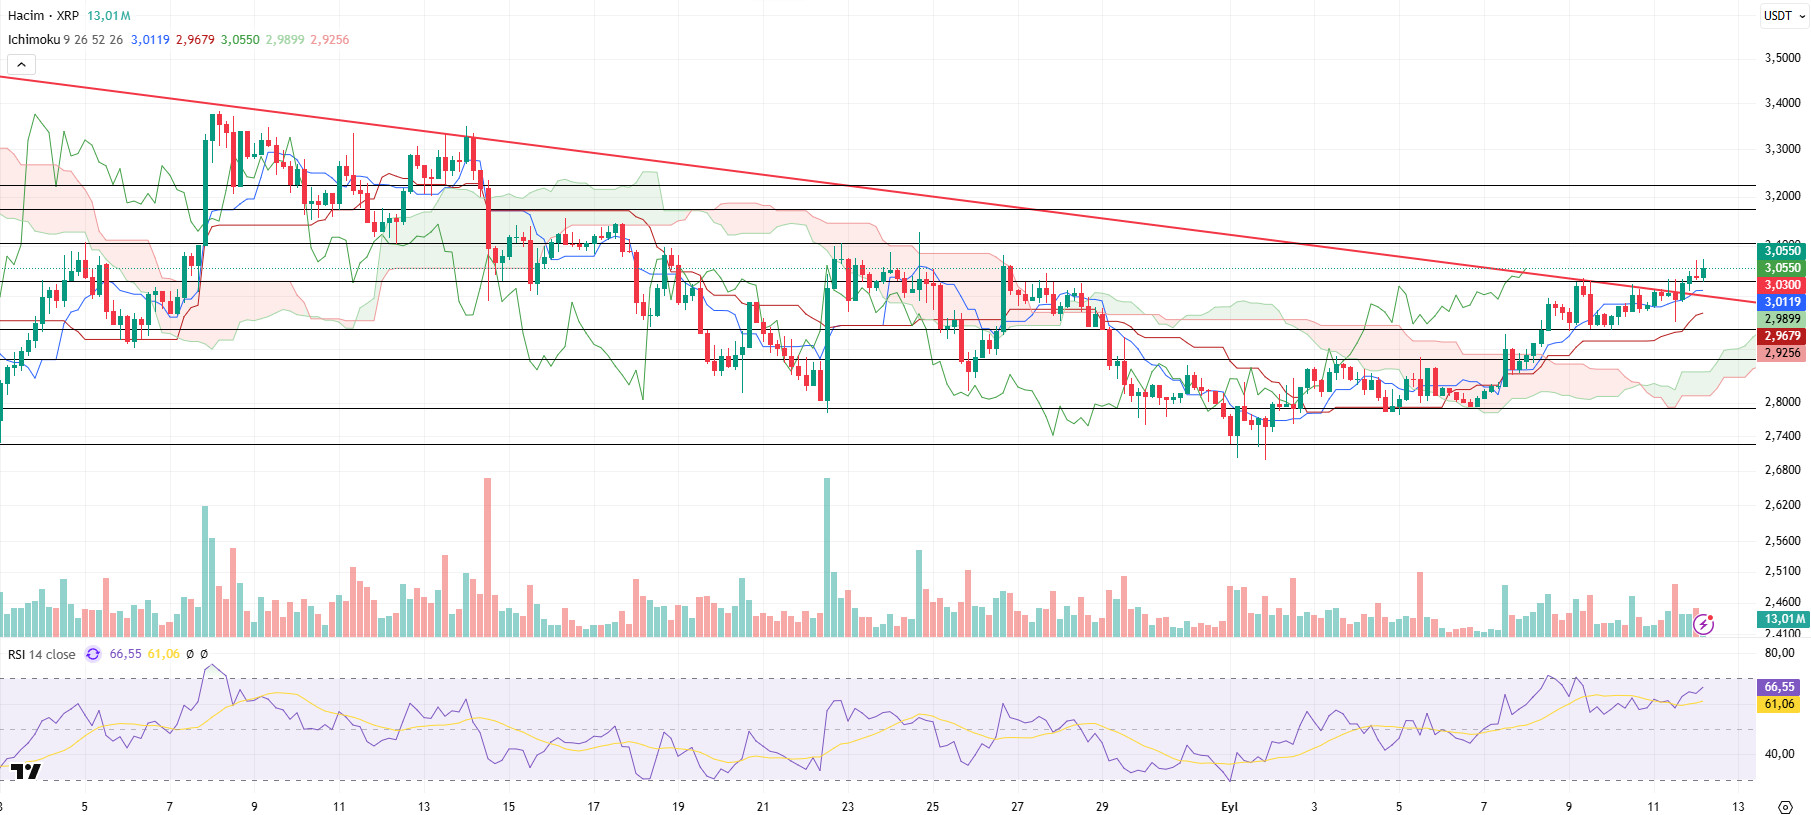
From a technical perspective, XRP fell as low as $2.7270 with the recent pullbacks and regained bullish momentum with the support it received from this level. XRP/USDT has managed to break the downtrend by strengthening its uptrend, which is currently above the Ichimoku indicators, with the support it received from the $2.9383 level. Maintaining this momentum and persistence above the downtrend indicates that the price may accelerate and continue its upward trend.
Yesterday, in line with our expectations, the positive momentum in the XRP price continued and our first target level of $ 3.0300 was exceeded. In addition, although the annual inflation data released from the US, which was in line with expectations, created some selling pressure in the markets, XRP fell to the lower band of the downtrend; however, it managed to recover from this level.
When technical indicators are analyzed for XRP, which is currently trading at the upper band of the downtrend and around $ 3.0550, the Relative Strength Index (RSI) has risen above the average with the recent rise and turned its direction upwards.
Within the framework of the current outlook, if the buying appetite continues, the resistance level of 3.1050 dollars is expected to be tested in the first place. If this level is exceeded, the price is likely to head towards 3.1750 dollars and 3.2250 dollars, respectively. On the other hand, if the selling pressure strengthens, the price is likely to fall back to the $3.0300 support level. In case this level is broken downwards, the levels of $ 2.9383 and $ 2.8800 stand out as critical follow-up zones.
Supports: 3,0300 – 2,9383 – 2,8800
Resistances: 3,1050 – 3,1750 – 3,2250
SOL/USDT
Galaxy Digital acquired $326 million SOL for Multicoin. FTX and Alameda repaid $44.9 million in Solana.
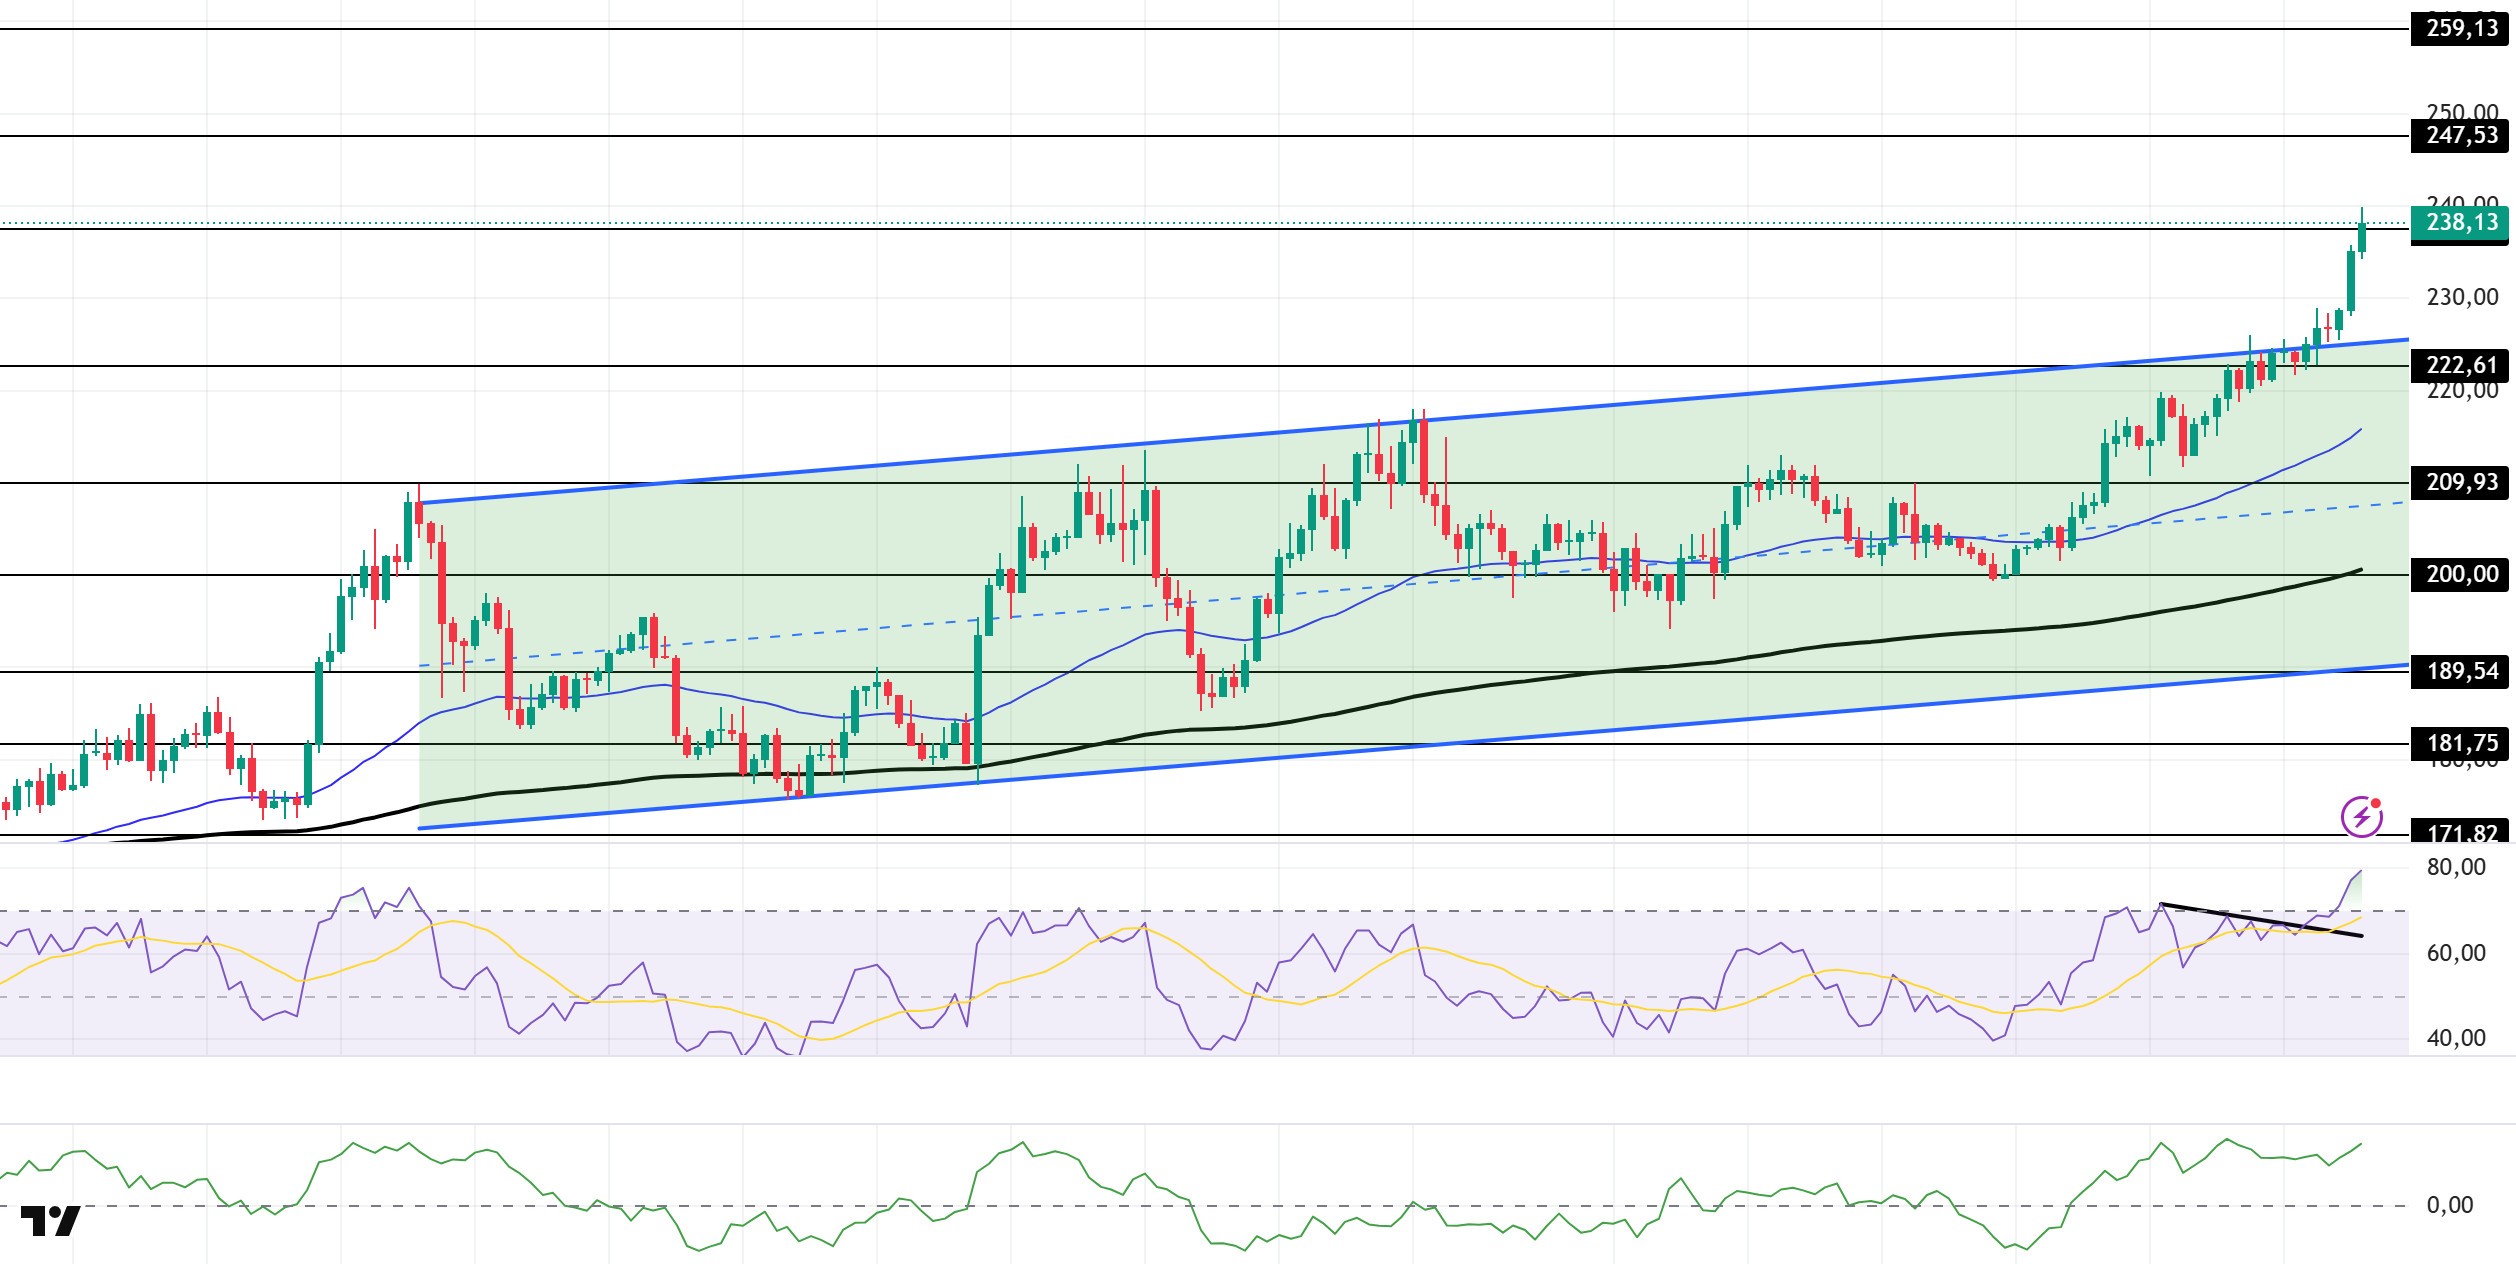
SOL price continued its uptrend. The asset broke the uptrend that started on August 14 to the upside and continues to rise. The price, which is currently testing the $ 237.53 level as resistance, may continue its rise in candle closures above this level. In retracements, the ceiling level of the rising trend can be followed.
On the 4-hour chart, it continued to be above the 50 EMA (Exponential Moving Average – Blue Line) and the 200 EMA (Black Line). This suggests that the uptrend may continue in the medium term. At the same time, the fact that the price is above both moving averages suggests that the market is bullish in the short term. Chaikin Money Flow (CMF-20) continued to be in positive territory. However, an increase in inflows may keep CMF above the positive zone. Relative Strength Index (RSI-14) continued to be in positive territory. However, the indicator is in overbought territory, which could lead to profit selling and a pullback. The $247.53 level stands out as a strong resistance point in the event of a rally on the back of macroeconomic data or positive news on the Solana ecosystem. If this level is broken upwards, the rise can be expected to continue. If there are pullbacks due to contrary developments or profit realizations, the $ 222.61 level can be tested. In case of a decline to these support levels, the increase in buying momentum may offer a potential bullish opportunity.
Supports 222.61 – 209.93 – 200.00
Resistances 237.53 – 247.53 – 259.13
DOGE/USDT
CleanCore Solutions continued its Dogecoin purchases, crossing the 500 million DOGE threshold. The company’s 1 billion DOGE target continues.
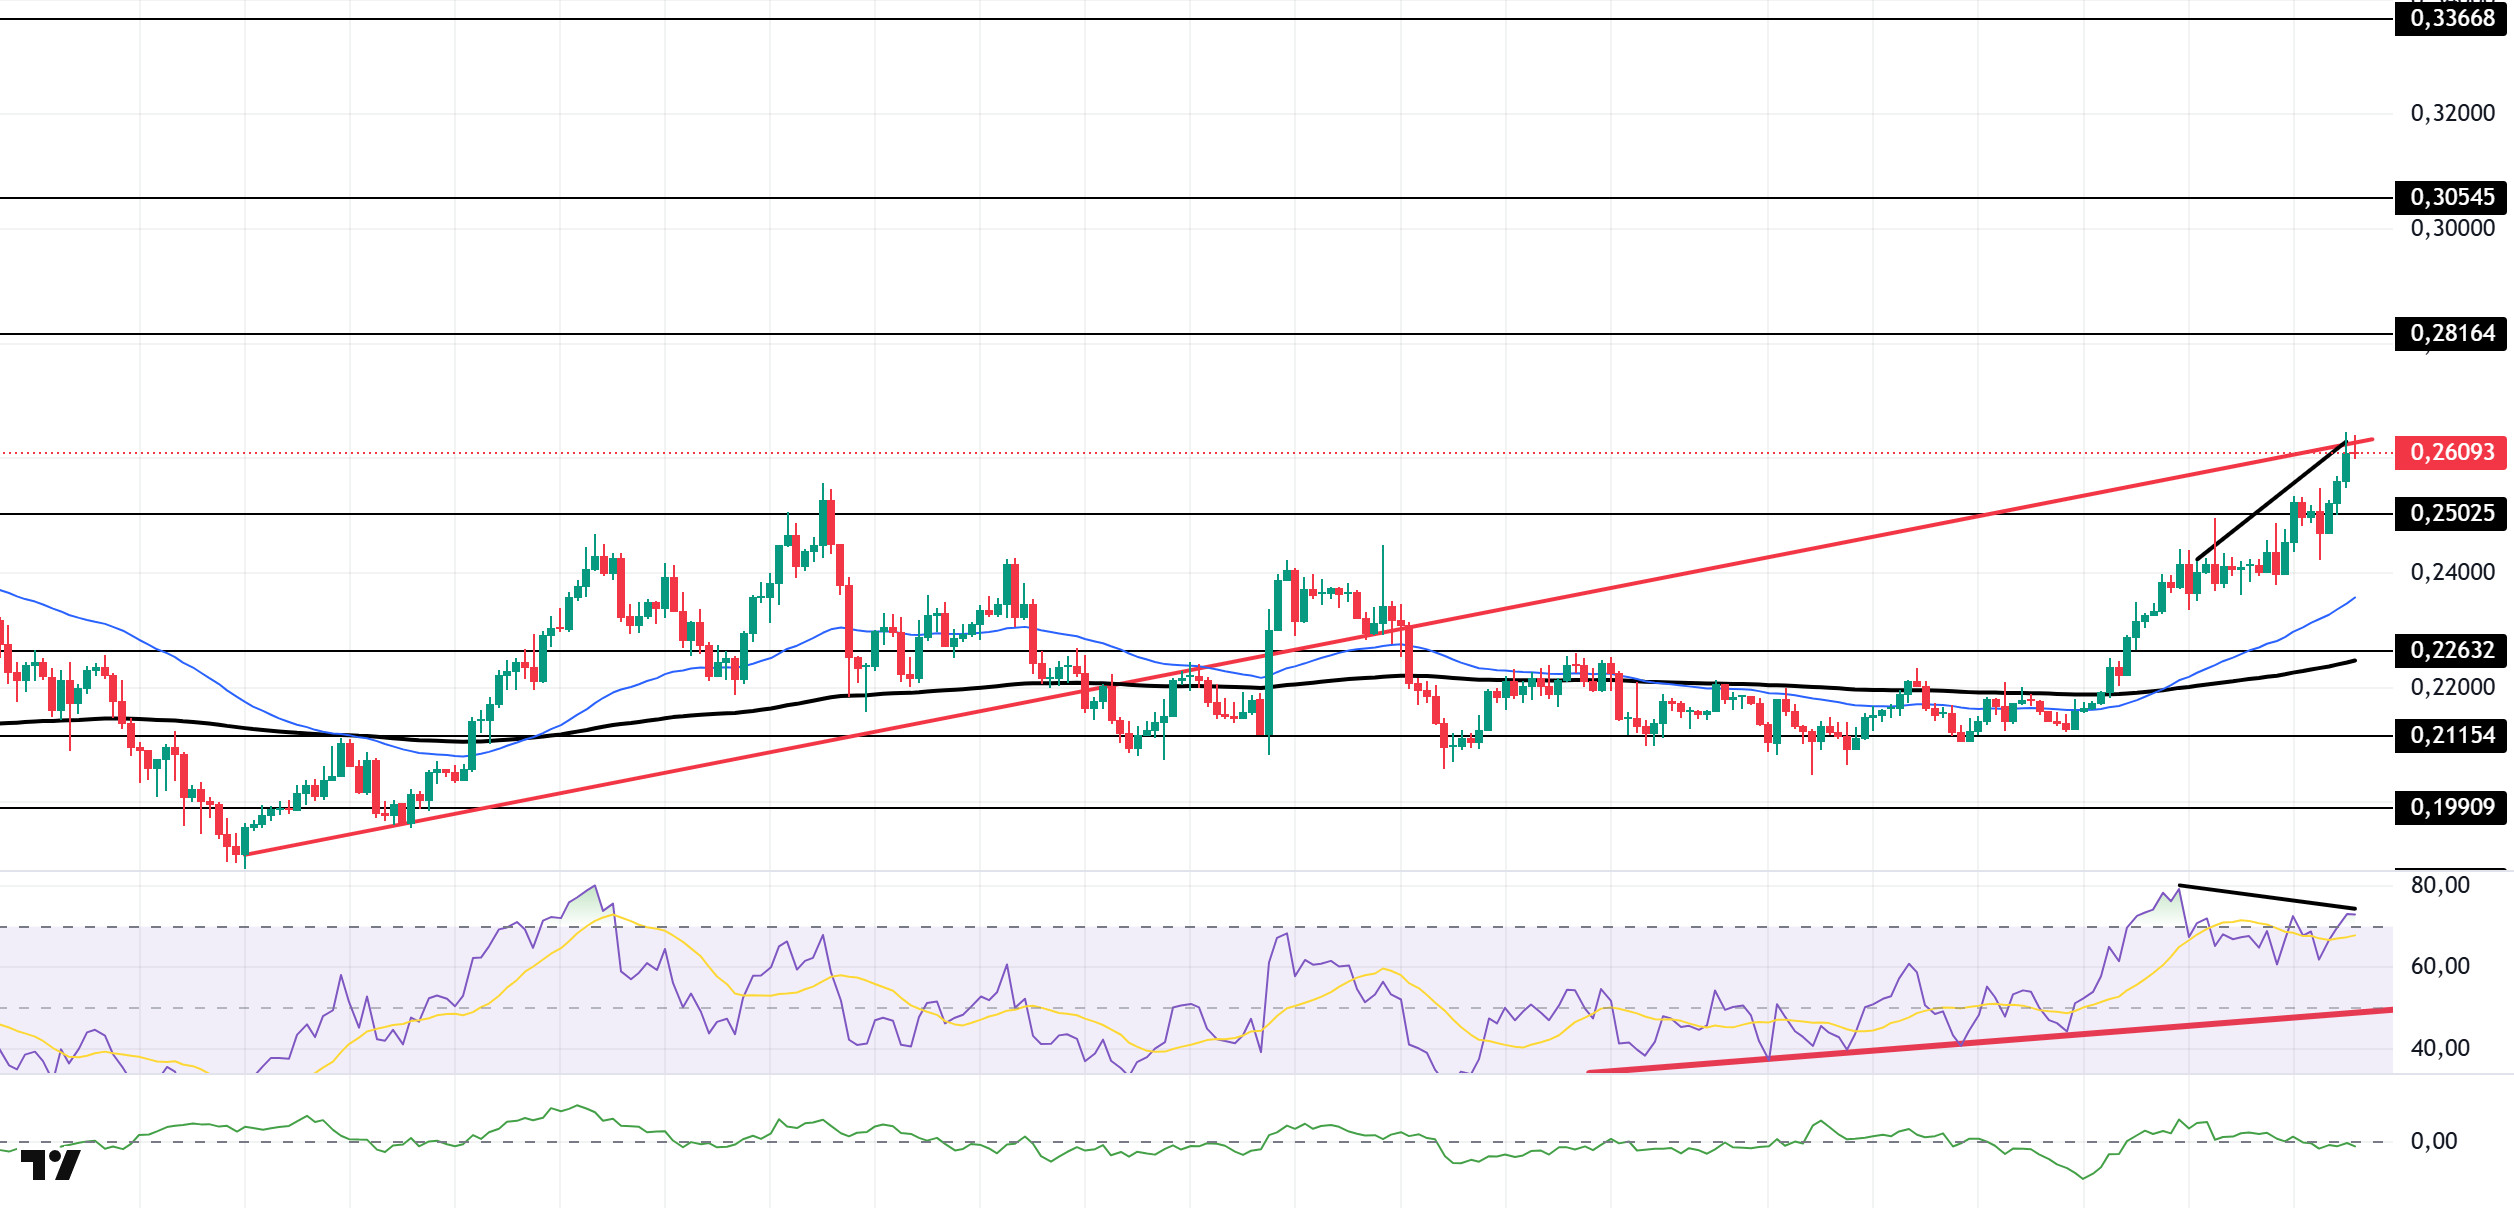
DOGE price continued its uptrend. The asset is testing the rising line that started on August 3 as resistance. Above the 50 EMA (Exponential Moving Average – Blue Line) and 200 EMA (Black Line) moving averages, the price has maintained its momentum and continues to appreciate above the moving averages. The price, which currently breaks the $0.25025 level, may continue to rise if it breaks the rising line upwards. In case of a possible pullback, the $0.25025 level may be triggered.
On the 4-hour chart, the 50 EMA (Blue Line) remained above the 200 EMA (Black Line). This indicates that the uptrend continues in the medium term. The fact that the price is above both moving averages suggests a strong bullish bias in the short term. Chaikin Money Flow (CMF-20), on the other hand, remained neutral. In addition; an increase in money inflows may move CMF into positive territory. Relative Strength Index (RSI-14) continues to be in overbought territory. At the same time, it remains in the upper zone of the uptrend that started on August 26. This signaled that momentum may continue. However, the negative divergence may cause pullbacks. The $0.28164 level stands out as a strong resistance zone in the uptrend in line with political developments, macroeconomic data or positive news flow in the DOGE ecosystem. In the opposite case or possible negative news flow, the $0.22632 level may be triggered. In case of a decline to these levels, the momentum may increase and a new bullish wave may start.
Supports 0.25025 – 0.22632 – 0.21154
Resistances 0.28164 – 0.30545 – 0.33668
BNB/USDT
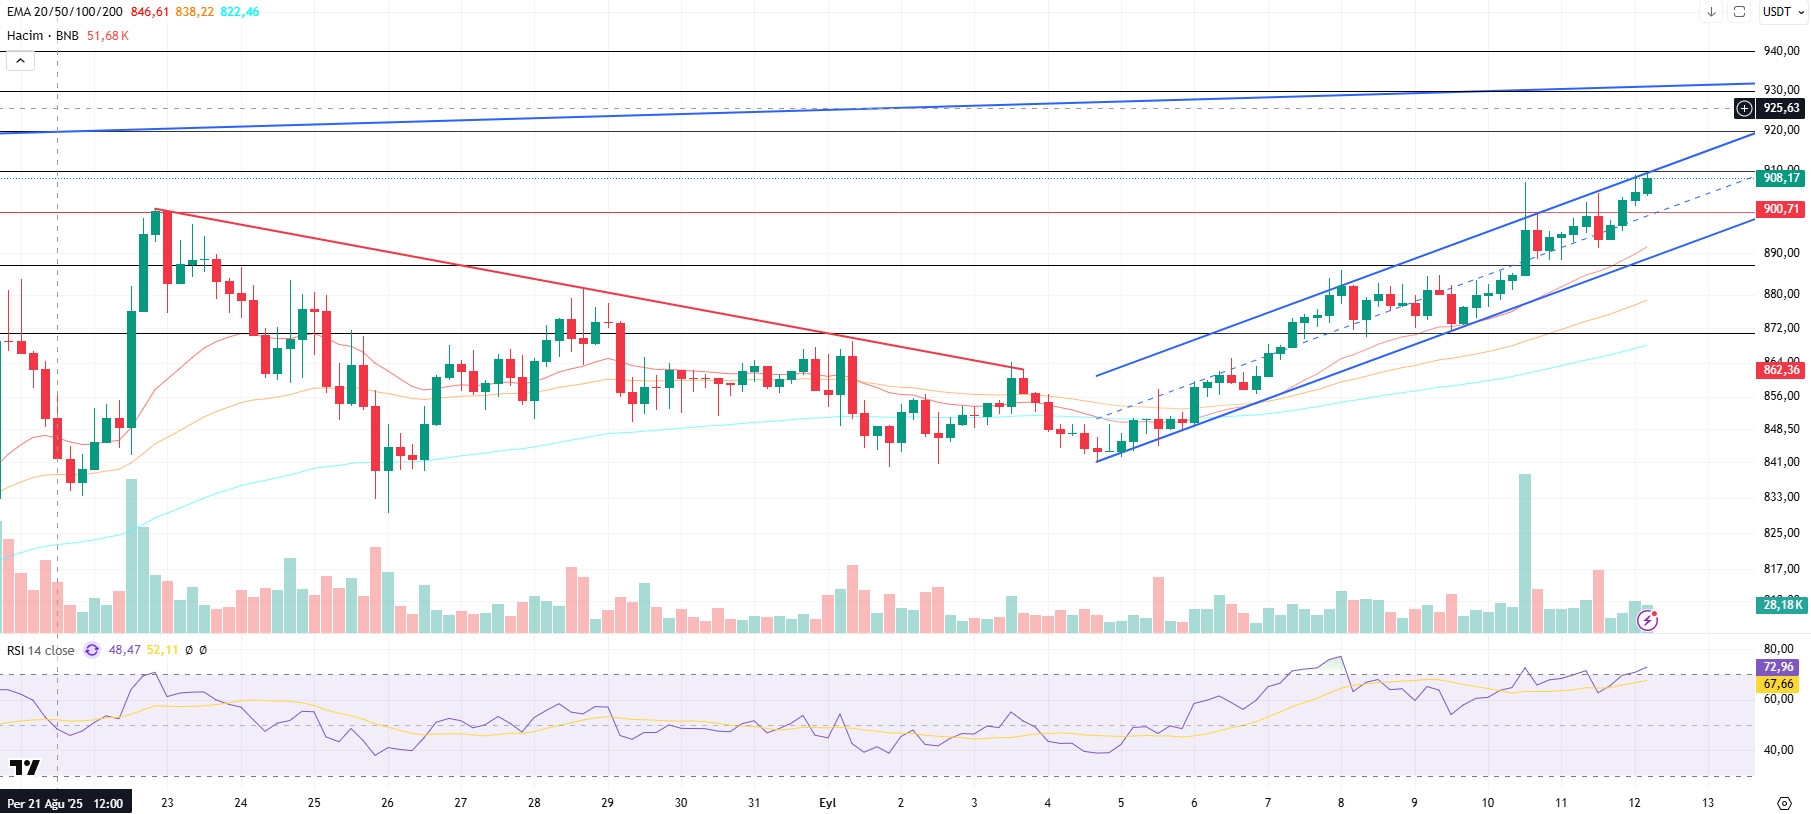
From a technical perspective, BNB/USDT, which is currently moving within the ascending channel, faced some selling pressure in the markets yesterday as the annual inflation data released from the US came in line with expectations. With this selling wave, BNB fell to the middle band of the ascending channel; however, it recovered from this level and maintained its positive momentum and managed to rise to the upper band of the ascending channel as well as our first target price level of $ 910.
Technical indicators for BNB/USDT, which is currently trading in the $900-910 range, reveal that the recent increase in trading volume has strengthened the buying appetite. This picture indicates that the positive outlook stands out in the market.
In addition, the Relative Strength Index (RSI) has risen above the 70 level with the recent rises; although short-term correction movements are observed, it is still holding at these levels. This technical structure indicates that the positive momentum in BNB is strengthening.
Within the framework of the current outlook, if the buying appetite is maintained, BNB is expected to test the $ 910 resistance level in the first place. If this level is exceeded, the price is likely to head towards $ 920 and $ 930 levels, respectively. On the other hand, if selling pressure increases, the price is likely to retreat back to $ 900 support. If this level is broken downwards, the $ 885 and $ 870 levels stand out as critical follow-up zones.
Supports 900 – 885 – 870
Resistances 910 – 920 – 930
ADA/USDT
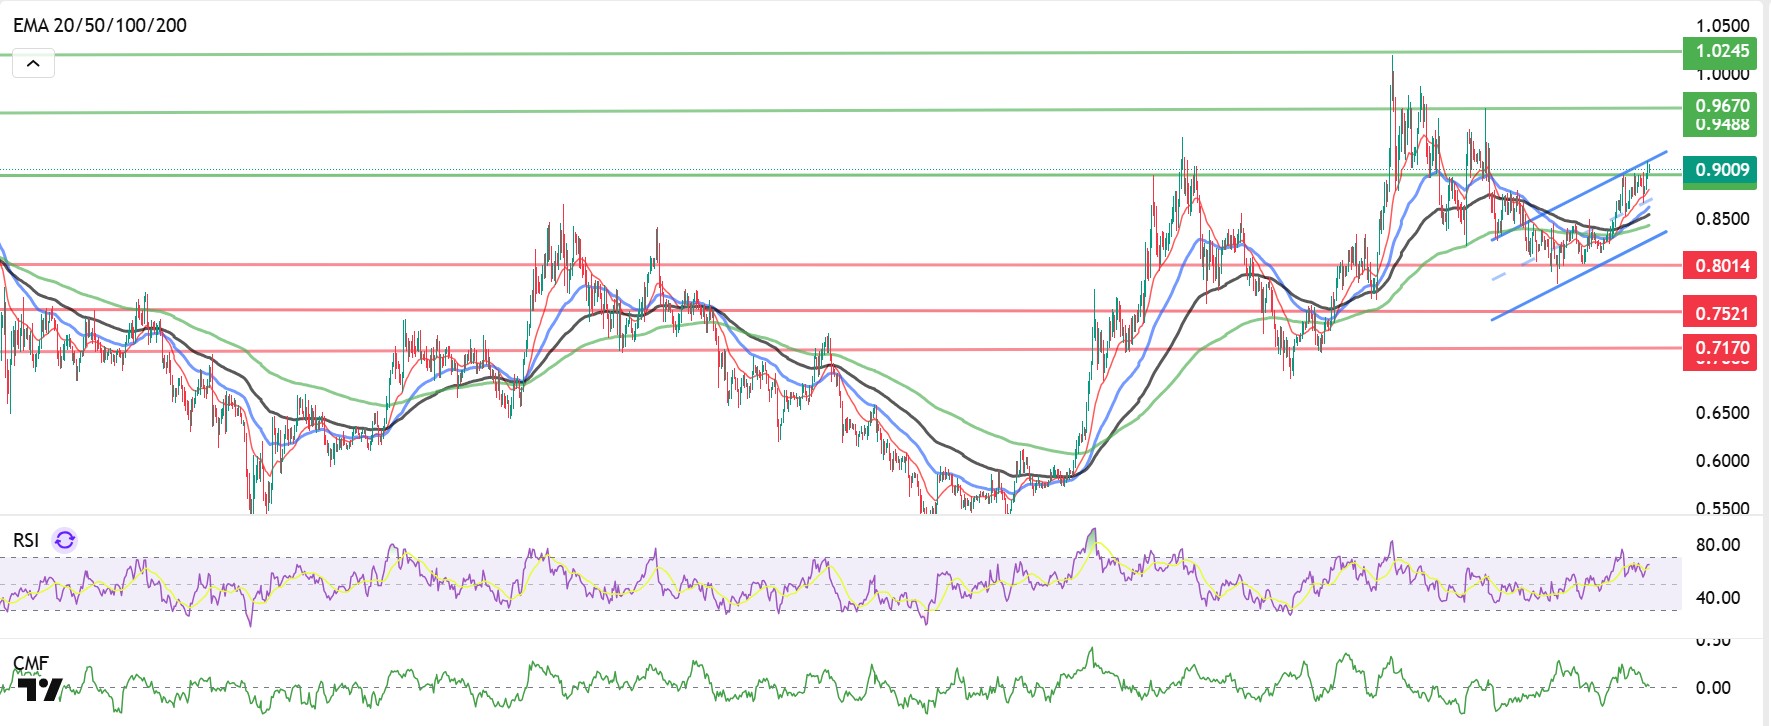
Cardano (ADA) has risen 1.16% since yesterday’s US CPI data, testing the first resistance level of 0.9019, liquidating long positions.
From a technical point of view, the ADA price is still moving within the ascending channel band. In this context, it is expected that the long leveraged positions of approximately 808 thousand dollars at the level of $ 0.9176 will be liquidated. This movement may cause the price to head towards the first resistance level of 0.9176 dollars with reaction purchases during the day. If this level is exceeded, it is likely to reach $0.9280, the peak of the rising channel within the major trend. The fact that the price is currently above all moving averages indicates that the uptrend is strengthening. In particular, staying above the 20-day exponential moving average (EMA-20, Red Line) and 50-day exponential moving average (EMA-50, Blue Line) levels is critical for the sustainability of the uptrend. Momentum indicators also generate positive signals. Relative Strength Index (RSI) rose to 65, approaching the overbought zone. On the other hand, Chaikin Money Flow (CMF-20) indicator rose to 0.03, indicating that the buying potential in the market remains strong. The increase in money inflows supports the CMF to remain in positive territory and creates a bullish correlation with the RSI. This alignment increases the likelihood of a sustained buying bias.
In terms of fundamental factors, possible statements by US President Donald Trump or institutional/strategic purchases in the Cardano ecosystem are among the factors that may support the price to head towards the strong resistance point at $ 0.9280. However, in case of a possible selling pressure in the markets, the 0.7851 dollar level should be followed as a critical support point.
Supports 0.7851 – 0.7566 – 0.7170
Resistances 0.9982 – 0.9636 – 0.9280
Legal Notice
The investment information, comments, and recommendations contained herein do not constitute investment advice. Investment advisory services are provided individually by authorized institutions taking into account the risk and return preferences of individuals. The comments and recommendations contained herein are of a general nature. These recommendations may not be suitable for your financial situation and risk and return preferences. Therefore, making an investment decision based solely on the information contained herein may not produce results in line with your expectations.


