
Technical Analysis
BTC/USDT
Markets have fully priced in the Fed’s 25 basis point rate cut; while the dollar index is trading at its lowest levels in 41 months, the S&P 500 and Nasdaq have hit record highs. The US and UK have decided to cooperate on crypto regulations. Trump’s visit to the UK highlights expectations of crypto-friendly regulations, with industry representatives scheduled to hold a roundtable meeting with the Senate Banking Committee tomorrow. Meanwhile, Trump has extended the TikTok ban for the fourth time. The House of Representatives plans to add a CBDC ban to the market structure bill.
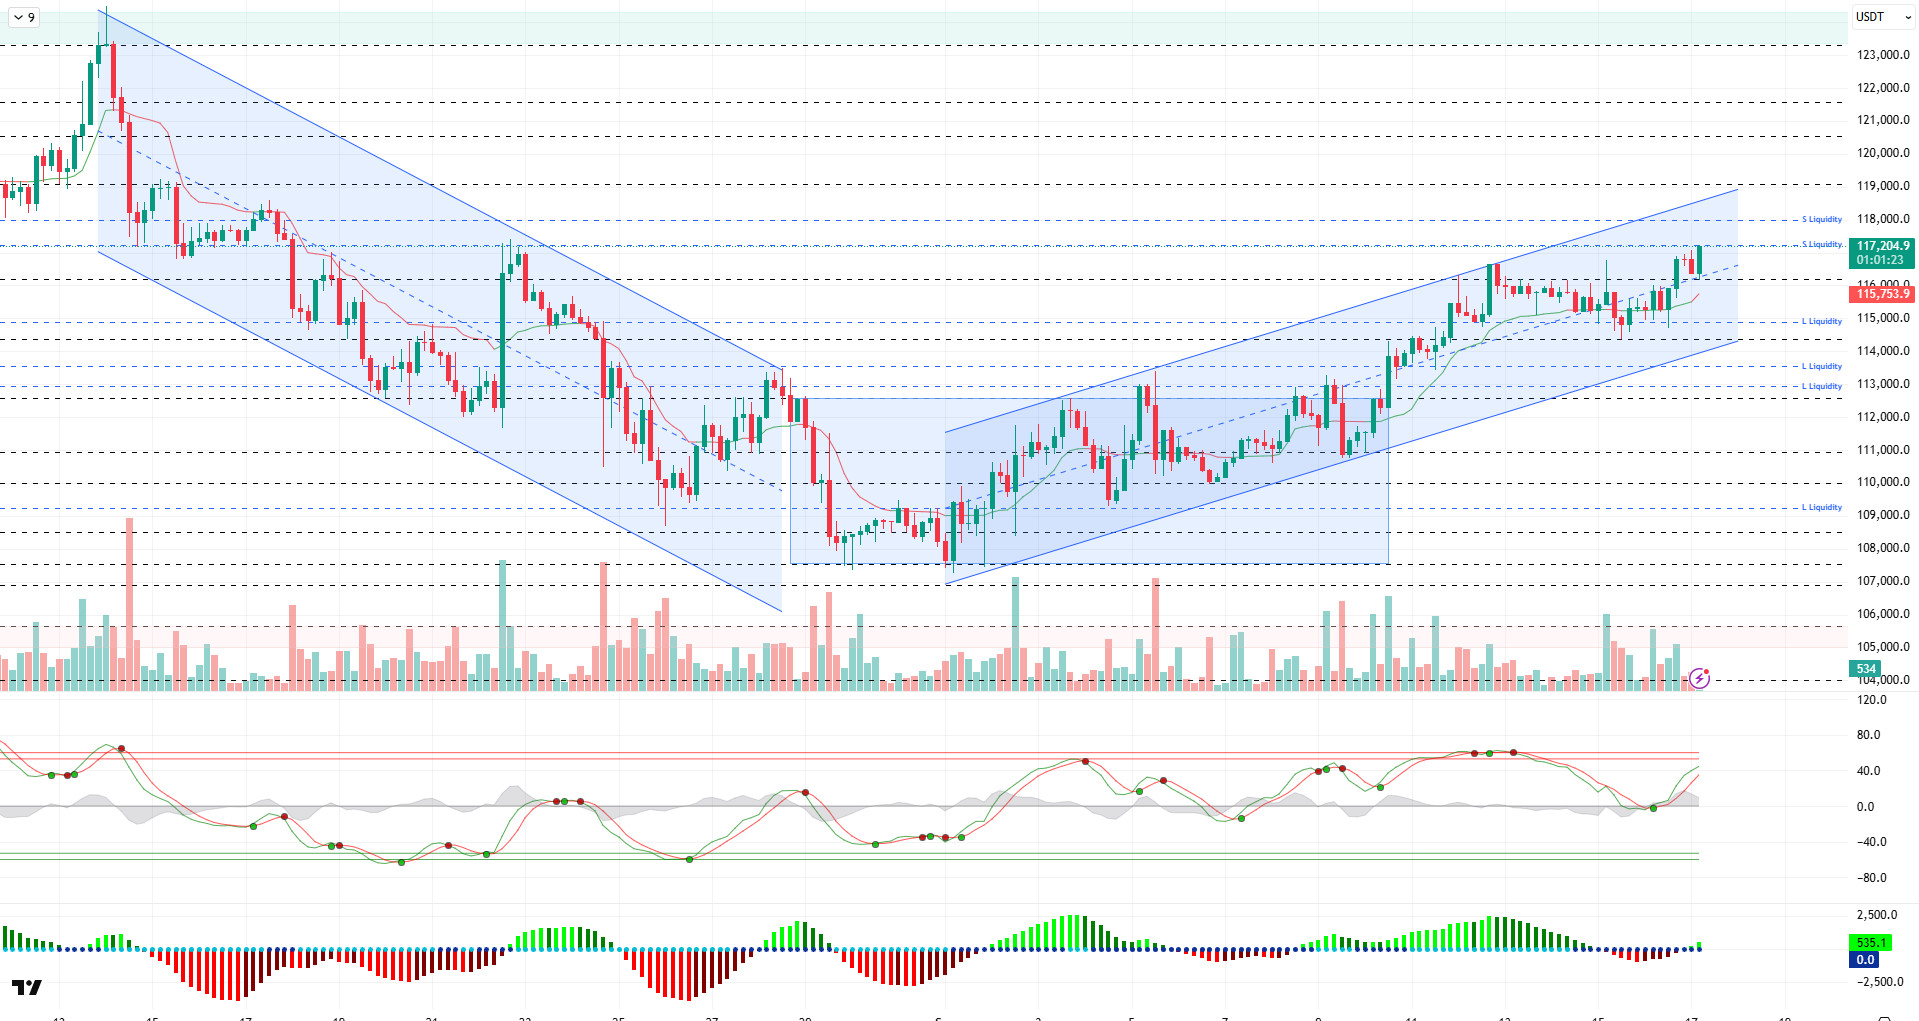
Looking at the technical picture, BTC, which painted a bearish picture in the previous analysis, continues to show indecisive price movements within an uptrend. At the time of writing, the price continues to trade at $117,200, having surpassed the $117,000 level.
Technical indicators show that the Wave Trend (WT) oscillator, despite occasionally weakening in the channel’s middle band, maintained its buy signal and moved towards the overbought zone. The Squeeze Momentum (SM) indicator’s histogram moved into positive territory. The Kaufman moving average is currently trading below the price at 115,741.
According to liquidity data, part of the volume created by short-term heavy selling in the 117,000 – 117,800 band has been liquidated. However, the remaining part of the selling pressure is maintained at the 117,800 level. Meanwhile, short-term buying levels are intensifying at 115,000 – 115,500, while the 113,600 – 112,500 band remains a strong liquidity zone in the long term.
In summary, the recent weakening of optimism amid fundamental developments has regained strength ahead of today’s meeting, as US macroeconomic data releases and expectations of an interest rate cut have become almost certain. Powell’s statements going forward will be critical, while the messages conveyed regarding the Fed’s projections will be decisive for the short-term direction. From a technical perspective, with favorable conditions, the price completed its consolidation within the horizontal band it had been in for a long time and tested the 117,250 level accompanied by a minor upward channel. While sell-side transactions in liquidity data were liquidated, buying pressure continues. In the coming period, it will be critical for the price to maintain its current upward channel for the sustainability of the rise. Closes above the 117,000 level are particularly important thresholds to monitor for the continuation of the uptrend. If momentum is gained above this level, the 120,000 region could emerge as a target. On the other hand, the 115,000 level is the first reference point in the event of potential selling pressure. If this level is lost, the 113,500 – 113,000 band will be monitored as a strong support and liquidity area.
Supports 116,100 – 115,000 – 114,000
Resistances 117,250 – 118,000 – 119,000
ETH/USDT
Today’s US Federal Reserve interest rate decision is quite critical for the markets. Volatility is expected to increase ahead of the decision, which could lead to sudden changes in the direction of the ETH price. Therefore, both support and resistance levels should be closely monitored throughout the day.
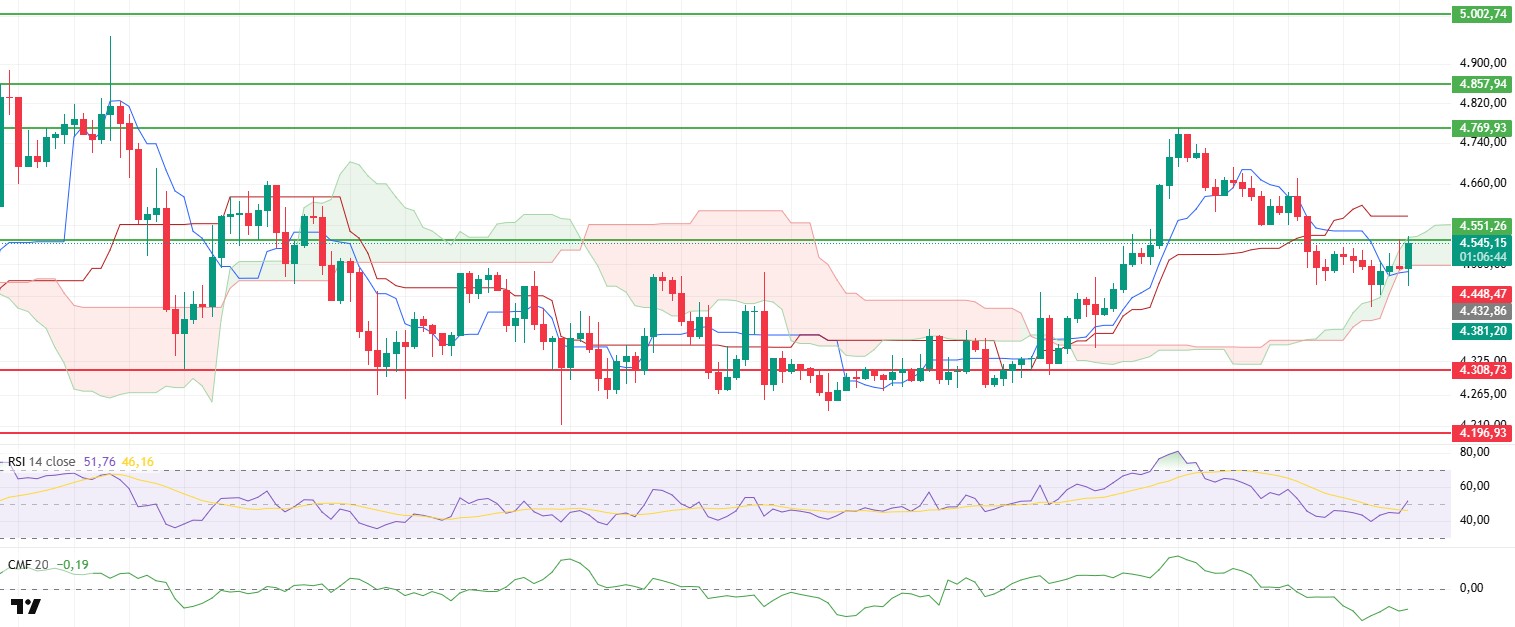
As predicted in yesterday morning’s analysis, the ETH price fell to $4,440 after losing its $4,551 support level due to increased selling pressure. This area also acted as a critical support level as it coincided with the lower band of the cloud. The price’s rebound from this level, preventing it from falling below the cloud, was an important positive signal for the main trend. Thanks to the buying pressure from this support level, ETH managed to climb back above the $4,500 level.
Looking at technical indicators, the Relative Strength Index (RSI) has risen above both the 50 level and its moving average, strengthening momentum. This outlook supports the possibility of a short-term rise. Although the Chaikin Money Flow (CMF) remains in negative territory, recent signs of recovery indicate that liquidity inflows have begun, albeit limited. This picture reveals that selling pressure is gradually weakening.
The Tenkan line remaining below the Kijun line in the Ichimoku indicator maintains the short-term sell signal. However, the price continuing to stay above the kumo cloud confirms that the main trend retains its positive outlook. From this perspective, downward movements can currently be viewed more as corrective moves.
As a result, if the ETH price exceeds the $4,551 level during the day, it could lead to a continuation of the upward movement, and in this scenario, the $4,635 level will emerge as critical resistance. Conversely, if the price remains below $4,500, testing the $4,440 level again could come into play.
Top of Form
Below the Form
Support levels: 4.308 – 4.196 – 4.084
Resistance levels: 4,551 – 5,857 – 5,000
XRP/USDT
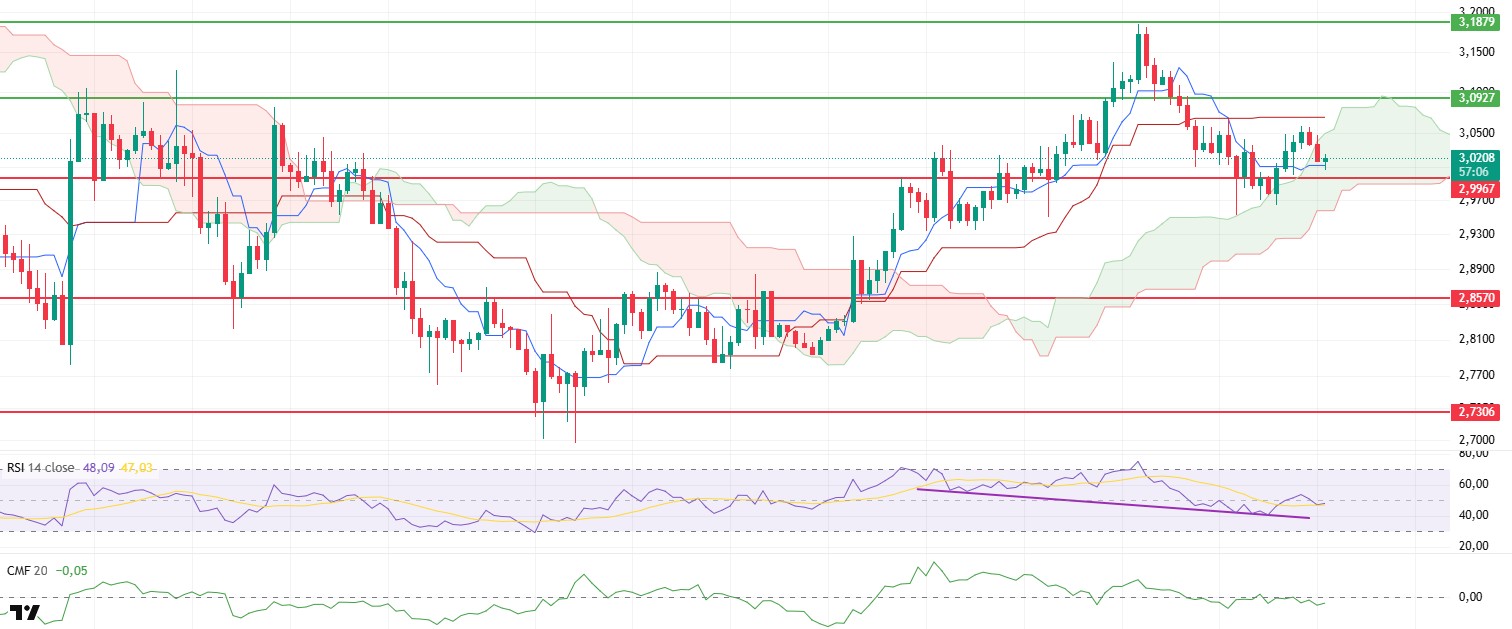
The XRP price fell to the Tenkan level following a pullback in the morning hours. However, it regained upward momentum thanks to the support it received from this area. Maintaining the $2.99 level is particularly critical for the short-term positive outlook to continue. The price holding at this level indicates that buyers are still active in the market and that selling pressure remains limited.
On the liquidity side, the Chaikin Money Flow (CMF) indicator continues its horizontal movement above the zero line. This indicates that market entries and exits remain balanced. The CMF’s balanced structure suggests that sharp movements could occur depending on the direction of the breakout. In particular, the indicator’s move into positive territory could strengthen the buying side.
The Ichimoku indicator shows that the price has re-entered the kumo cloud. At the same time, the Tenkan level has started to act as support, indicating that an area of uncertainty has formed in the market. This pattern points to critical breakouts that will determine the direction in the short term. As long as the price remains within the cloud, rapid upward and downward price movements are possible.
The $2.99 level remains the key support level in the overall outlook. Closings below this region could trigger a pullback in the price and accelerate selling pressure. Conversely, if the price manages to hold above $3.09, upward momentum is expected to continue.
Support levels: 2.8570 – 2.7306 – 2.6513
Resistance levels: 2.9967 – 3.0927 – 3.3058
SOL/USDT
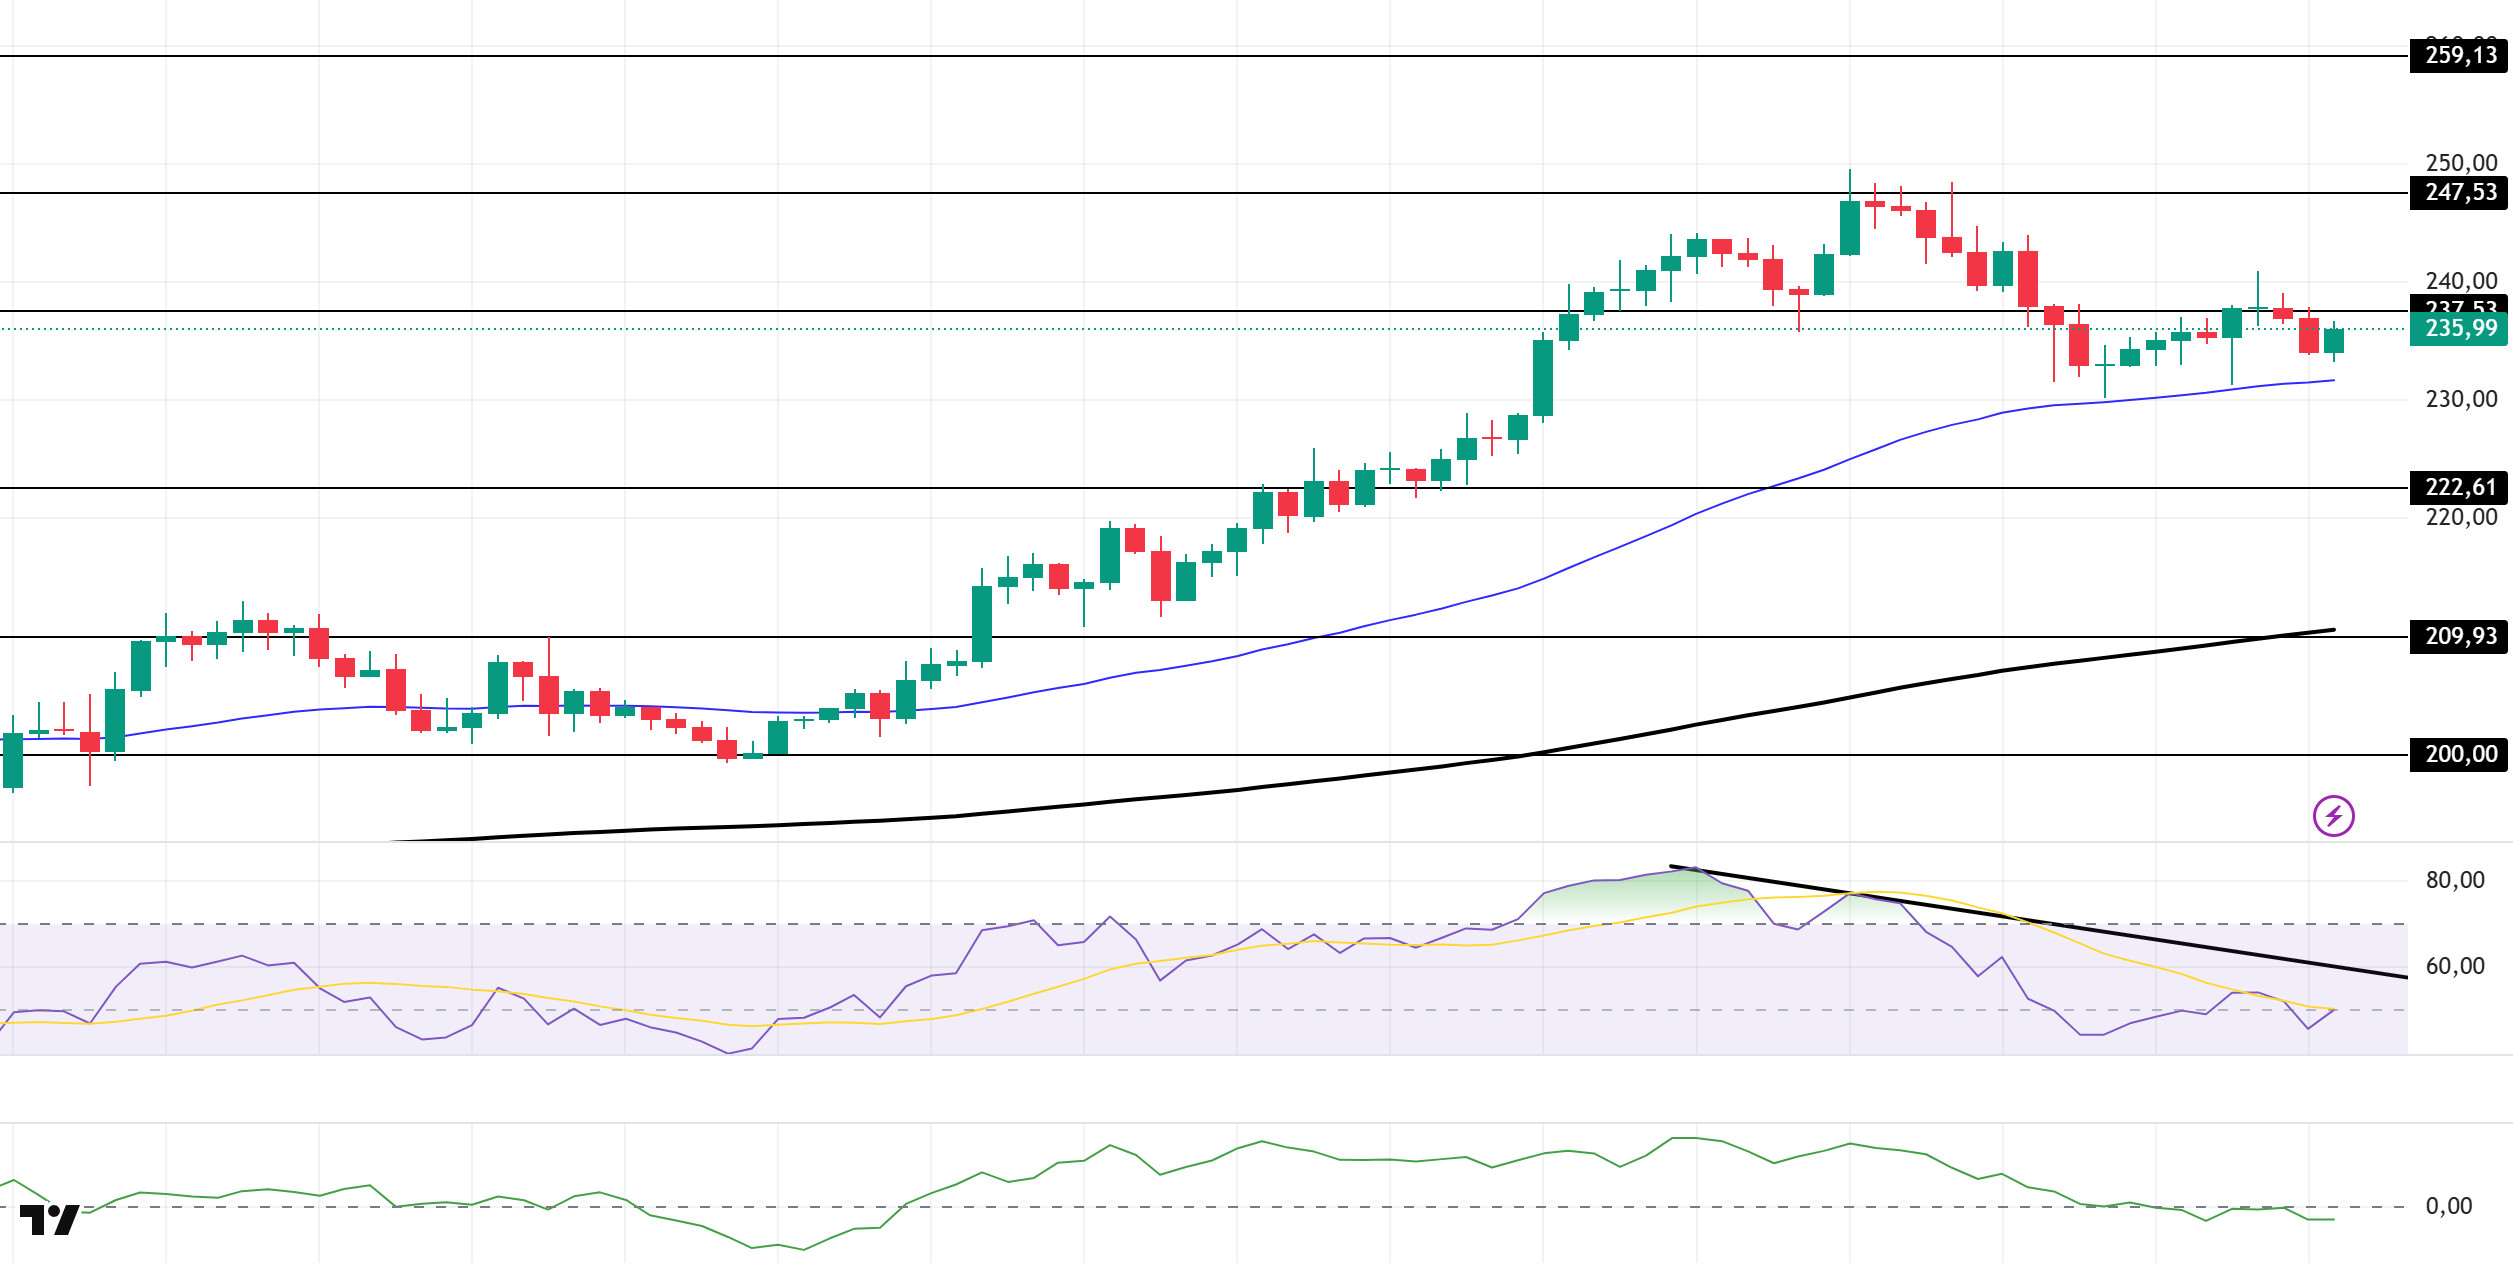
The SOL price traded sideways. The asset tested the strong resistance level of $237.53 but failed to break through and retreated, trading near the 50 EMA (Exponential Moving Average – Blue Line). It may test the $222.61 level with candle closes below the 50 EMA. With candle closes above the $237.53 level, the $247.53 level should be monitored.
The price continued to remain above the 50 EMA (Exponential Moving Average – Blue Line) and 200 EMA (Black Line) on the 4-hour chart. This indicates that the upward trend may continue in the medium term. At the same time, the price being above both moving averages shows us that the market is trending upward in the short term. The large difference between the two moving averages indicates that the asset may be in a sideways or downward trend. Chaikin Money Flow (CMF-20) remained in negative territory. However, a decrease in cash inflows could push the CMF deeper into negative territory. The Relative Strength Index (RSI-14) fell from neutral territory to negative territory. At the same time, its position in the lower region of the downtrend that began on September 12 indicated that selling pressure continued. In the event of an upturn due to macroeconomic data or positive news related to the Solana ecosystem, the $247.53 level stands out as a strong resistance point. If this level is broken upwards, the uptrend is expected to continue. If pullbacks occur due to developments in the opposite direction or profit-taking, the $222.61 level could be tested. A decline to these support levels could increase buying momentum, presenting a potential upside opportunity.
Supports: 222.61 – 209.93 – 200.00
Resistances 237.53 – 247.53 – 259.13
DOGE/USDT
Dogecoin treasury company CleanCore added another 100 million DOGE, bringing the total amount to over 600 million.
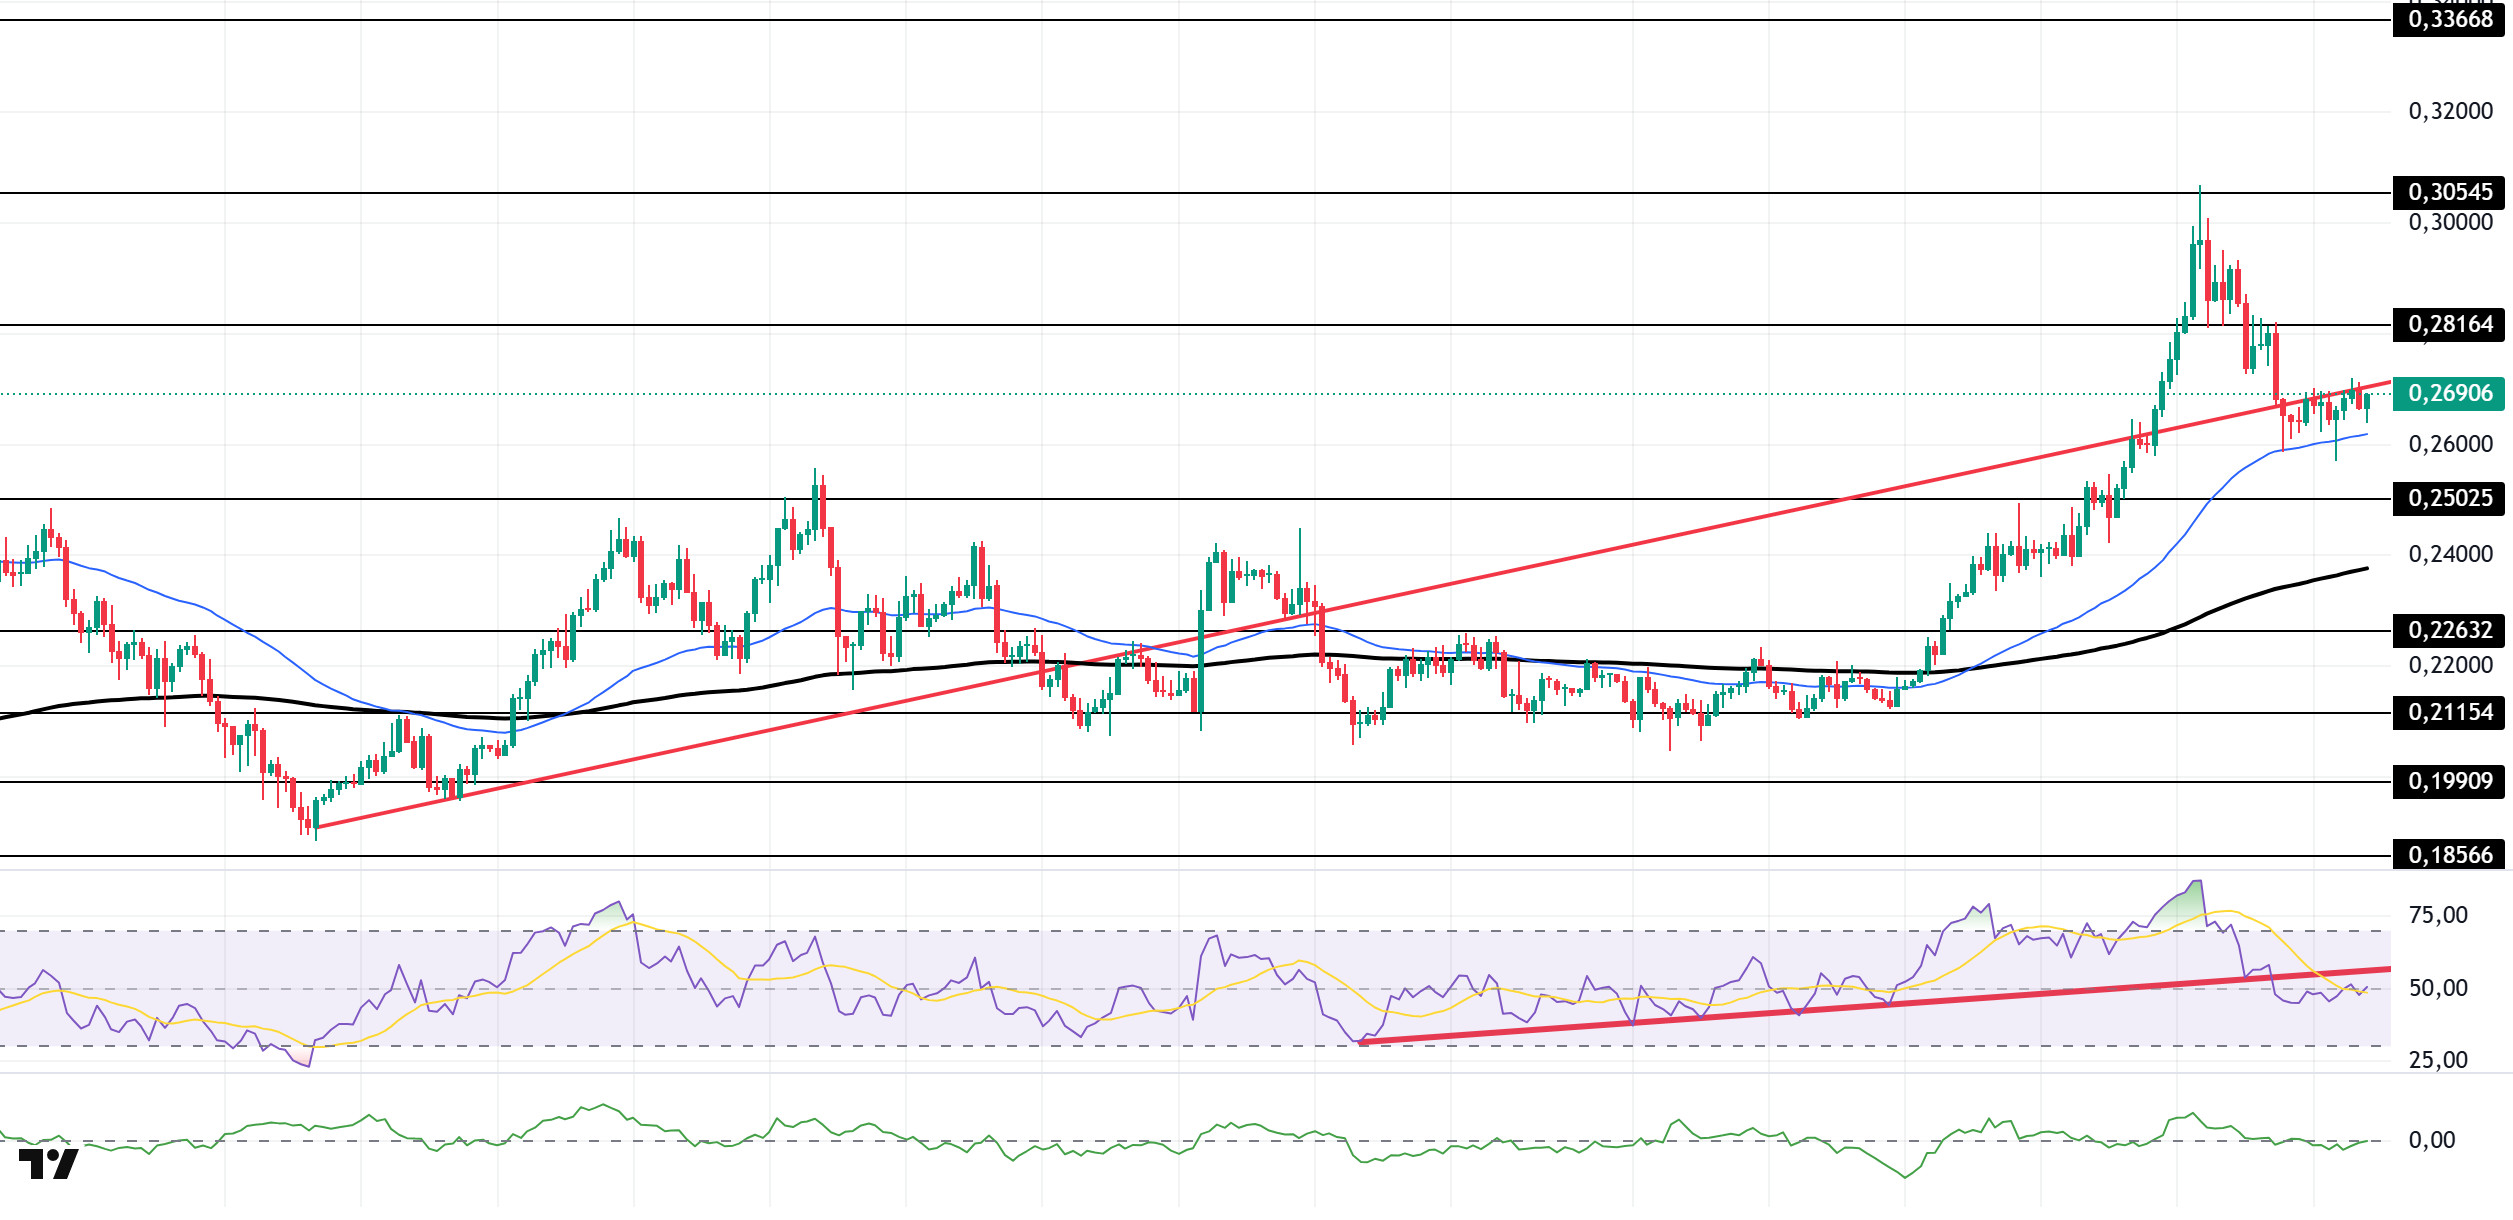
The DOGE price continued to fluctuate. The asset tested the upward trend that began on August 3 as support and broke below it, deepening its pullback. The price, which is preparing to retest the 50 EMA (Exponential Moving Average – Blue Line) moving average as support, may test the $0.25025 level on candlestick closes below the 50 EMA. In an upward move, the $0.28164 level could act as resistance.
On the 4-hour chart, the 50 EMA (Blue Line) remained above the 200 EMA (Black Line). This indicates that the medium-term upward trend is continuing. The price being above both moving averages shows that the short-term upward trend is strong. A large difference between the two moving averages may cause the asset to pull back or move sideways. Chaikin Money Flow (CMF-20) remained in negative territory. Additionally, a decrease in money inflows could push CMF deeper into negative territory. The Relative Strength Index (RSI-14) remained in negative territory. At the same time, it remained in the lower region of the upward trend that began on August 26. This indicated that selling pressure continued. In the event of potential increases due to political developments, macroeconomic data, or positive news flow in the DOGE ecosystem, the $0.28164 level stands out as a strong resistance zone. Conversely, in the event of negative news flow, the $0.25025 level could be triggered. A decline to these levels could increase momentum and potentially initiate a new upward wave.
Supports: $0.25025 – $0.22632 – $0.21154
Resistances: 0.28164 – 0.30545 – 0.33668
AVAX/USDT
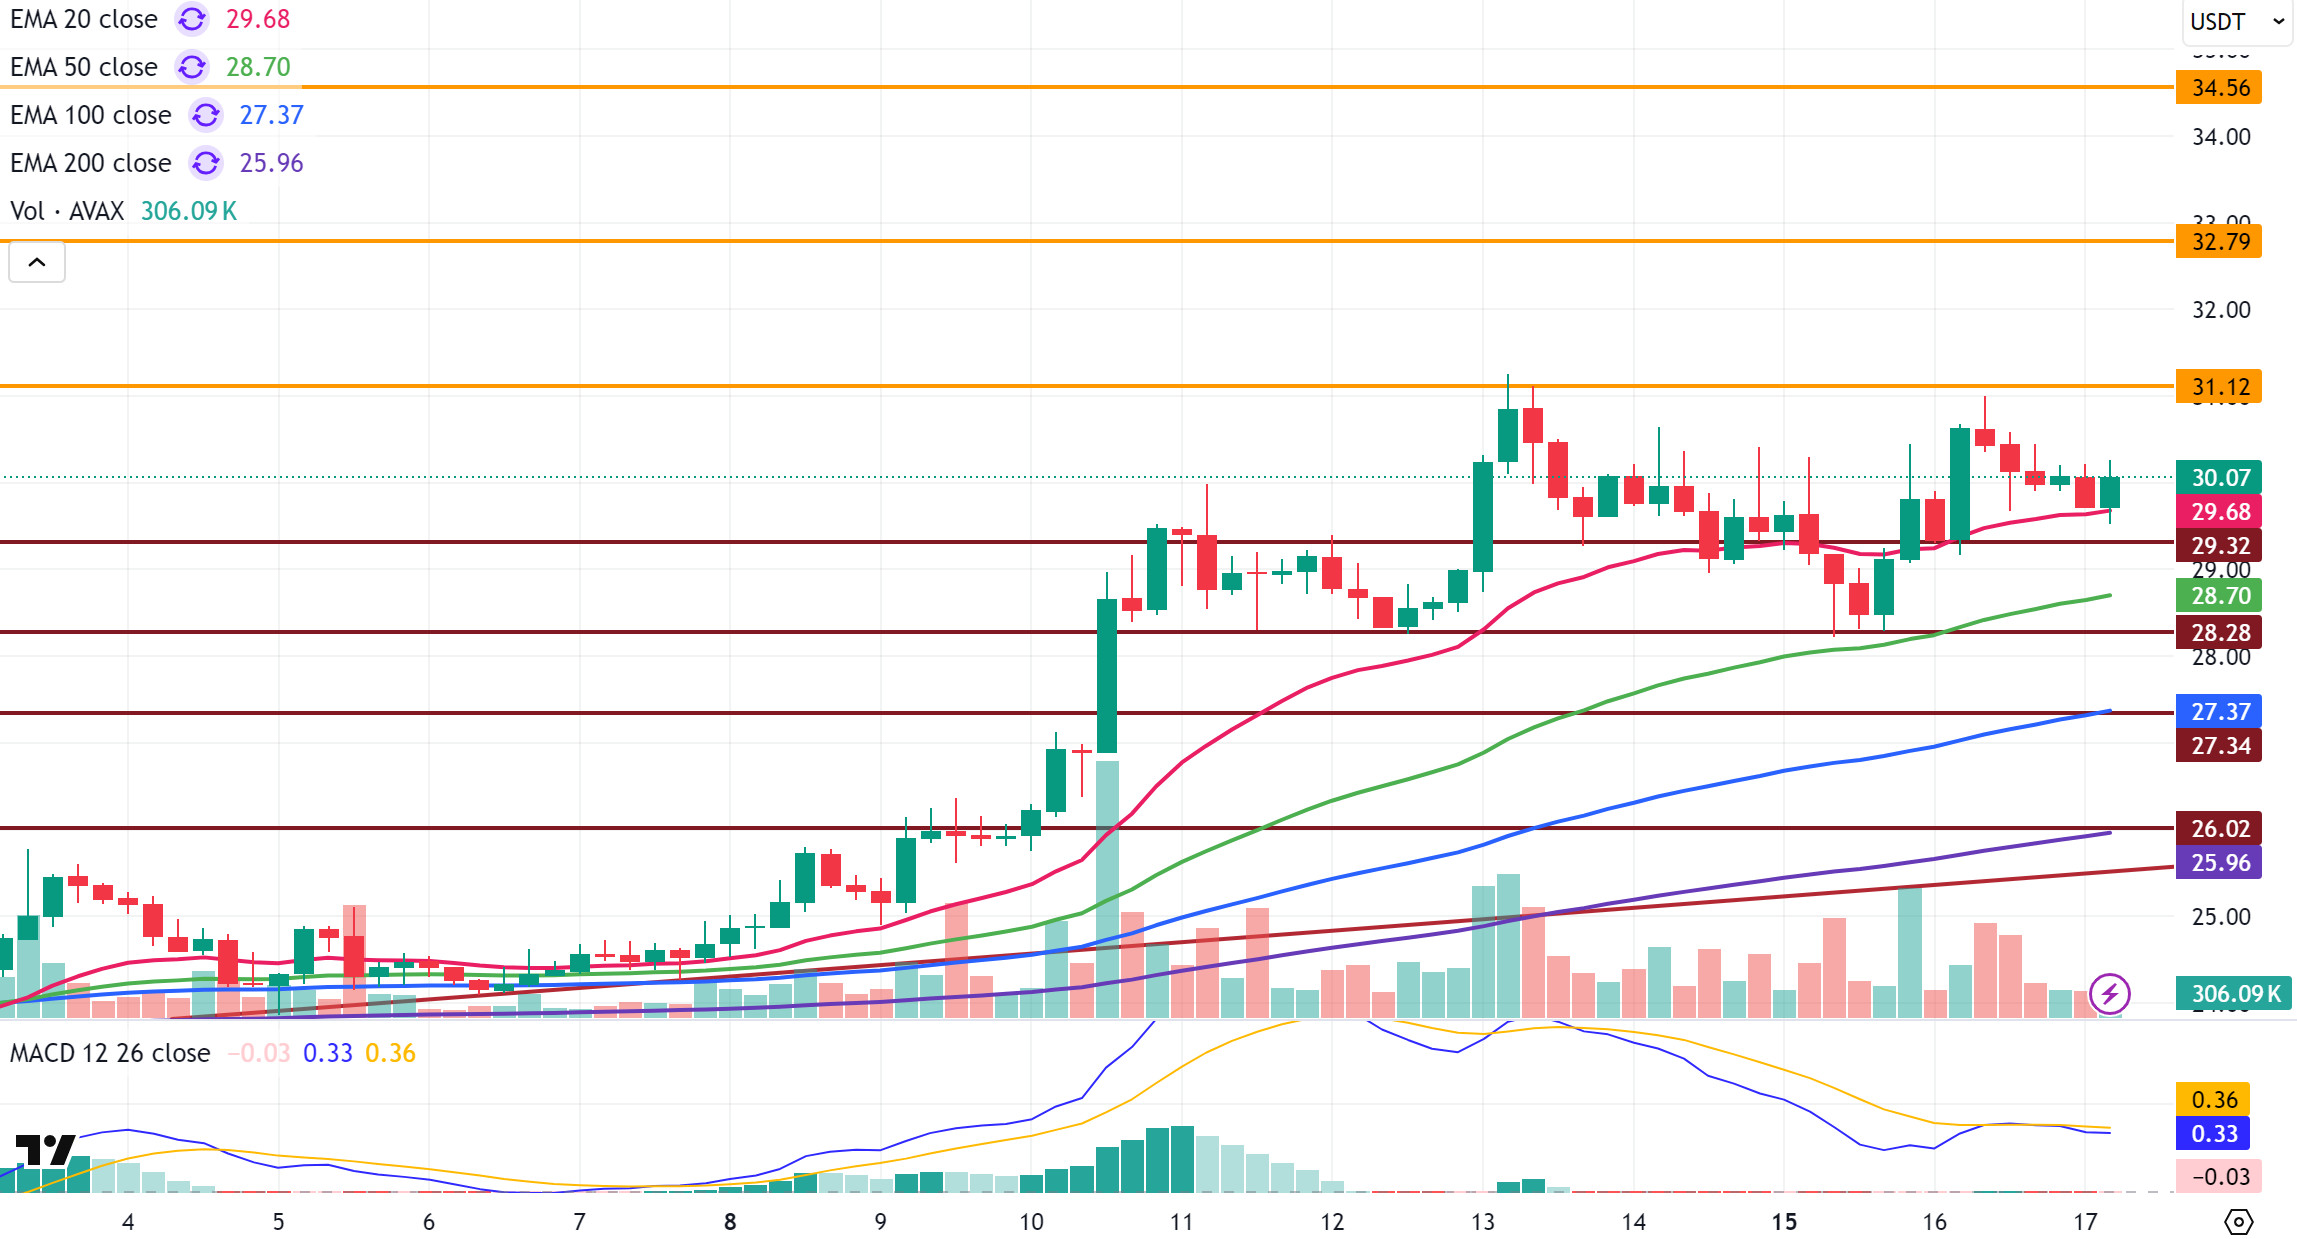
AVAX, which opened at $29.79 yesterday, closed the day at $30.05 with a 0.9% increase in value. Starting the new day with a decline, AVAX recovered with purchases at the 20-period Exponential Moving Average (EMA20) level and is trading at the starting level for the day. Today’s most important agenda items will be the Fed interest rate decision, economic projections, and Powell’s speech to be announced by the US. Expectations of an interest rate cut by the Fed support pricing, while Powell’s statements may highlight the possibility of a second and third interest rate cut. However, in the event of a negative message, the possibility of markets facing heavy selling pressure should not be overlooked.
On the 4-hour chart, AVAX retreated under selling pressure after rising to $31 yesterday. During this decline, the Moving Average Convergence/Divergence (MACD) line crossed below the signal line. This indicates that positive momentum is weakening and the downward trend is strengthening. As strong upward momentum has not yet formed, it is noteworthy that AVAX is facing selling pressure at resistance levels. On the positive side, AVAX is still trading above critical EMA levels. In particular, the 20-period Exponential Moving Average (EMA20) level is acting as support for the price’s recovery efforts. Sustained trading above this level increases the likelihood of the uptrend regaining momentum.
In the short term, the $29.32 support level is critical for AVAX if the downward movement continues. If it stays below this level, selling pressure could increase, and the price is likely to pull back to $28.28 and then $27.34. In a stronger downtrend scenario, the $26.02 level will come into focus as the main support. In the opposite scenario, with strong buying coming into play, the first target for AVAX’s rise will again be the $31.12 level. If closes occur above this level, the resistance levels of $32.79 and $34.56 could be tested in sequence. In the broader picture, AVAX remains technically positive as it continues to stay above the EMAs, but momentum is weak on the MACD. Therefore, the Fed’s decisions and Powell’s statements will play a critical role in determining the direction in the short term.
(EMA20: Pink Line, EMA50: Green Line, EMA100: Blue Line, EMA200: Purple Line)
Supports 29.32 – 28.28 – 27.34
Resistances 31.12 – 32.79 – 34.56
BNB/USDT
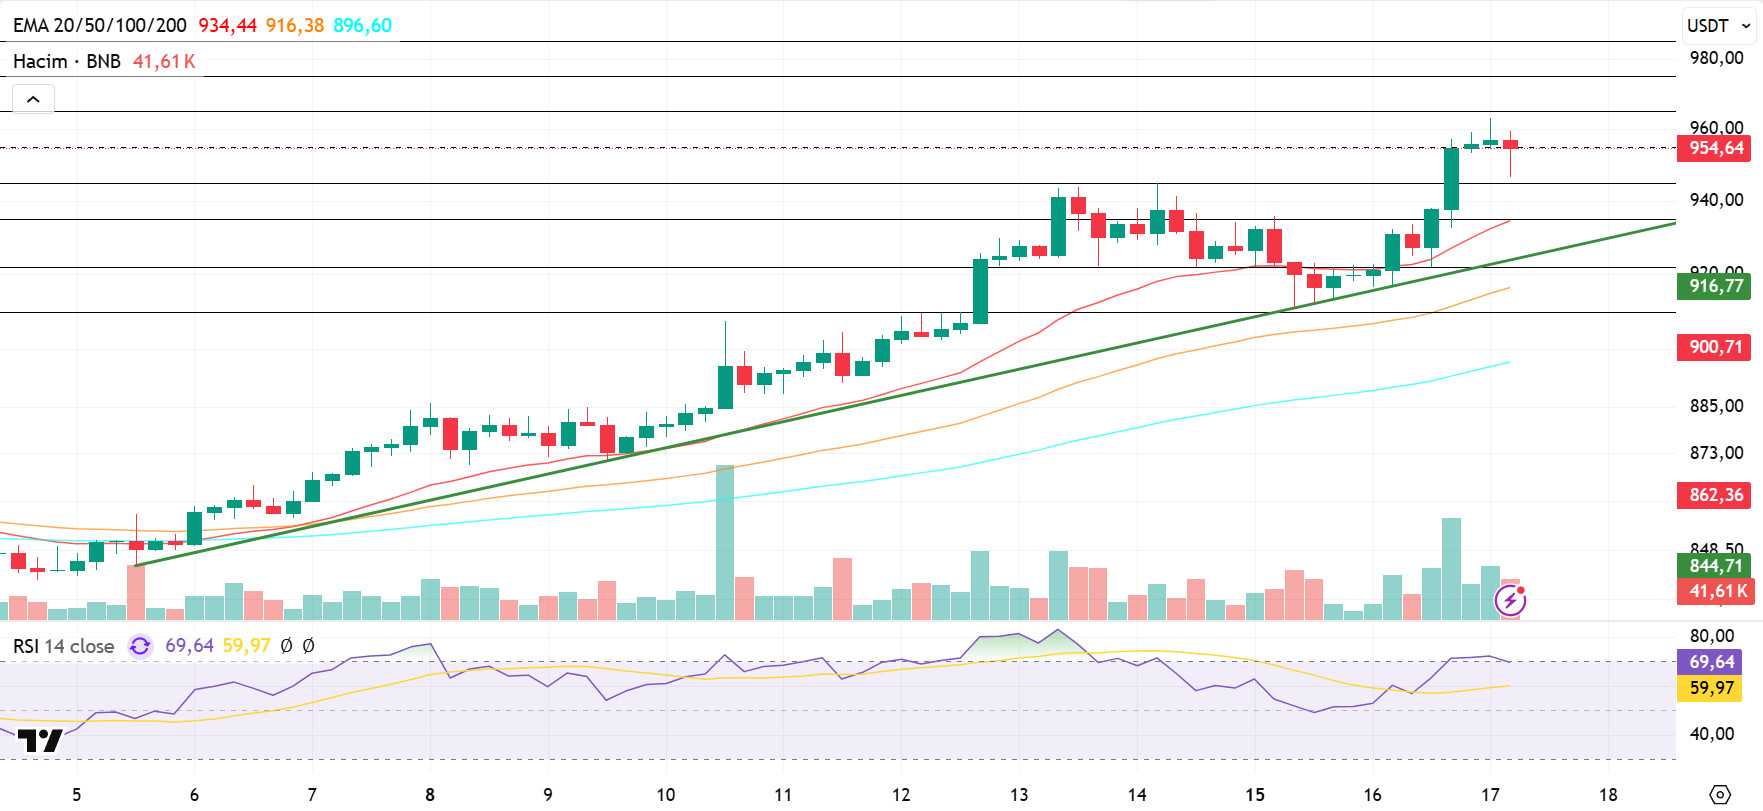
From a technical perspective, BNB/USDT entered an uptrend with strong support at the $840 level and recorded new historical highs. In this direction, BNB, which exceeded the $950 level, retreated due to selling pressure from that level.
After the pullback, the price experienced a correction towards the $945 level, and then showed a limited recovery from these levels.
Technical indicators for BNB/USDT, currently trading in the $945–965 range, point to positive changes in trading volume recently, suggesting the asset’s upward momentum may continue. Additionally, the Relative Strength Index (RSI) rose above the 70 level with the recent rallies, but despite turning downward with the price correction, it still hovers near these levels.
Based on the current technical picture, if selling pressure increases, the price is likely to fall back to the $945 support level. If this level is broken downwards, the price is expected to retreat to the $935 and $920 levels. On the other hand, if buying appetite is maintained, BNB is expected to test the $965 resistance level in the first stage. If this level is exceeded, the price may move towards the $975 and $985 levels, respectively.
Supports: 945 – 935 – 920
Resistances: 965 – 975 – 985
ADA/USDT
The FED’s decision to cut interest rates for the first time this year has been highlighted as a potential catalyst for crypto assets. According to news yesterday evening, Openbank announced that it has added local crypto trading in Germany by integrating BTC, ETH, LTC, POL, and ADA. This service will work alongside existing investment products and follow the EU MiCA regulatory framework. MiCA provides a unified regulatory framework across the EU for crypto asset service providers. Under MiCA, Openbank must meet transparency, custody, and market conduct requirements. This regulatory compliance enables banks like Santander to offer crypto services with clearer compliance obligations and consumer protections.
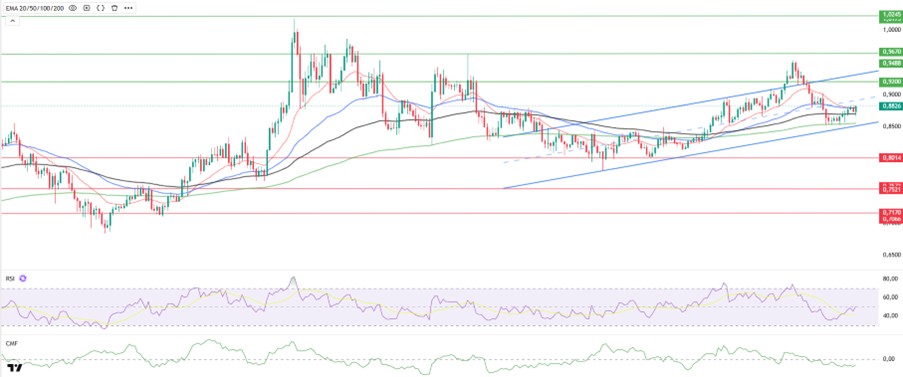
The ADA price started the day at 0.8824 levels and continues to trade above the moving averages. The 20-day Exponential Moving Average (EMA 20 – Red Line) and (EMA 50 – Blue Line) closing above the price is important for the continuation of the uptrend. After these two averages intersected on the 4-hour chart, the price initiated an upward reversal and continues to move above the 100-day Exponential Moving Average (EMA 100 – Black Line).
Technically speaking, on the 4-hour chart, if the ADA price closes above $0.8900, it could first target $0.9500, and if momentum continues, the $1.0245 level could be our first resistance level in the wide range. The Relative Strength Index (RSI) is rising towards the 50 level, approaching the buy zone, while the Chaikin Money Flow (CMF-20) is falling to the -0.12 level, indicating that the selling potential continues. The decrease in money inflows may keep the CMF in negative territory. Depending on the macroeconomic data to be released this week or positive news regarding the Cardano ecosystem, the $0.9500 level may emerge as our strong resistance point. If the decline begins, the $0.8075 level will be the important support level we will follow.
Supports 0.8075 – 0.7380 – 0.7170
Resistances: 1.1943 – 1.0245 – 0.9500
Legal Notice
The investment information, comments, and recommendations contained herein do not constitute investment advice. Investment advisory services are provided individually by authorized institutions taking into account the risk and return preferences of individuals. The comments and recommendations contained herein are of a general nature. These recommendations may not be suitable for your financial situation and risk and return preferences. Therefore, making an investment decision based solely on the information contained herein may not produce results in line with your expectations.

