
Technical Analysis
BTC/USDT
US jobless claims came in below expectations at 231K. While uncertainty continues over the Fed chairmanship, White House economic advisor Hassett stated that inflation is more serious than anticipated. The Bhutanese government transferred 343.1 BTC to a new wallet. Japanese public company Remixpoint purchased an additional 77.15 BTC, bringing its total BTC holdings to 1,350.
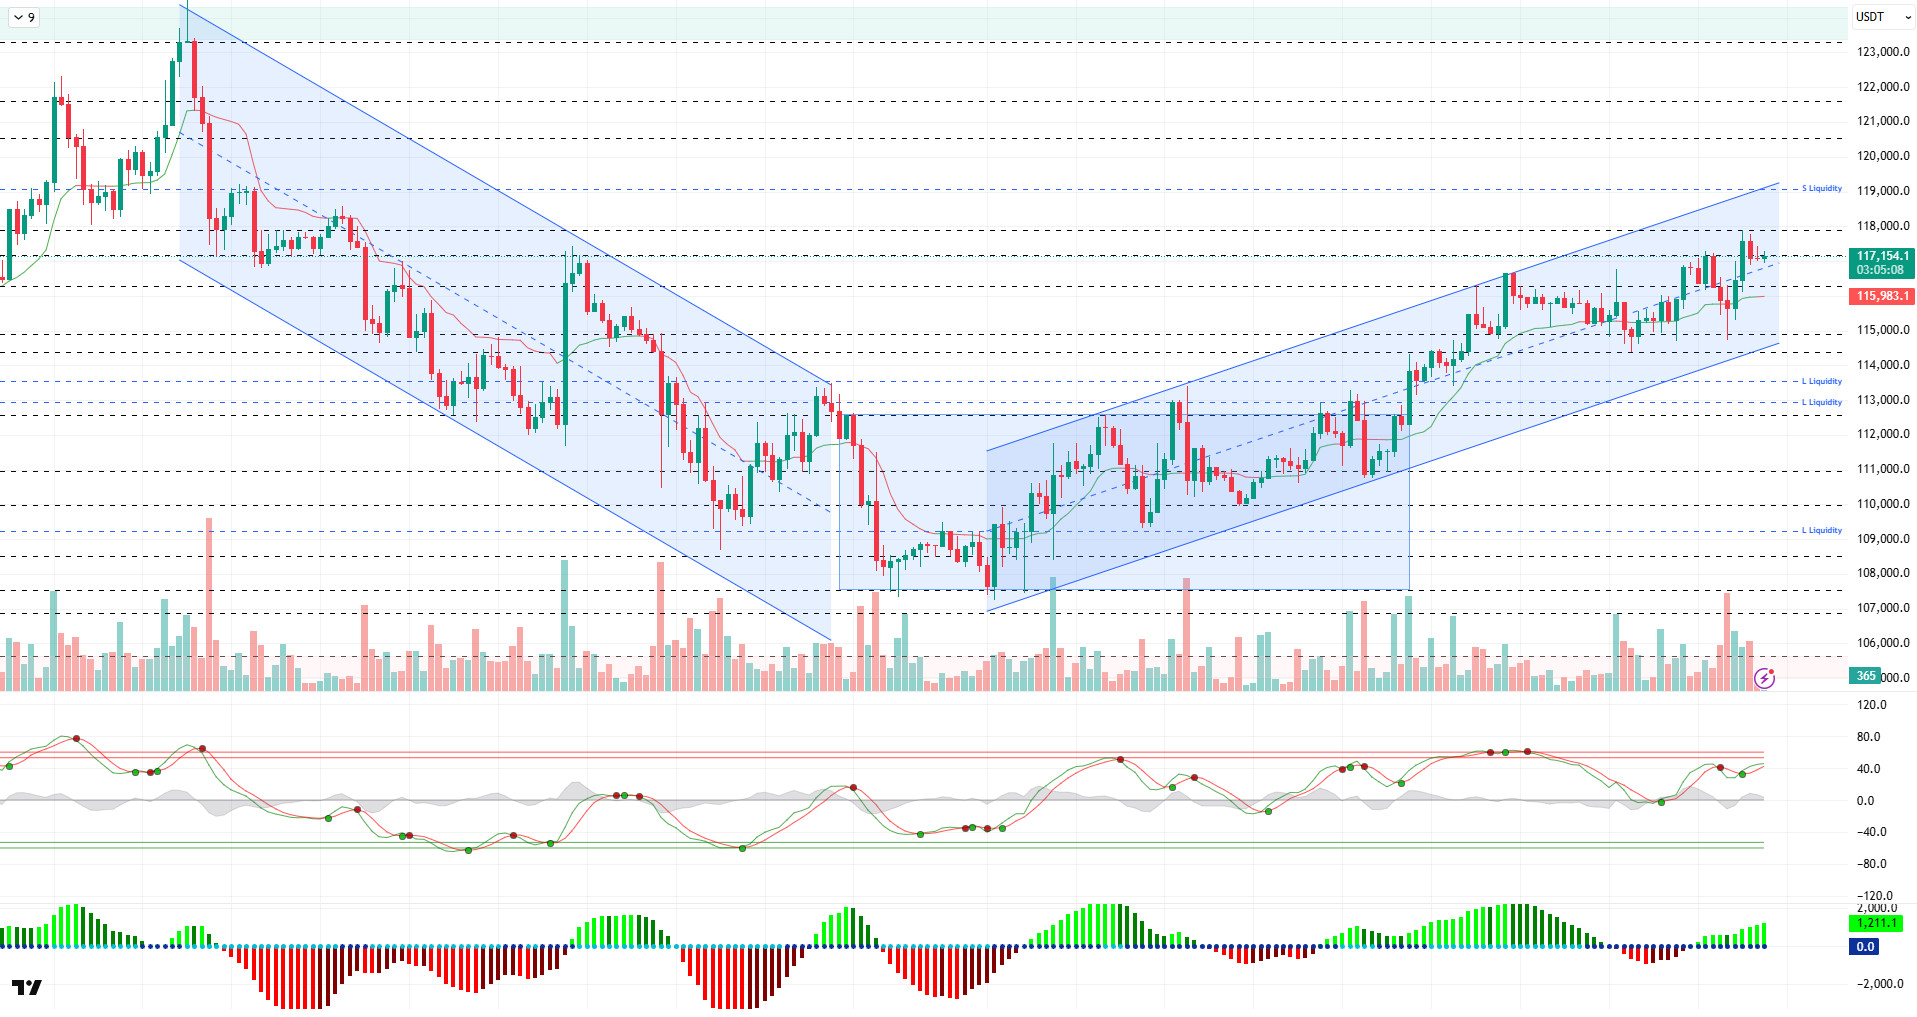
Looking at the technical picture, BTC continues to trade in a slightly bearish range compared to the previous analysis. The price, which occasionally dipped below 117,000, managed to recover and close above this level on an hourly basis. At the time of writing, it is trading at 117,230.
Technical indicators show that the Wave Trend oscillator (WT) is weakening, despite giving a buy signal after a short-term trend reversal following a sell signal in the overbought zone. The Squeeze Momentum (SM) indicator’s histogram gained momentum in positive territory. The Kaufman moving average is currently trading below the price at 115,985.
According to liquidity data, short-term sell positions were liquidated in the 117,000 – 117,800 band. The next sell level gained intensity in the 118,500 – 119,000 band. The buy level was liquidated at the 115,000 range with yesterday’s spike movement. The broader buy level continues to accumulate in the 113,000 – 114,000 range.
In summary, the market environment maintains a positive outlook, supported by fundamental developments. Despite the limited response to the interest rate cut, the Fed’s projections continue to support optimism. As we approach October, Bitcoin maintaining its upward stability and the price heading back towards ATH levels may not be a surprise for the market. On the technical side, the price completed its consolidation within the horizontal band it had been in for a long time and tested the 117,800 level accompanied by a minor upward channel. While sell-side transactions were liquidated in liquidity data, liquidations also occurred in the buy tiers. For the sustainability of the rise, it is critical for the price to maintain its current upward channel. Closings above the 117,000 level are particularly important for the continuation of the trend. If momentum is gained above this level, the 118,500 – 119,000 liquidity zone could become the target, followed by the 120,000 level. On the other hand, in the event of potential selling pressure, 116,100 is the support level, while 115,000 is the reference point to be monitored. If the price falls below this level, the 113,500 – 113,000 band will be monitored as a strong support and liquidity area.
Supports: 116,100 – 115,000 – 114,000
Resistances: 117,250 – 118,000 – 119,000
ETH/USDT
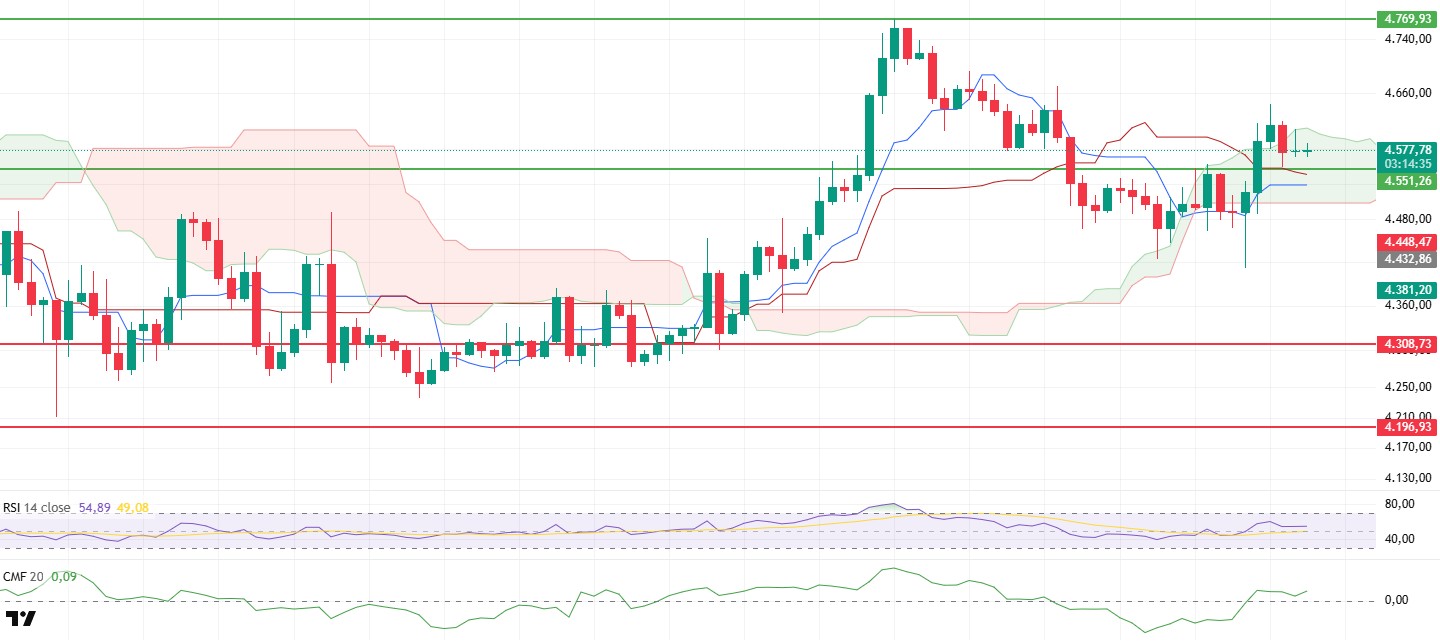
During the day, the ETH price retested the upper band of the cloud, a technically critical level at $4,608. However, the price failed to break through this area and experienced a slight pullback amid selling pressure, settling at the $4,570 level and ending the day with a relatively flat appearance. This movement highlights that the $4,608 level continues to act as strong resistance and that buyers are struggling at this level.
However, technical indicators point to positive signals emerging in market dynamics. The Chaikin Money Flow (CMF) indicator continuing its upward movement in positive territory indicates that the amount of liquidity entering the market is increasing and buyers’ appetite is being maintained. This is an important sign that the price still has strong potential for upward movement.
Furthermore, the price being above both the Tenkan and Kijun levels on the Ichimoku indicator shows that buyers are in control. In particular, the Tenkan line approaching the Kijun line indicates that short-term momentum is gaining strength and supports the bullish scenario. This picture suggests that intraday pullbacks are corrective in nature for now.
In the broader view, if ETH breaks above the upper band of the cloud in the evening hours, upward movement is likely to continue. In this case, the price is expected to first test the critical resistance level at $4,769. Breaking above this level could accelerate the uptrend and pave the way for new peak attempts. On the other hand, in a downward scenario, the $4,551 support level is a critical threshold. If this level is broken downward, selling pressure could intensify, and the price could retreat towards the $4,500 – $4,440 band in the short term.
Support levels: 4.551 – 4.308 – 4.196
Resistance levels: 4,769 – 4,857 – 5,002
XRP/USDT
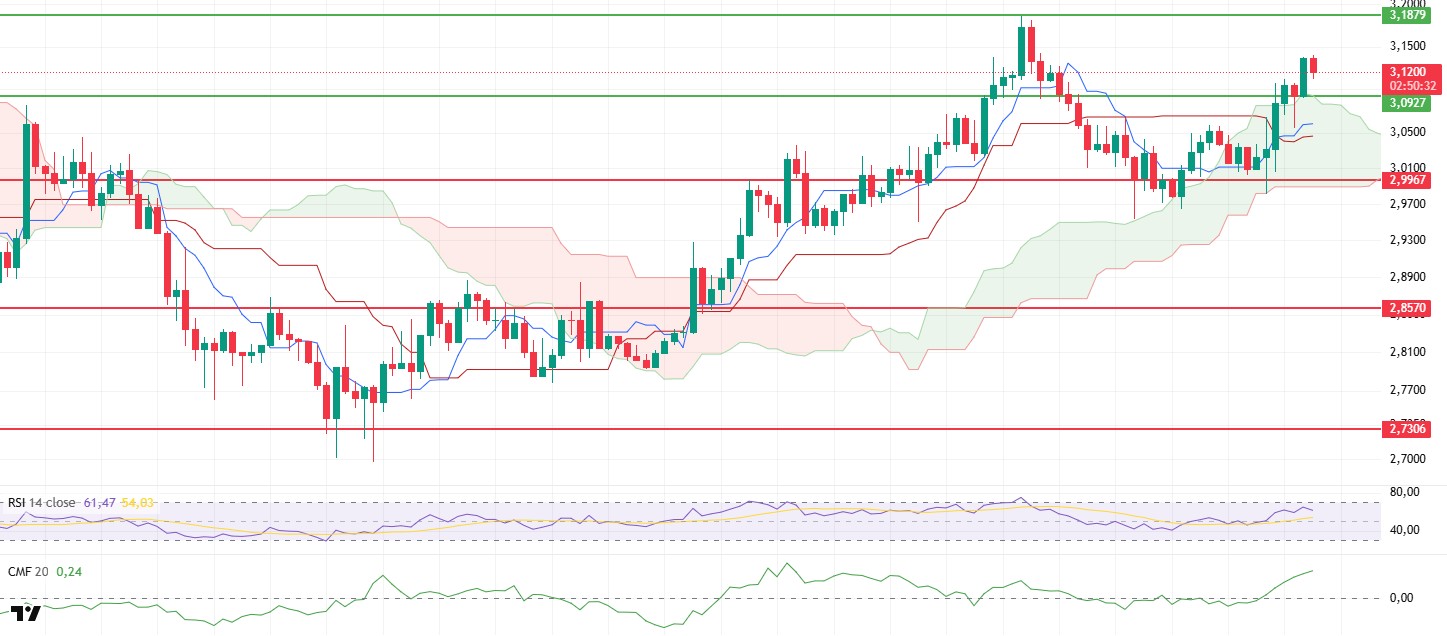
During the day, the XRP price managed to break through the critical resistance level of $3.09 highlighted in the morning analysis and rose to $3.14 by maintaining its position above this level. However, selling pressure at this point caused the price to pull back slightly, stabilizing at $3.12 in the evening.
On the liquidity side, the Chaikin Money Flow (CMF) indicator continues its movement in positive territory, maintaining its upward momentum. This outlook signals strong money inflows into the market and that buyers are still in a dominant position. The CMF maintaining its positive trend confirms that there is strong liquidity support behind the bullish scenario.
In the Ichimoku indicator, the breakout of the kumo cloud and the Tenkan line crossing above the Kijun line continue to support the positive outlook for both the main trend and short-term momentum. This picture shows that the upward trend in XRP remains technically strong and that corrections are limited for now.
In the overall outlook, the $3.09 level now stands out as an important support point. Sustaining above this level will increase the potential for the price to maintain its upward momentum and continue its rise towards the critical resistance at the $3.18 level. Breaking above $3.18 could pave the way for the trend to gain stronger momentum. Conversely, if the $3.09 level is lost, the price could retreat to the main support level of $2.99. Therefore, whether the $3.09 support holds in the short term will be decisive for the direction of XRP.
Support levels: $3.0927 – $2.9967 – $2.8570
Resistance levels: 3.1879 – 3.3058 – 3.6554
SOL/USDT
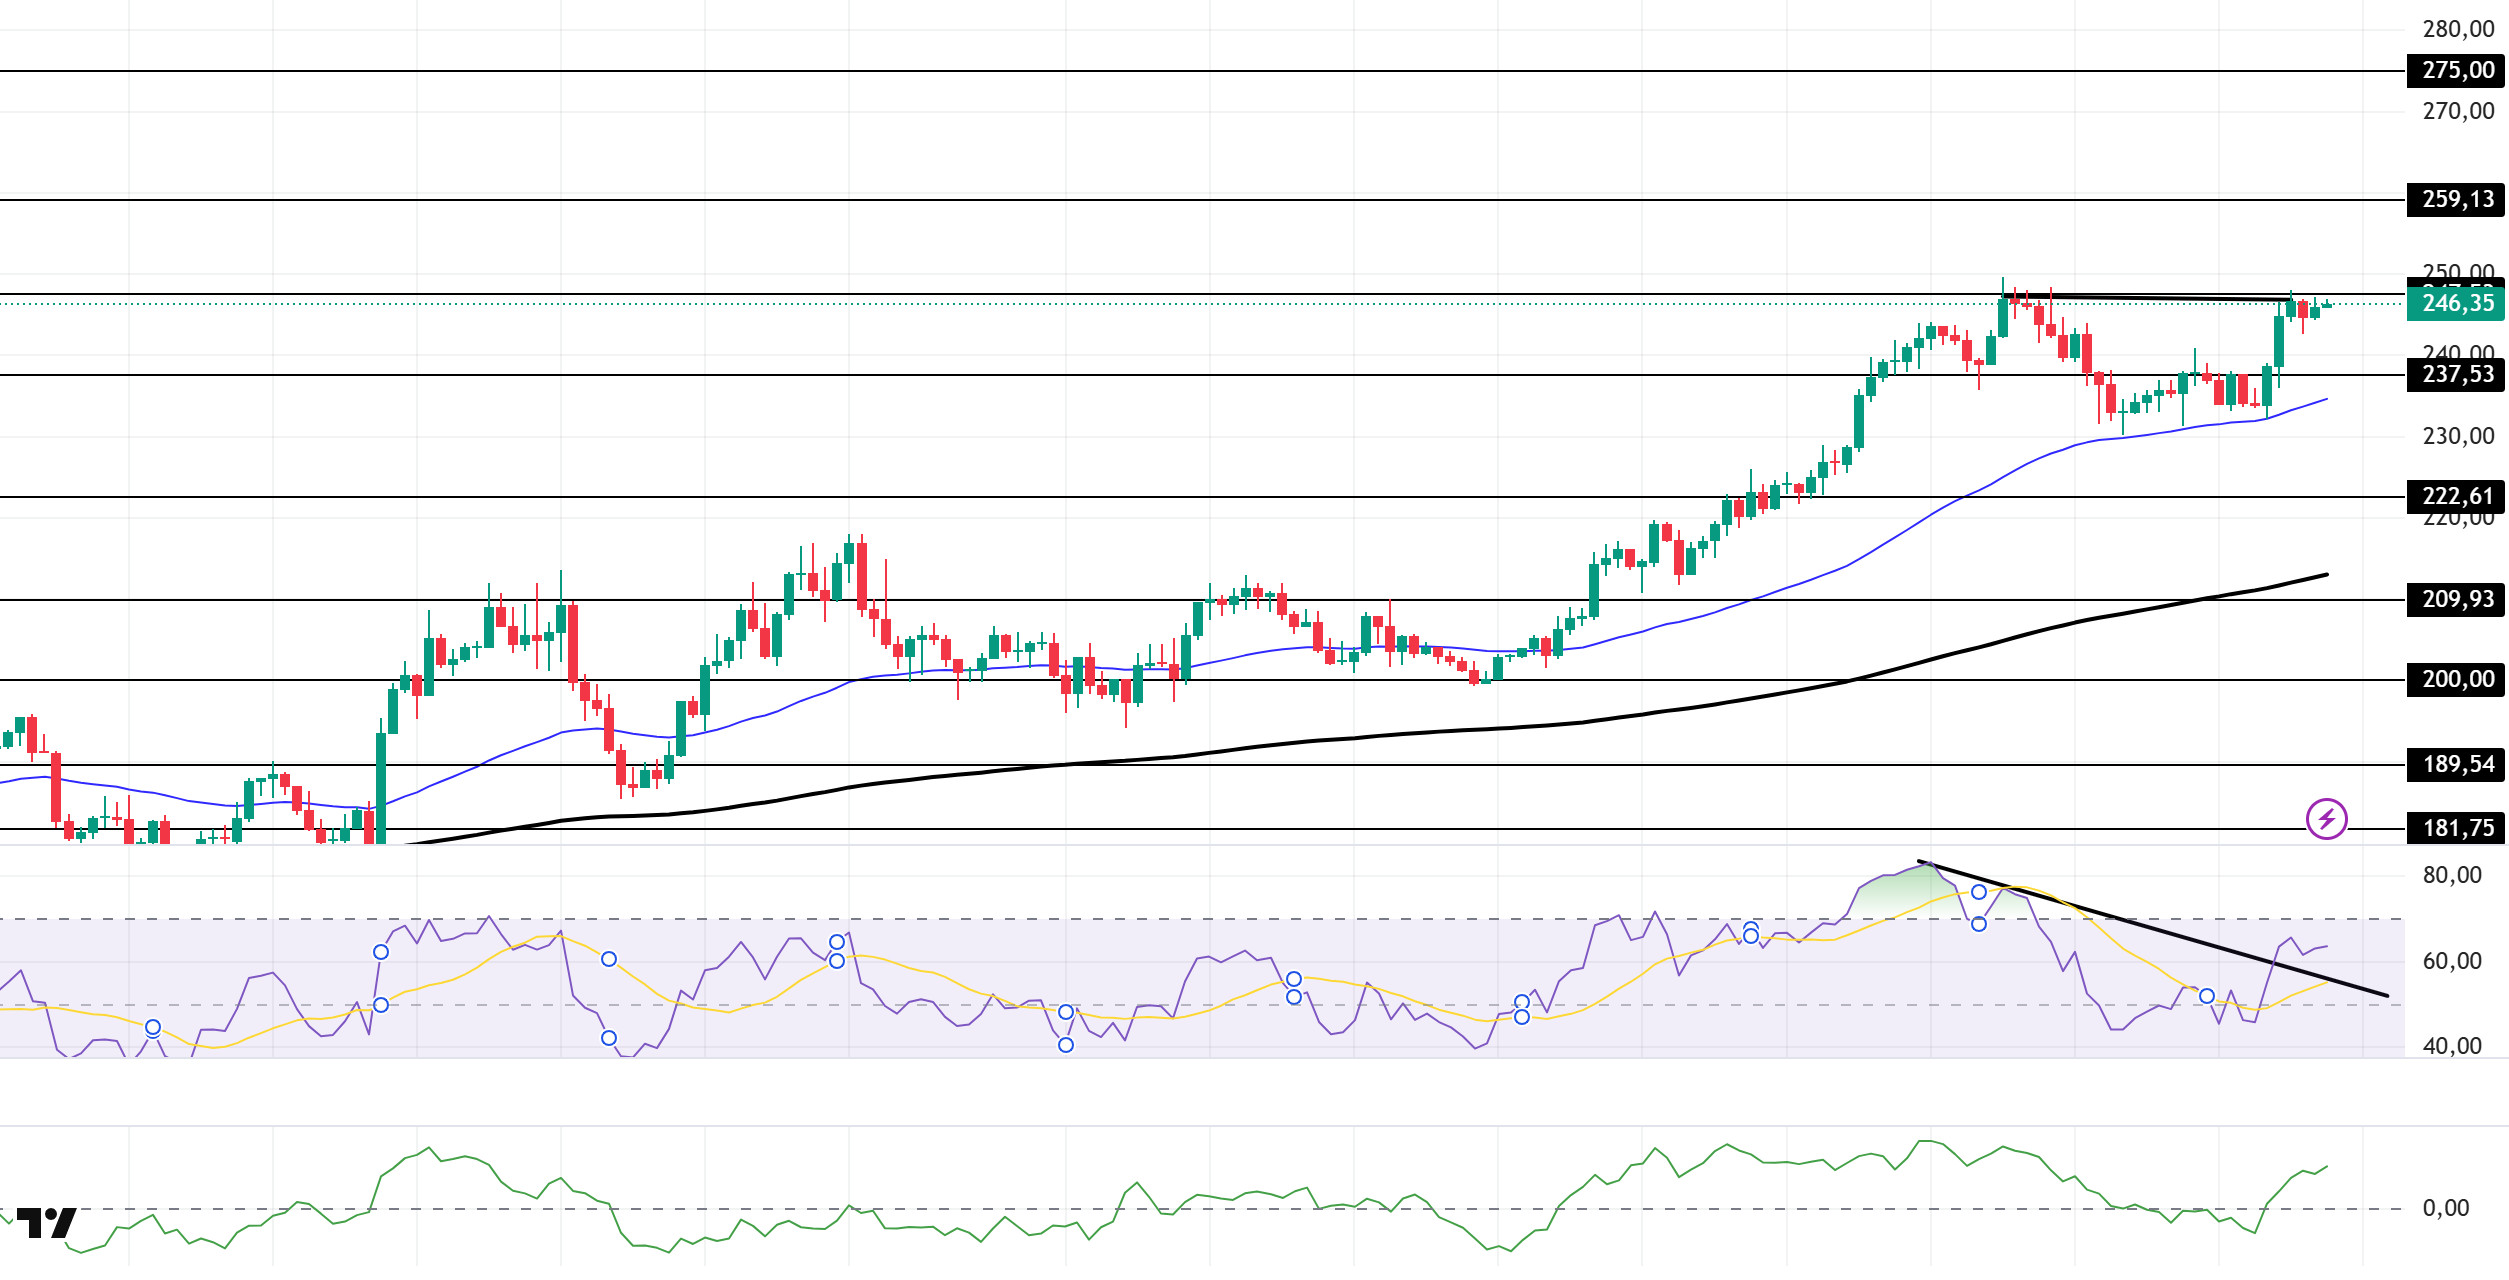
The SOL price moved sideways during the day. The asset tested the strong resistance level of $237.53 and broke through it to continue its upward movement. Currently testing the strong resistance level of $247.53, the price could target the $259.13 level if it closes above this level. In case of a pullback, the $237.53 level could be monitored.
On the 4-hour chart, it remained above the 50 EMA (Exponential Moving Average – Blue Line) and 200 EMA (Black Line). This indicates that the medium-term upward trend may continue. At the same time, the price being above both moving averages shows us that the market is trending upward in the short term. The large difference between the two moving averages indicates that the asset may be in a sideways or downward trend. Chaikin Money Flow (CMF-20) remained in positive territory. However, an increase in cash inflows could push the CMF to the upper levels of the positive zone. The Relative Strength Index (RSI-14) maintains its position in positive territory. It also remained above the downward trend that began on September 12, signaling buying pressure. However, negative divergence could cause pullbacks. If there is an uptrend due to macroeconomic data or positive news related to the Solana ecosystem, the $259.13 level stands out as a strong resistance point. If this level is broken upwards, the rise is expected to continue. If pullbacks occur due to developments in the opposite direction or profit-taking, the $237.53 level may be tested. If there is a decline to these support levels, an increase in buying momentum may present a potential upside opportunity.
Supports: 237.53 – 222.61 – 209.93
Resistances: 247.53 – 259.13 – 275.00
DOGE/USDT
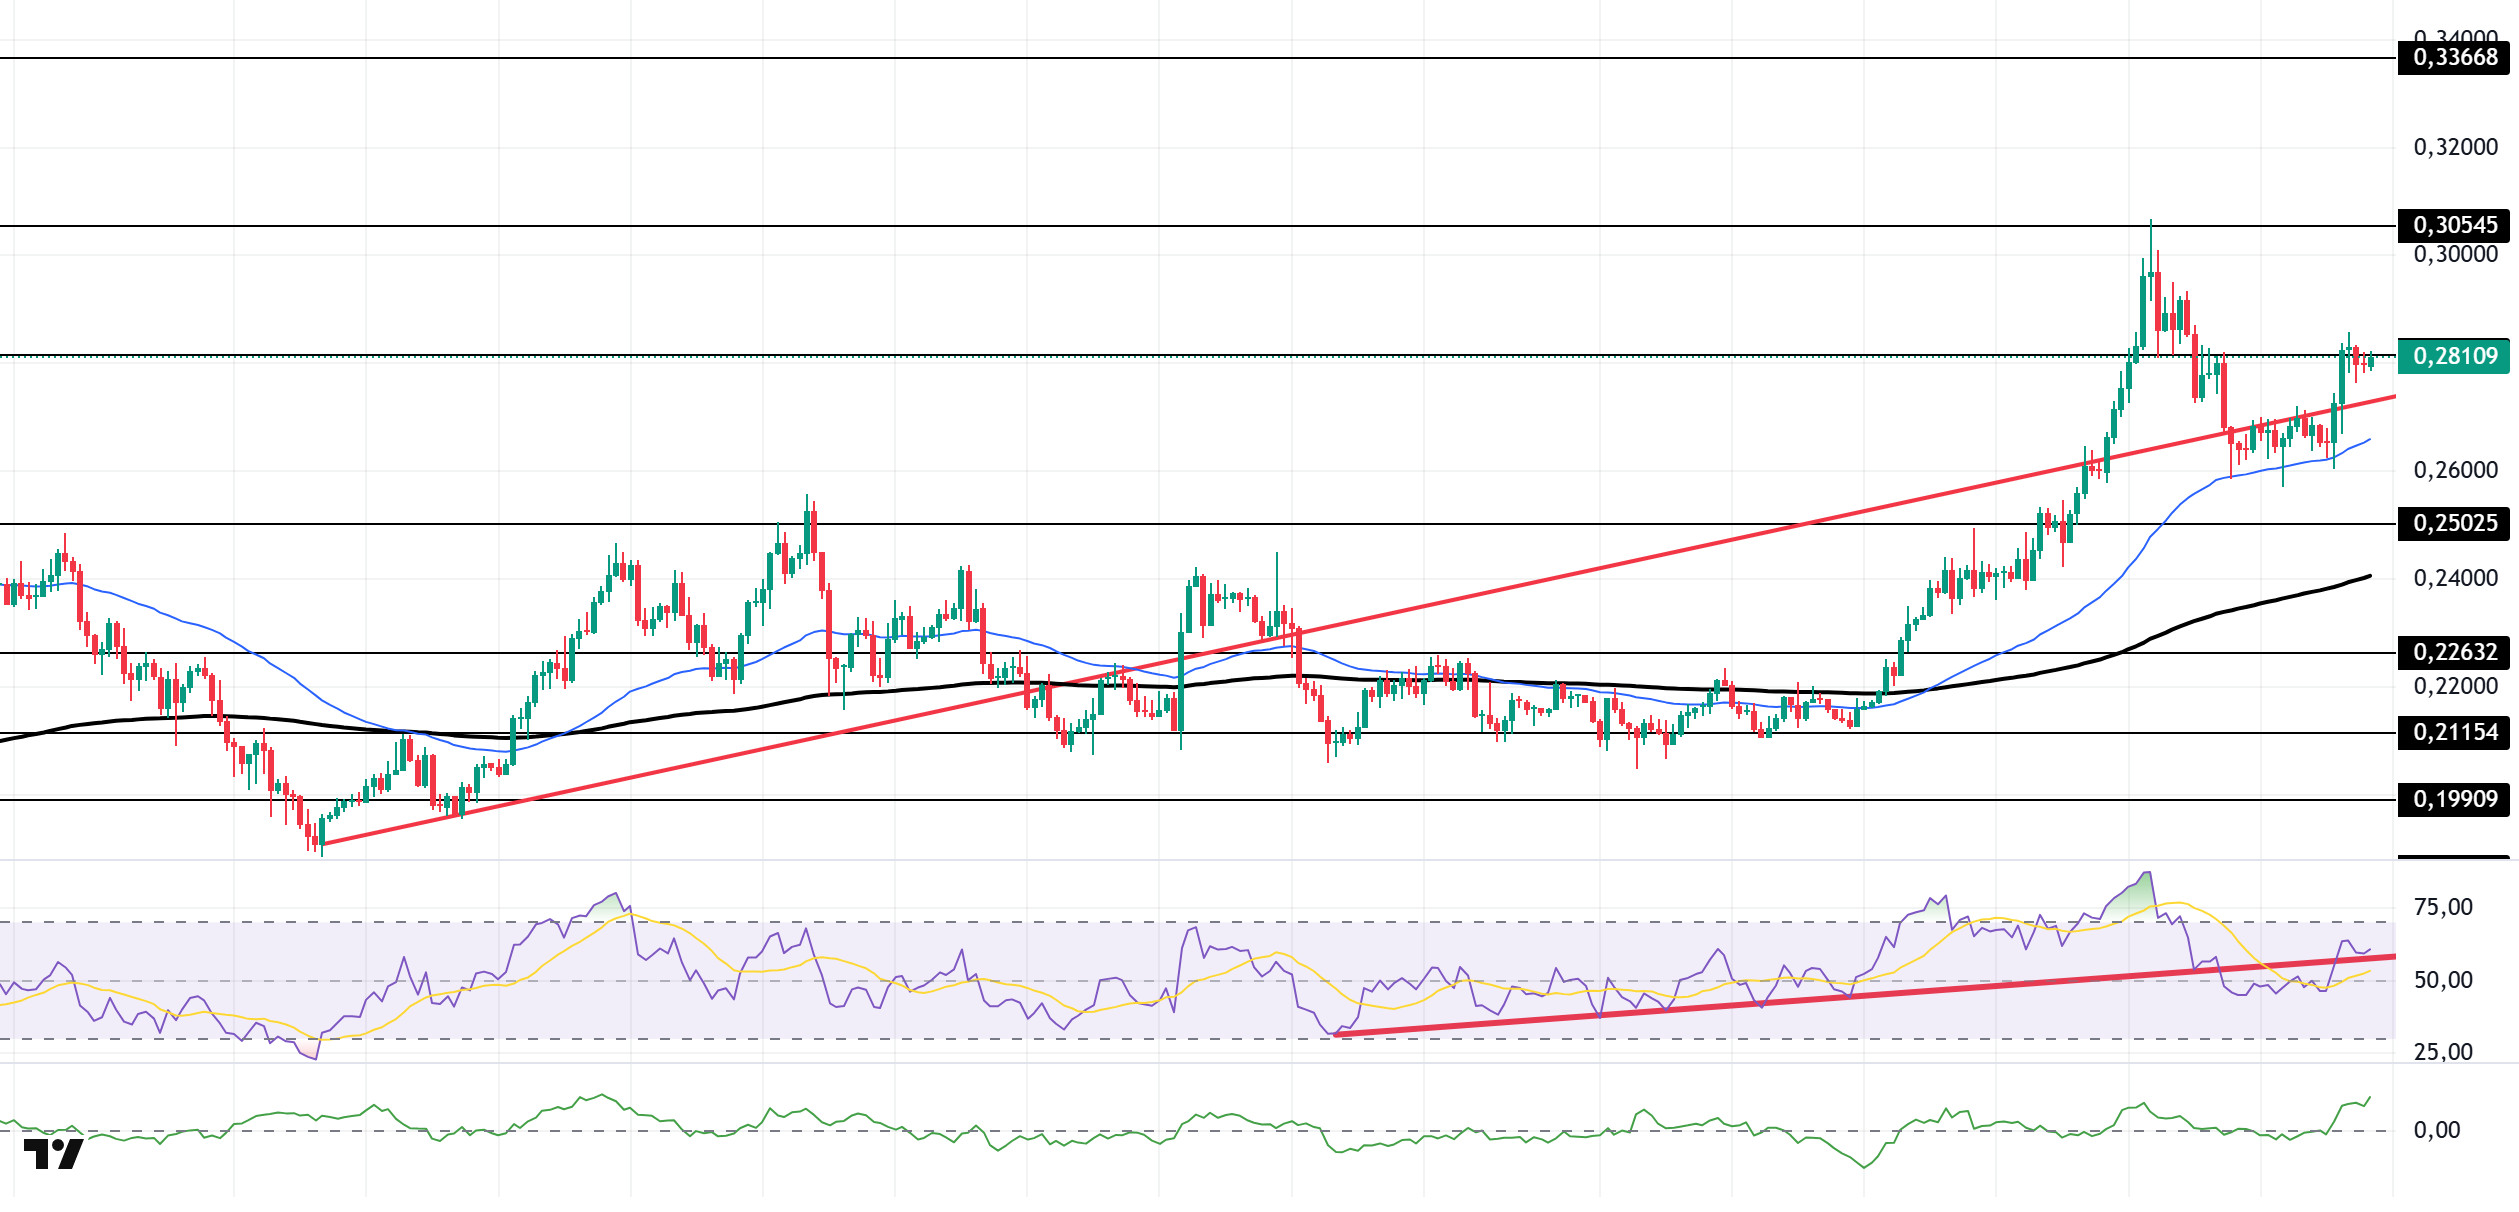
The DOGE price moved sideways during the day. The asset retested the 50 EMA (Exponential Moving Average – Blue Line) moving average as support and gained momentum from there, breaking above the upward trend that began on August 3. Currently testing the $0.28164 level as resistance, the price could test the $0.30545 level if it closes above this level. In the event of a pullback, the upward trend could act as support.
On the 4-hour chart, the 50 EMA (Blue Line) remained above the 200 EMA (Black Line). This indicates that the medium-term upward trend is continuing. The price being above both moving averages shows that the short-term upward trend is strong. A large difference between the two moving averages may cause the asset to pull back or move sideways. Chaikin Money Flow (CMF-20) continues to be in positive territory. Additionally, a decrease in money inflows could push CMF into negative territory. The Relative Strength Index (RSI-14) maintains its position in positive territory. At the same time, it continues to trade above the uptrend that began on August 26 and is currently testing it as support. In the event of potential increases driven by political developments, macroeconomic data, or positive news flow within the DOGE ecosystem, the $0.30545 level stands out as a strong resistance zone. Conversely, in the event of negative news flow, the $0.25025 level could be triggered. A decline to these levels could increase momentum and potentially initiate a new upward wave.
Supports: $0.25025 – $0.22632 – $0.21154
Resistances: 0.28164 – 0.30545 – 0.33668
BNB/USDT
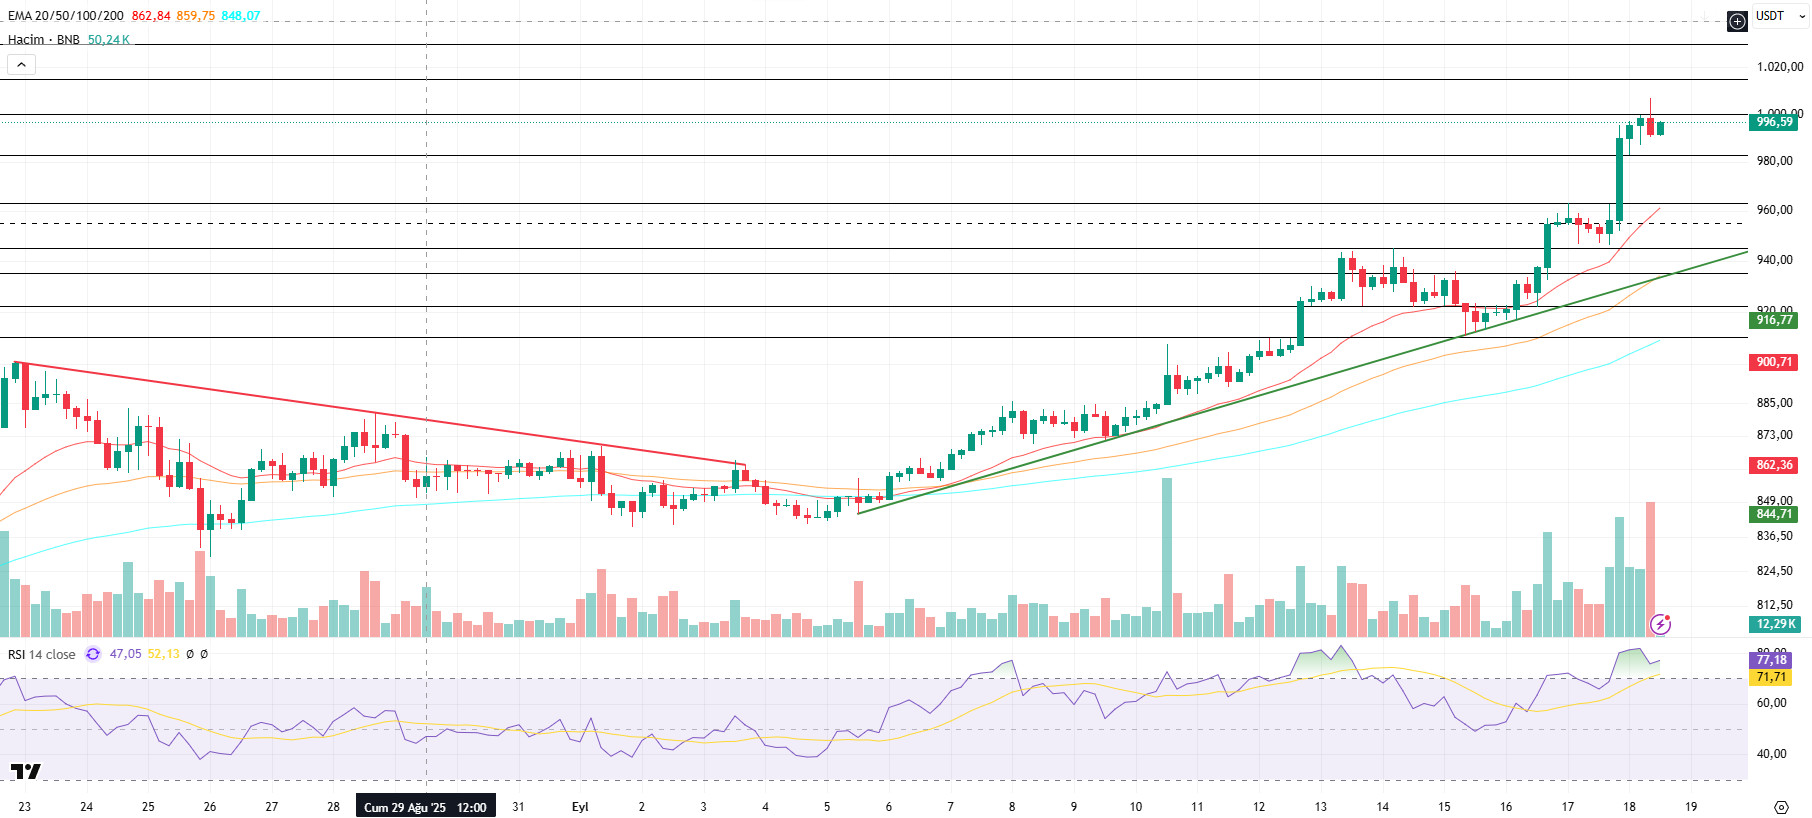
Yesterday, following the Fed’s 25 basis point cut in its policy rate, BNB showed strong gains, setting new historical highs. In this context, BNB surpassed the psychological $1,000 level, recording an all-time high (ATH) of $1,006. Although a partial price correction was seen from this level, it maintains its positive momentum based on the newly opened candle.
From a technical perspective, BNB/USDT entered an uptrend with strong support at the $840 level and showed positive momentum up to the $960 level. Facing selling pressure at this level, BNB retreated to the EMA 20 (red line) level. However, with the support of fundamental developments, BNB found strong support at these levels and continued its rise, setting a new ATH at $1,006.
Currently trading in the $985–1,000 range, technical indicators for BNB/USDT show that the recent increase in trading volume has contributed to the upward momentum. Furthermore, the Relative Strength Index (RSI) rose above the 70 level with the recent increases but turned downward with the price correction. Nevertheless, the RSI is still hovering near these levels, indicating that there is limited room for correction in the asset.
Based on the current technical picture, if buying appetite is maintained, BNB is expected to retest the psychological resistance level of $1,000 in the first stage. If this level is broken, the price could potentially move towards the $1,015 and $1,030 levels. On the other hand, if selling pressure increases, the price is likely to fall back to the $985 support level. If this level is broken downwards, the price is expected to retreat to the $965 and $945 levels, respectively.
Supports: 985 – 965 – 945
Resistances: 1000 – 1015 – 1030
Legal Notice
The investment information, comments, and recommendations contained herein do not constitute investment advice. Investment advisory services are provided individually by authorized institutions taking into account the risk and return preferences of individuals. The comments and recommendations contained herein are of a general nature. These recommendations may not be suitable for your financial situation and risk and return preferences. Therefore, making an investment decision based solely on the information contained herein may not produce results in line with your expectations.


