
Technical Analysis
BTC/USDT
Fed member Neel Kashkari stated that two additional interest rate cuts would be appropriate this year, while also saying they are open to raising rates if necessary. European Commission President Ursula von der Leyen announced that they will unveil new restrictive measures covering cryptocurrency platforms. Bitcoin Treasury increased its reserves to 1,111 BTC by acquiring 111 more BTC. According to on-chain data, the amount of Bitcoin that has not moved for over seven years increased by 422,430, bringing the illiquid supply to a record high of 14.30 million BTC.
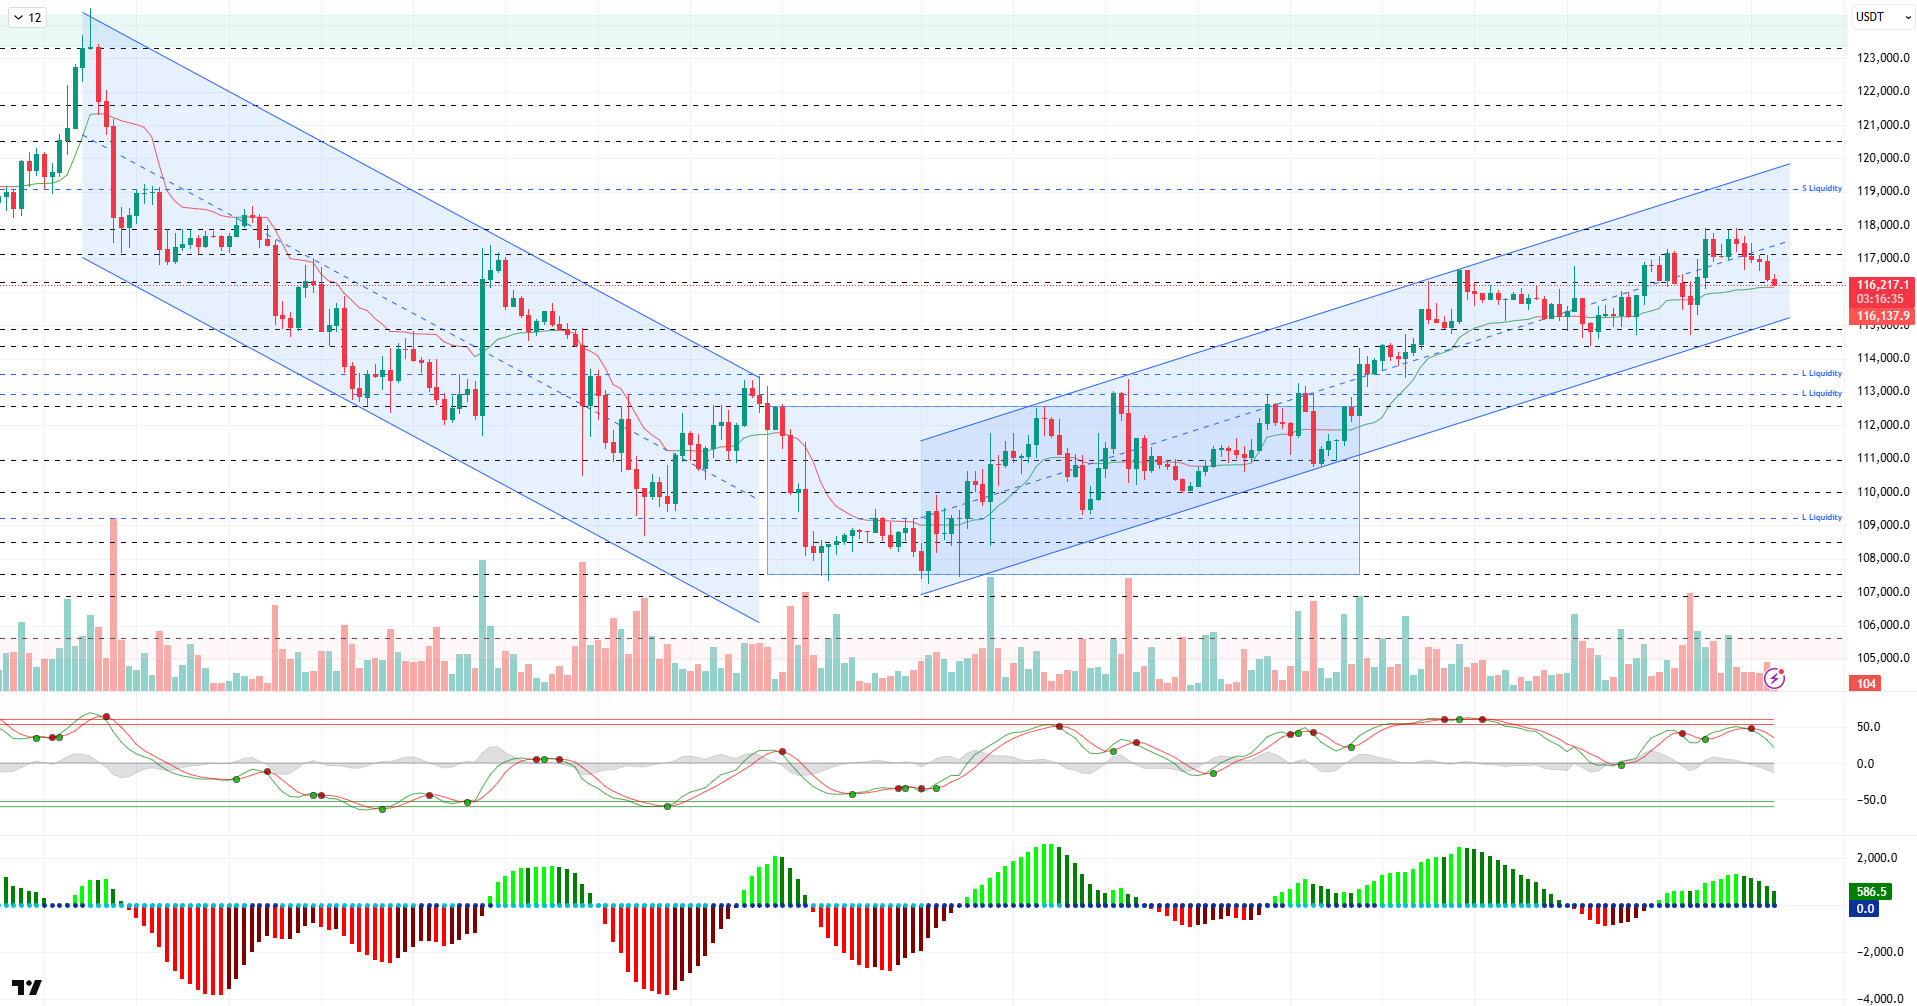
Looking at the technical picture, BTC continues to maintain its bearish outlook despite surpassing the 117,000 level during the day. The price, which has fallen below the middle band of the parallel trend channel, is trading at 116,200, just above the support level of 116,100.
Technical indicators point to a trend reversal, with the Wave Trend oscillator (WT) giving a sell signal in the overbought zone, while hourly charts are moving close to the oversold zone. The Squeeze Momentum (SM) indicator’s histogram is losing momentum in the positive zone. The Kaufman moving average is currently trading below the price at 116,100.
According to liquidity data, short-term sell positions were liquidated in the 117,000 – 117,800 band. The next sell level gained intensity in the 118,500 – 119,000 band. The buy level was partially liquidated at the 116,500 range following yesterday’s spike, and the 116,000 range was also liquidated with the latest decline. The broader buy level continues to accumulate at the 113,000 – 114,000 range.
In summary, the market environment maintains a positive outlook, supported by fundamental developments. Despite the limited response to the interest rate cut, the Fed’s projections continue to support further rate cuts. As we approach October, Bitcoin maintaining its upward stability and the price heading back towards ATH levels may not be a surprise for the market. On the technical side, the price completed its consolidation within the horizontal band it has been in for a long time and tested the 117,800 level accompanied by a minor upward channel. While sell-side transactions were liquidated in liquidity data, liquidations also occurred in the buy-side tiers. For the sustainability of the rise, it is critical for the price to maintain its current upward channel. Closings above the 117,250 level are particularly important for the continuation of the trend. If momentum is gained above this level, the 118,500 – 119,000 liquidity zone could become the target, followed by the 120,000 level. On the other hand, in the event of potential selling pressure, 116,100 is the support level, while 115,000 is the reference point to be monitored. If the price falls below this level, the 113,500 – 113,000 band will be monitored as a strong support and liquidity area.
Supports: 116,100 – 115,000 – 114,000
Resistances: 117,250 – 118,000 – 119,000
ETH/USDT
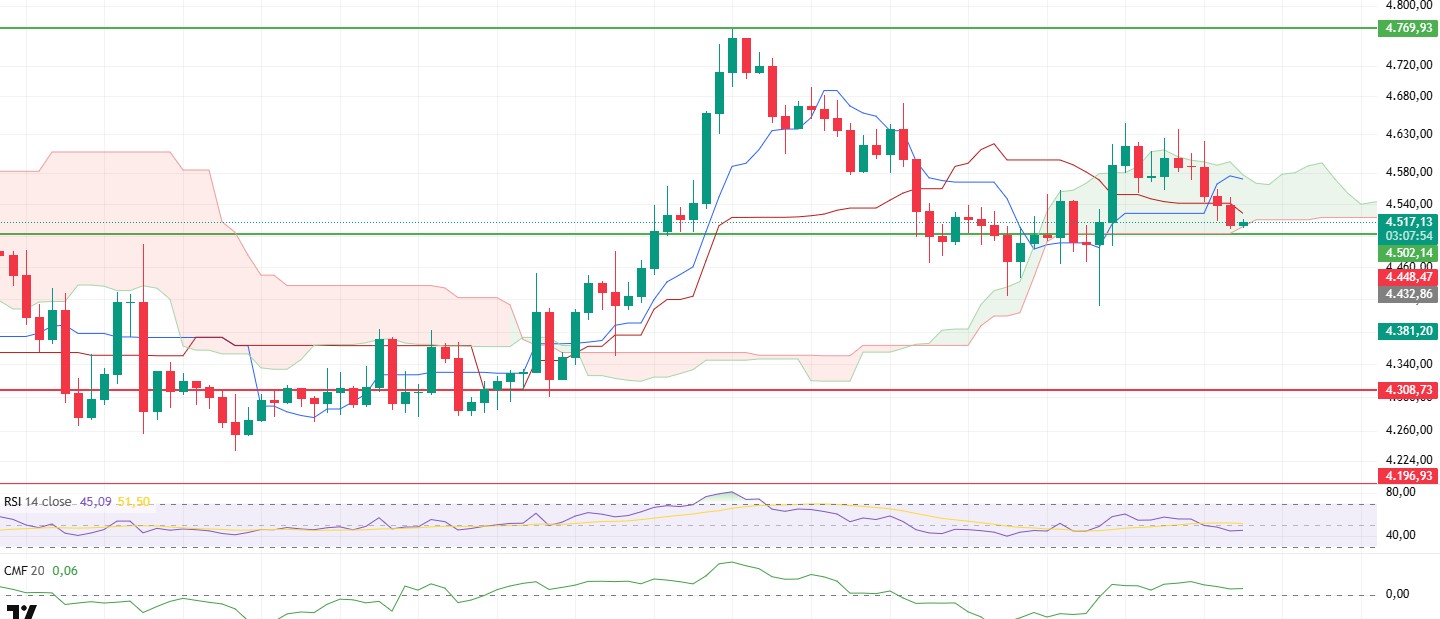
The pullback in the Ethereum price throughout the day continued to the lower band of the kumo cloud at the $4,510 level. This area stands out as a critical support point where the price is trying to stabilize and the market is attempting to determine its direction. The failure of the upward attempts seen especially in the morning hours indicates that selling pressure continued to exert its influence during the day.
Looking at liquidity, the Chaikin Money Flow (CMF) indicator continues to move sideways. This suggests that there is no strong liquidity outflow from the market, but that the decline is primarily driven by short positions opened in futures trading. This indicates that despite the price decline, buyers have not completely withdrawn from the market, and a balanced outlook is maintained in the spot market.
In the Ichimoku indicator, the price continues to hold onto the kumo cloud, and the Tenkan line remains above the Kijun line, supporting the positive outlook for both the short-term and overall trend. This structure shows that buyers have not completely lost control and that even small-volume recoveries could trigger upward momentum again. However, volume growth continues to play a critical role for a strong uptrend.
In the overall outlook, the $4,510 – $4,500 range stands out as an important support zone in the evening hours. If these levels are maintained, the price is likely to rebound towards the upper band of the kumo cloud at $4,590. However, if the support range is lost, selling pressure could intensify, and the price could retreat to lower support levels, particularly the $4,440 level.
Top of Form
Below the Form
Support levels: 4,500 – 4,308 – 4,196
Resistance levels: 4,769 – 4,857 – 5,002
XRP/USDT
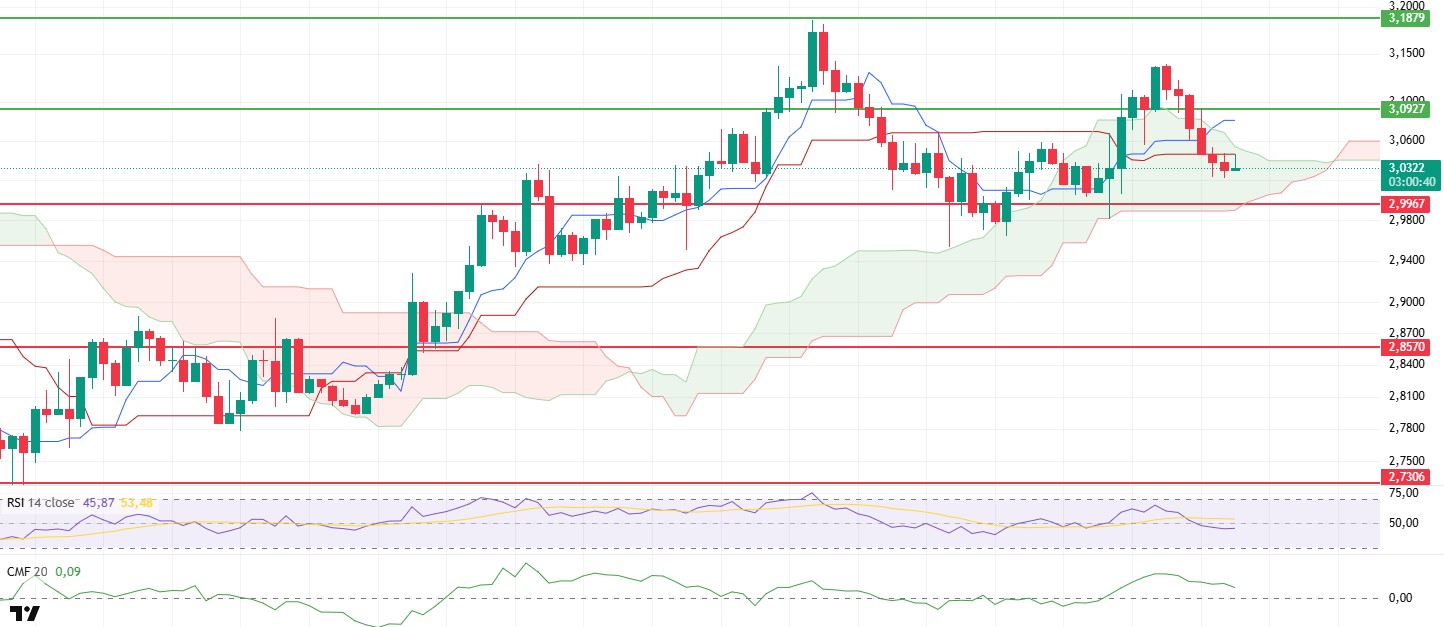
After experiencing a sharp decline in the morning, XRP traded sideways in the $3.03 – $3.04 range for the rest of the day. This movement within a narrow band indicates that buyers and sellers have reached a balance point in the market and that the price is waiting to determine a new direction.
Looking at technical indicators, there was no significant change throughout the day. While the Chaikin Money Flow (CMF) remains in positive territory, it has lost its previous momentum. This picture shows that market entries have not completely ended, but that strong buying appetite has not emerged either. The RSI indicator remains below the 50 level, signaling continued short-term weakness.
In the Ichimoku indicator, the price remains within the cloud boundaries and below the Tenkan and Kijun levels, confirming that XRP is in a decision zone. This outlook reveals that the price needs a new catalyst to determine its direction.
In the overall picture, the critical support level of $2.99 retains its importance. As long as the price remains above this level, rebound rallies towards the $3.09 level may come into play. However, if the $2.99 support is lost, selling pressure may increase, and the risk of the decline continuing towards deeper levels will remain on the table.
Support levels: 2.9967 – 2.8570 – 2.7306
Resistance levels: 3.0927 – 3.1879 – 3.3058
SOL/USDT
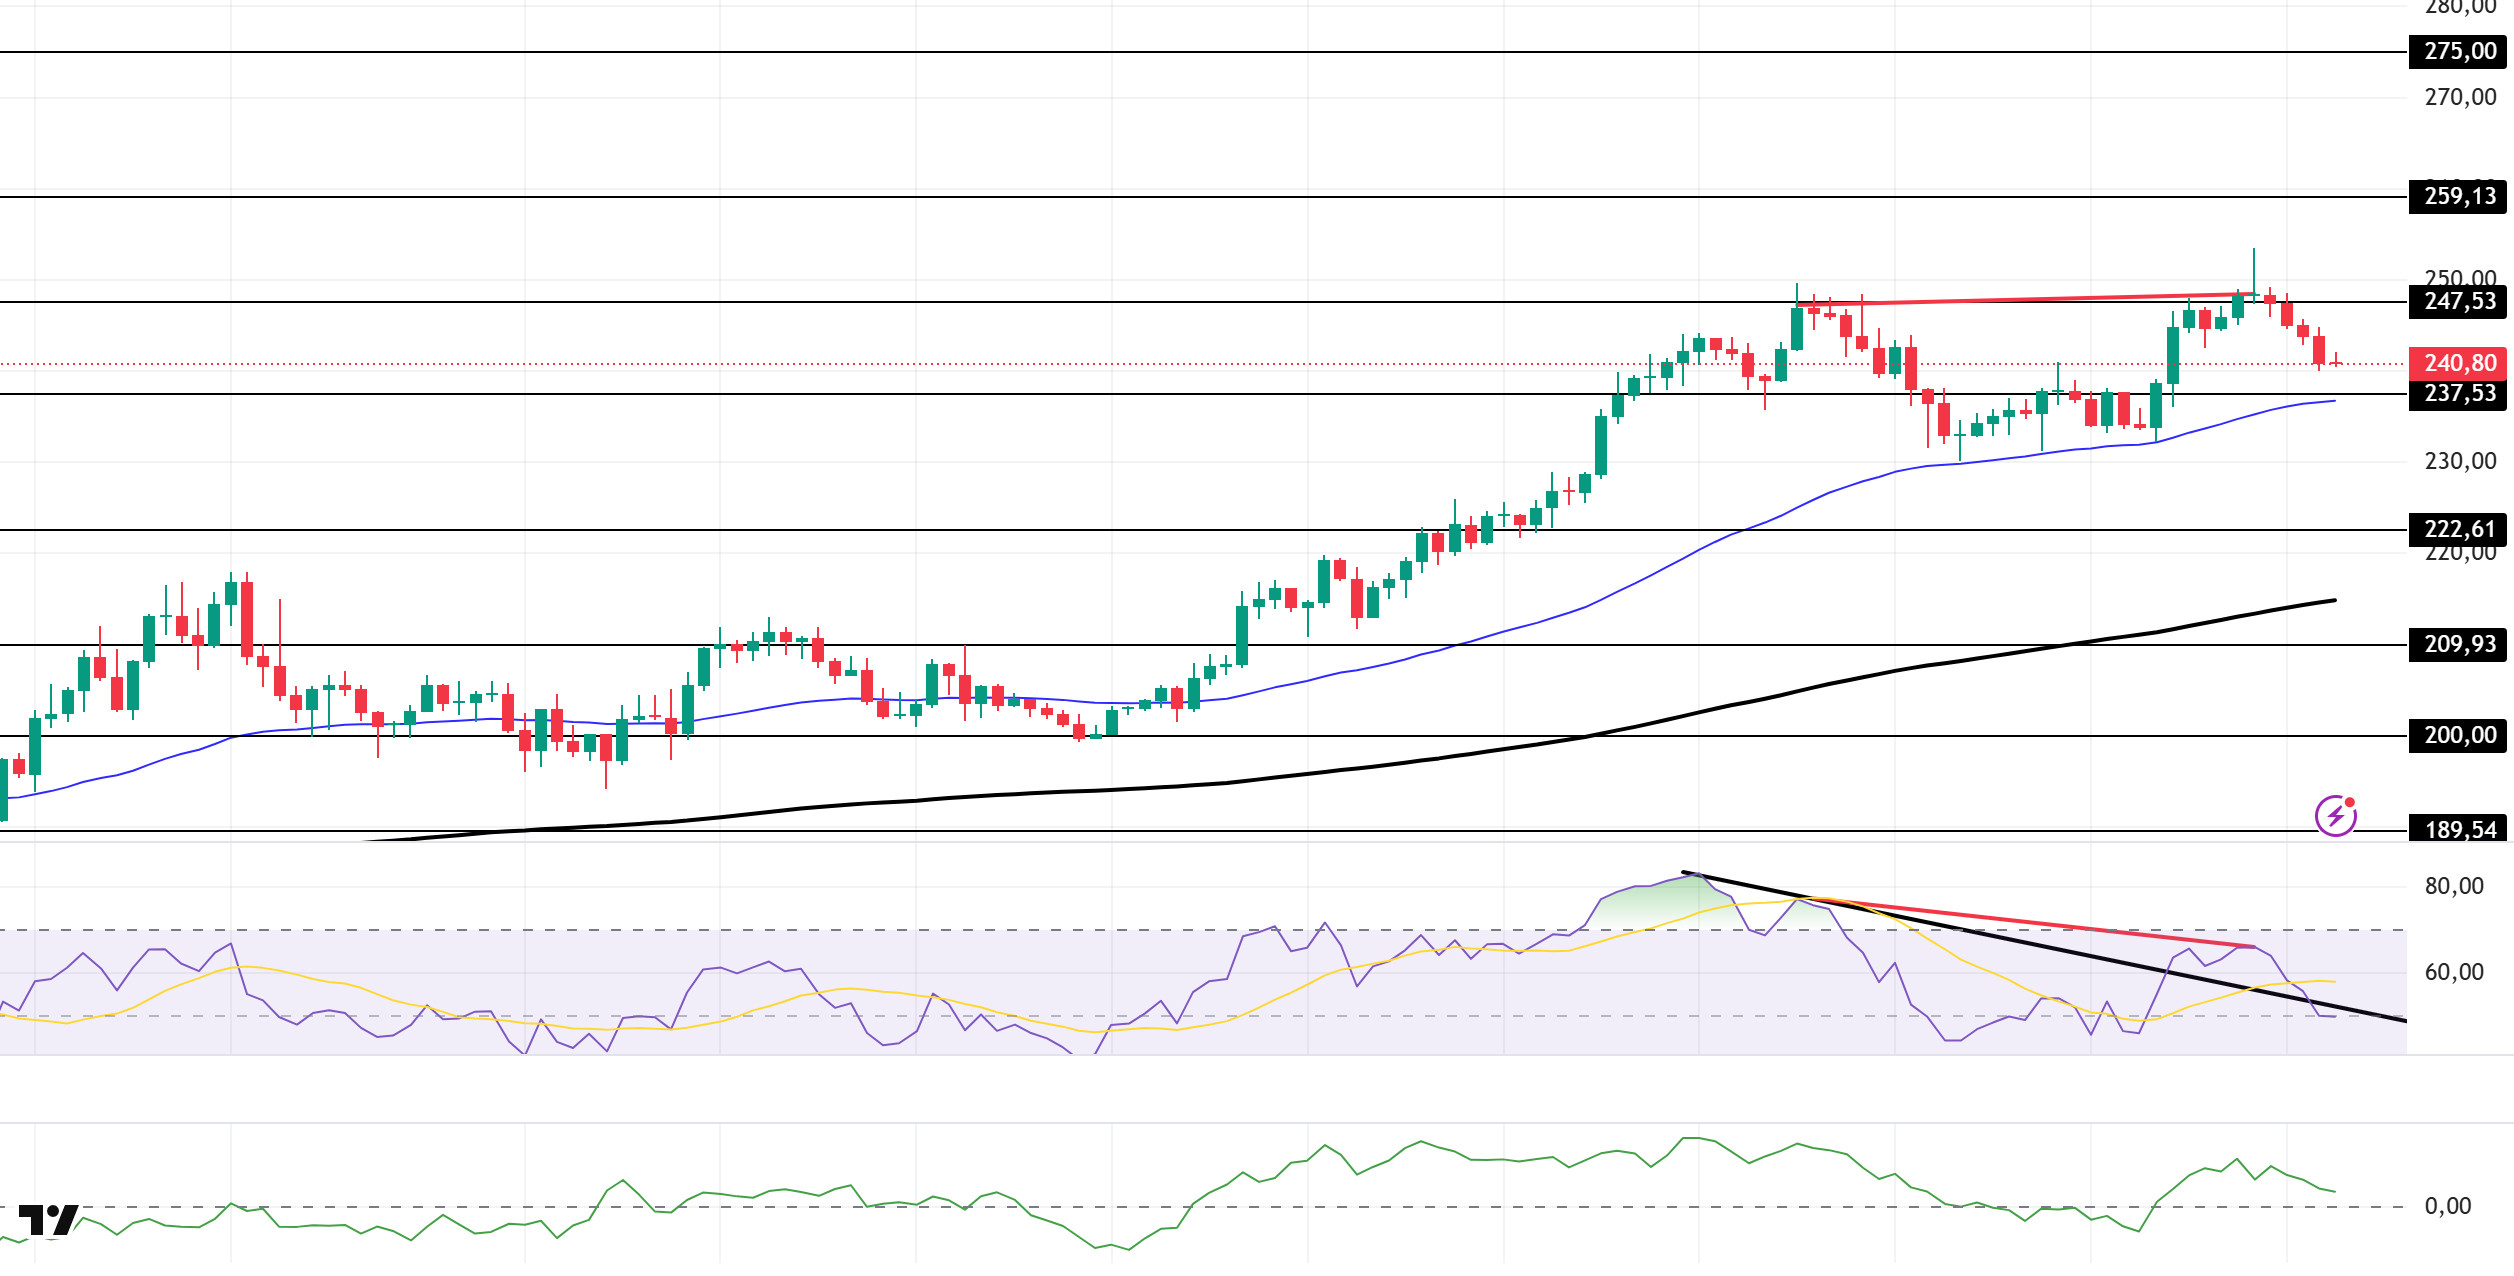
The SOL price experienced a pullback during the day. The asset continues to trade above the strong resistance level of $237.53. The price tested the strong resistance level of $247.53 but failed to break through, resulting in a pullback. If the pullback continues, the $237.53 level or the 50 EMA (Exponential Moving Average – Blue Line) moving average can be monitored.
On the 4-hour chart, it continues to remain above the 50 EMA (Exponential Moving Average – Blue Line) and 200 EMA (Black Line). This indicates that the upward trend may continue in the medium term. At the same time, the price being above both moving averages shows us that the market is trending upward in the short term. The large difference between the two moving averages indicates that the asset may be in a sideways or downward trend. Chaikin Money Flow (CMF-20) remained in positive territory. However, a decrease in cash inflows could push the CMF into negative territory. The Relative Strength Index (RSI-14) fell back to neutral levels. At the same time, it began to trade below the downtrend that started on September 12, signaling selling pressure. However, negative divergence could deepen pullbacks. If there is an uptrend due to macroeconomic data or positive news related to the Solana ecosystem, the $259.13 level stands out as a strong resistance point. If this level is broken upwards, the uptrend is expected to continue. If pullbacks occur due to developments in the opposite direction or profit-taking, the $237.53 level could be tested. A decline to these support levels could increase buying momentum, presenting a potential upside opportunity.
Supports: 237.53 – 222.61 – 209.93
Resistances: 247.53 – 259.13 – 275.00
DOGE/USDT
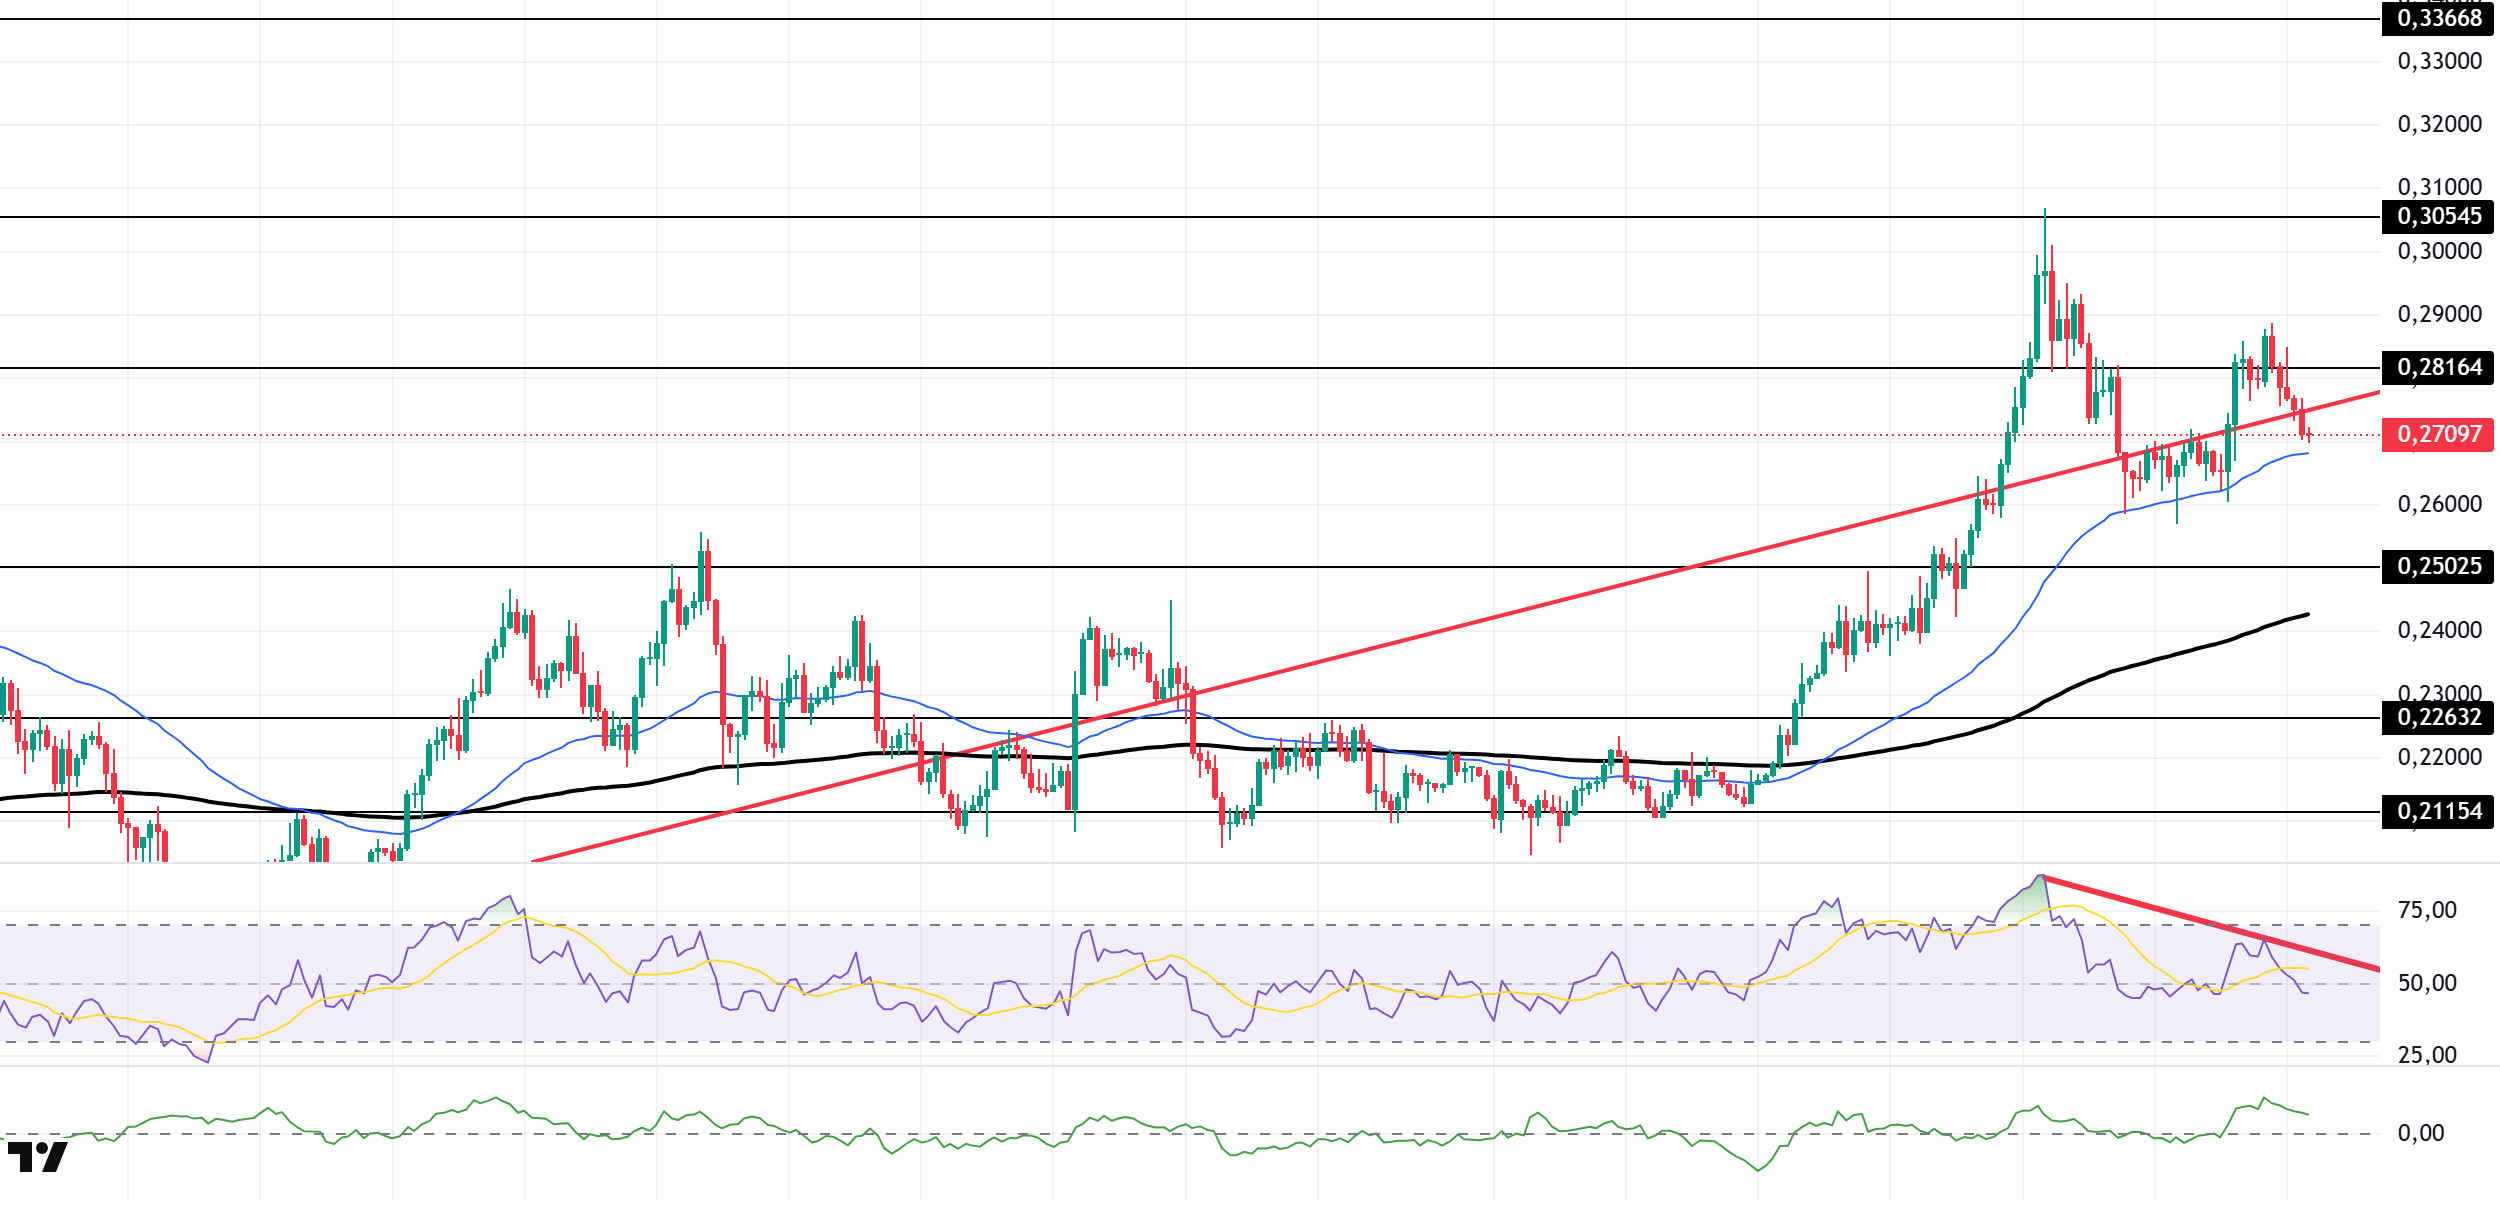
The DOGE price lost value during the day. The asset tested the strong resistance level of $0.28164 but retreated, moving into the lower region of the upward trend that began on August 3. Currently, the price is preparing to test the 50 EMA (Exponential Moving Average – Blue Line) as support. If it closes below the moving average, it could deepen the pullback and test the $0.25025 level. In the event of a potential rise, the $0.30545 level should be monitored as resistance.
On the 4-hour chart, the 50 EMA (Exponential Moving Average – Blue Line) remained above the 200 EMA (Black Line). This indicates that the medium-term upward trend is continuing. The price being above both moving averages indicates that the upward trend is strong in the short term. A large difference between the two moving averages may cause the asset to pull back or move sideways. Chaikin Money Flow (CMF-20) continues to be in positive territory. Additionally, a decrease in money inflows could push CMF into negative territory. The Relative Strength Index (RSI-14) has moved into negative territory and continues to remain in the lower region of the downtrend that began on September 13, signaling continued selling pressure. In the event of potential upward movements driven by political developments, macroeconomic data, or positive news flow within the DOGE ecosystem, the $0.30545 level stands out as a strong resistance zone. Conversely, in the event of negative news flow, the $0.25025 level could be triggered. A decline to these levels could increase momentum and initiate a new wave of growth.
Supports: $0.25025 – $0.22632 – $0.21154
Resistances: 0.28164 – 0.30545 – 0.33668
AVAX/USDT
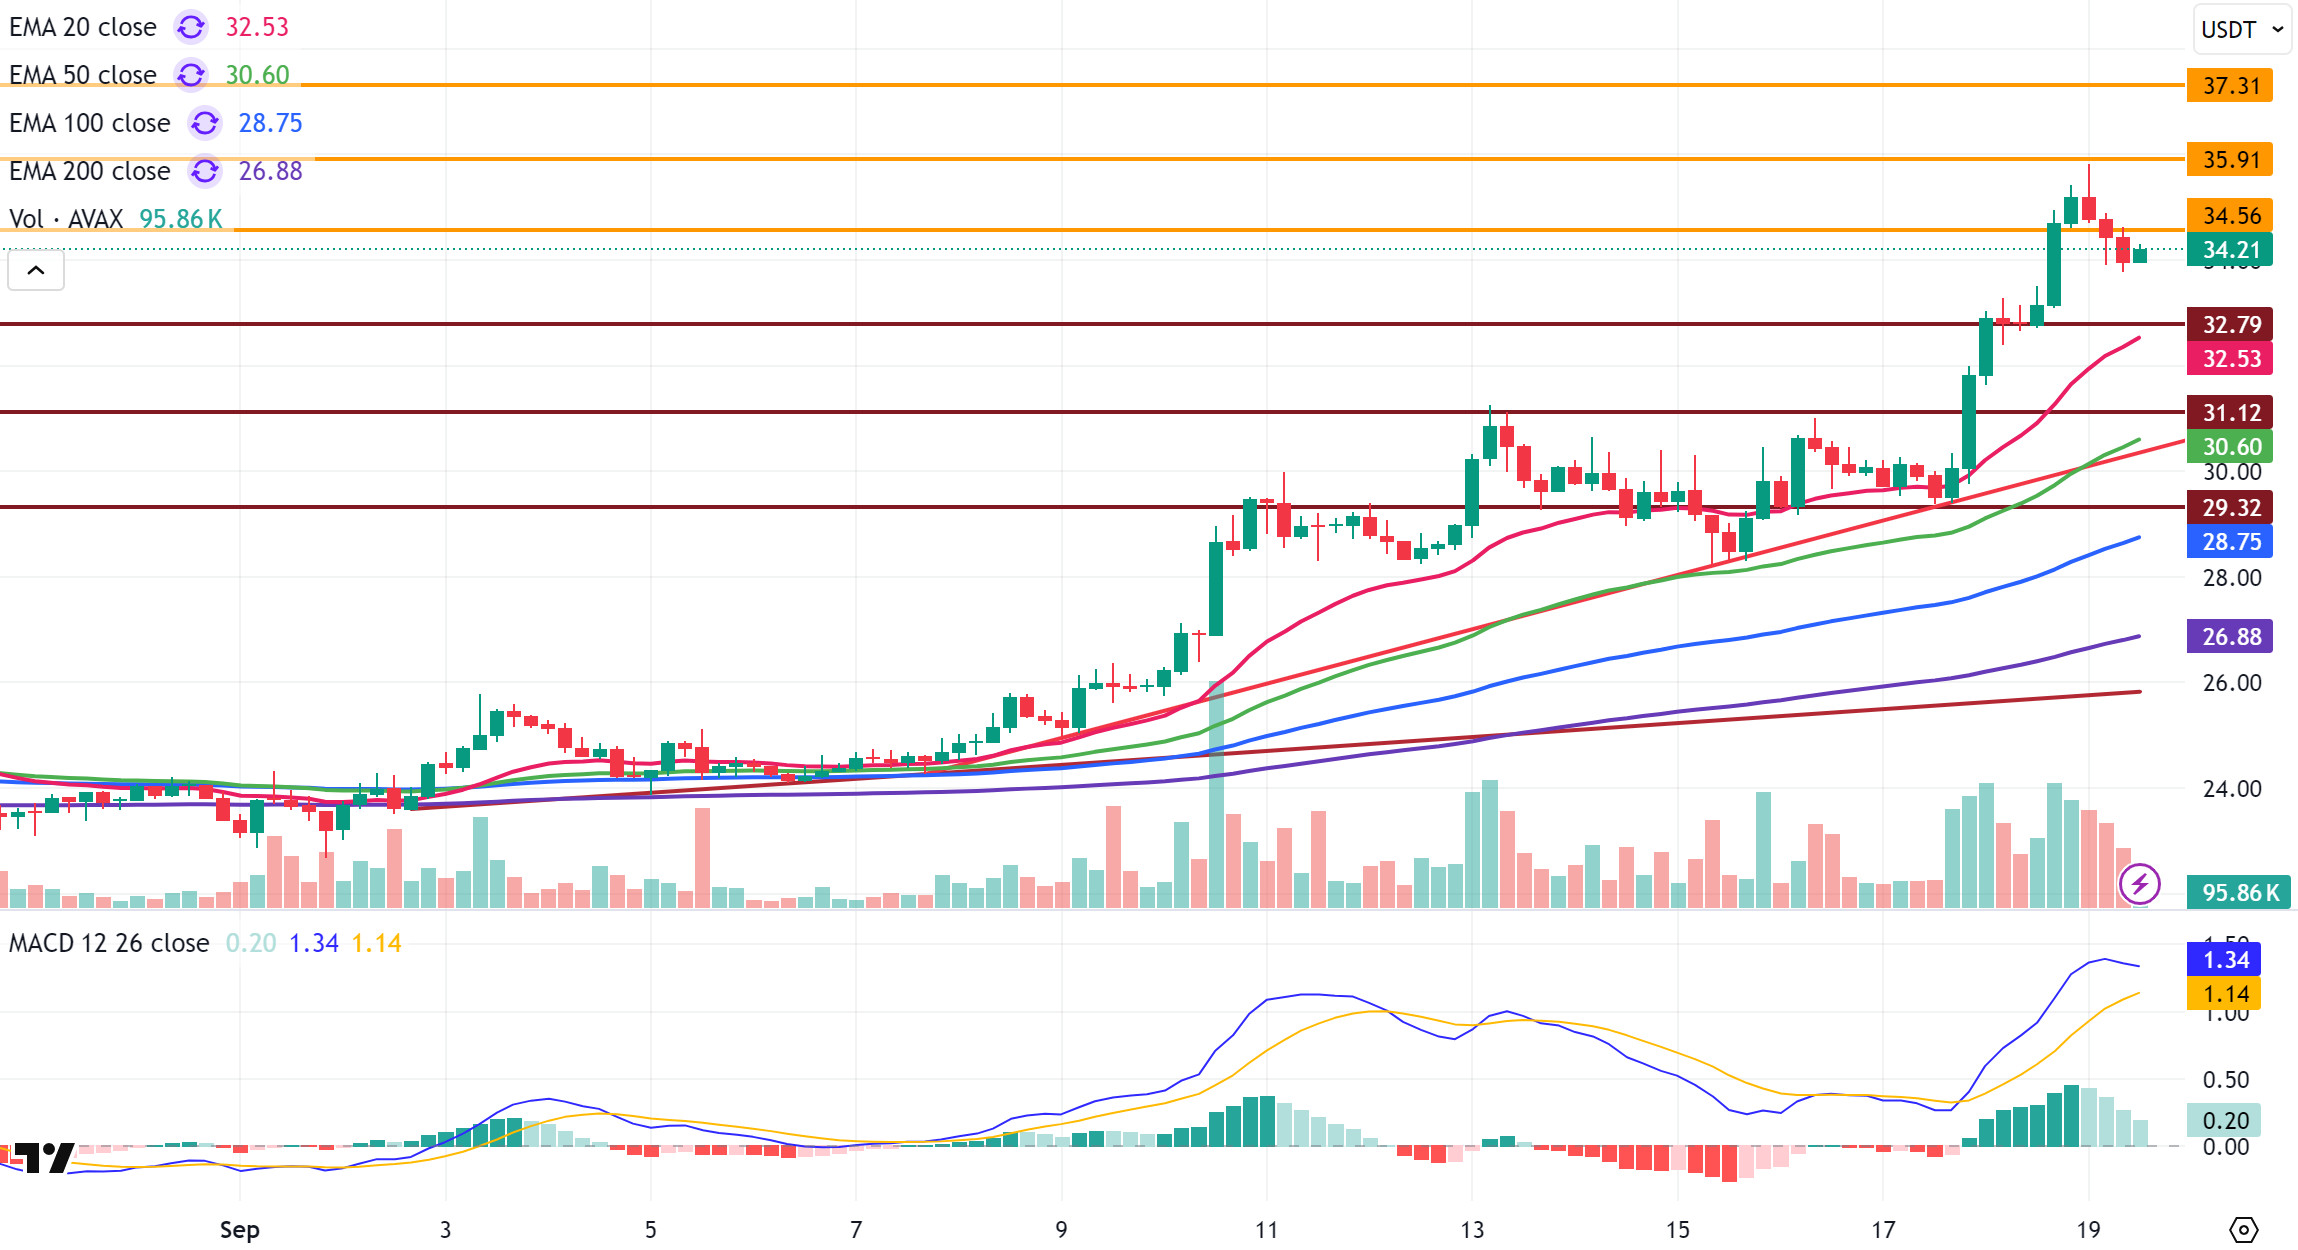
AVAX started the day at $35.19, then lost 3.3% of its value due to selling pressure during the day, falling to the $34 level. Throughout the day, volatility remained high for AVAX, with selling accelerating particularly after the $34.56 support level was broken. Testing the $34.56 level to break it upward at the new candle opening, AVAX failed to hold above this level and experienced another decline.
Although the Moving Average Convergence/Divergence (MACD) line is still above the signal line on the 4-hour chart, it has started to show a downward trend as momentum weakens. If the MACD line crosses below the signal line, this could cause the decline to deepen. Although this presents a negative technical outlook, AVAX remaining above critical Exponential Moving Average (EMA) levels keeps the possibility of renewed positive momentum alive.
In the short term, the $34.56 resistance level stands out as a critical threshold. If it manages to stay above this level, AVAX could rise towards the first target of $35.91 and then the $37.31 resistance levels. In the opposite scenario, with selling pressure continuing, AVAX could first retreat to the $32.79 support level and then to the $31.12 support level. In the overall outlook, although AVAX remains above critical support levels, it has not been able to establish a clear direction due to weakening momentum. Strong buying and confirmation of positive momentum are critical for it to resume its upward trend.
(EMA20: Pink Line, EMA50: Green Line, EMA100: Blue Line, EMA200: Purple Line)
Supports: 32.79 – 31.12 – 29.32
Resistances: 34.56 – 35.91 – 37.31
BNB/USDT
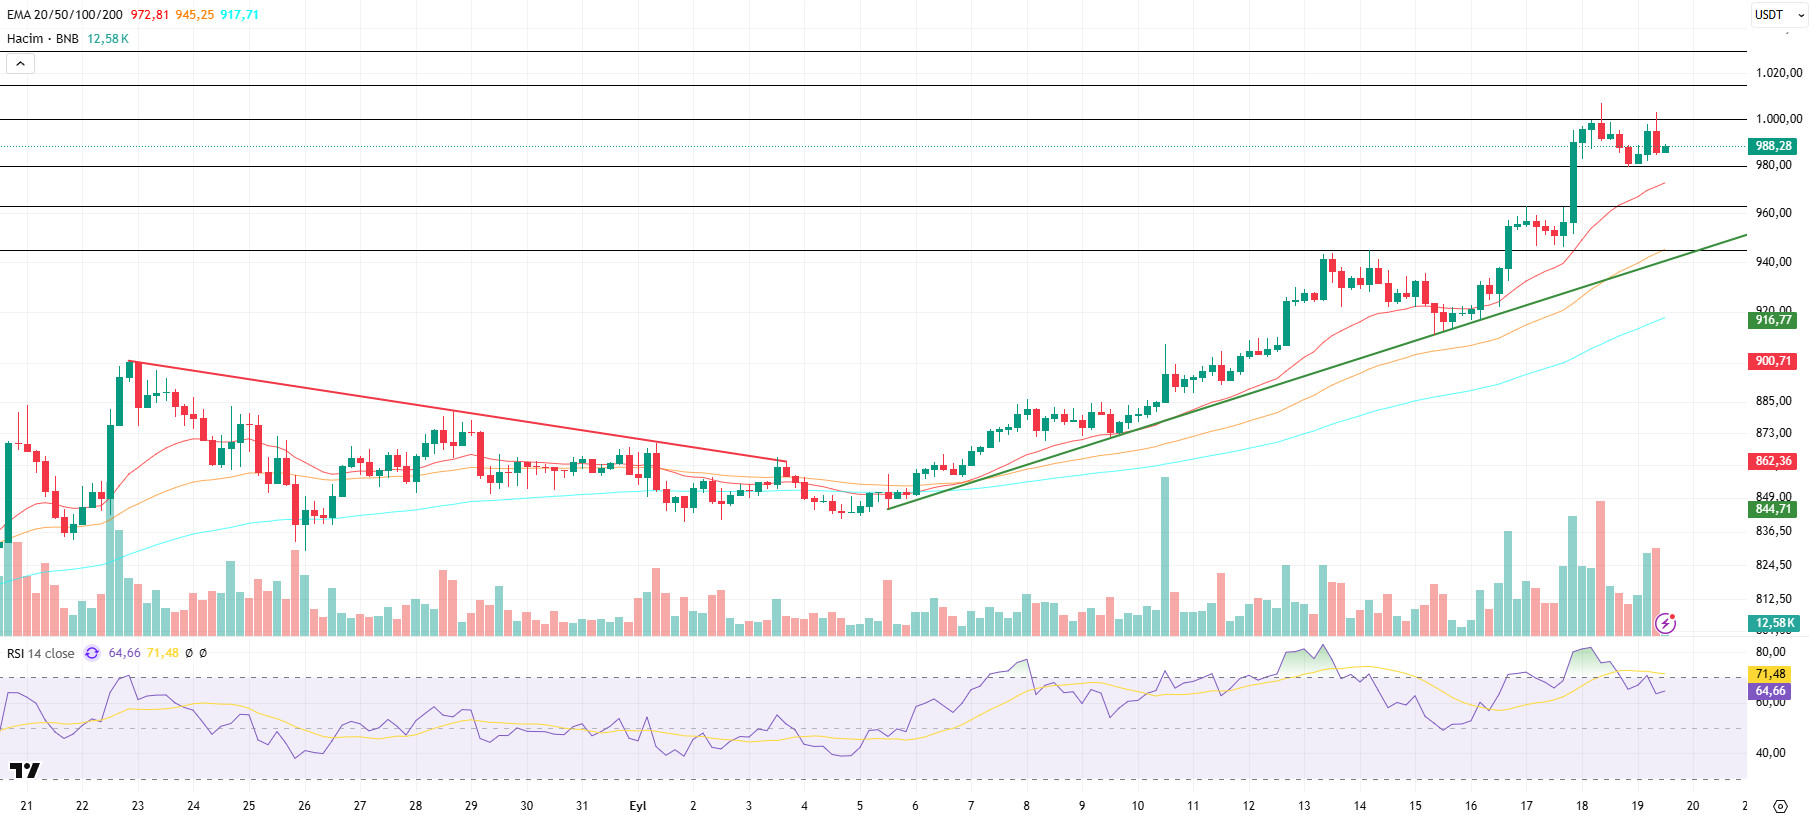
Midweek, BNB recorded new historic highs, demonstrating strong growth influenced by developments on the fundamental side. In this context, BNB surpassed the psychological $1,000 level, recording an All Time High (ATH) of $1,006. Although a price correction down to $980 was observed from this level, BNB has maintained its positive momentum based on the newly opened candle.
From a technical perspective, BNB/USDT entered an uptrend with strong support at the $840 level and accelerated its positive momentum with the contribution of fundamental developments, setting a new ATH level of $1,006.
Technical indicators for BNB/USDT, currently trading in the $980–1,000 range, show that the recent increase in trading volume has contributed to the upward momentum. Furthermore, the Relative Strength Index (RSI) rose above the 70 level with the recent increases; however, it turned downward with the price correction. Nevertheless, the RSI is still hovering near these levels, indicating that there is limited room for correction in the asset.
Based on the current technical picture, if buying appetite is maintained, BNB is expected to retest the psychological resistance level of $1,000 in the first stage. If this level is broken, the price could potentially move towards the $1,015 and $1,030 levels. On the other hand, if selling pressure increases, the price is likely to fall back to the $980 support level. If this level is broken downwards, the price is expected to retreat to the $965 and $945 levels, respectively.
Supports: 980 – 965 – 945
Resistances: 1000 – 1015 – 1030
Legal Notice
The investment information, comments, and recommendations contained herein do not constitute investment advice. Investment advisory services are provided individually by authorized institutions taking into account the risk and return preferences of individuals. The comments and recommendations contained herein are of a general nature. These recommendations may not be suitable for your financial situation and risk and return preferences. Therefore, making an investment decision based solely on the information contained herein may not produce results in line with your expectations.

