
Technical Analysis
BTC/USDT
US President Donald Trump and Elon Musk briefly met at the Charlie Kirk memorial service. Trump and Chinese President Xi Jinping agreed to meet again at the APEC summit in South Korea on October 31. Trump announced a $100,000 fee for H-1B visas and unveiled the “Trump Gold Card” program. As the risk of a government shutdown in the US on October 1 looms, the Bank of Japan announced an annual ETF sales plan worth 660 billion yen. The UK, Canada, Australia, and Portugal announced they recognize Palestine as a state. Japan’s publicly traded Metaplanet Inc. purchased an additional 5,419 BTC, bringing its total reserves to 25,555 BTC. France-based Capital B purchased 551 BTC with a €54.7 million capital increase, raising its holdings to 2,800 BTC.
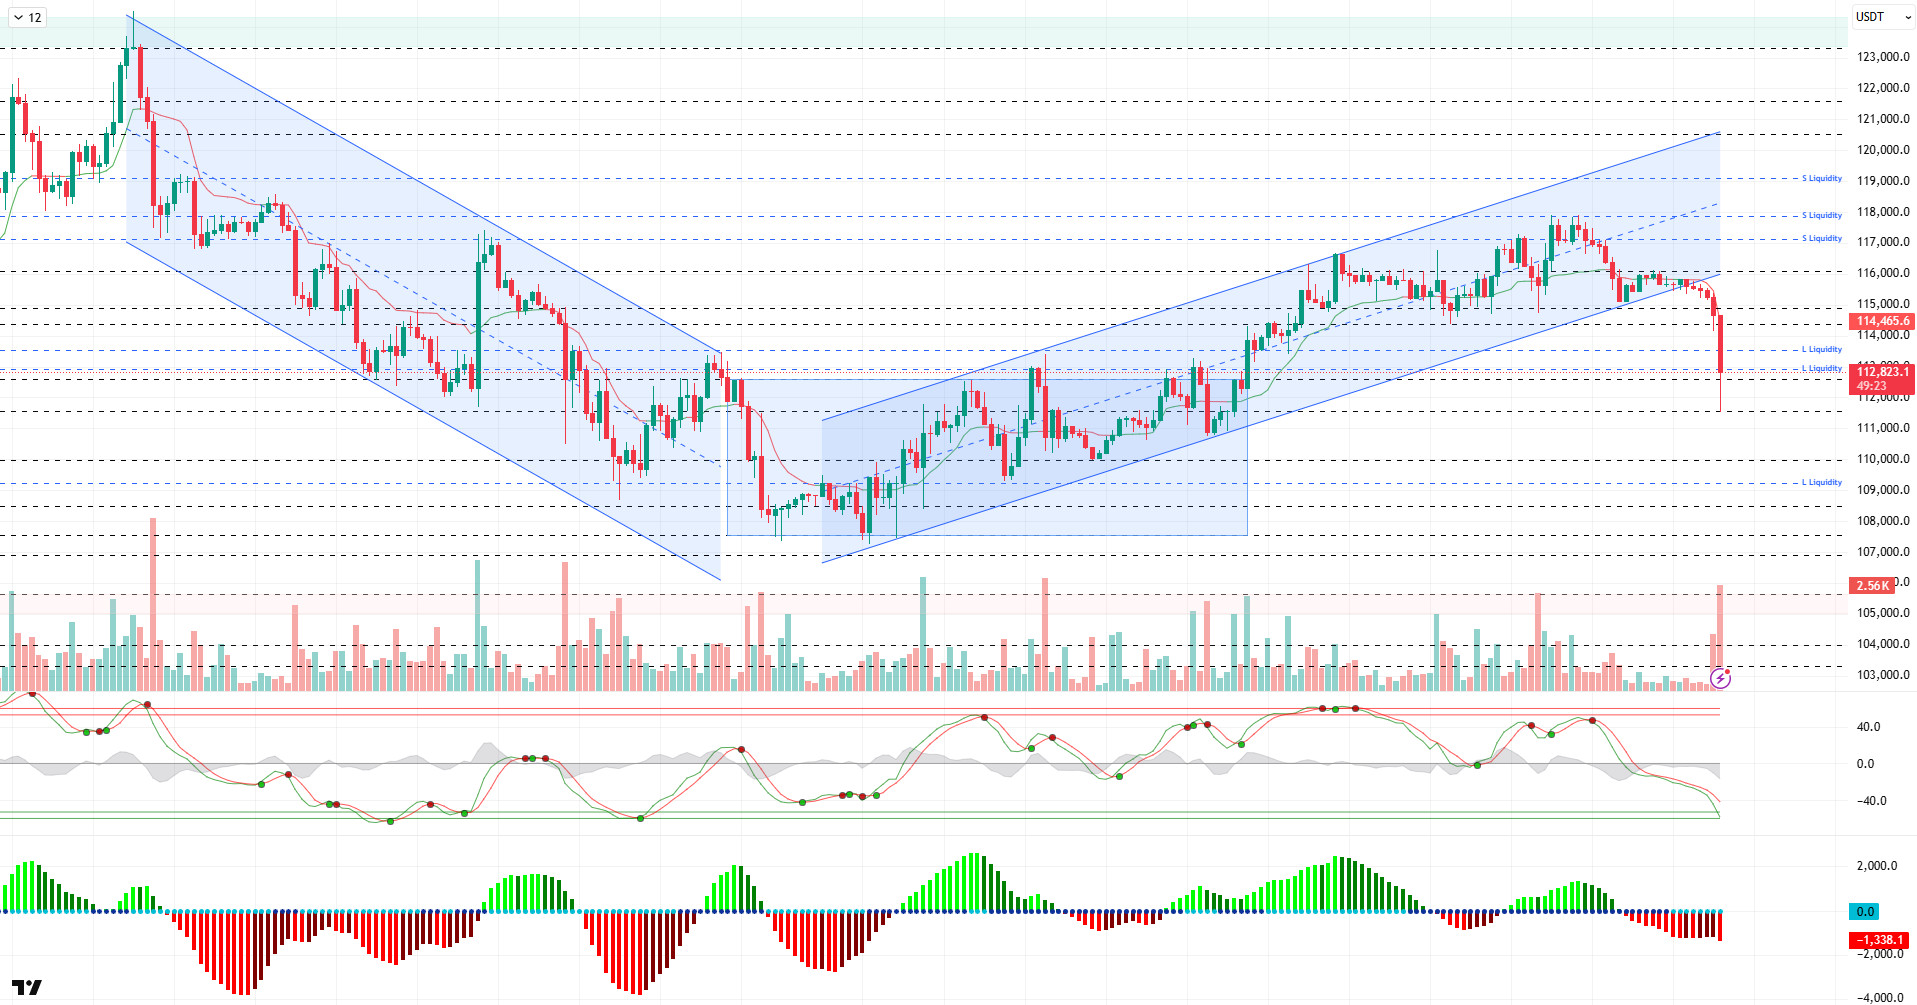
Looking at the technical picture, BTC, which moved within the 115,000 – 116,000 band over the weekend, felt selling pressure last night and fell back to the critical reference and trend lower band point of 115,000. Then, this morning, with increased selling pressure, the 115,000 support level was broken with high volume, and the price fell to 111,400. After that, BTC experienced some recovery, and while volatile movements continue, the price is trading at 112,900.
Technical indicators show that the Wave Trend oscillator (WT) has moved into the oversold zone after giving a sell signal in the overbought zone following the trend reversal. The Squeeze Momentum (SM) indicator shows weakening within the negative histogram area, while the Kaufman moving average is currently trading above the price at the 114,500 level.
According to liquidity data, the recent decline resulted in a total of $1.03 billion in liquidations from buy-side transactions in the crypto markets. Among these liquidations, BTC ranked second after ETH with $212 million. Looking at the buy levels, the 113,000–114,000 band stood out as an accumulation zone, while the 112,800 level drew attention as a strong concentration point. On the other hand, a significant increase is observed in the selling tiers after the decline. On this side, the 116,800 level is a short-term accumulation zone, while the 118,000–119,000 band stands out as an important liquidity area in a broader time frame.
In summary, while there is no clear fundamental catalyst for recent sales, selling pressure from futures trading appears to have deepened the decline. Although there are no new developments to change the positive picture in the market, developments later in the day will be an important reference point for whether the price’s fragile structure will continue. On the technical side, the upward structure has been broken with the price falling below the 115,000 reference level of the upward channel. Liquidity data continues to determine the direction of the market: with the recent decline, buy orders have been cleared, while a significant increase in sell orders stands out. In this context, for the price to recover, it must first regain the 114,000 level, followed by closes above 115,000. This scenario could prevent a negative outlook. However, if selling pressure persists and the 112,600 level is broken, the next important support level to watch will be 111,500.
Supports 112,600 – 111,400 – 110,000
Resistances , 114,000 – 115,000 – 116,100
ETH/USDT
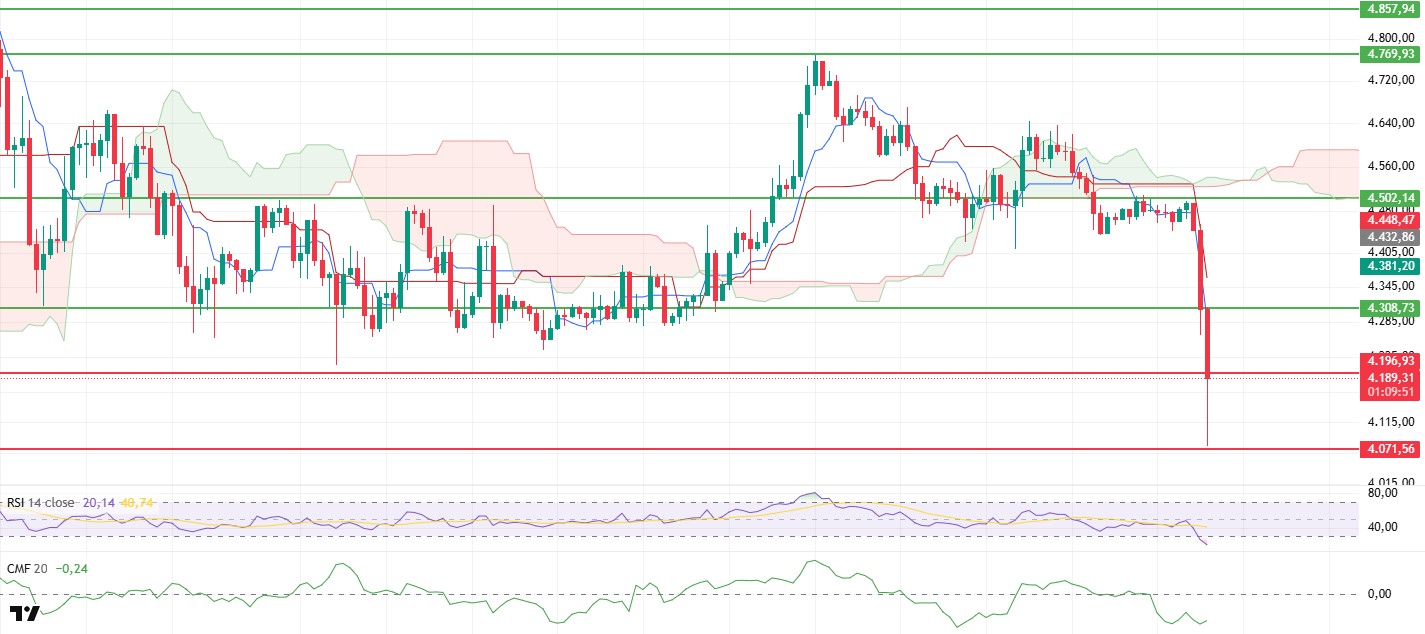
Although the Ethereum price attempted to rise above the $4,500 level over the weekend, it was pushed back by selling pressure in this region. Particularly affected by increased heavy selling on Sunday, the price first broke the important support point at the $4,308 level and then deepened its decline, falling back to the support zone at the $4,071 level. Buyers stepped in at this level, causing the price to reverse its direction upward, and as a result of rebound buying, it recovered to the $4,196 level.
Technical indicators reveal that this sharp decline has had a significant impact on the market. The Chaikin Money Flow (CMF) indicator’s retreat into negative territory signals strong liquidity outflows and persistent selling pressure. This scenario reflects buyers’ recent loss of momentum and their short-term withdrawal from the market.
In the Ichimoku indicator, the price falling below the kumo cloud and the Tenkan and Kijun levels also being lost confirms that the short-term trend is now downward from a technical perspective. Additionally, the downward turn in the slope of the kumo cloud indicates that a change in direction has occurred in the market and that the downward trend may continue.
On the other hand, the Relative Strength Index (RSI) entering the oversold zone raises the possibility of a short-term reversal at these levels. The RSI’s movement in this zone provides the first signs that rebound rallies could gain strength following the decline.
As a result, if the Ethereum price remains below the $4,196 level during the day, the likelihood of a pullback towards the $4,071 level appears quite high. However, if the price manages to hold above $4,196, the upward movement could gain momentum with the support of the reversal signal in the RSI, and the $4,308 level could be regained in a short time. From this perspective, the $4,196 level remains a critical threshold for intraday pricing.
Top of Form
Below the Form
Support levels: 4,196 – 4,071 – 3,940
Resistance levels: 4,308 – 4,502 – 4,769
XRP/USDT
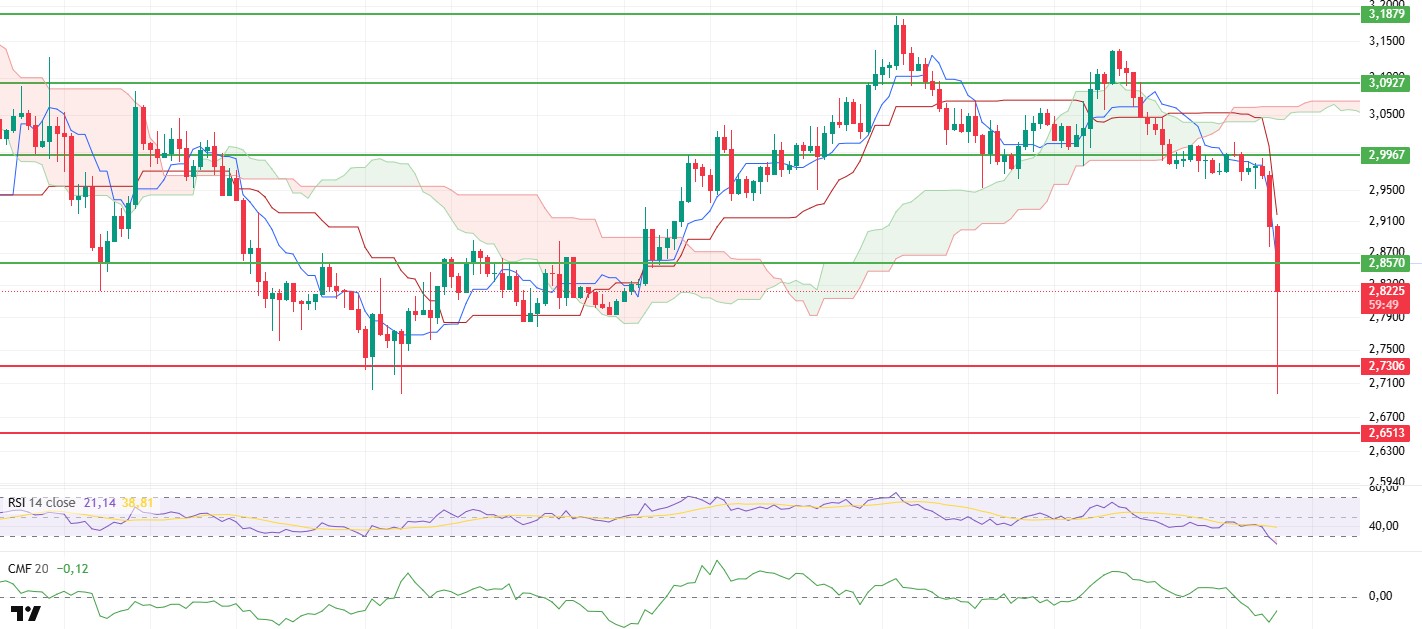
After losing the critically important $2.99 support level on Friday, the XRP price moved sideways around this level throughout the weekend. However, due to the increasing selling pressure in the cryptocurrency market in general, the price experienced a sharp pullback, falling to the $2.69 level. At this point, buyers stepped in, triggering rebound buying, and the price recovered to the $2.82 level.
Upon examining the indicators, it is noteworthy that the Chaikin Money Flow (CMF) indicator has fallen sharply into negative territory, indicating significant liquidity outflows from the market. Although a limited recovery was observed afterward, this movement has not produced a strong signal that selling pressure has weakened. Therefore, it can be said that market inflows remain weak.
In the Ichimoku indicator, the price remaining below the Tenkan and Kijun levels, as well as the Kumo cloud, confirms that the short-term trend has clearly turned negative. This outlook indicates that selling pressure remains strong and upward movements may be limited for now.
As a result, if the price regains the $2.85 level during the day, a new rapid advance towards the $2.99 level is possible. However, if the price remains below the $2.85 level, selling pressure may intensify, causing the price to retreat back towards the $2.69 level. Therefore, the $2.85 level should be monitored as a critical threshold for the intraday outlook.
Support levels: 2.7306 – 2.6513 – 2.4730
Resistance levels: 2.8570 – 2.9967 – 3.0927
SOL/USDT
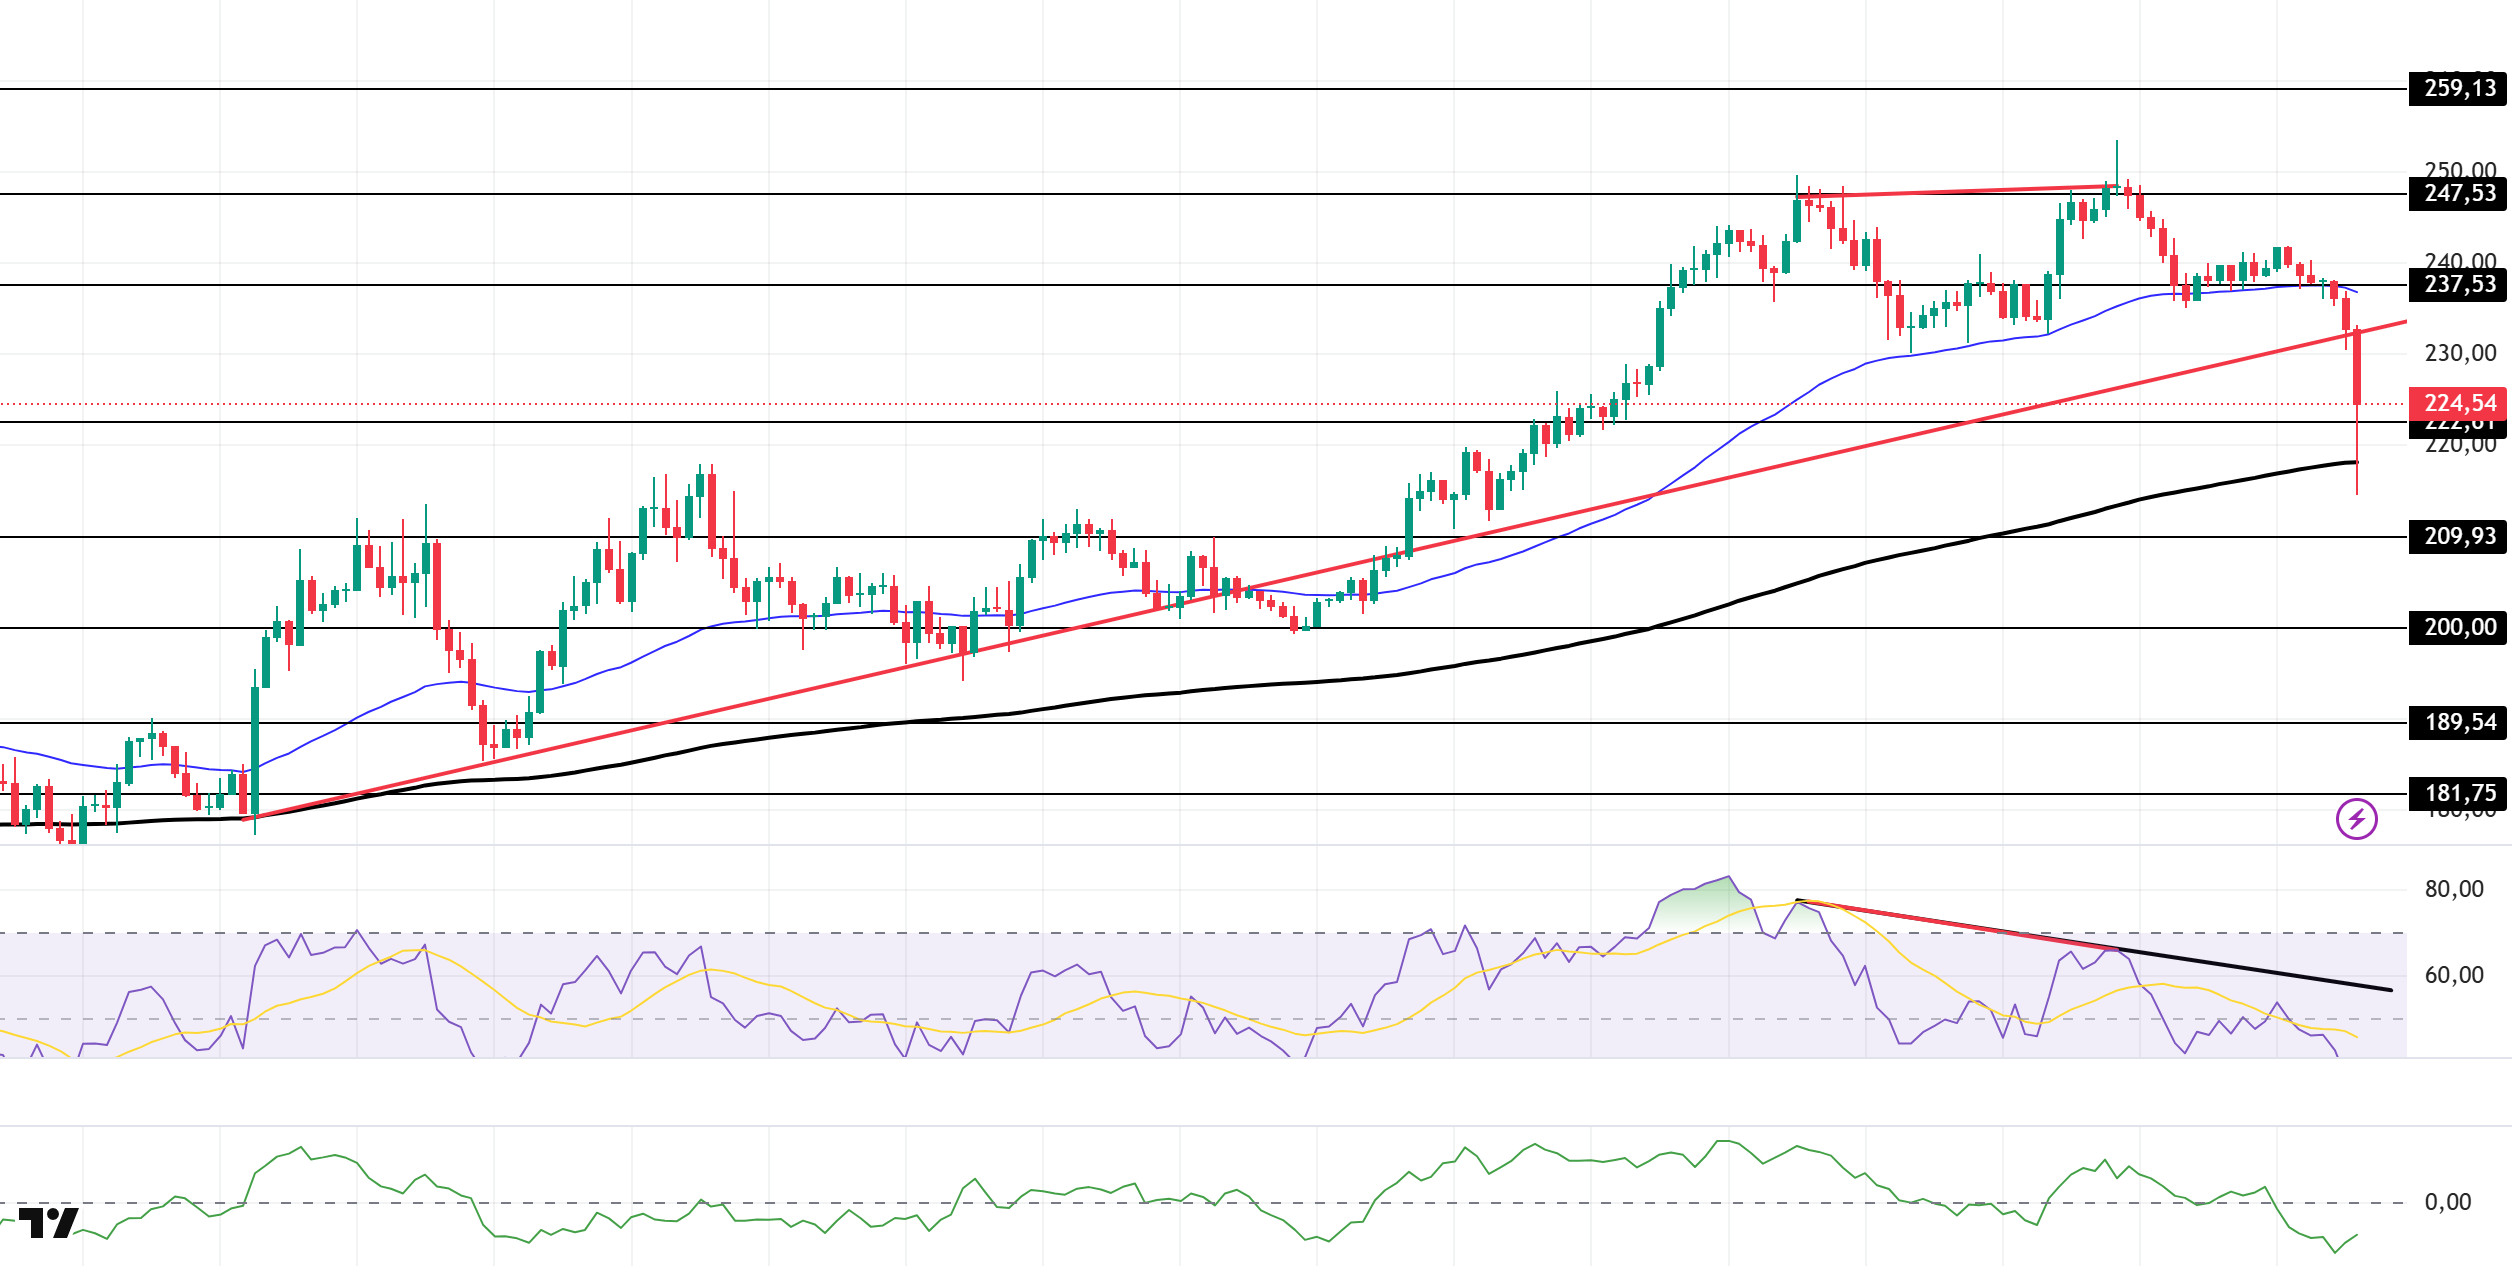
SOL experienced a price pullback. The asset deepened its decline by breaking below the strong support level of $237.53 and the 50 EMA (Exponential Moving Average – Blue Line) moving average. As of now, it is testing the upward trend that began on August 22 as support. This trend could test the $222.61 level as support in six consecutive candle closes. If the upward movement begins, it could test the $237.53 level as resistance.
On the 4-hour chart, it remained above the 50 EMA (Exponential Moving Average – Blue Line) and 200 EMA (Black Line). This indicates that the medium-term upward trend may continue. At the same time, the price being above both moving averages shows us that the market is trending upward in the short term. The large difference between the two moving averages indicates that the asset may continue its sideways or downward trend. Chaikin Money Flow (CMF-20) has started to move into negative territory. Furthermore, a decrease in cash inflows could push the CMF deeper into negative territory. The Relative Strength Index (RSI-14) has fallen into the oversold zone. This may cause slight corrections. At the same time, it continued to remain below the downward trend that began on September 14, indicating that selling pressure continues. However, the negative divergence triggered pullbacks. If there is an upturn due to macroeconomic data or positive news related to the Solana ecosystem, the $247.53 level stands out as a strong resistance point. If this level is broken upwards, the uptrend is expected to continue. If pullbacks occur due to developments in the opposite direction or profit-taking, the $222.61 level could be tested. A decline to these support levels could increase buying momentum, presenting a potential opportunity for an upward move.
Supports: 222.61 – 209.93 – 200.00
Resistances: 237.53 – 247.53 – 259.13
DOGE/USDT
Grayscale has filed to convert the Dogecoin Trust into an ETF.
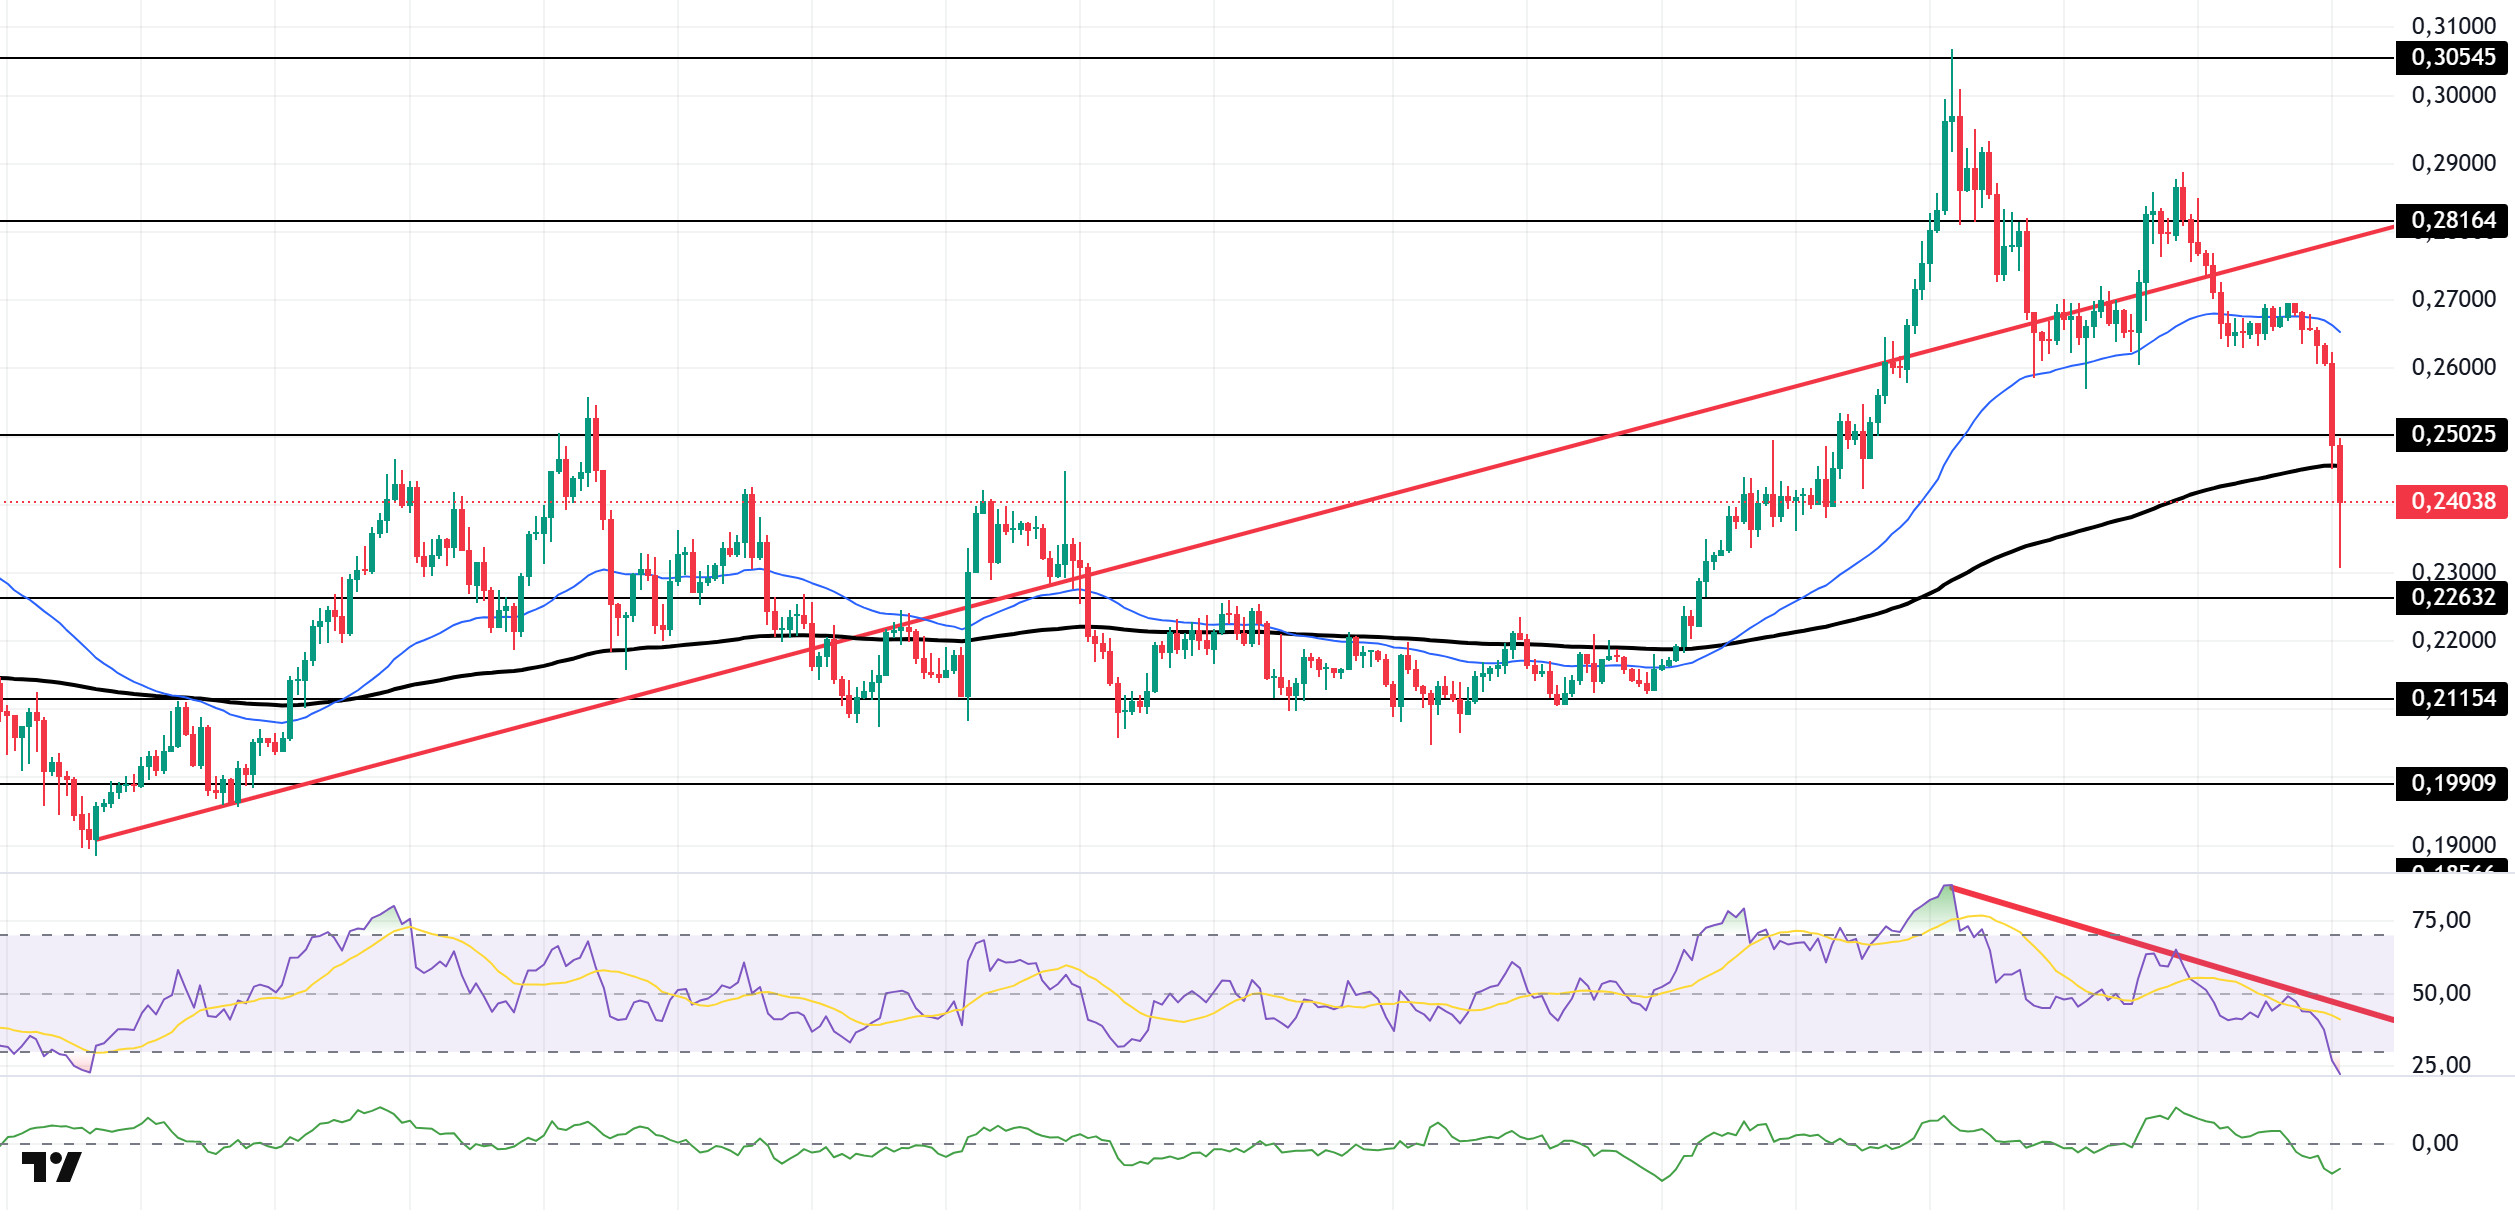
The DOGE price has declined. The asset tested the strong resistance level of $0.28164 but retreated, moving below the rising trend line that began on August 3 and the lower region of the 50 EMA (Exponential Moving Average – Blue Line). It is currently testing the 200 EMA moving average as support. If it closes below the 200 EMA moving average, it could test the $0.22632 level. In the event of a potential rise, the $0.28164 resistance level should be monitored.
On the 4-hour chart, the 50 EMA (Exponential Moving Average – Blue Line) remained above the 200 EMA (Black Line). This indicates that the medium-term upward trend continues. The price being between the two moving averages shows that the price is in a decision phase in the short term. The Chaikin Money Flow (CMF-20) has started to move into negative territory. Additionally, a decrease in money inflows could push the CMF deeper into negative territory. The Relative Strength Index (RSI-14) has moved into oversold territory. This could trigger an upward correction. At the same time, it continues to be in the lower region of the downtrend that began on September 13, indicating that selling pressure continues. In the event of an upturn due to political developments, macroeconomic data, or positive news flow in the DOGE ecosystem, the $0.28164 level stands out as a strong resistance zone. Conversely, in the event of negative news flow, the $0.22632 level could be triggered. A decline to these levels could increase momentum and initiate a new wave of growth.
Supports: $0.22632 – $0.21154 – $0.19909
Resistances: 0.25025 – 0.28164 – 0.30545
TRX/USDT
As of September 21, 2025, the total amount of TRX staked is 44,581,839,843, which is 47.09% of the circulating supply. Compared to the previous day, there has been a decrease of approximately 0.01% in the amount staked. However, the TRX market cap is $32.4 billion.
Additionally, a total of 2,518,686 TRX was burned yesterday, and a net 1,397,026 TRX was added to the circulating supply. This development is leading to increased inflationary pressure on Tron.
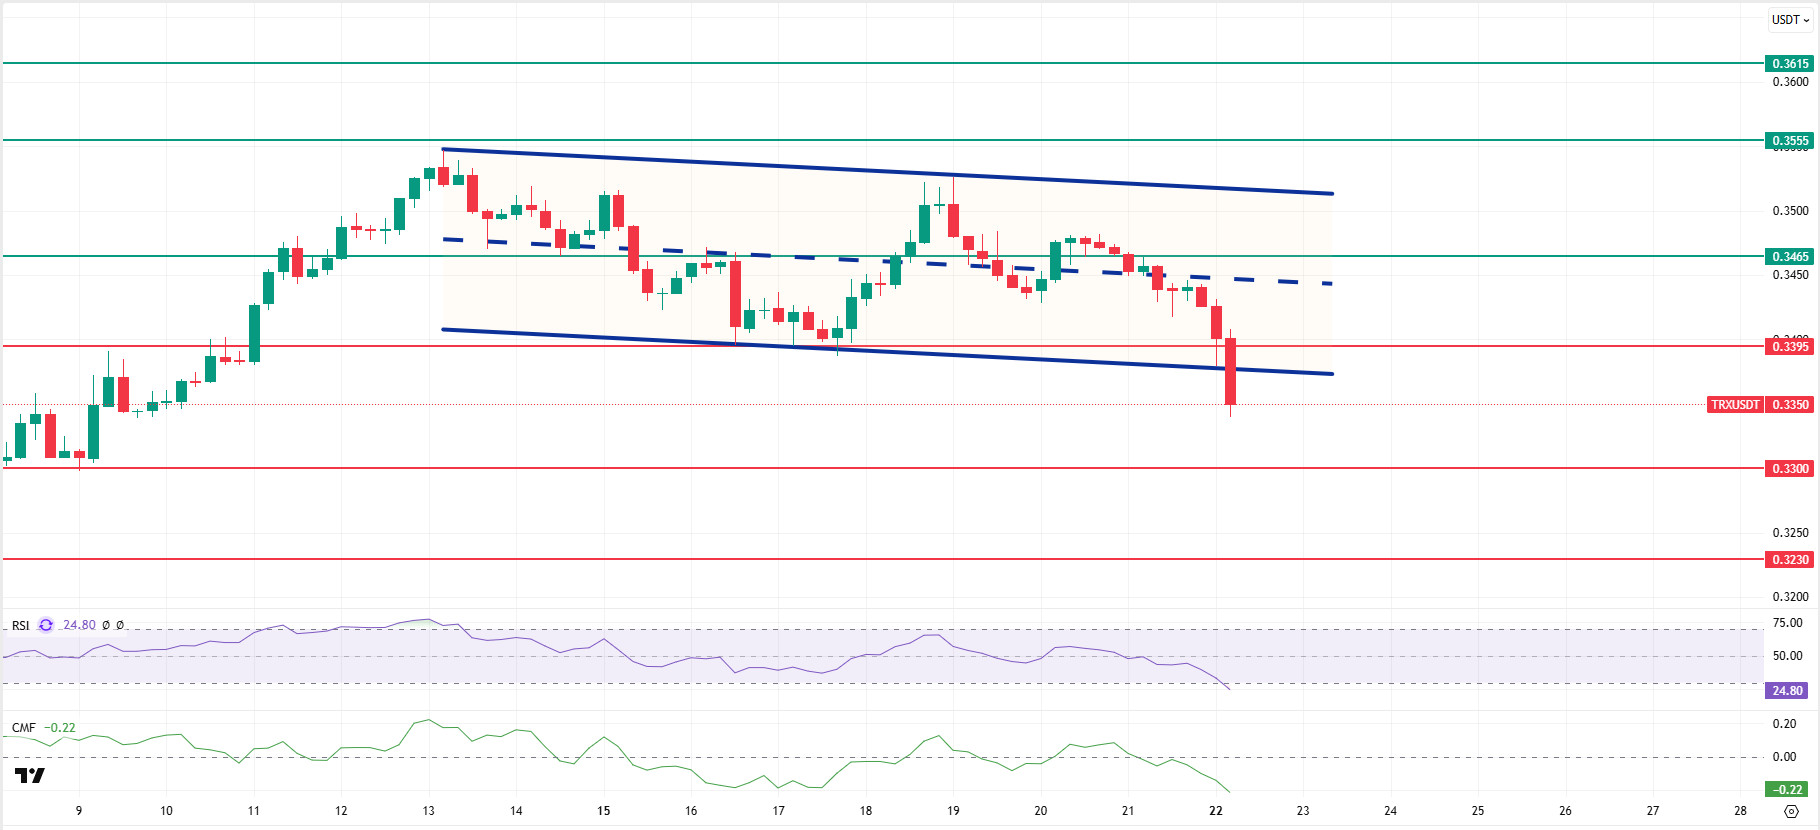
Technically speaking, TRX closed yesterday at 0.3426 following the decline and has fallen further this morning, currently trading at 0.3350. TRX is currently attempting to break below the lower band of the bearish channel and is priced just below the 0.3395 support level on the 4-hour chart. The Relative Strength Index (RSI) value is 24, indicating an oversold region. In addition, the Chaikin Money Flow (CMF) indicator is -0.22, below zero, indicating a decrease in cash inflows. This situation signals that buyer pressure in the market is weakening and that selling movements may gain short-term strength.
In light of all these indicators, TRX may test the 0.3300 support level by falling slightly in the first half of the day, given its current zone and RSI value. A candle close below this support could extend the decline, potentially testing the 0.3230 resistance level. If it fails to close below the 0.3395 support level and the CMF indicator also moves into positive territory, it may rise slightly with potential new buying interest and test the 0.3465 resistance level.
On the 4-hour chart, 0.3230 is an important support level, and as long as it remains above this level, the upward momentum is expected to continue. If this support is broken, selling pressure may increase.
Supports: 0.3395 – 0.3300 – 0.3230
Resistances: 0.3465 – 0.3555 – 0.3615
Legal Notice
The investment information, comments, and recommendations contained herein do not constitute investment advice. Investment advisory services are provided individually by authorized institutions taking into account the risk and return preferences of individuals. The comments and recommendations contained herein are of a general nature. These recommendations may not be suitable for your financial situation and risk and return preferences. Therefore, making an investment decision based solely on the information contained herein may not produce results in line with your expectations.


