
September 22-29, 2025 – Darkex Weekly Technical Analysis Report
BTC/USDT
Last week saw significant developments in the crypto markets. At its September meeting, the Fed cut its policy rate by 25 basis points to a range of 4%–4.25%. The decision was passed by a vote of 11 to 1, with Stephen Miran dissenting and favoring a 50 bp cut. In Madrid, the US and China reached a principle agreement on TikTok; meanwhile, China’s SAMR deepened its anti-monopoly investigation into NVIDIA. During a phone call between Trump and Xi Jinping, critical topics were discussed, with Trump stating that Europe must stop Russian oil imports to resolve the Ukraine war. The US Congress discussed a plan for a strategic reserve of 1 million BTC, while the US and UK decided to cooperate on crypto regulations. On the corporate front, Strategy, Japan-based Remixpoint, Bitcoin Treasury, and Metaplanet continued their Bitcoin purchases.
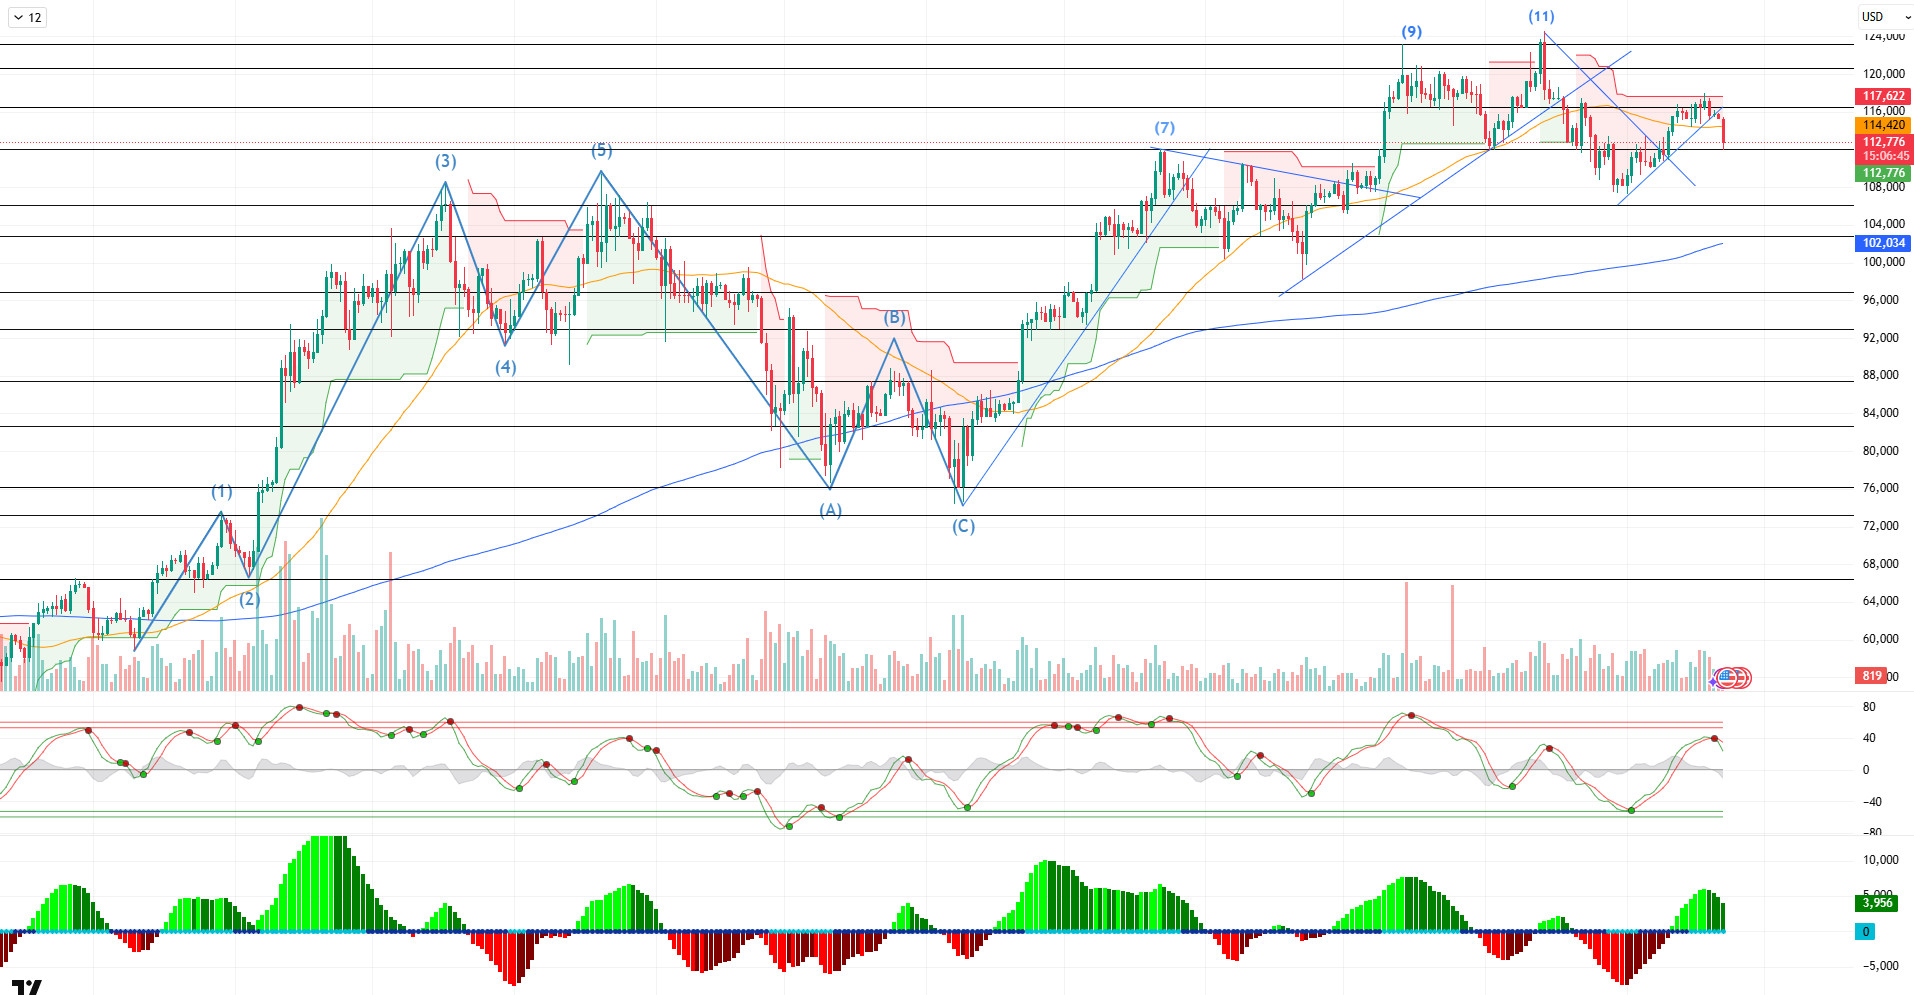
Looking at the daily technical outlook following all these developments, it appears that BTC failed to attempt a new peak after reaching the 11th point peak with its golden cross formation. Facing selling pressure from the 117,800 level, BTC tried to gain momentum in an upward direction throughout the week but, as of today, lost its 115,000 support and fell to the 111,400 level. BTC, which started the week at the 115,000 level, continues to trade at the 112,700 level with a 2.28% loss in value.
Looking at technical indicators, the Wave Trend (WT) oscillator confirmed the trend reversal with its sell signal in the overbought zone on the daily chart. While the Squeeze Momentum (SM) indicator lost its momentum within the positive zone, the golden cross pattern continues on the moving averages as the 50-day SMA crosses above the 200-day SMA.
When examining weekly liquidity data, the 112,500 – 113,000 band stood out as an area of high liquidity for buy-side transactions. However, with the recent downward movement, the accumulation formed in this band has been completely cleared. On the selling side, the 118,000 level stands out as a notable point of intensity. Above this, the next significant selling level is clearly defined at 119,000.
In summary, when fundamental developments are evaluated, the Fed’s interest rate cut and expectations for continued rate cuts at upcoming meetings, the Bitcoin reserve strategy, the resolution of tensions between Trump and China through compromise, and institutional purchases created a positive environment for the market. These factors broke the negative cyclical movement in September, triggering a cyclical movement again with the recent decline as the month neared its close, and selling pressure came to the fore. On the technical side, the price completed its long-standing consolidation in the horizontal band and tested the 117,800 level along with the minor upward channel. However, liquidity data emerged as a factor disrupting the picture. Supported by the fundamental and technical outlook, buy-side transactions created intense accumulation, and BTC cleared its liquidity areas with the latest decline. Going forward, whether the price can regain the 115,000 level will be a critical reference point to monitor, and staying above this level will be decisive for the uptrend to gain momentum. On the other hand, if selling pressure deepens, the 110,000 level emerges as a critical threshold for maintaining a positive position. If this level is lost, a deeper correction in BTC can be expected.
Supports: 113,000 – 110,000 – 106,300
Resistances: 115,000 – 116,600 – 120,500
ETH/USDT
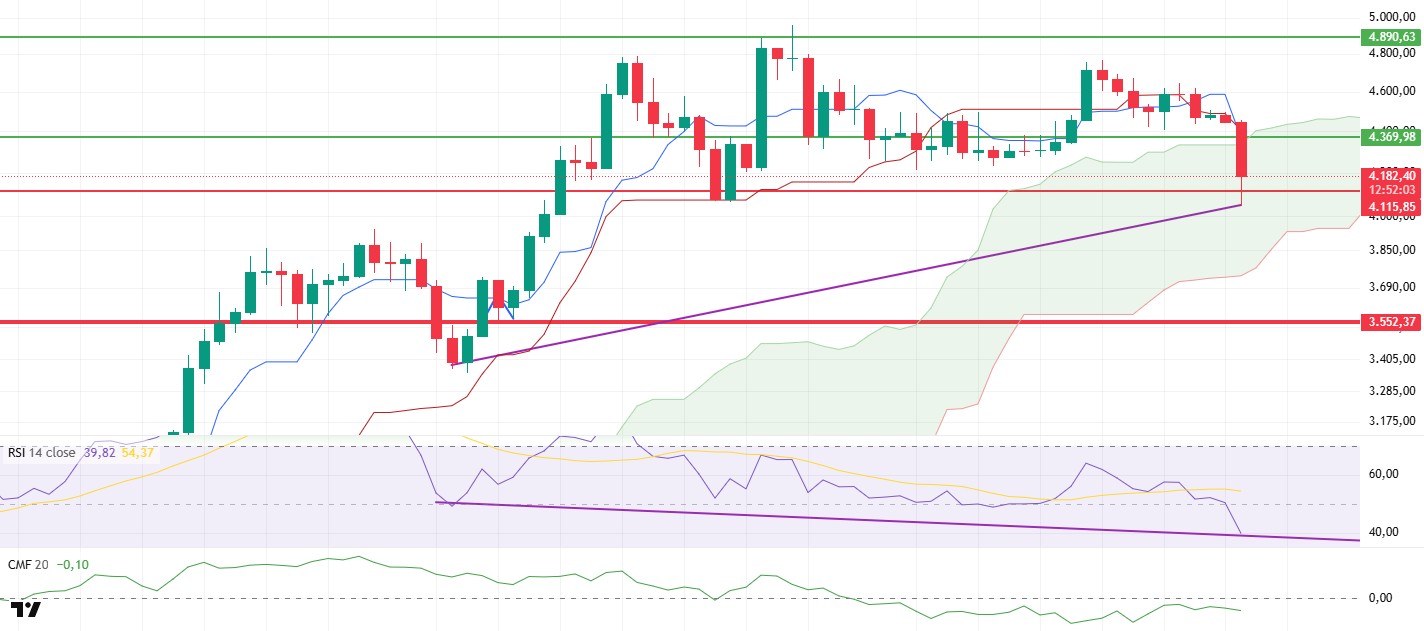
Ethereum was at the center of sharp fluctuations last week following the Fed’s 25 basis point rate cut and Powell’s speech. Although the price initially rose to $4,644, showing a strong short-term outlook, it lost the $4,500 support level due to selling pressure from this region. After the weekly close, the price fell back to the $4,000 level as selling deepened, and it is currently trying to hold this critical threshold. This movement shows that the market has taken on a fragile structure in the short term, causing investors to turn their attention to closes below this level.
On-chain data shows that despite the sharp price decline, Ethereum has maintained its long-term confidence. The Total Value Staked (TVS) has increased from 36.01 million ETH to 36.13 million ETH. This indicates that investors have not changed their long-term staking decisions despite short-term volatility and selling pressure, and that confidence in the ecosystem continues. On the other hand, open interest in the futures markets has declined from $30.4 billion to $27 billion. This decline in open interest indicates that the market has been brought to a healthier ground with the clearing of excessively leveraged trades, while the funding rate turning negative shows that intensive short trades have been opened, which could be a potential reversal signal.
Looking at technical indicators, it is noteworthy that the price has retreated into the Ichimoku cloud. Although the price remains below the Tenkan and Kijun levels, it is still within the cloud, making it impossible to speak of a clear trend reversal. In particular, regaining the cloud’s upper band at the $4,474 level could be strong confirmation that the liquidation cleanup following the sharp decline has been completed. Sustaining above this level could facilitate the price regaining upward momentum.
On the liquidity side, although the Chaikin Money Flow (CMF) indicator remains in negative territory, it has shown strong resilience by not accompanying the sharp decline in price. This indicates that there has not been a massive liquidity outflow from the market and that the indicator could be interpreted positively. The Relative Strength Index (RSI) has produced positive divergence signals despite breaking sharply below the 50 level. This stands out as a signal that strengthens the possibility of an upward recovery if the price can hold at current levels.
In the overall outlook, it is critically important for Ethereum to maintain the $4,000 level. As long as it stays above this level, it seems likely that the price will break through the $4,369 resistance again and then test the upper cloud band at the $4,474 level. In such a scenario, the market could potentially return to buyer control. However, closes below $4,000 could undermine the positive outlook and pave the way for a deeper decline. While risks remain elevated in the short term, long-term confidence indicators and staking data confirm that Ethereum remains structurally strong.
Support levels: 4,115 – 4,000 – 3,552
Resistance levels: 4,369 – 4,890 – 5,250
XRP/USDT
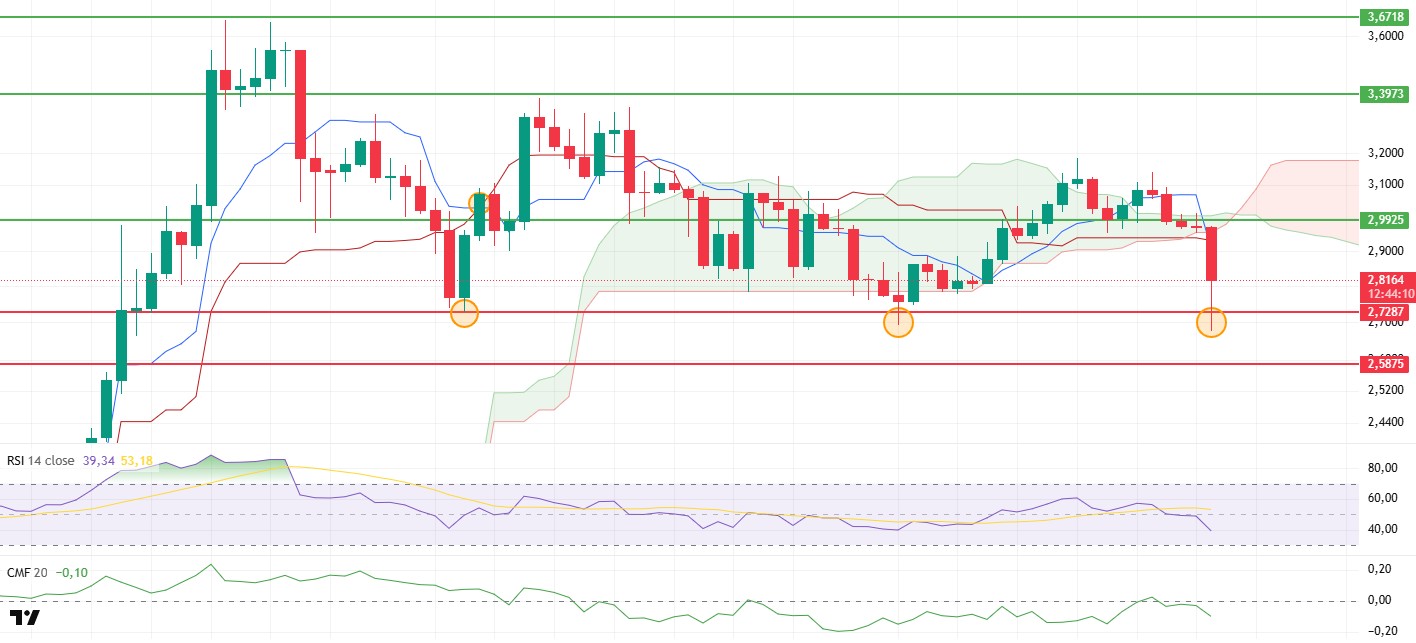
After trading sideways at the $2.99 level for a while last week, XRP fell below this important support level due to selling pressure over the weekend. Following a sharp decline, the price retreated to the $2.70 level, which had previously served as strong support twice, and managed to rebound above the $2.80 level. This movement shows that buyers are still stepping in at critical levels despite strong selling pressure in the short term. Statements that Ripple will accelerate its expansion plans in Asia following its payment institution license from the Monetary Authority of Singapore have been a factor strengthening the project’s regulatory compliance in the medium to long term.
Technical indicators continue to show weakness. The price has fallen below the Tenkan and Kijun lines, losing important levels within the Ichimoku cloud. While this development could be seen as a sign of a trend reversal, it has not yet been confirmed by daily closes. If one or two closes occur below these levels in the coming days, the negative trend is likely to gain strength. On the liquidity side, the Chaikin Money Flow (CMF) indicator has fallen back into negative territory, indicating accelerated capital outflows from the market and weak support for buying. The Relative Strength Index (RSI) indicator has fallen sharply below the 50 level, clearly showing a significant weakening of momentum.
In the overall outlook, the critical level for XRP is once again highlighted as $2.99. If the price regains this level, upward movements may resume, and the $3.07 level could be targeted again. However, staying below the $2.99 level could cause the market to test the $2.70 level once again. Therefore, where the price stabilizes in the coming days will be the most critical factor in determining the direction of the short-term trend.
Support levels: 2.7287 – 2.5875 – 2.3233
Resistances: 2.9925 – 3.3973 – 3.6718
SOL/USDT
Last week in the Solana ecosystem;
- Helius raised over $500 million in funding to launch SOL Treasury Company in partnership with Pantera Capital and Summer Capital.
- Forward Industries announced a $4 billion capital increase program to expand the Solana (SOL) treasury.
- Defidevcorp purchased an additional 62,745 SOL (15 million dollars), increasing its total holdings to 2.1 million SOL (499 million dollars).
- The Solana Foundation and Cathie Wood’s Ark Invest have participated in a $300 million investment for the new SOL treasury, Solmate.
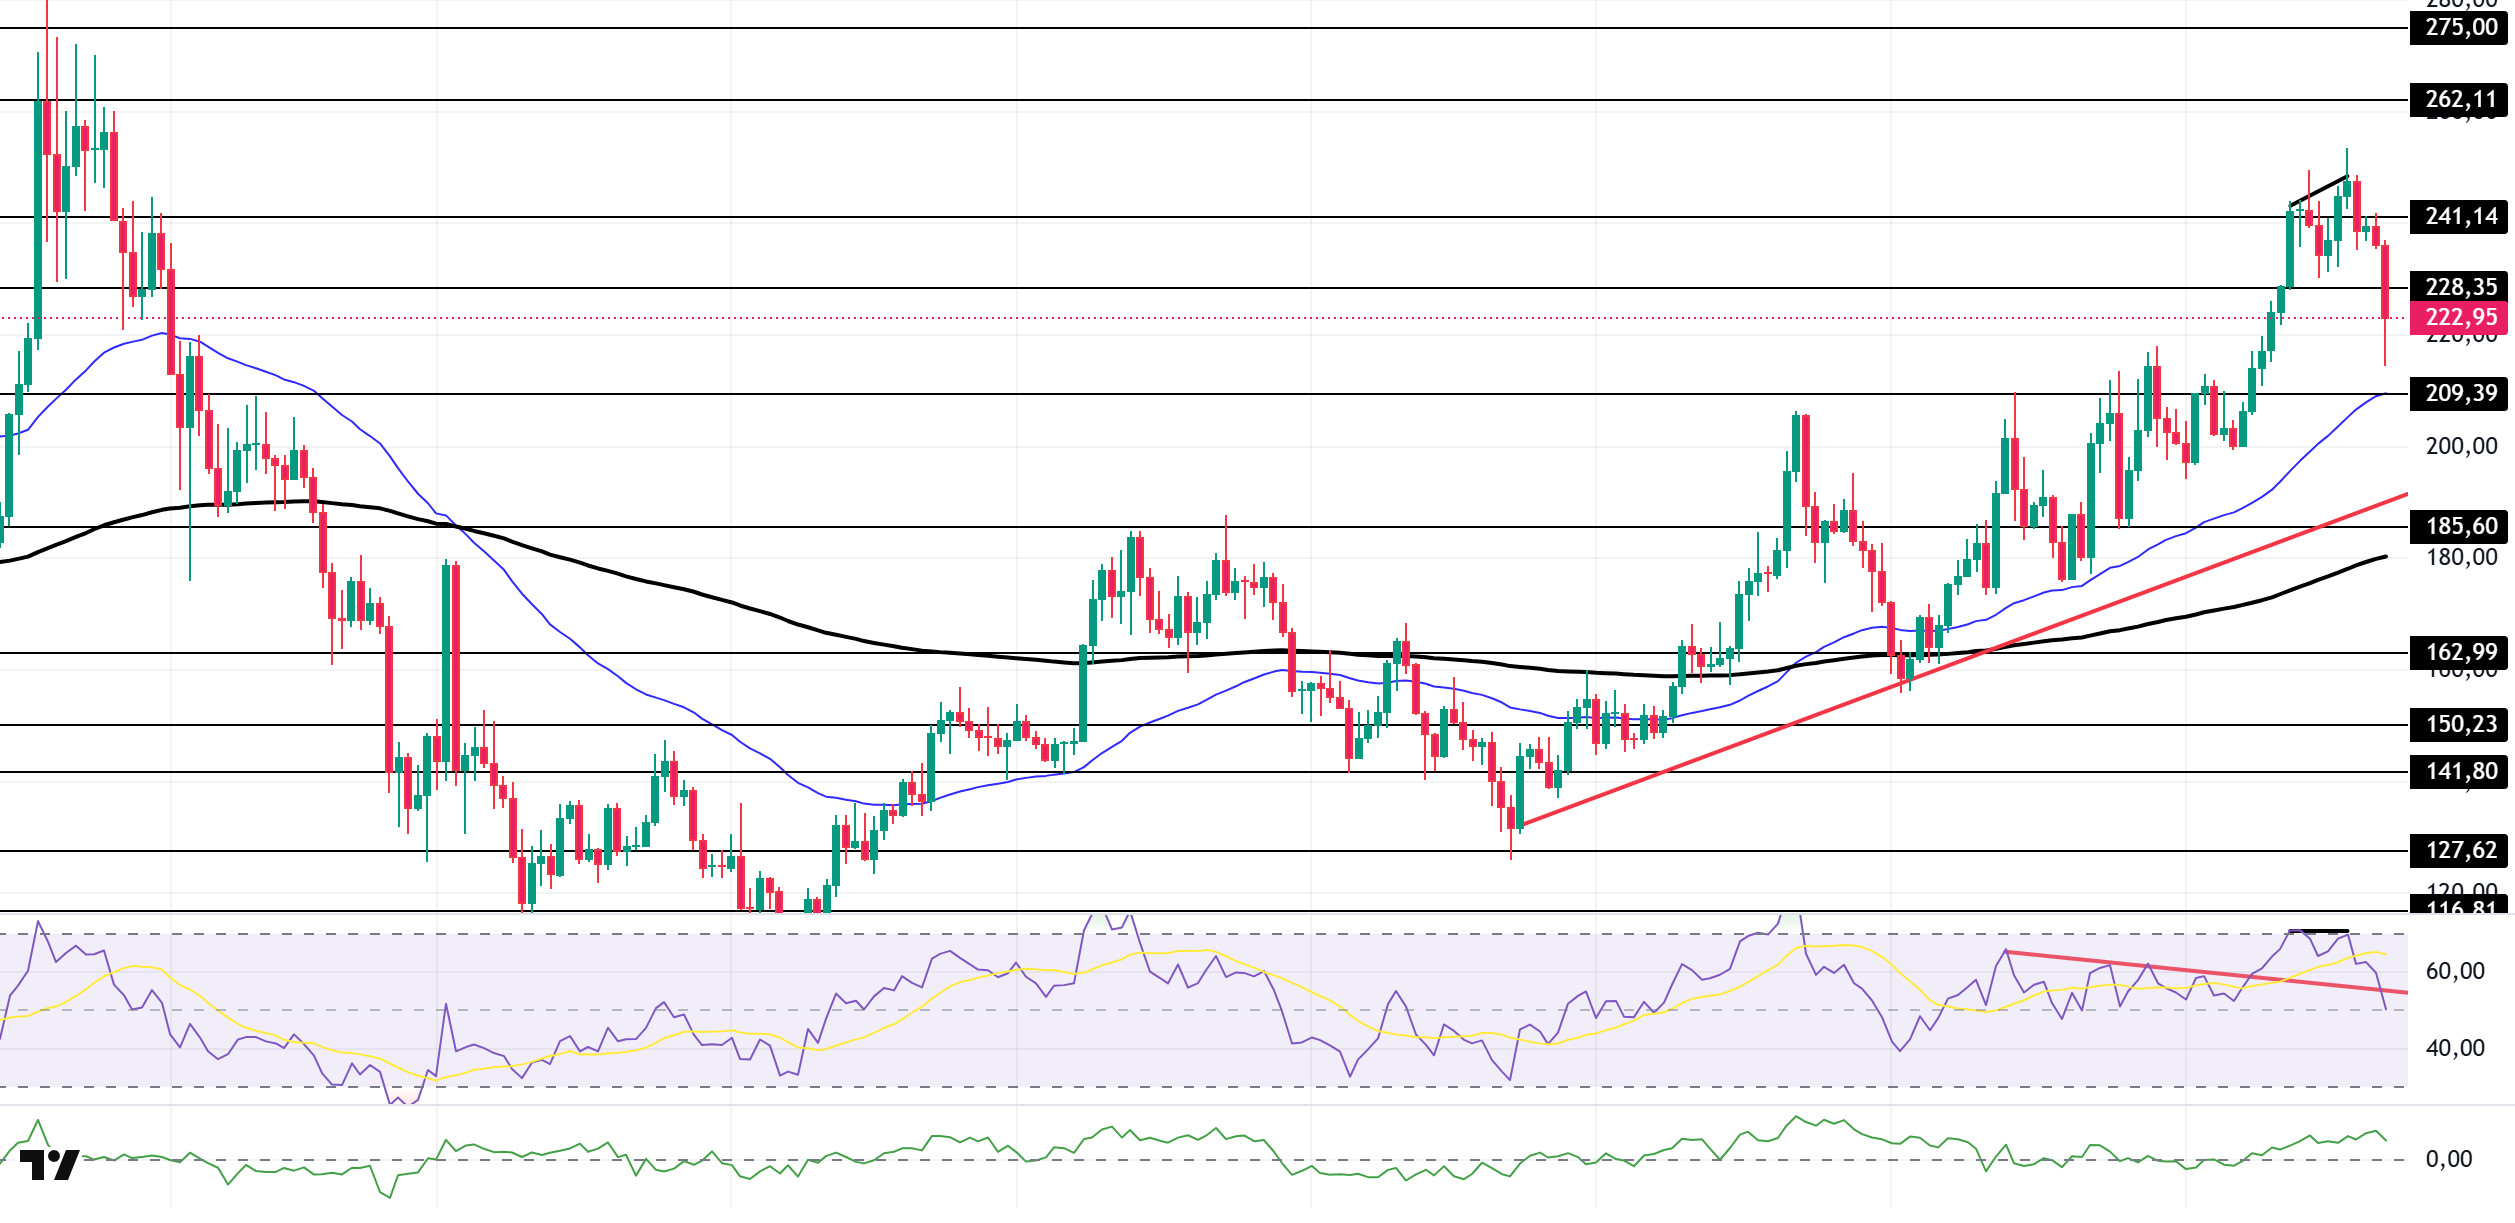
The SOL price showed a decline of approximately 5.6% on the daily chart this week. The asset managed to stay in the upper region of the rising line that began on June 23 and is currently testing the strong support level of $228.35 . If it closes above this level, it could continue its upward trend, rise to the January 20 level of $262.11, and form a cup pattern. If it experiences a pullback, it could test the upward trend as support.
The asset is trading above its 50 EMA (Exponential Moving Average – Blue Line) and 200 EMA (Black Line) moving averages, indicating that the asset is in an uptrend. Furthermore, the 50 EMA remaining above the 200 EMA indicates the continuation of a technical “golden cross” formation. This shows that the potential for an uptrend in the medium term continues. On the other hand, the large gap between the two moving averages increases the possibility of a sideways movement or a decline. The RSI (14) has fallen to a neutral level. At the same time, the indicator has moved into the lower region of the downward trend that began on August 13. This signals increased selling pressure. On the other hand, there is a negative divergence. The Chaikin Money Flow (CMF-20) remains in positive territory; however, the decrease in money inflows could push the CMF-20 indicator into negative territory. If macroeconomic data remains positive and developments in the ecosystem continue to be favorable, the first major resistance level of $262.11 could be retested. Conversely, in the event of potential negative news flow or deterioration in macro data, the $209.39 level could be monitored as a potential buying opportunity.
Supports: 228.35 – 209.39 – 185.60
Resistances: 241.14 – 262.11 – 275.00
DOGE/USDT
Dogecoin treasury company CleanCore added another 100 million DOGE, bringing the total amount to over 600 million. The first dogecoin ETF exceeded expectations, trading approximately $6 million in its first hour on Wall Street. Grayscale filed to convert the Dogecoin Trust into an ETF.
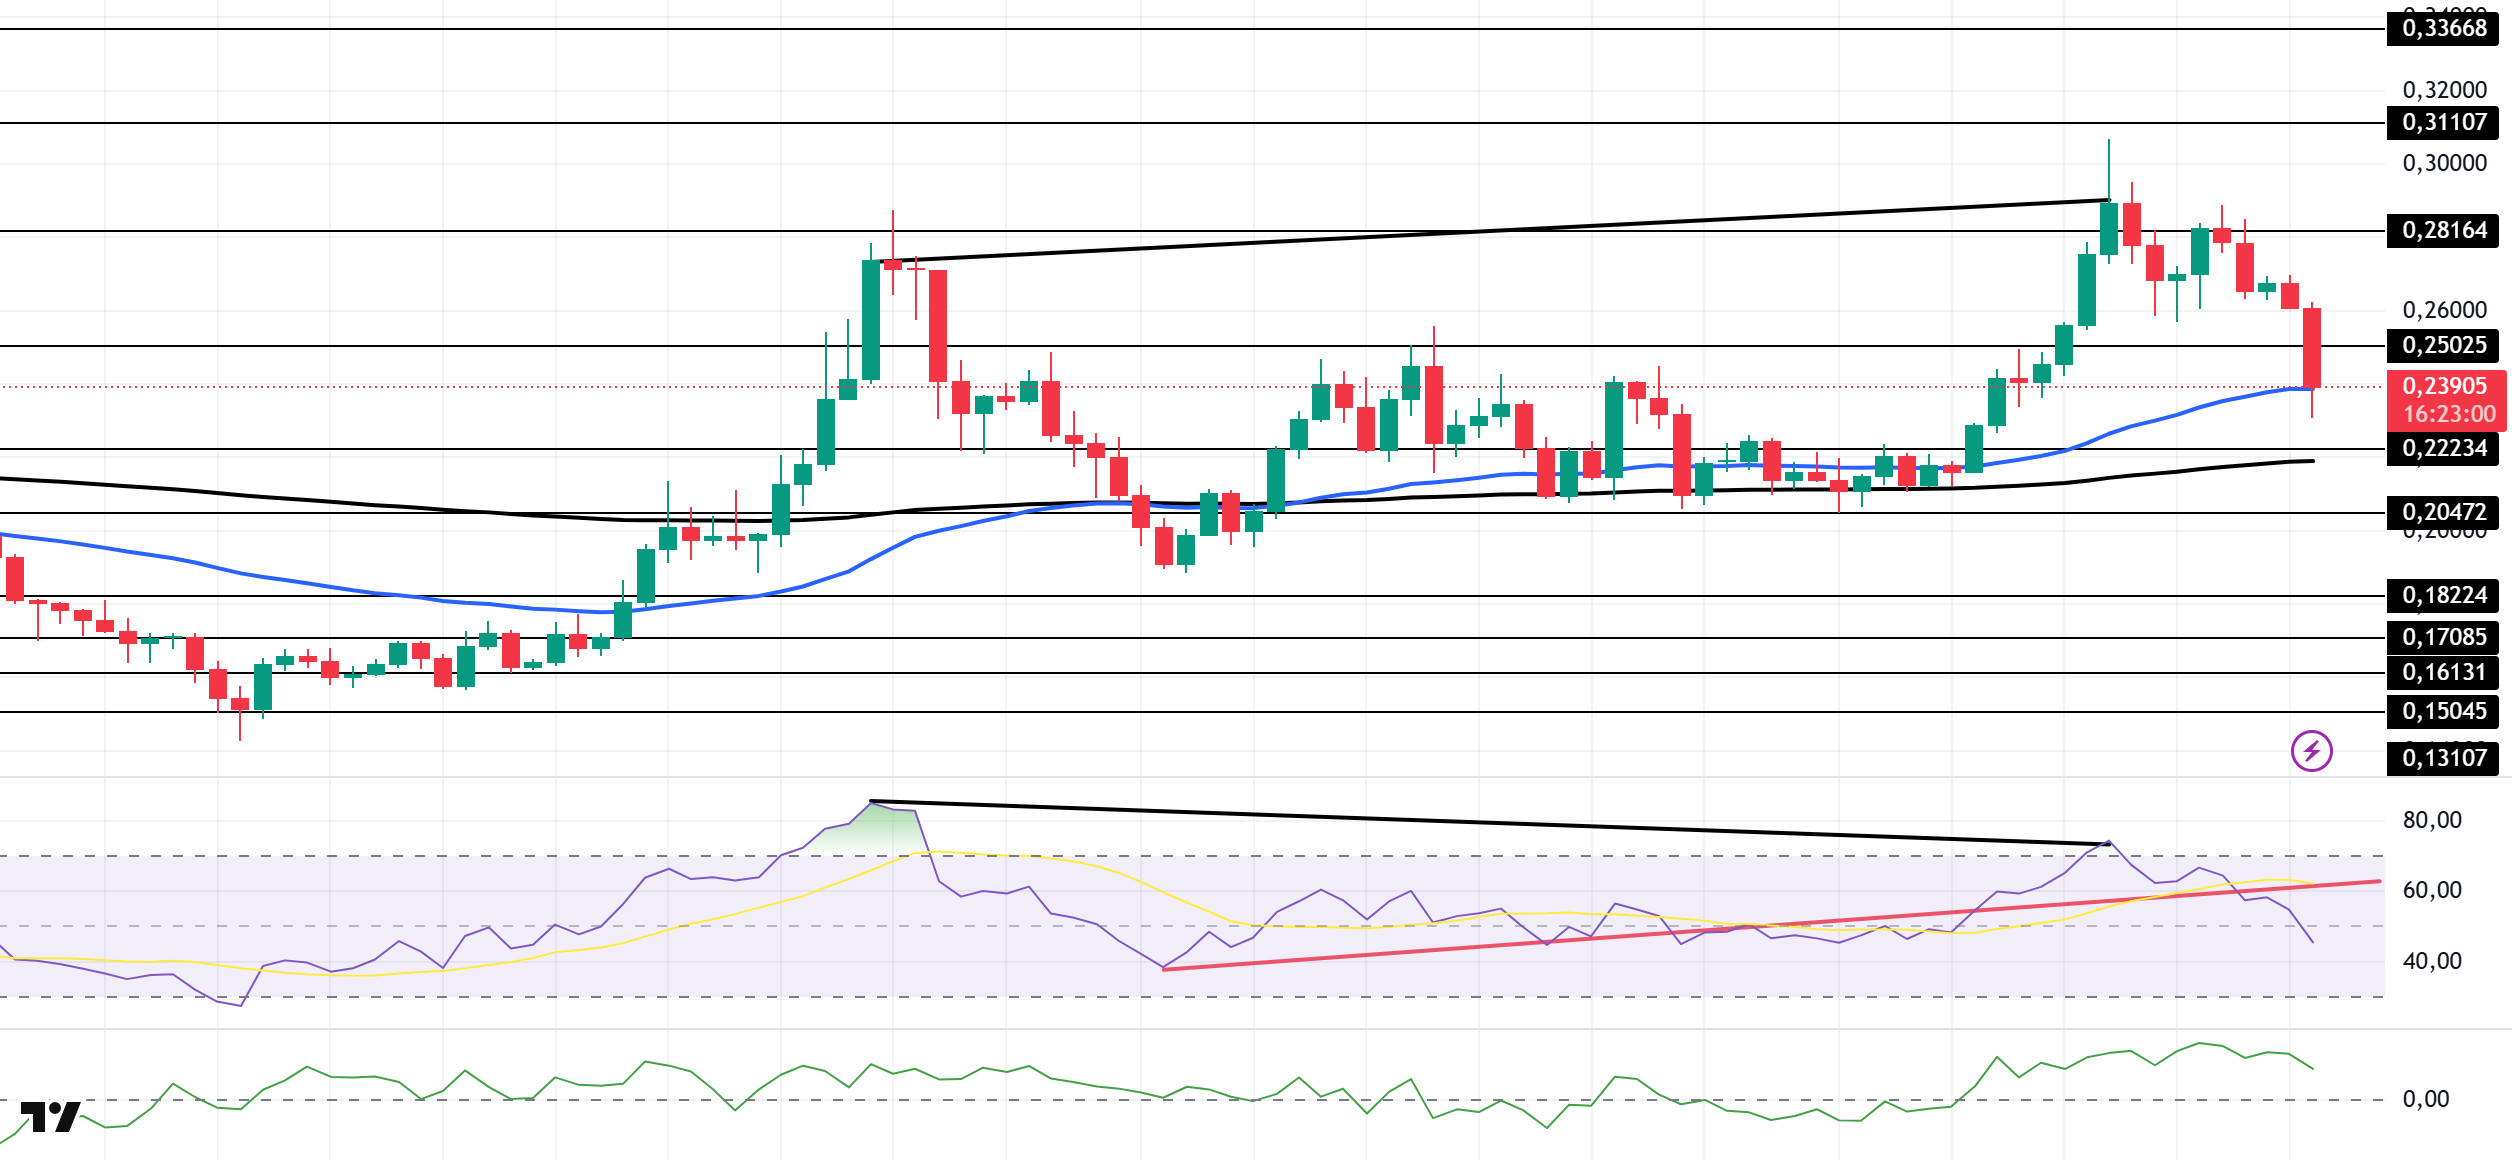
On the daily chart, DOGE has fallen approximately 11% since last week. Testing the strong resistance level of $0.28164, the price retreated and is currently testing the 50 EMA ( ) moving average as support. If the price closes below the 50 EMA, the decline could deepen and test the 200 EMA (Black Line). If the price starts to rise, it could retest the $0.28164 level.
The asset is trading above the 50 EMA (Blue Line) and 200 EMA (Exponential Moving Average – Black Line) moving averages. This indicates that the asset is in an uptrend. Meanwhile, the 50 EMA continues to stay above the 200 EMA, indicating that the “golden cross” formation is continuing. This also signals that upward pressure may continue in the medium term. The Chaikin Money Flow (CMF–20) indicator remained in positive territory. Money inflows, however, continue to decline. This could push the CMF-20 into negative territory. Looking at the Relative Strength Index (RSI-14) indicator, it pulled back from the overbought zone towards neutral levels, breaking the upward trend that had been ongoing since August 2. This signaled increased selling pressure. On the other hand, negative divergence may continue. In the event of macroeconomic risks or negative news from the ecosystem, the $0.22234 level can be monitored as strong support. On the other hand, if the upward movement gains strength, the $0.28164 level comes to the fore as the first strong resistance level.
Supports: 0.25025 – 0.22234 – 0.20472
Resistances: 0.28164 – 0.31107 – 0.33668
TRX/USDT
Last week, Tron founder Justin Sun announced that PayPal USD (PYUSD) is now available on the TRON network through LayerZero integration. Justin Sun stated that the launch of PYUSD on the TRON network contributes to liquidity and network accessibility for both individual users and institutional actors, while also reflecting their strategic commitment to supporting assets that offer trust, transaction efficiency, and scalable access in the digital economy.
Last week, the TRON network generated a total of $55.3 million in revenue, increasing its revenue by $1.1 million compared to the previous week and continuing to be the highest-revenue-generating ecosystem among all blockchain networks. Maintaining this momentum is critical to solidifying TRON’s leadership in the DeFi and stablecoin ecosystem.
During the week of September 15-21, 2025, a total of 25.9 million TRX were burned on the TRON network. Despite this, the circulating supply increased by 1.5 million. The increase in circulating supply creates inflationary pressure on TRX. Additionally, the total number of addresses also increased by 1.6 million to 333.7 million during the same week.
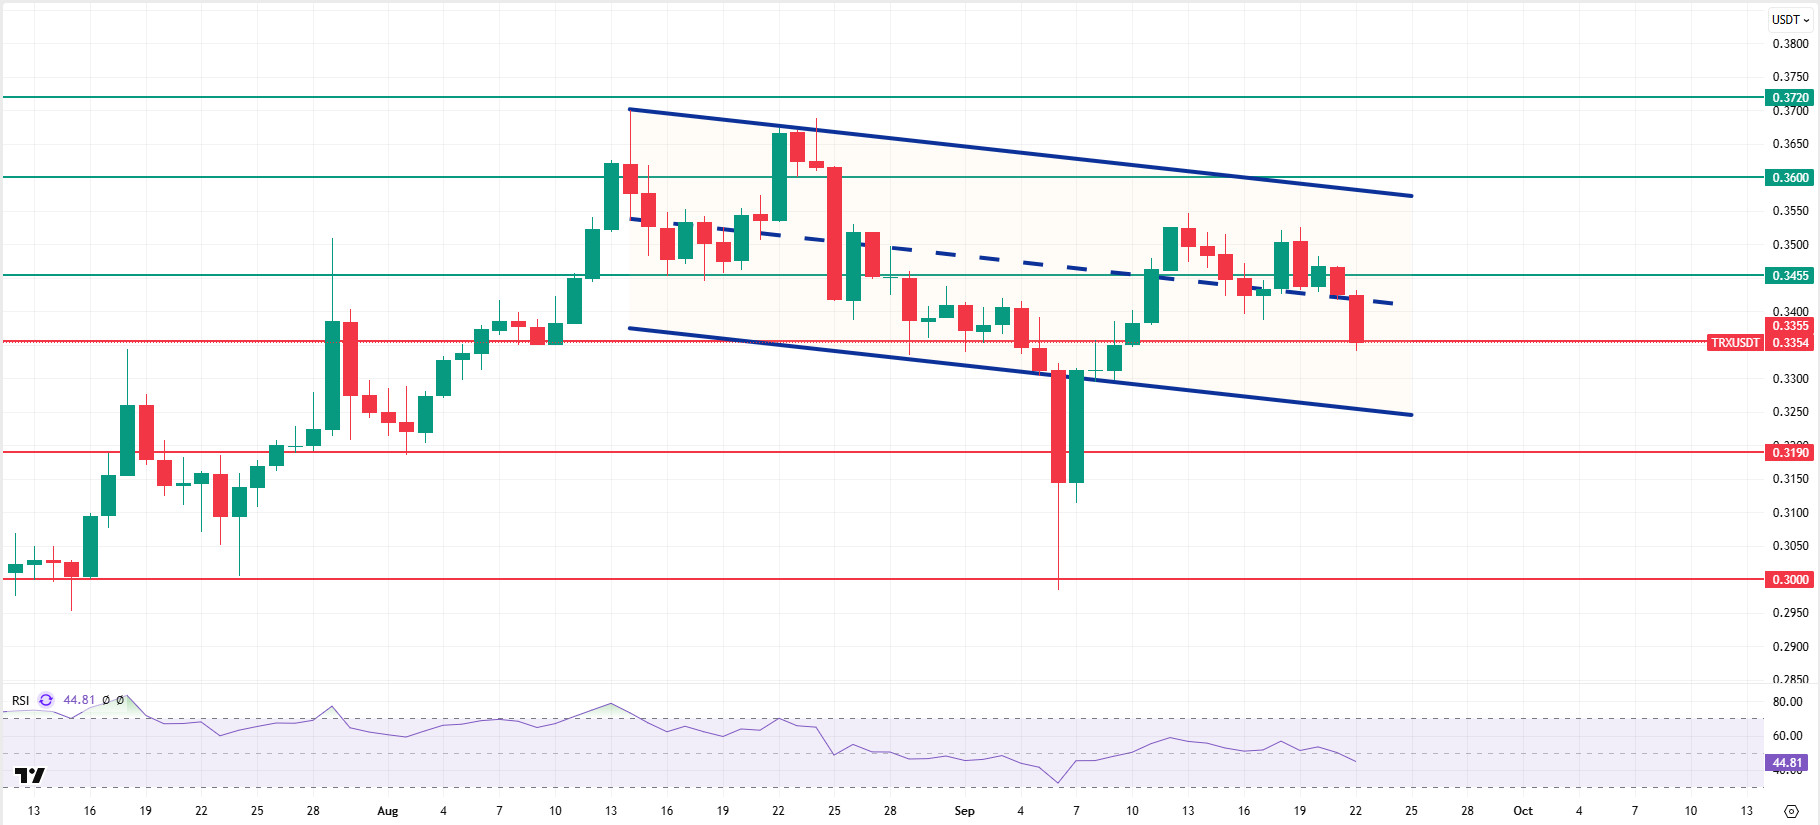
Technically speaking, TRX started last week at 0.3485 and closed the week at 0.3426, falling approximately 2% over the course of the week. Thus, it has completed its second consecutive week of decline, with its market value falling to $32.4 billion. Currently trading at 0.3354, TRX is just below the middle band of the bearish channel on the daily chart and is attempting to break the 0.3355 support level. The Relative Strength Index (RSI) value is also observed to be in the sell zone at 44. Considering its position within the bearish channel and the RSI indicator, the TRX price may rise slightly. This indicates that it may want to move towards the upper band of the channel. In such a case, it may test the 0.3455 resistance. If it closes above the 0.3455 resistance level on a daily basis, it may test the 0.36000 resistance level. If it fails to close above the 0.3455 resistance level on a daily basis and selling pressure increases in the market, it may decline due to potential selling from this area. In such a case, it may test the 0.3190 support level.
The 0.3000 level is being monitored as a critical support point on the daily chart. Sustaining above this level could maintain the upward trend, while closes below it could lead to increased selling pressure and deeper downward price movements.
Supports: 0.3355 – 0.3190 – 0.3000
Resistances: 0.3455 – 0.3600 – 0.3720
AVAX/USDT
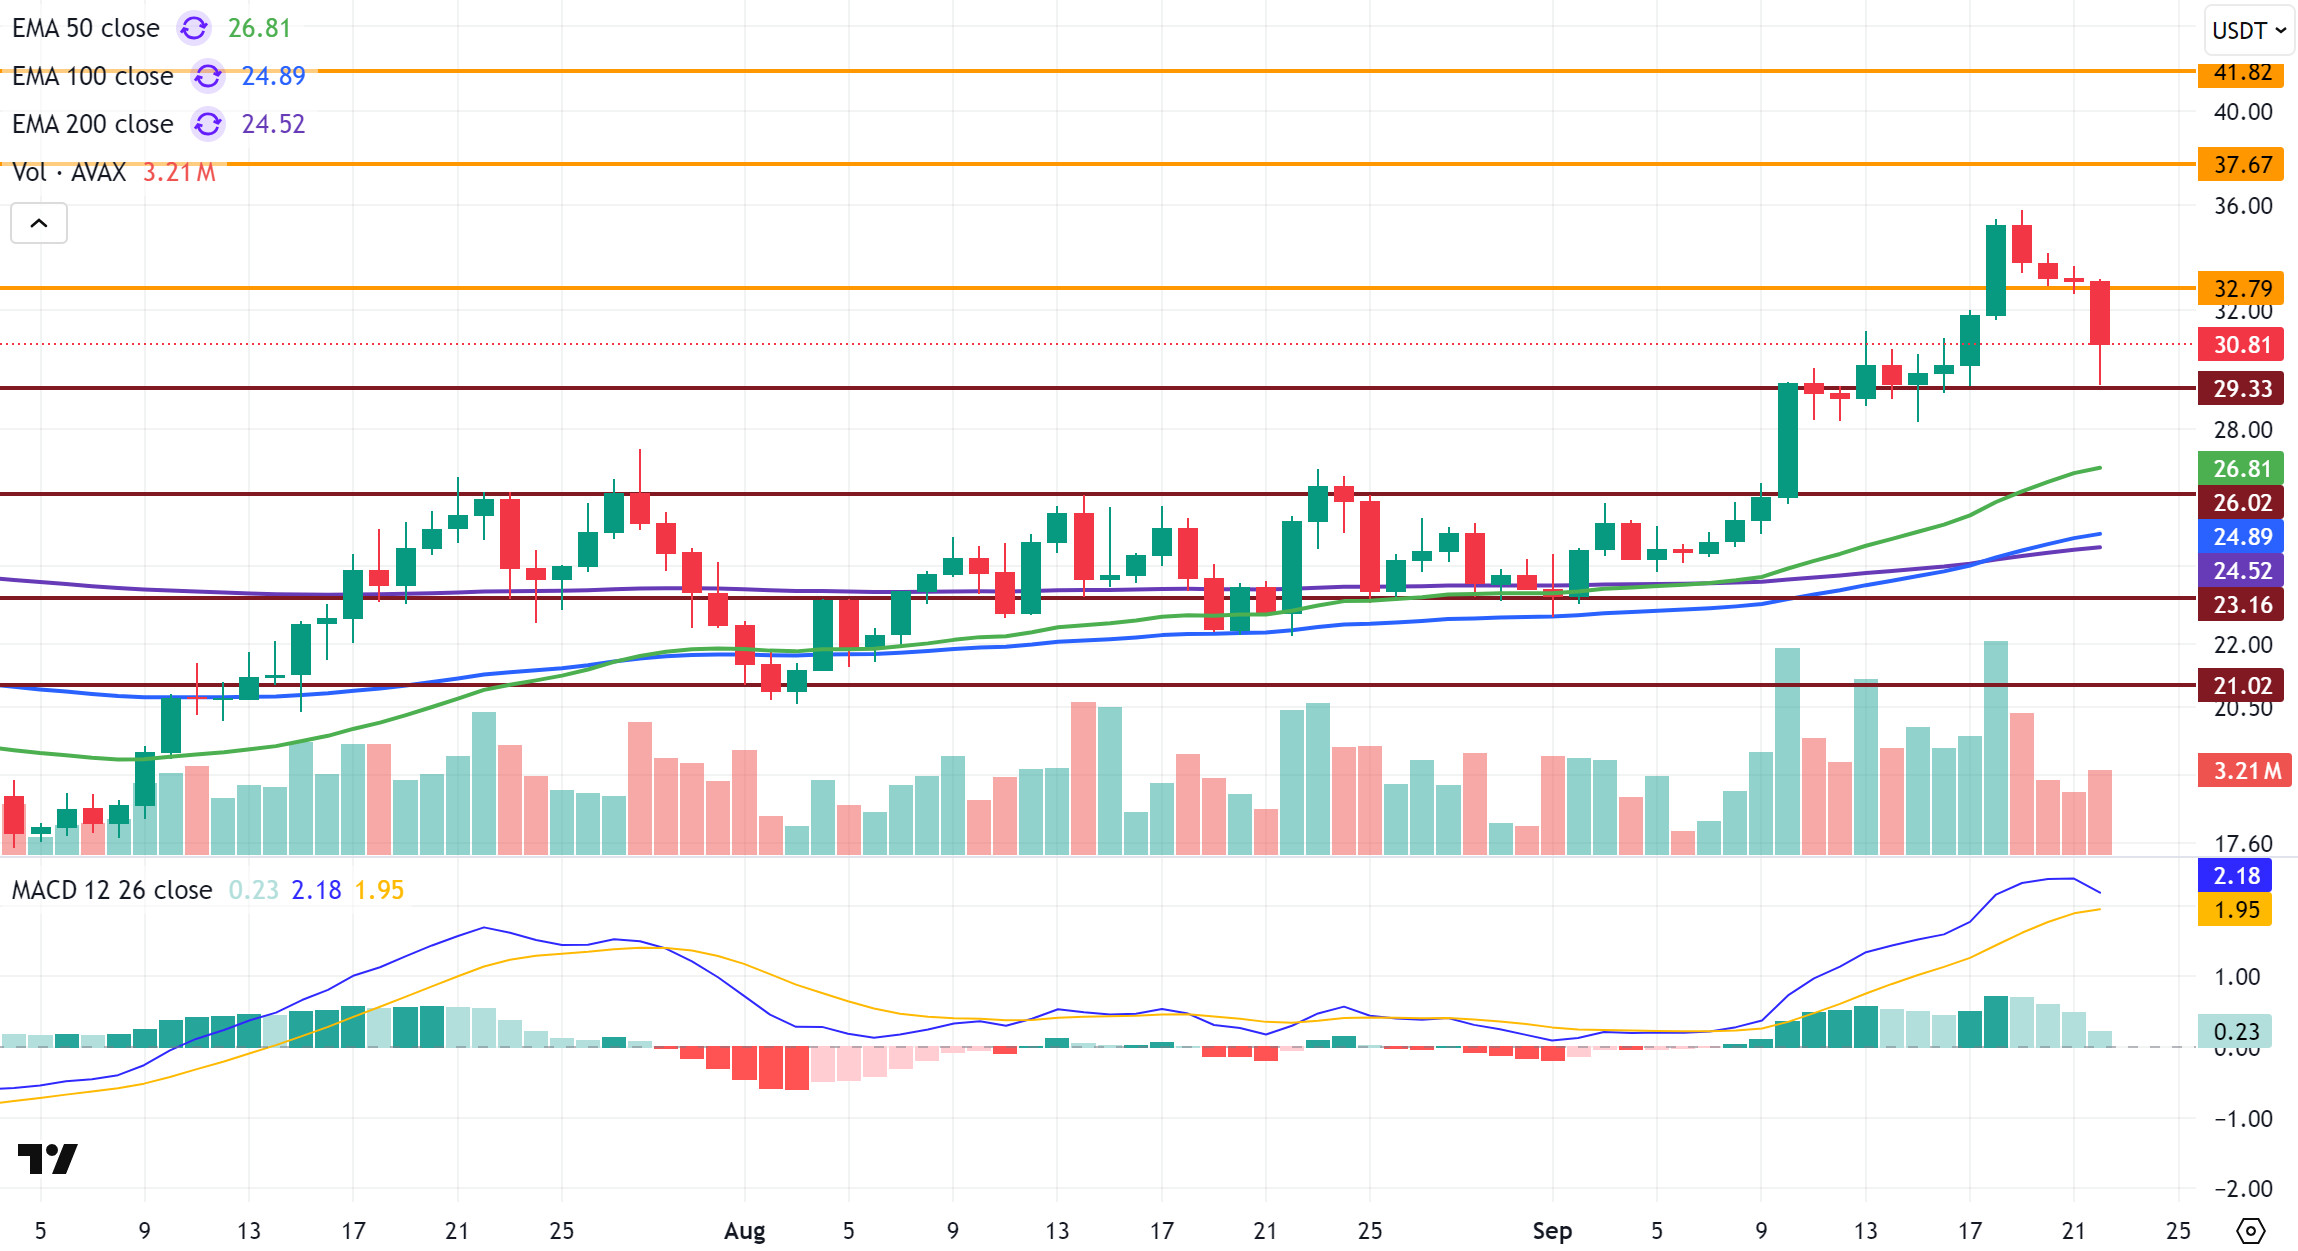
Starting last week at $29.43, AVAX rose to $35.80 before closing the week at $33.02 after three days of selling. On a weekly basis, it saw an approximate 12.20% increase in value. The trading volume in the AVAX ecosystem and institutional interest in RWA were catalysts for AVAX’s rise. AVAX joined the decline seen across the crypto market in the new week. After falling to the $29.33 support level during its sharp decline, AVAX is trading above the $30 level again thanks to buying at this level. Market sentiment is negative following the decline seen across the cryptocurrency market. Uptrends are insufficient as momentum has weakened considerably.
Although the Moving Average Convergence/Divergence (MACD) line continues to trade above the signal line on the daily chart, it has started to show a downward trend as momentum weakens. If the MACD line crosses below the signal line, this could cause the decline to deepen. Although this outlook is technically negative, AVAX trading above critical Exponential Moving Average (EMA) levels is technically positive. Technical indicators have not formed a clear direction. If momentum continues to weaken, selling pressure may increase. In this case, it may test critical support levels with its decline.
If momentum weakens significantly for AVAX and the MACD line crosses below the signal line, it could retest the $29.33 support level. If it closes below this level, the critical support level of $26.02 could come into play. If this level is broken, the decline could gain momentum, leading to a pullback to the $23.16 and then $21.02 support levels. Conversely, if buying pressure and positive developments emerge, triggering a rebound, it is important for prices to close above the $32.79 level. Closing above this level could trigger a gradual rise, bringing the $37.67 and then $41.82 resistance levels into focus. Overall, AVAX shows a negative outlook according to MACD but a positive outlook according to EMA. This indicates that AVAX has not yet found a clear direction. It is important for it to close above $30. Strong buying and confirmation of positive momentum are critical for it to resume its upward trend. Otherwise, increased selling pressure could deepen the decline, bringing the critical support level of $26.02 back into focus.
(EMA50: Green Line, EMA100: Blue Line, EMA200: Purple Line)
Supports: 29.33 – 26.02 – 23.16
Resistances: 32.79 – 37.67 – 41.82
LTC/USDT
LTC ended last week with a 0.96% decline and started the new week at 114.00. LTC also lost 0.8% against Bitcoin during the same period, with its market value falling to approximately $8.4 billion and maintaining its 20th place in the market cap rankings. Open positions in futures trading decreased by 6.75% compared to last week, while funding rates remain positive.
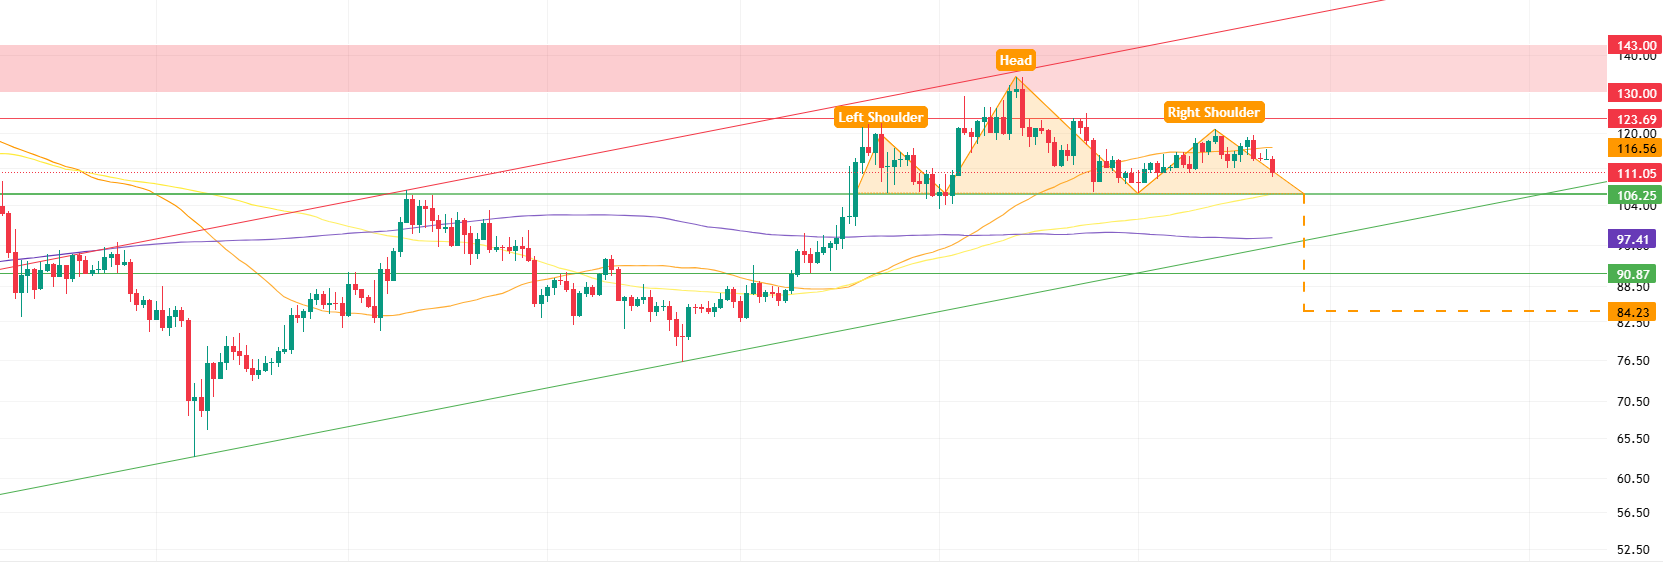
On the technical side, Litecoin is trading above the 100-period (yellow) and 200-period (purple) moving averages, but below the 50-period (orange) moving average. The horizontal resistance at the 123.69 level continues to exert pressure. If an upward breakout occurs at this level, the rise is expected to continue to the 130.00 – 143.00 range. However, the 130.00 level in particular should be monitored as an important threshold. The 143.00 level is the upper point of the red band and can be considered the most critical position where sudden rises could continue if exceeded.
The current outlook suggests that price movements are preparing for a Head and Shoulders formation that could create downward momentum. As the pattern is not yet complete, it is only possible to say that the possibility of a pullback has increased at this stage. In this scenario, the first level to watch will be the 106.25 horizontal support. At the same time, the fact that this region coincides with the 100-period moving average increases the importance of the support. If prices remain below this level, the pattern will be complete, and the 84.23 level will come into focus as a target. Within this bearish scenario, price movements may find support from the 200-period moving average (also a trend support) at 97.41 and the horizontal support zone at 90.87.
Supports: 106.25 – 97.41 – 90.87
Resistances: 123.69 – 130.00 – 143.00
BNB/USDT
Looking at the key developments this week, the AVNT, BARD, LAYER, and 0G projects have been listed on Binance Launchpool within the BNB ecosystem. These listings are expected to increase demand for BNB, which is used for transaction fees, and reduce the circulating supply through users staking BNB. This situation is expected to have a generally positive impact on the price of BNB.
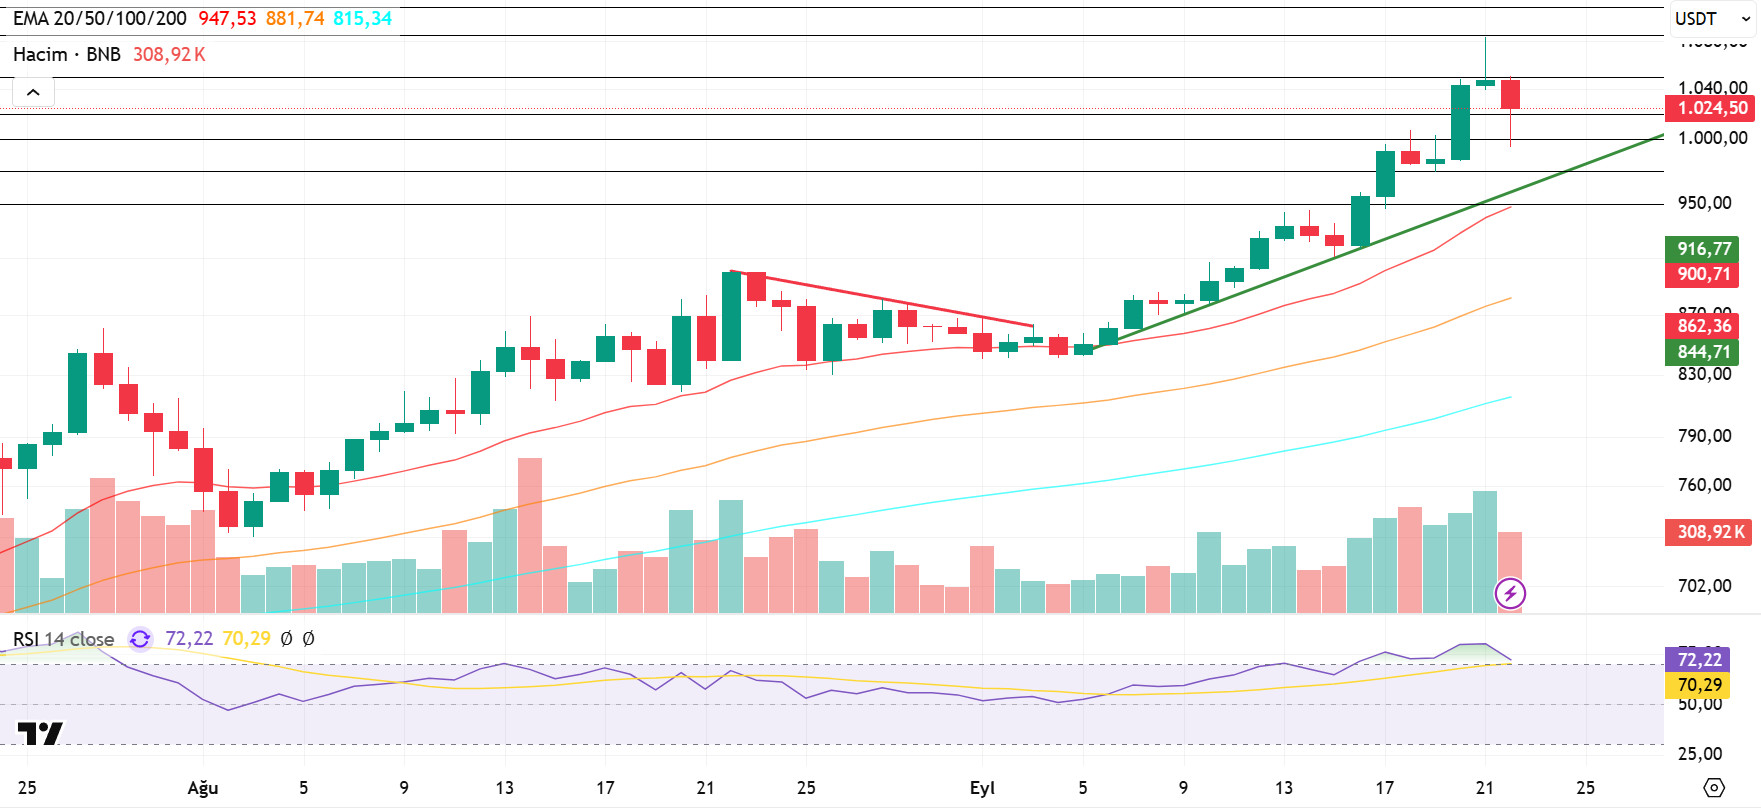
From a technical perspective, BNB/USDT, which ended its correction movement starting from the previous All Time High (ATH) level of $900 at the $840 level, continued its rise with strong support from this region and recorded new historical highs. In this direction, BNB, which reached $1,080, retreated to $990 with a sharp correction during the day, then showed a partial recovery.
Technical indicators for BNB/USDT, currently trading in the $1,020–$1,050 range, reveal that the recent increase in trading volume has supported buying. This picture signals that the positive outlook in the market is gaining strength. Furthermore, the Relative Strength Index (RSI) has risen above the 70 level with the recent increases; although short-term corrections have been seen, it is still holding at these levels. This technical structure indicates that positive momentum in BNB is strengthening.
Within the current outlook, if selling pressure increases, the price is likely to retreat back to the $1,020 support level. If this level is broken downwards, the $1,000 and $975 levels emerge as critical areas to watch. On the other hand, if buying appetite is maintained, BNB is expected to test the $1,050 resistance level in the first stage. If this level is exceeded, the price may move towards the $1,080 and $1,100 levels, respectively.
Supports: 1020 – 1000 – 975
Resistances: 1050 – 1080 – 1100
LINK/USDT
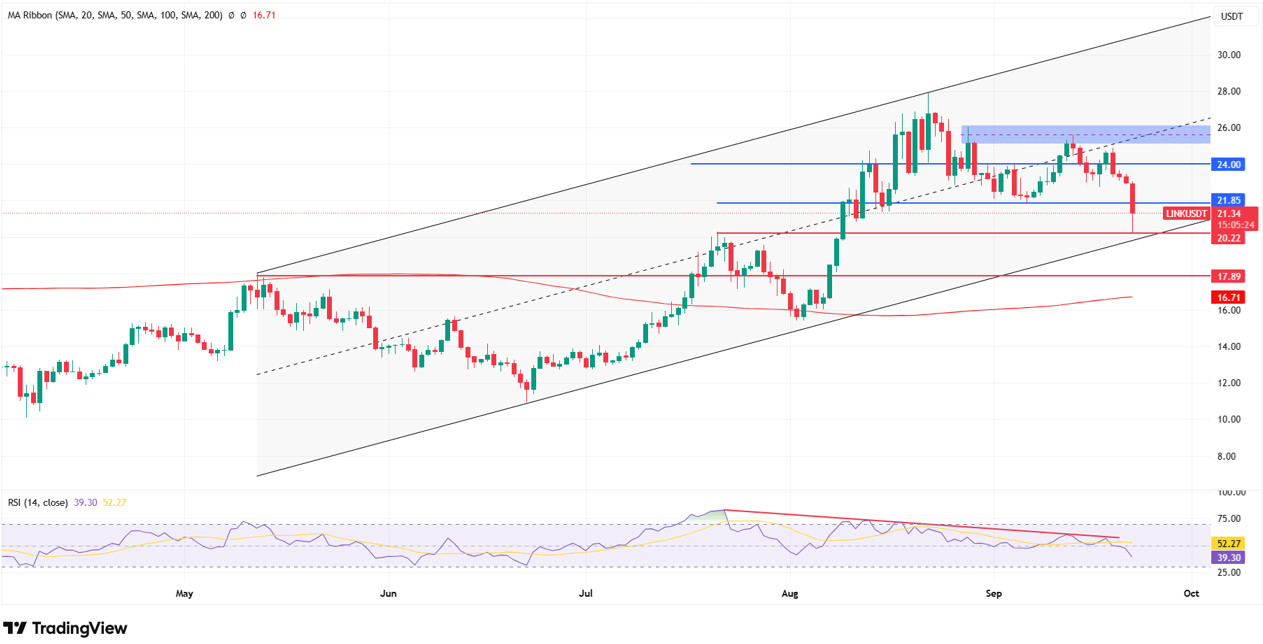
LINK continues to move within the rising main channel, but failed to hold above the horizontal resistance line at 24.00, which we mentioned last week. Additionally, due to the negative divergence we also mentioned last week, the price fell to the 21.85 level, retreating to the price zone where the divergence began.
If we see 4-hour candle closes below the 21.85 level in the coming days, the price has the potential to pull back to the next strong demand zone at 20.22–19.33. This zone stands out as the strongest demand zone because it is both the lower band of the channel and a horizontal support, and it is possible for the price to receive a positive reaction from here. In the event of a deeper pullback, the 17.89 and 16.71 levels could come into play.
On the other hand, for the upside scenario to regain strength, the price must first hold above 21.85, followed by consecutive 4-hour closes above 24.00 and volume-supported daily closes. In this case, our targets could be the $26.05 and $27.94 levels, respectively.
The Relative Strength Index (RSI) indicator is currently at 39.30 and, with the effect of negative divergence, is supporting the price downward. For us to see a recovery in momentum, the RSI needs to rise to the 55+ zone and the price needs to hold above 24.00. If both of these occur simultaneously, it would be possible to say that the upward scenario is confirmed not only technically but also in terms of momentum.
Supports: 20.22 – 17.89 – 16.71
Resistances: 21.85 – 24.00 – 26.00
SUI/USDT
Noteworthy steps were taken in the Sui (SUI) ecosystem this week. With the completion of LayerZero integration, Sui is now able to interact more easily with different blockchains. This will expand both cross-chain token transfers and the use cases for DeFi applications. In addition, DeepBook V2, an important step in decentralized exchange infrastructure, was launched. The new version aims to enable faster and more reliable transactions in order book-based trading.
There were also noteworthy developments on the infrastructure side. The Sui Kiosk 2.0 update was released, introducing features that will facilitate the secure trading of NFTs, in-game assets, and digital collections. Furthermore, new testing modules and error detection mechanisms for developers were added, taking steps to simplify the work of teams writing smart contracts. Meanwhile, a $2.4 million security vulnerability was reported in the Nemo Protocol. While this incident sparked debate within the community, the project team’s swift intervention ensured that the damage was limited.
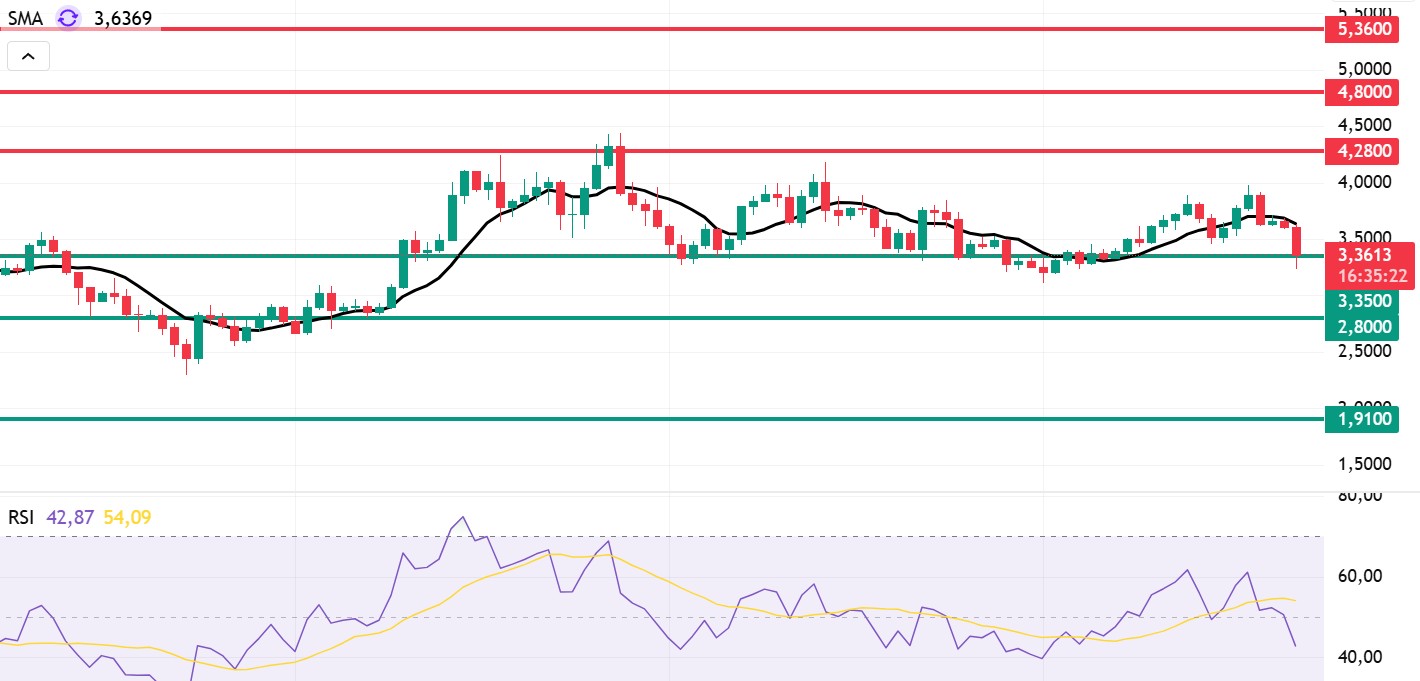
Following recent developments, when we look at Sui’s technical outlook, we see that the price has fallen on a weekly basis, moving sideways at around $3.36, influenced by fundamental developments. The Relative Strength Index (RSI) is currently in the range of 42.87 – 54.09. This range indicates that the market is trading close to the sell zone; however, if the RSI weakens and falls to the 35.00 – 40.00 range, it could signal a potential buying point. If the price moves upward, the resistance levels of $4.28, $4.80, and $5.36 can be monitored. However, if the price retreats to new lows, it could indicate that selling pressure may deepen. In this case, the support levels of $3.35, $2.80, and $1.91 come to the fore. Based on the trend line, a pullback to $2.80 appears technically possible. According to Simple Moving Averages (SMA) data, Sui’s average price is currently at $3.63. If the price remains below this level, it indicates that the current upward trend may not continue technically. The downward trend of the SMA also supports this situation.
Support levels: 1.91 – 2.80 – 3.35
Resistances: 4.28 – 4.80 – 5.36
ADA/USDT
The Federal Reserve decided to cut interest rates by 0.25% at its last meeting on Wednesday last week, and officials hinted at further cuts at the next meeting. Stephen Miran, the newest Fed official appointed by Donald Trump, voted to cut interest rates by 0.50% at this meeting. This move caught Trump’s attention and showed the possibility of him appointing him as Federal Reserve chairman.
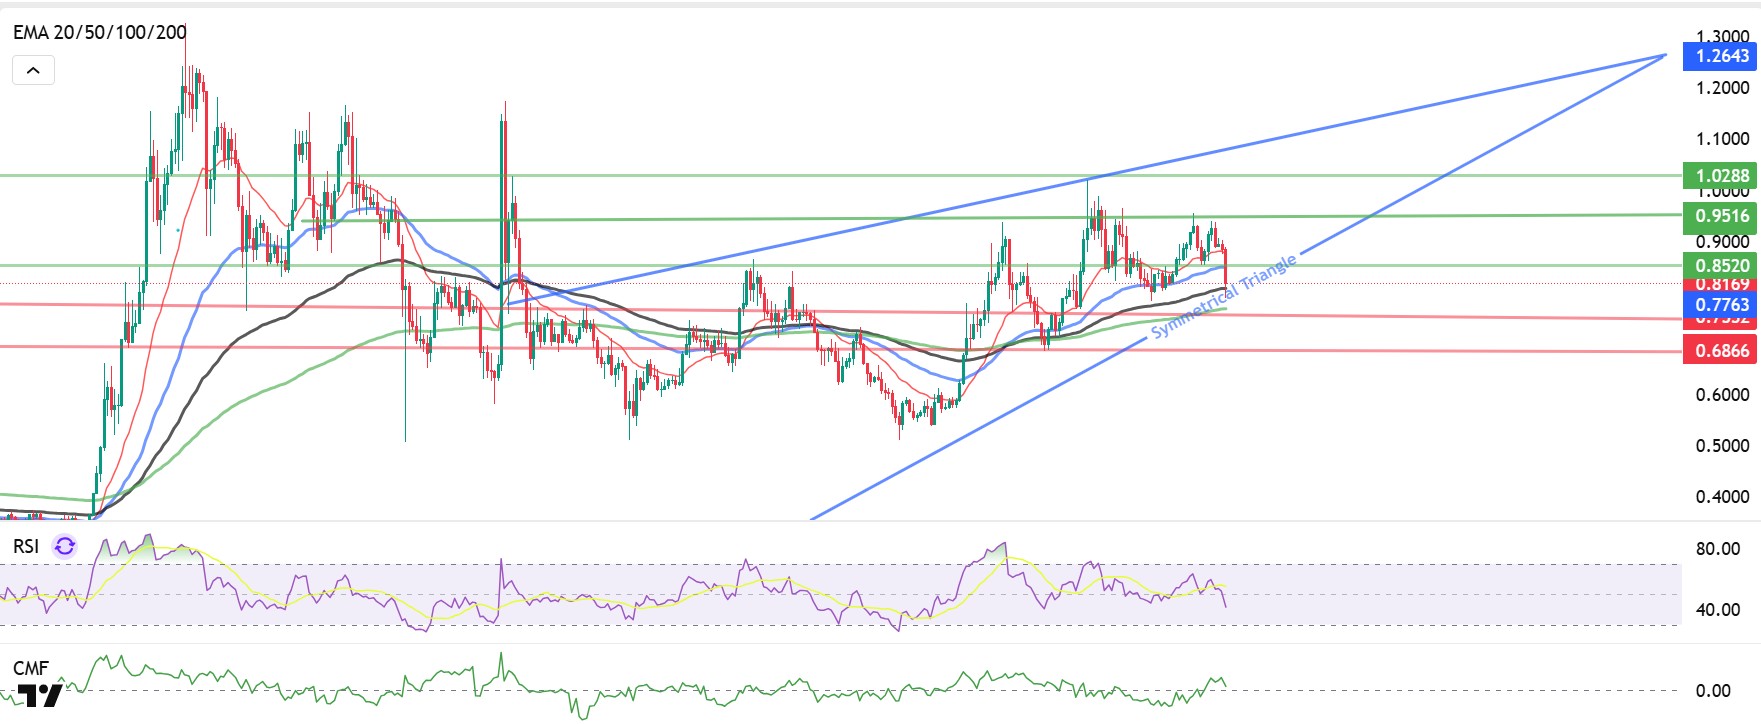
Technically speaking, ADA, which priced in the interest rate cut expectation a few days in advance, fell by 6.85% in a week. The price fell to $0.8135, reaching last week’s first support level of $0.8075, preparing to execute liquidation settlements. If there is a confirmed close above $0.8520, the first target could be $0.9516, and if momentum continues, the $1.0288 level could be our first resistance level in the wide band range. As long as the price continues within the symmetrical triangle formation, especially as long as it closes above the 20-day Exponential Moving Average (EMA 20 – Red Line) and (EMA 50 – Blue Line), the uptrend may continue. The Relative Strength Index (RSI) continues to move near the sell zone, falling to 44 levels, while the Chaikin Money Flow (CMF-20) falls to 0.04 levels, indicating potential for a sell-off. The decrease in money inflows may keep the CMF in negative territory, and the uncertainty between the two indicators may signal a sell-off. With macroeconomic data to be released this week or positive news regarding the Cardano ecosystem, the $0.9500 level may emerge as our strong resistance point. If the decline begins, the 0.7380 level is the important support level we will be watching.
Supports: 0.8075 – 0.7763 – 0.6866
Resistances 1.0288 – 0.9516 – 0.8520
Legal Notice
The investment information, comments, and recommendations contained in this document do not constitute investment advisory services. Investment advisory services are provided by authorized institutions on a personal basis, taking into account the risk and return preferences of individuals. The comments and recommendations contained in this document are of a general nature. These recommendations may not be suitable for your financial situation and risk and return preferences. Therefore, making an investment decision based solely on the information contained in this document may not result in outcomes that align with your expectations.