Weekly Ethereum Onchain Report – September 24
Active Addresses
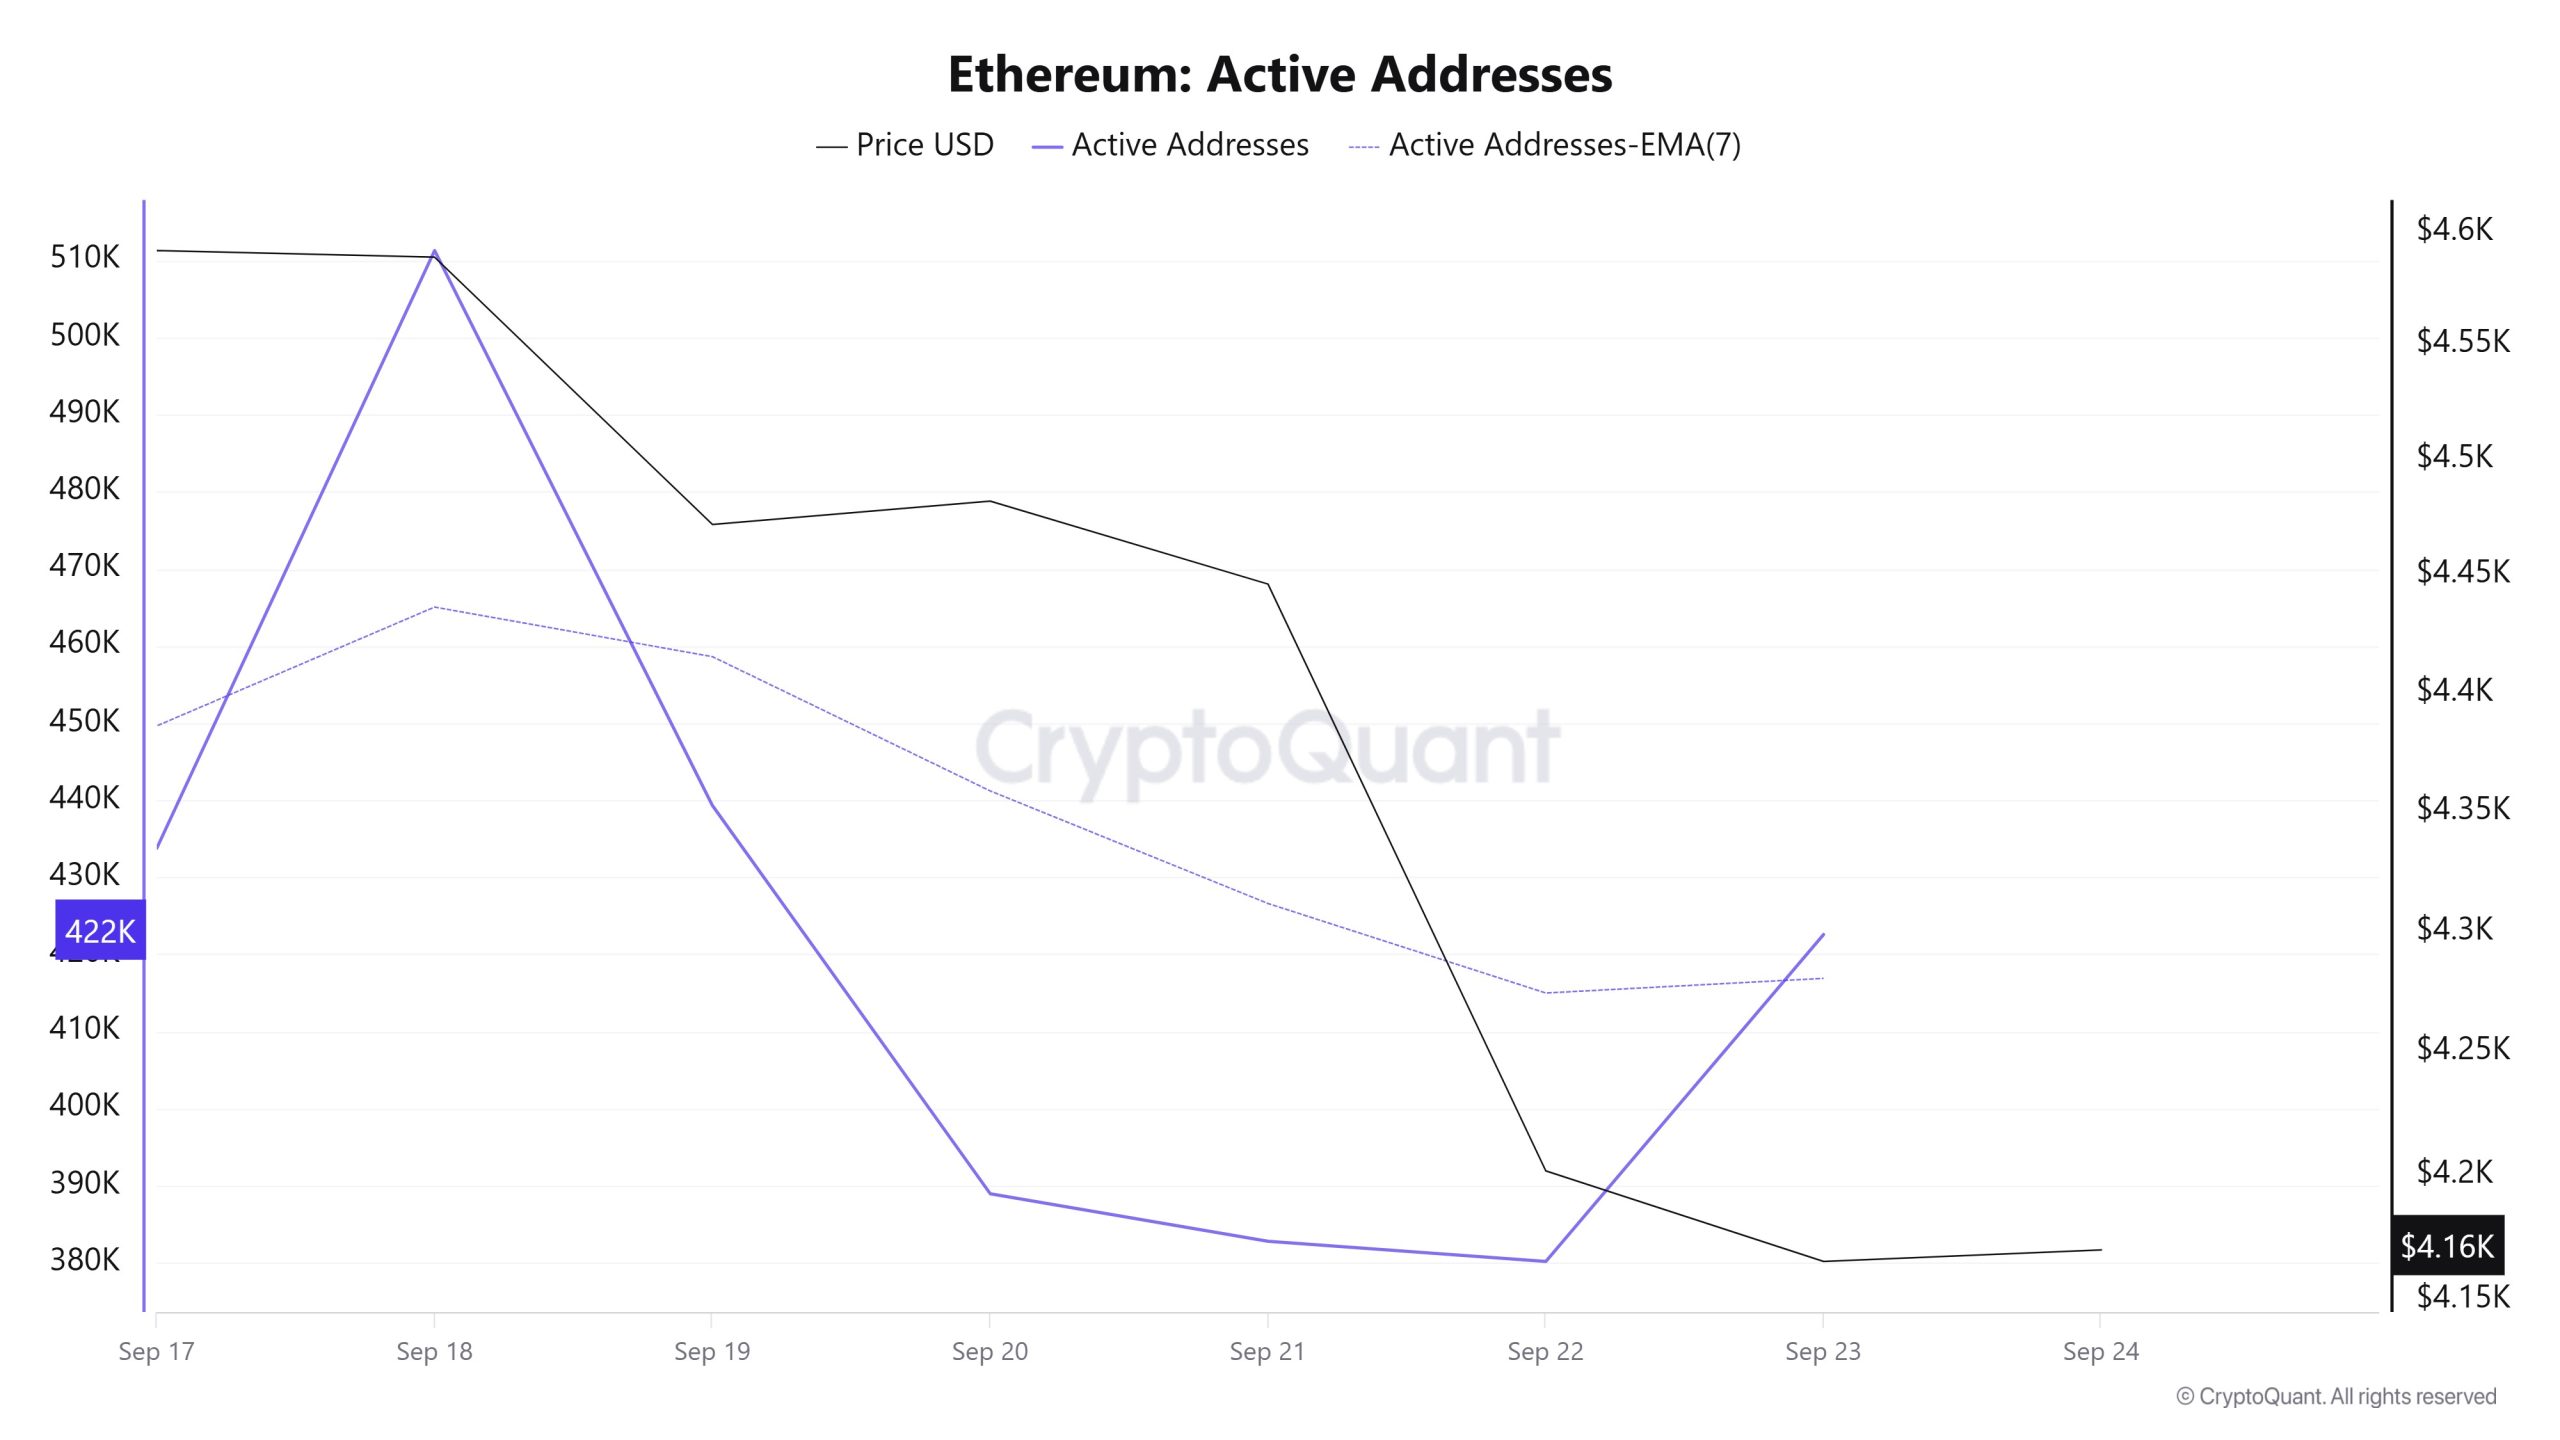
Between September 17 and September 24, a total of 511,295 active addresses entered the network. During this period, the Ethereum price dropped from $4,588 to $4,201. Especially on September 19, at the intersection of the price and the number of active addresses, the price started to fall along with the number of active addresses. When the 7-day simple moving average (SMA) is analyzed, it is seen that the Ethereum price is generally consolidating horizontally.
Active Sending Addresses
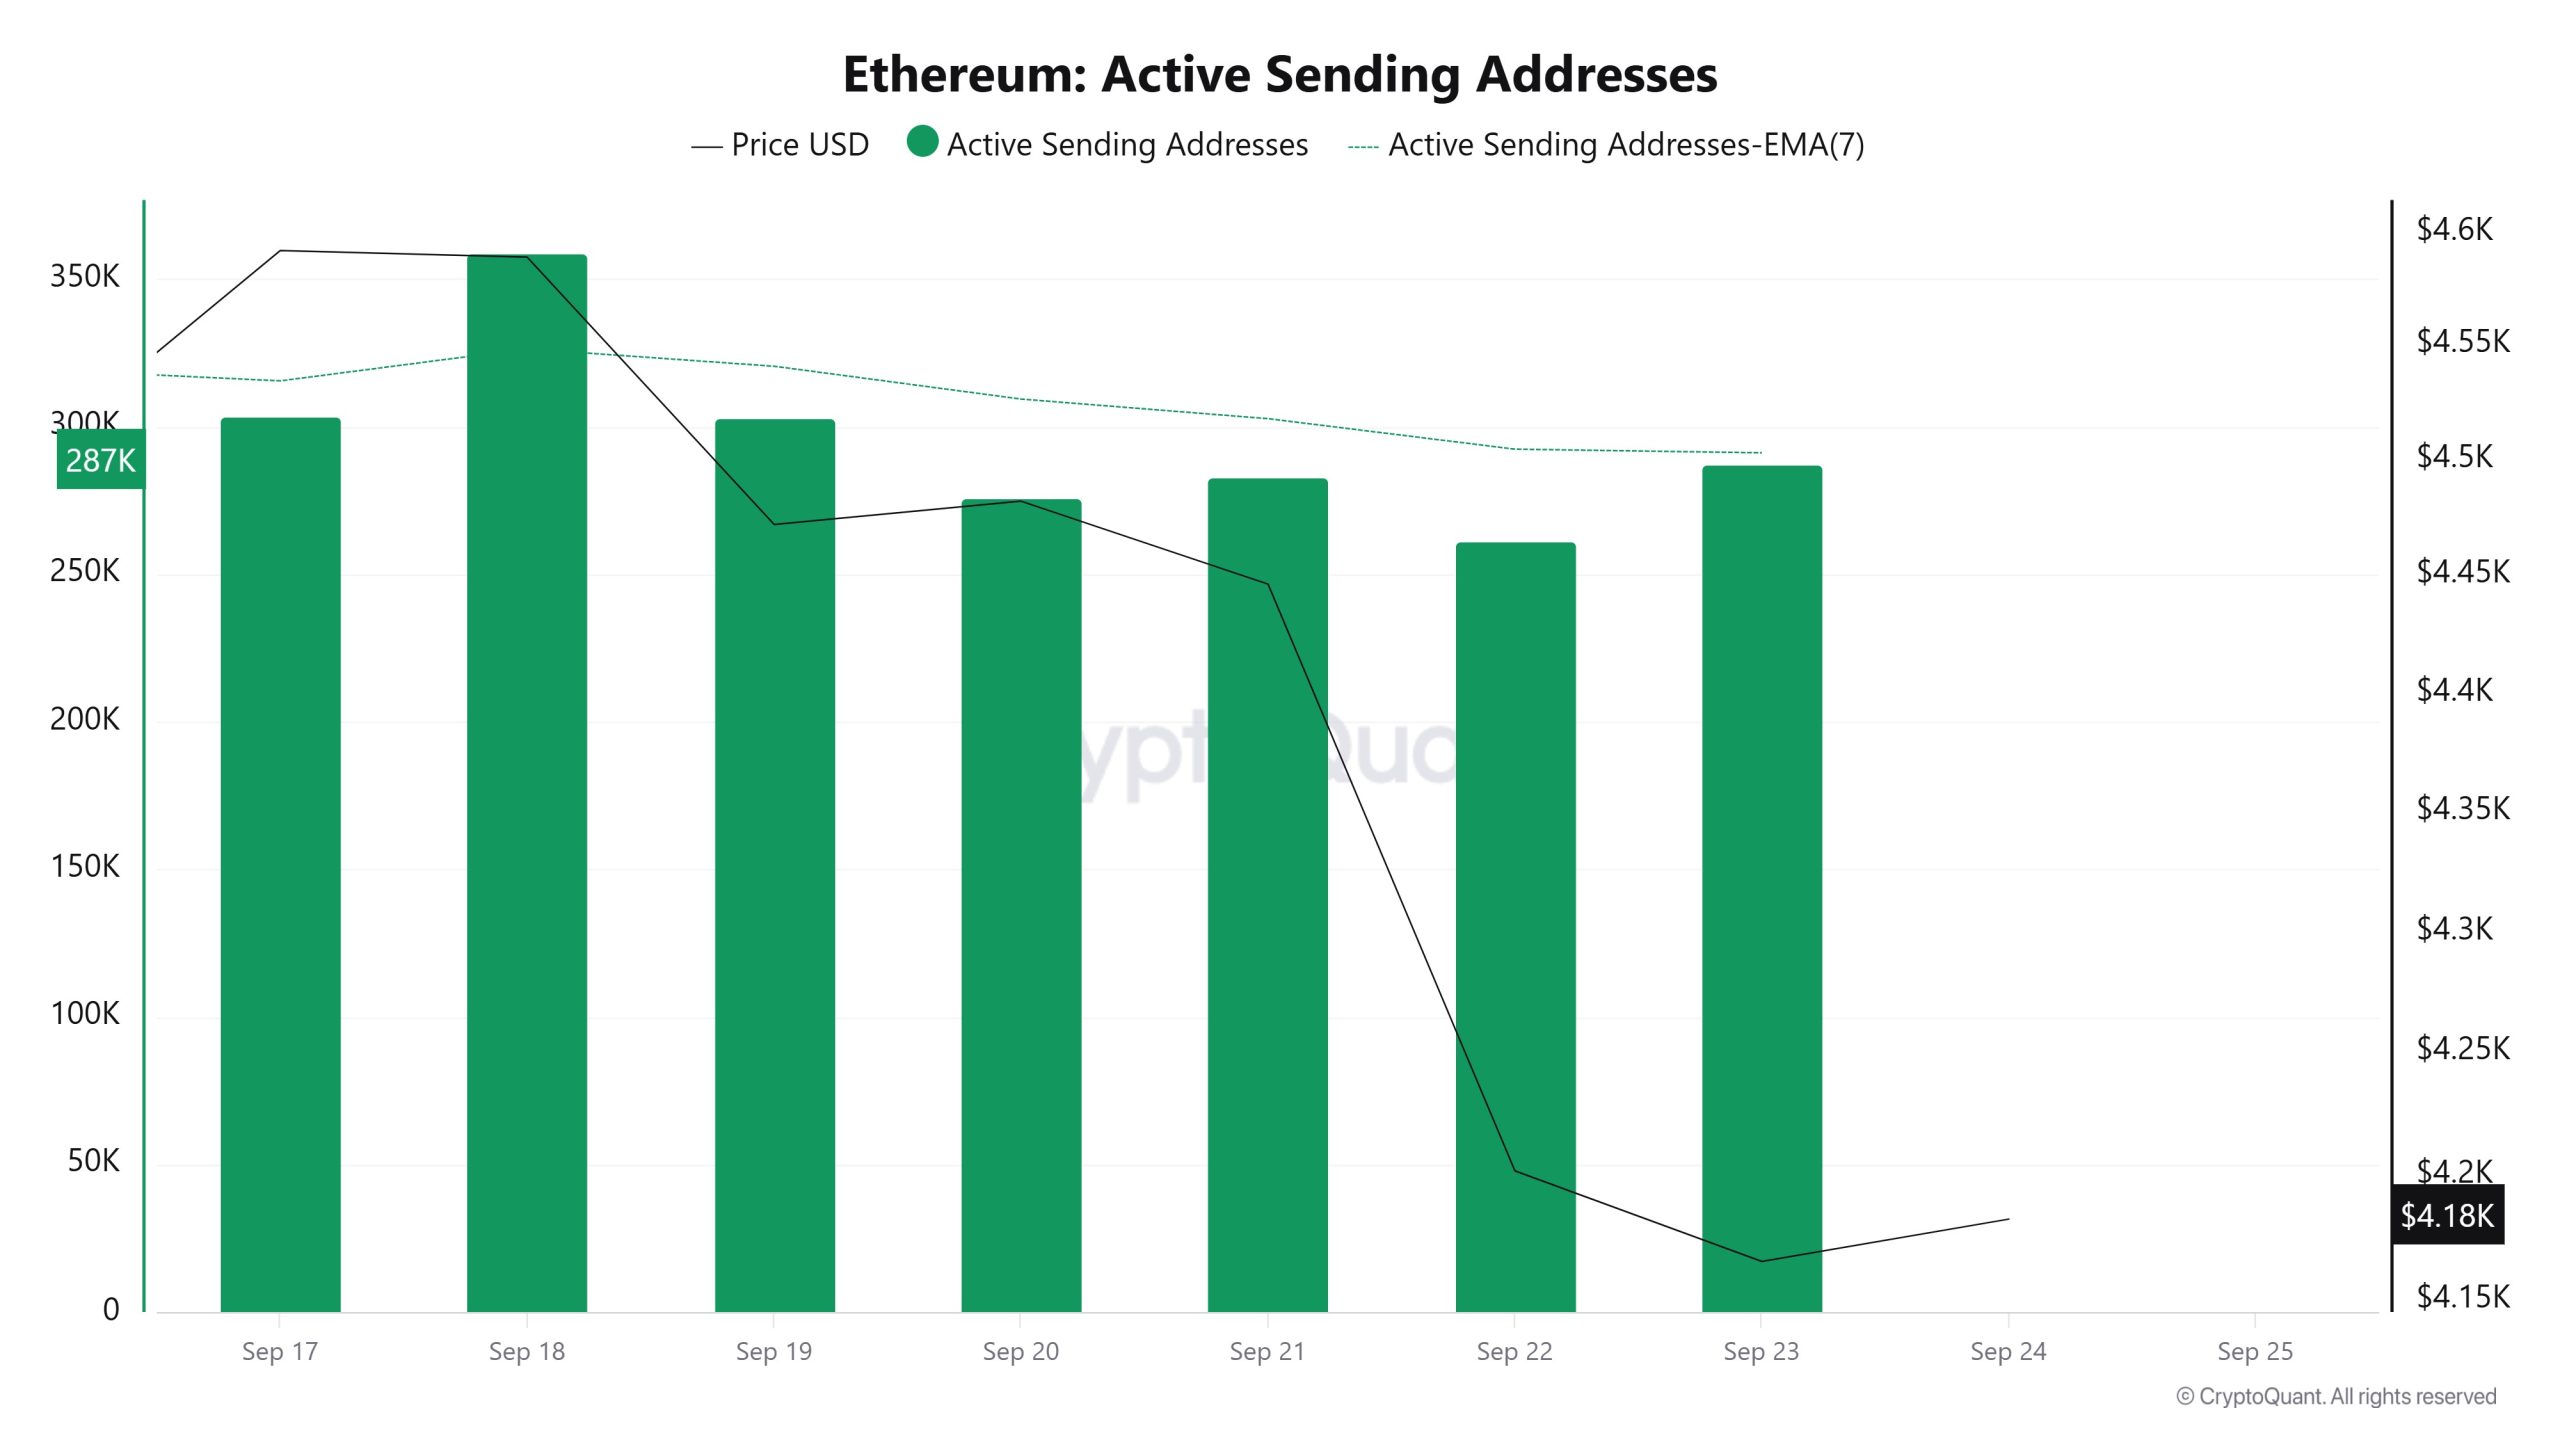
Between September 17th and September 24th, a high level of active sending activity was observed along with the Black Line (price line) in active shipping addresses. On the day when the price reached a weekly high, active shipping addresses reached 358,766.
Active Receiving Addresses
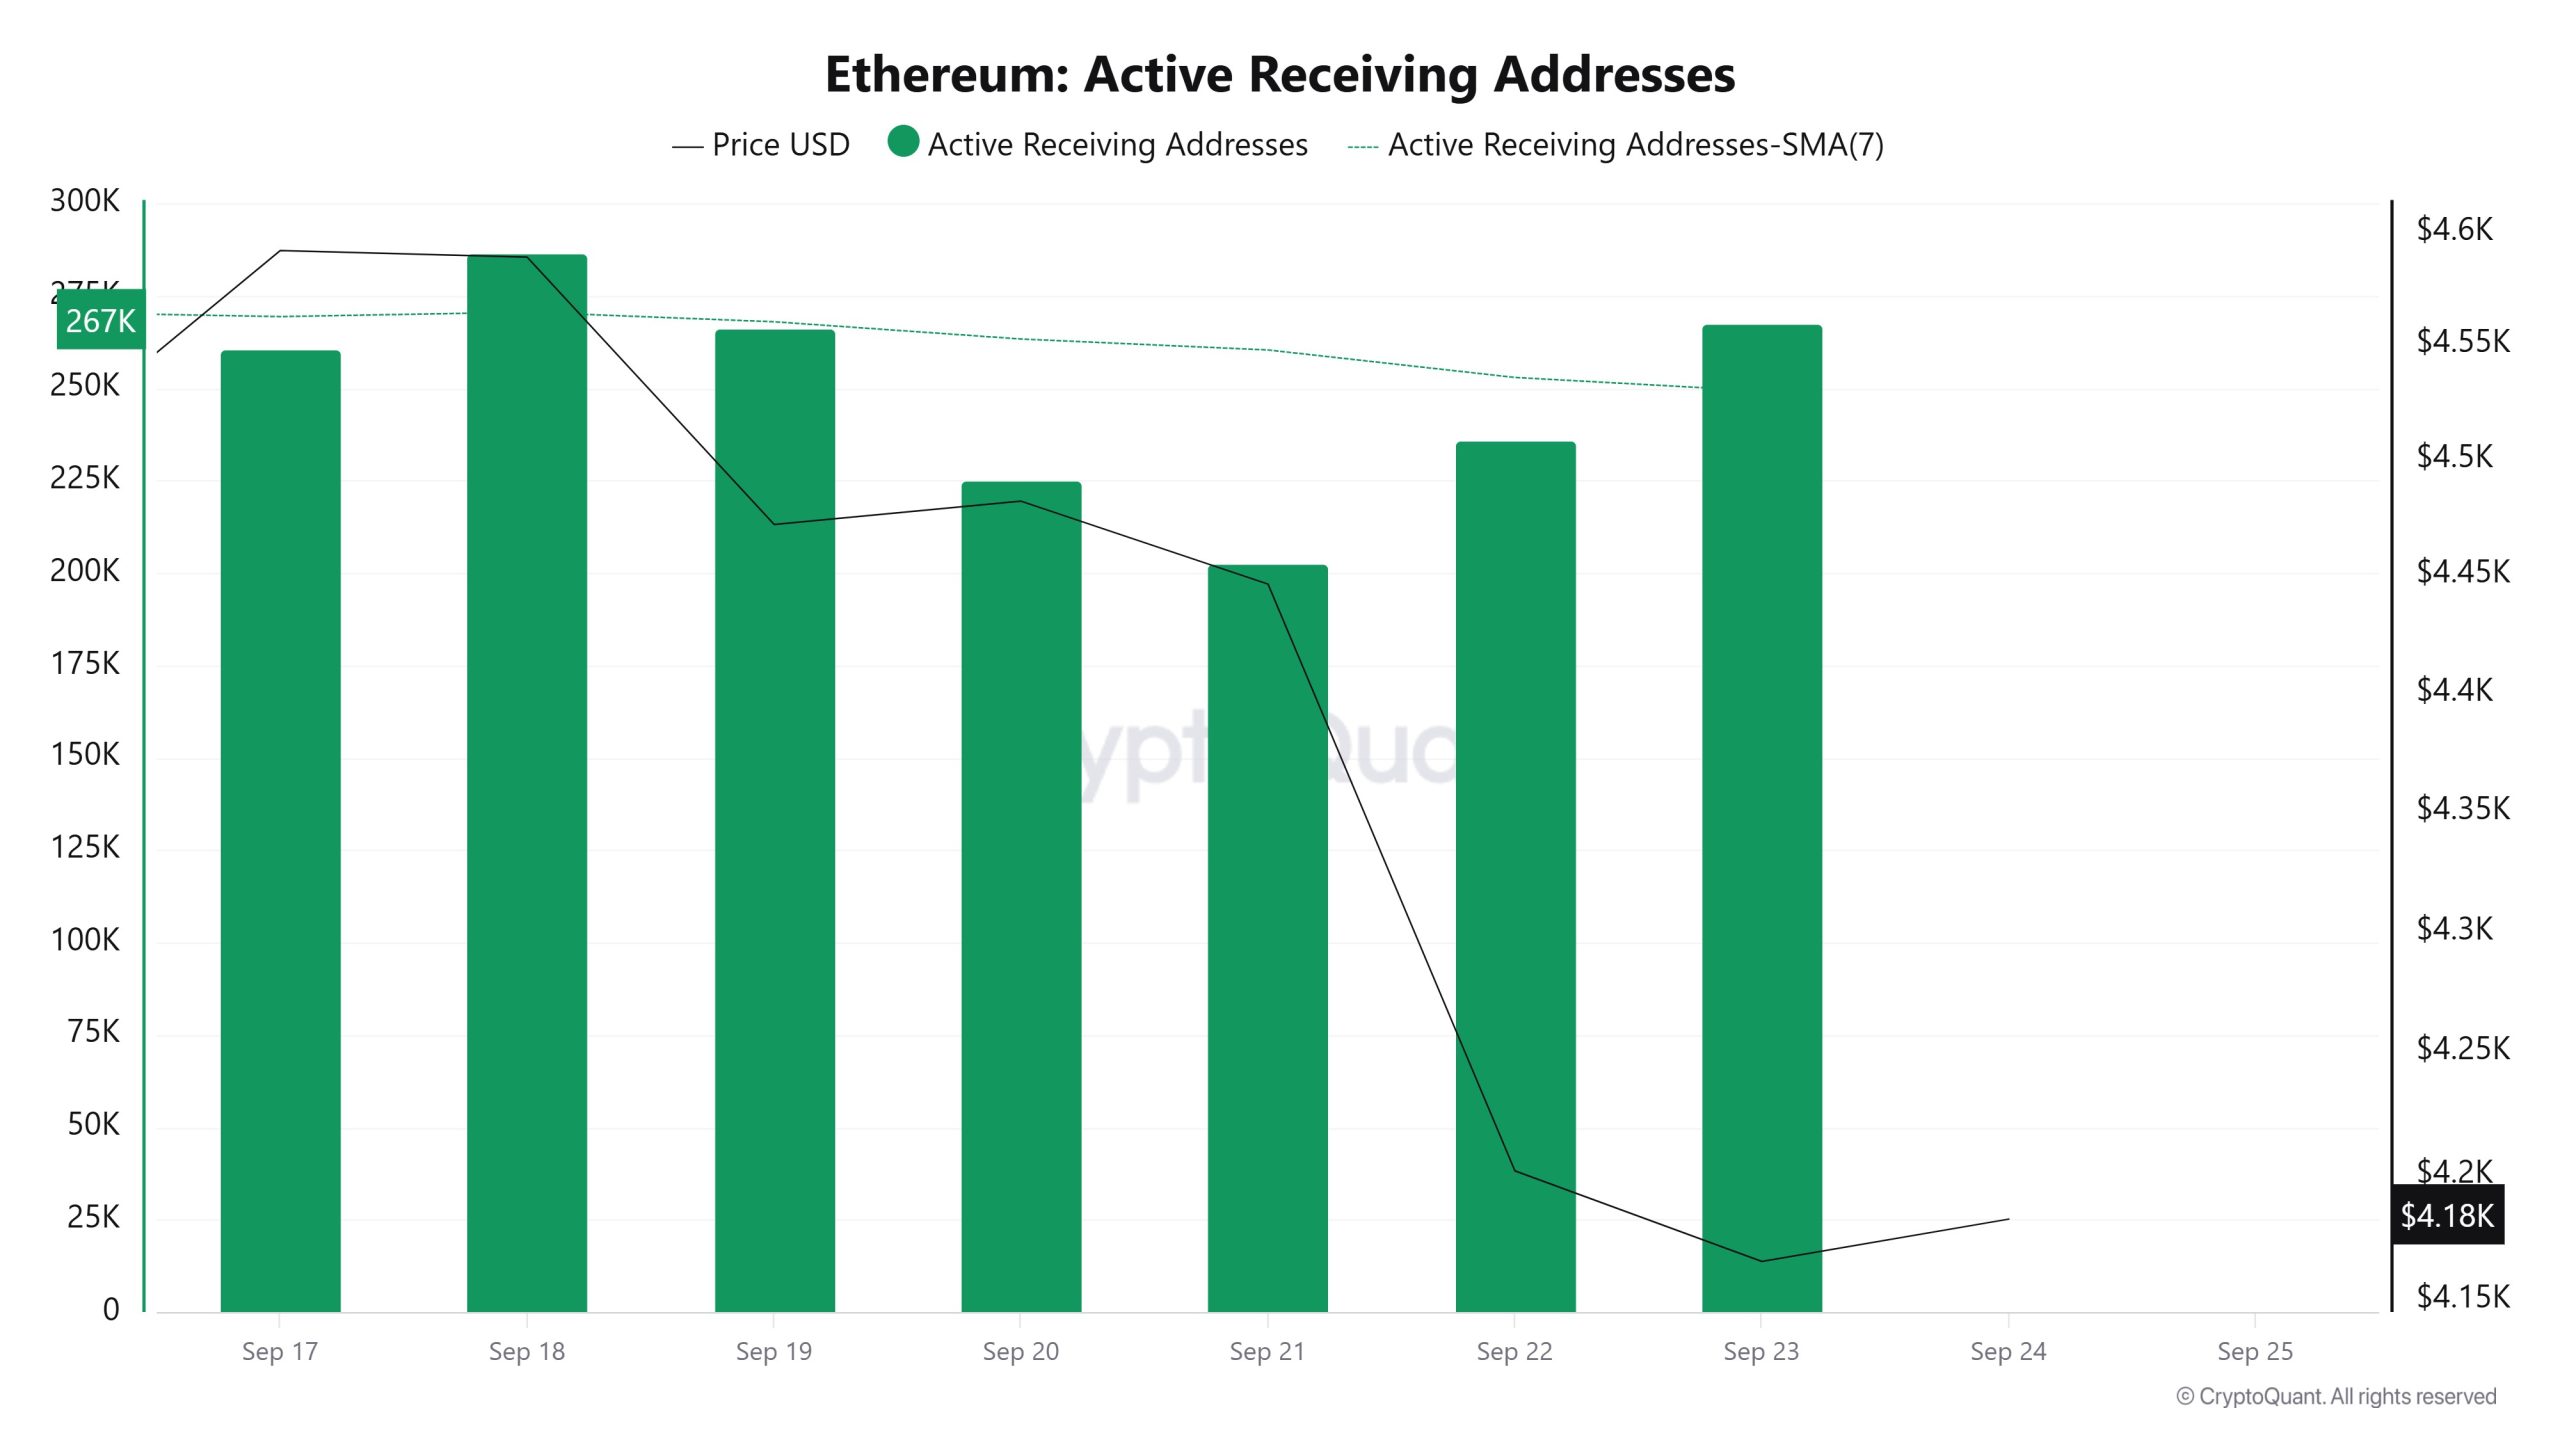
Between September 17 and September 24, there was no significant increase in active buying addresses and the price consolidated horizontally. On the day when the price reached its highest level, active receiving addresses reached 260,569, indicating that purchases were limited.
Derivatives
Open Interest
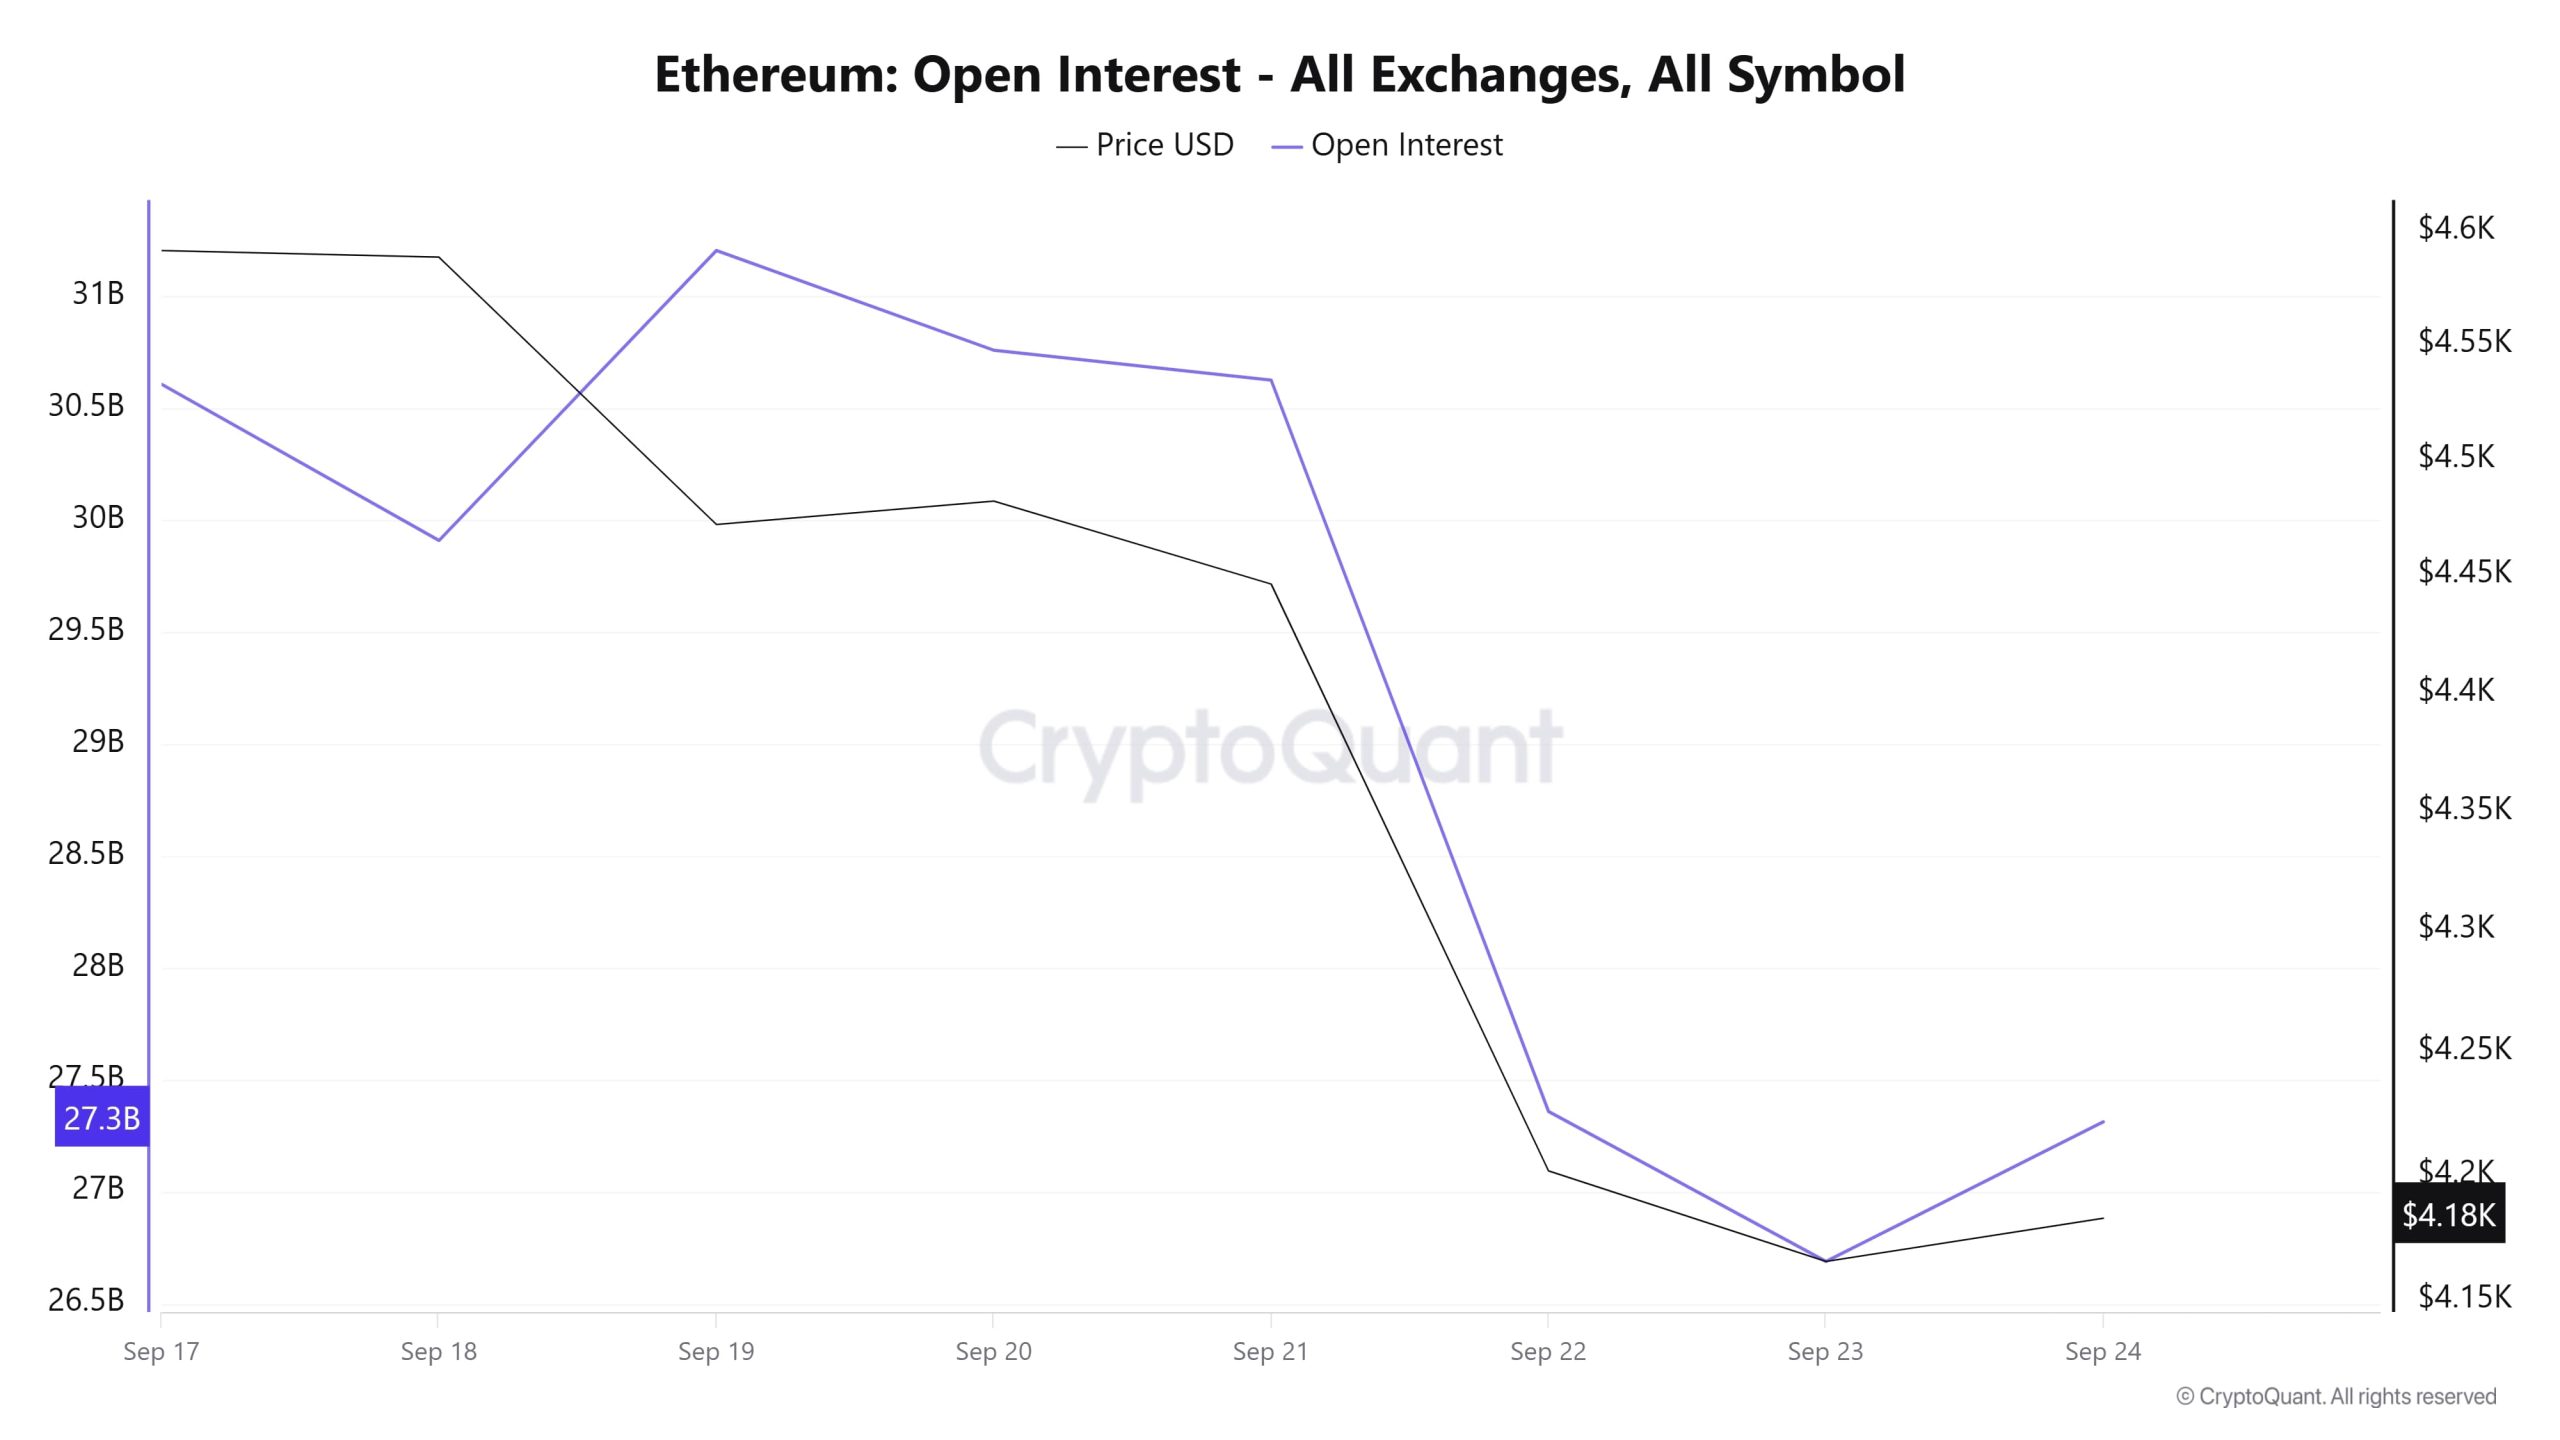
On September 17, the price hovers around $4,550 while open interest stands at around $30.5 billion. On September 18, although the price remained flat, open interest briefly declined, before rising again on September 19 to exceed $31 billion. After September 20-21, both price and open interest enter a downward trend. On September 22-23, the price drops to around $4,100 and open interest falls to $27.3 billion. On September 24, there is a limited rebound in both, with the price at $4,180 and open interest back towards $27.5 billion. Overall, the chart shows that during price declines, traders tend to close positions and open interest moves in tandem with price.
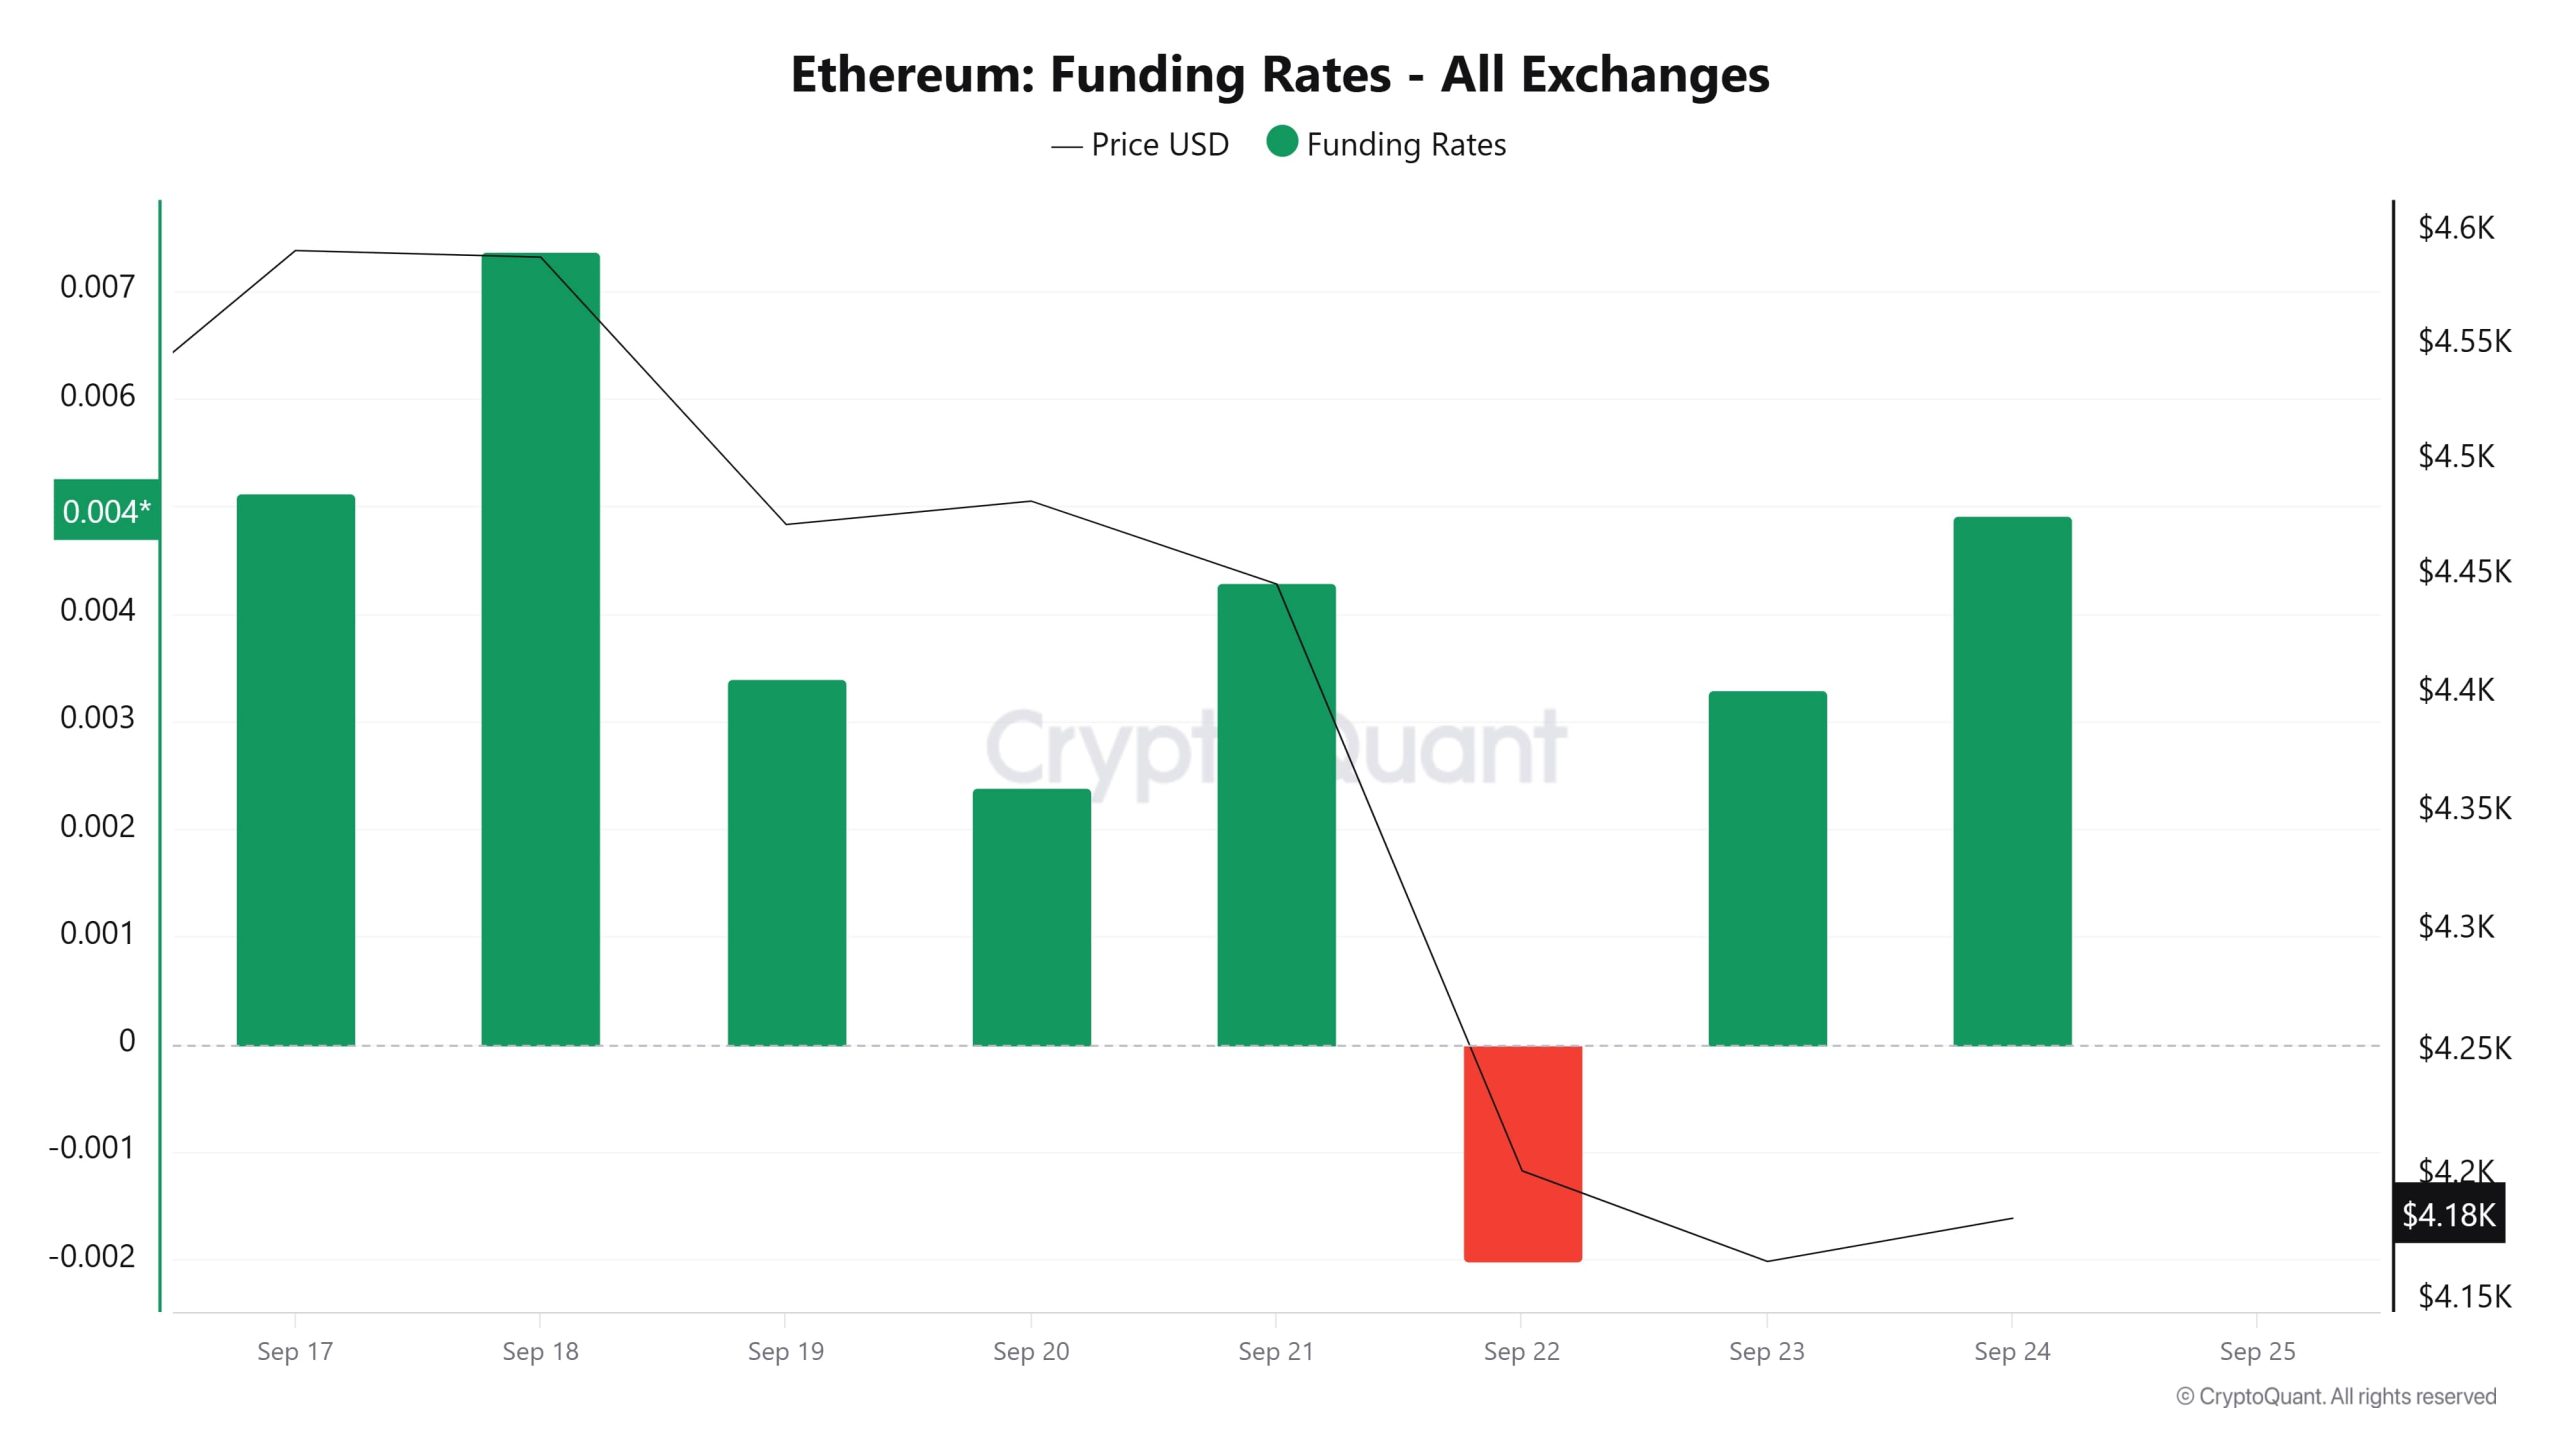
Funding Rate
When Ethereum’s funding rate data is analyzed, it is seen that it was predominantly positive between September 17-21 but turned negative on September 22 and fell to -0.002 for a short time. Meanwhile, the price retreated from around $4,600 to around $4,100 on September 24. The negative funding rate supported the downward movement of the price as the pressure on long positions decreased and short expectations strengthened. After September 23, the funding rate turned positive again, while the price struggled to hold at $4,100. The overall outlook reveals that the funding rate’s rapid directional changes are in line with short-term price movements and the market’s sentiment is quite sensitive.
Long & Short Liquidations
With the ETH price falling from $4,600 to below $4,100, approximately $811 million of long positions were liquidated. Another $170 million worth of short positions were liquidated in the same timeframe.
| Dates | Long Amount (Million $) | Short Amount (Million $) |
|---|---|---|
| September 17 | 70.11 | 66.60 |
| September 18 | 41.03 | 25.44 |
| September 19 | 152.80 | 7.28 |
| September 20 | 4.90 | 3.95 |
| September 21 | 25.43 | 9.52 |
| September 22 | 467.29 | 37.92 |
| September 23 | 50.08 | 20.25 |
| Total | 811.64 | 170.96 |
Supply Distribution
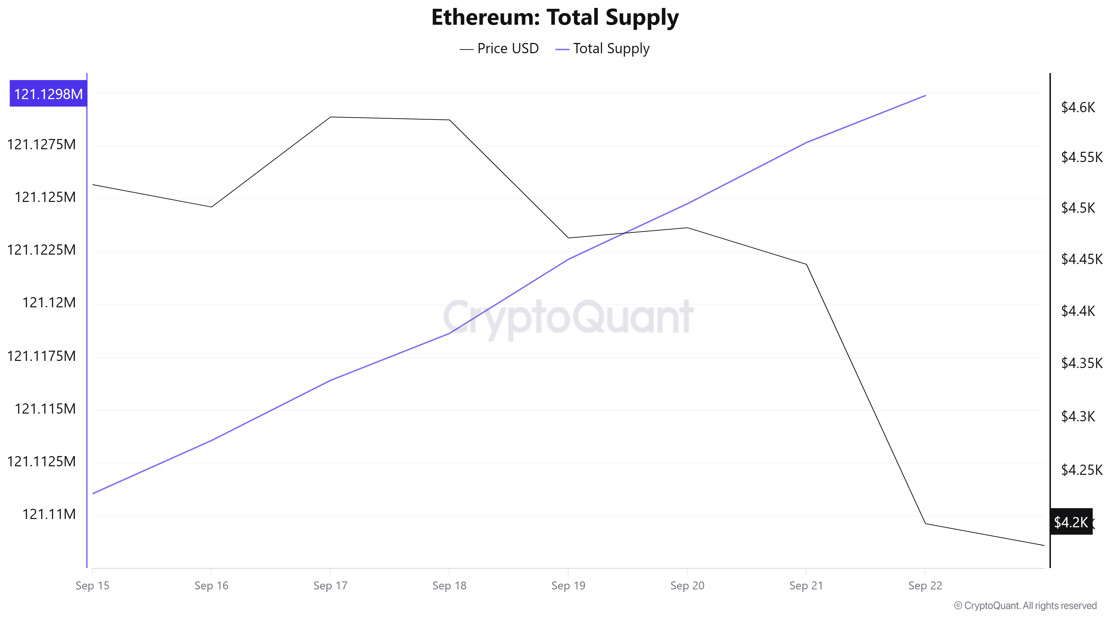
Total Supply: It reached 121,111,025 units, an increase of approximately 0.01556% compared to last week.
New Supply: The amount of ETH produced this week was 18,850.
Velocity: Velocity was 9.61 as of September 22, up from 9.55 last week.
| Wallet Category | 15.09.2025 | 22.09.2025 | Change (%) |
|---|---|---|---|
| 100 – 1k ETH | 8.4951M | 8.5036M | 0.1001% |
| 1k – 10k ETH | 13.1317M | 13.1203M | -0.0868% |
| 10k – 100k ETH | 20.8883M | 21.0765M | 0.9010% |
| 100k+ ETH | 4.2618M | 4.9009M | 14.9960% |
According to the latest weekly data, there is a bullish outlook in Ethereum wallet distribution. The 100-1k ETH range increased by 0.10%, while the 1k-10k ETH segment decreased by 0.09%. The 10k-100k ETH group saw an increase of 0.90%, while the 100k+ ETH category saw a much stronger increase of 15.00%.
Exchange Supply Ratio
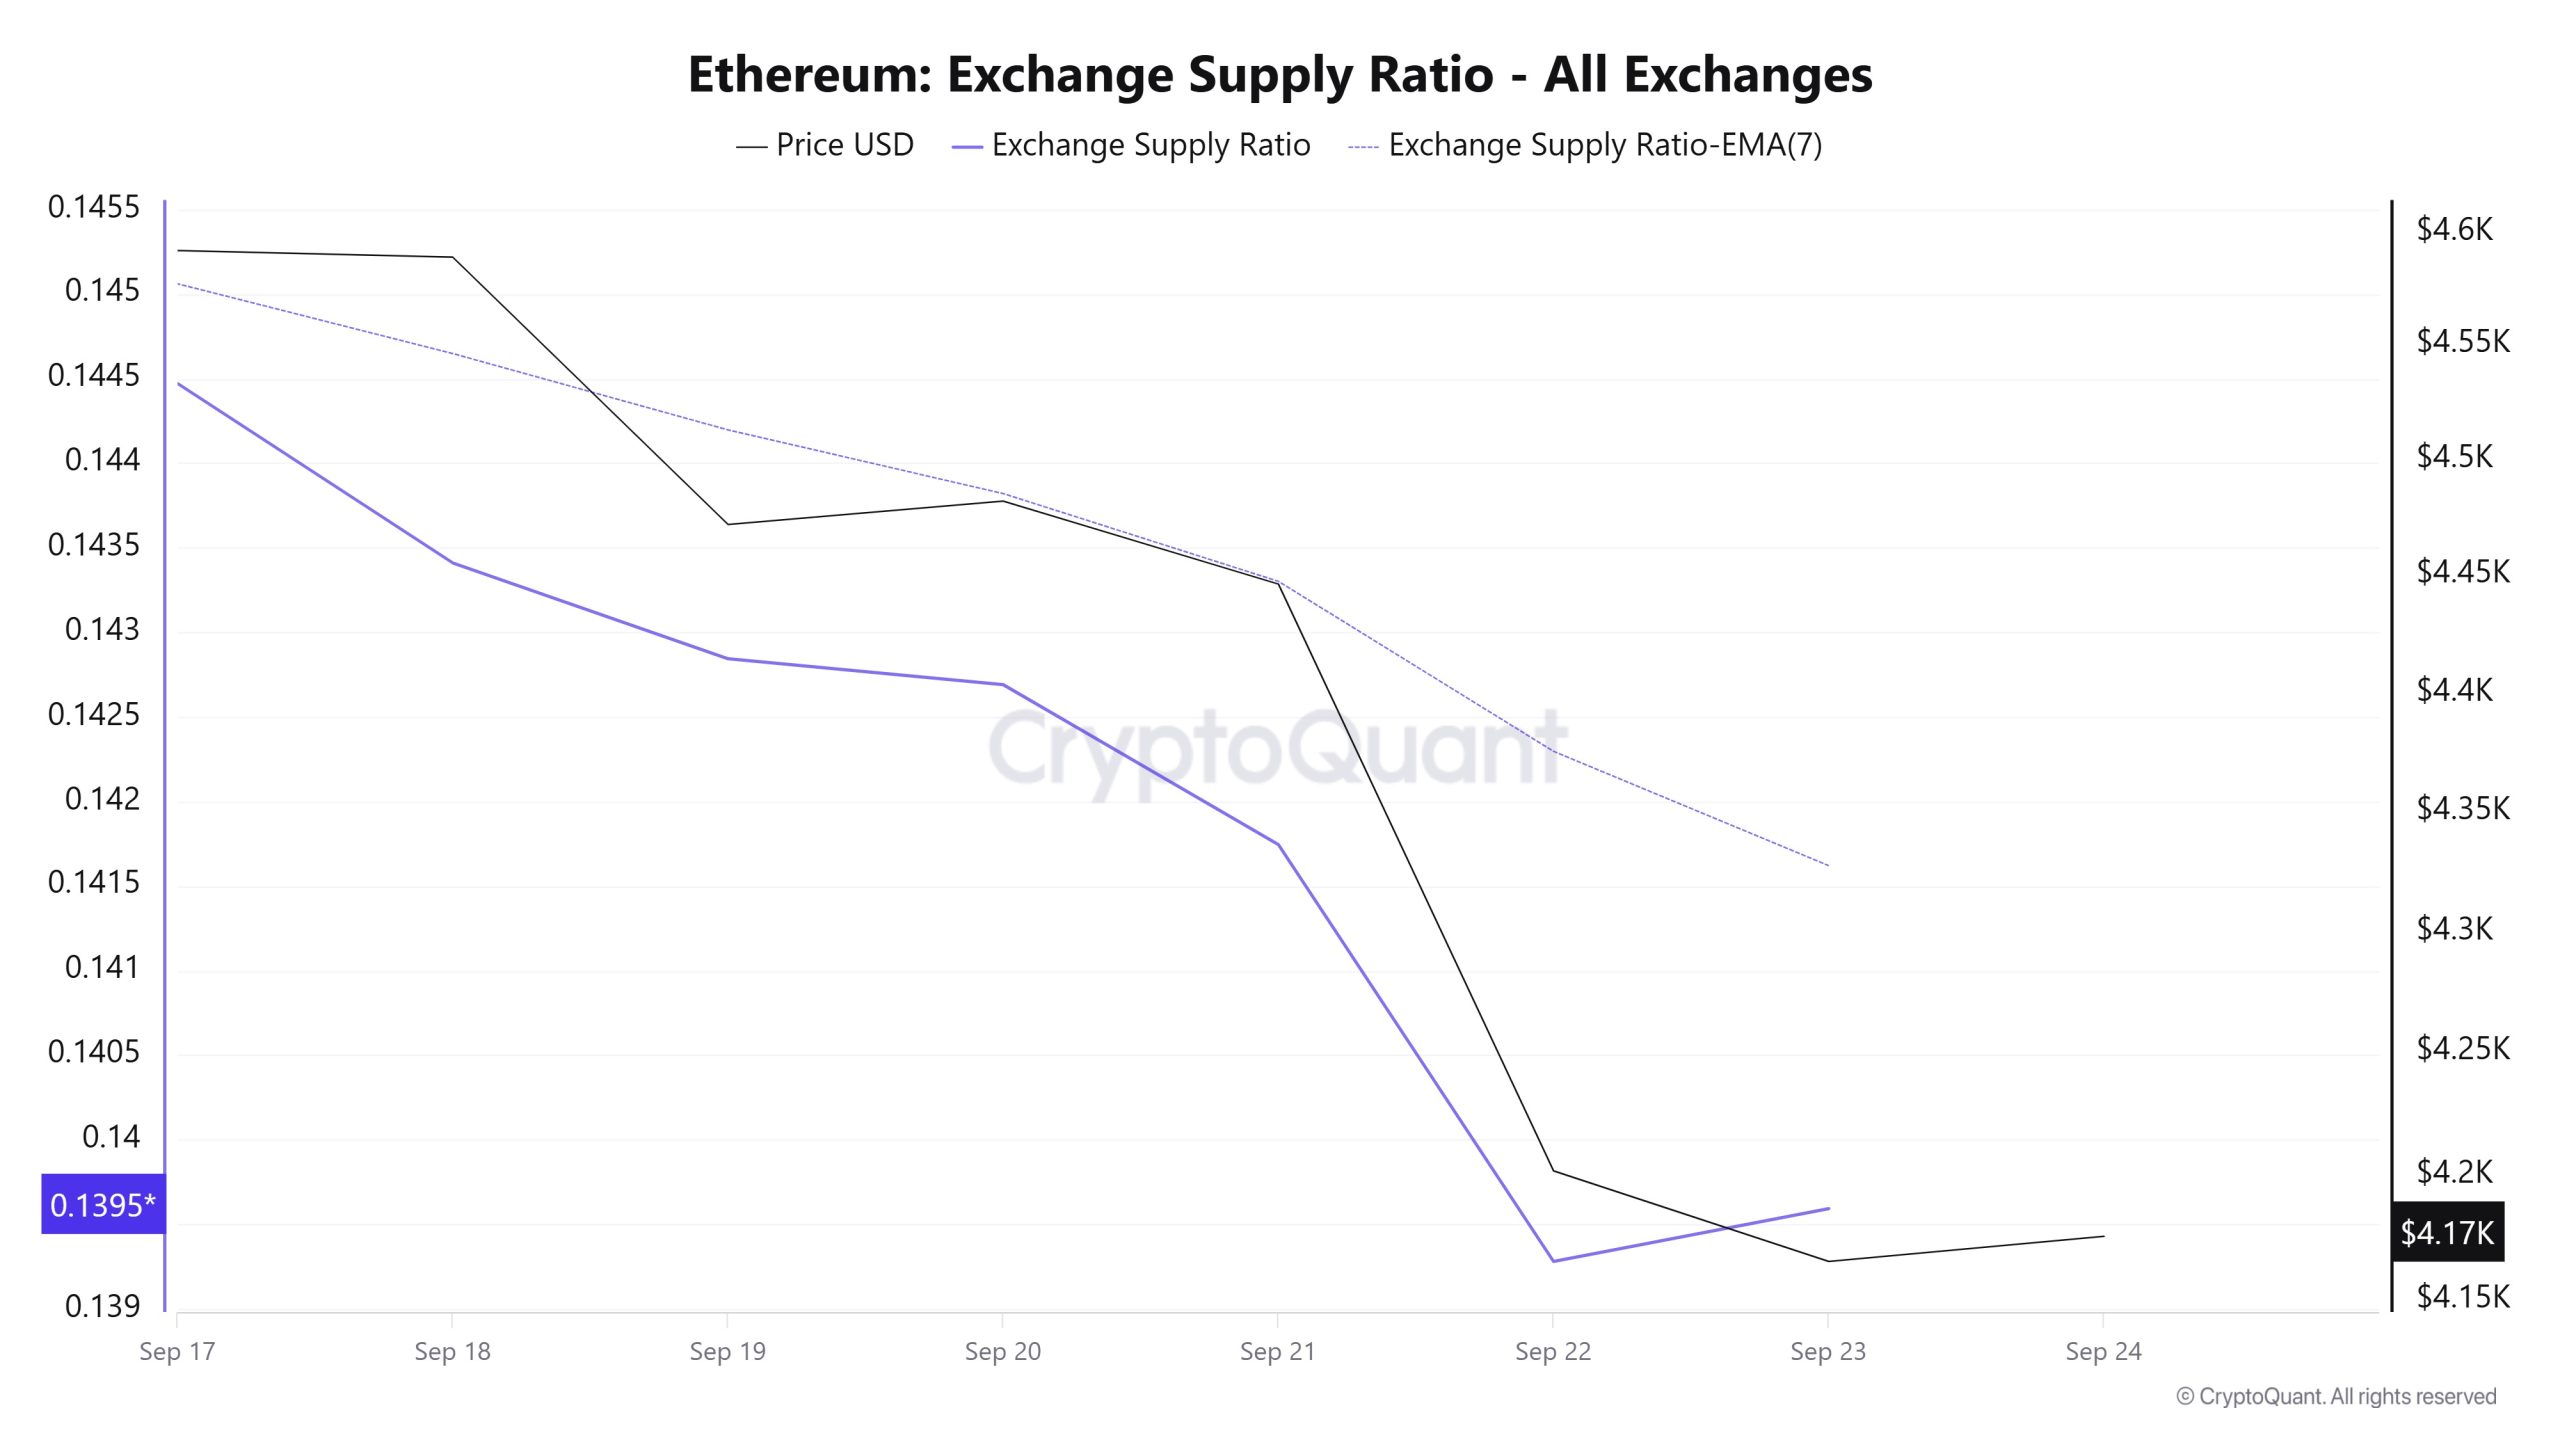
Between September 17th and 24th, as crypto assets continued to price the FED rate cut negatively , the Ethereum Exchange Supply Ratio dropped from 0.1447094 to 0.13959243. During this period, the Ethereum price dropped from $4,590 to $4,200. Especially this week, the positive correlation between the price and the Exchange Supply Ratio shows that despite the price decline, the amount of Ethereum supplied to exchanges has increased, possibly indicating that long-term investors continue to hold their assets. It is seen that a neutral expectation is generally dominant in the Ethereum price.
Exchange Reserve
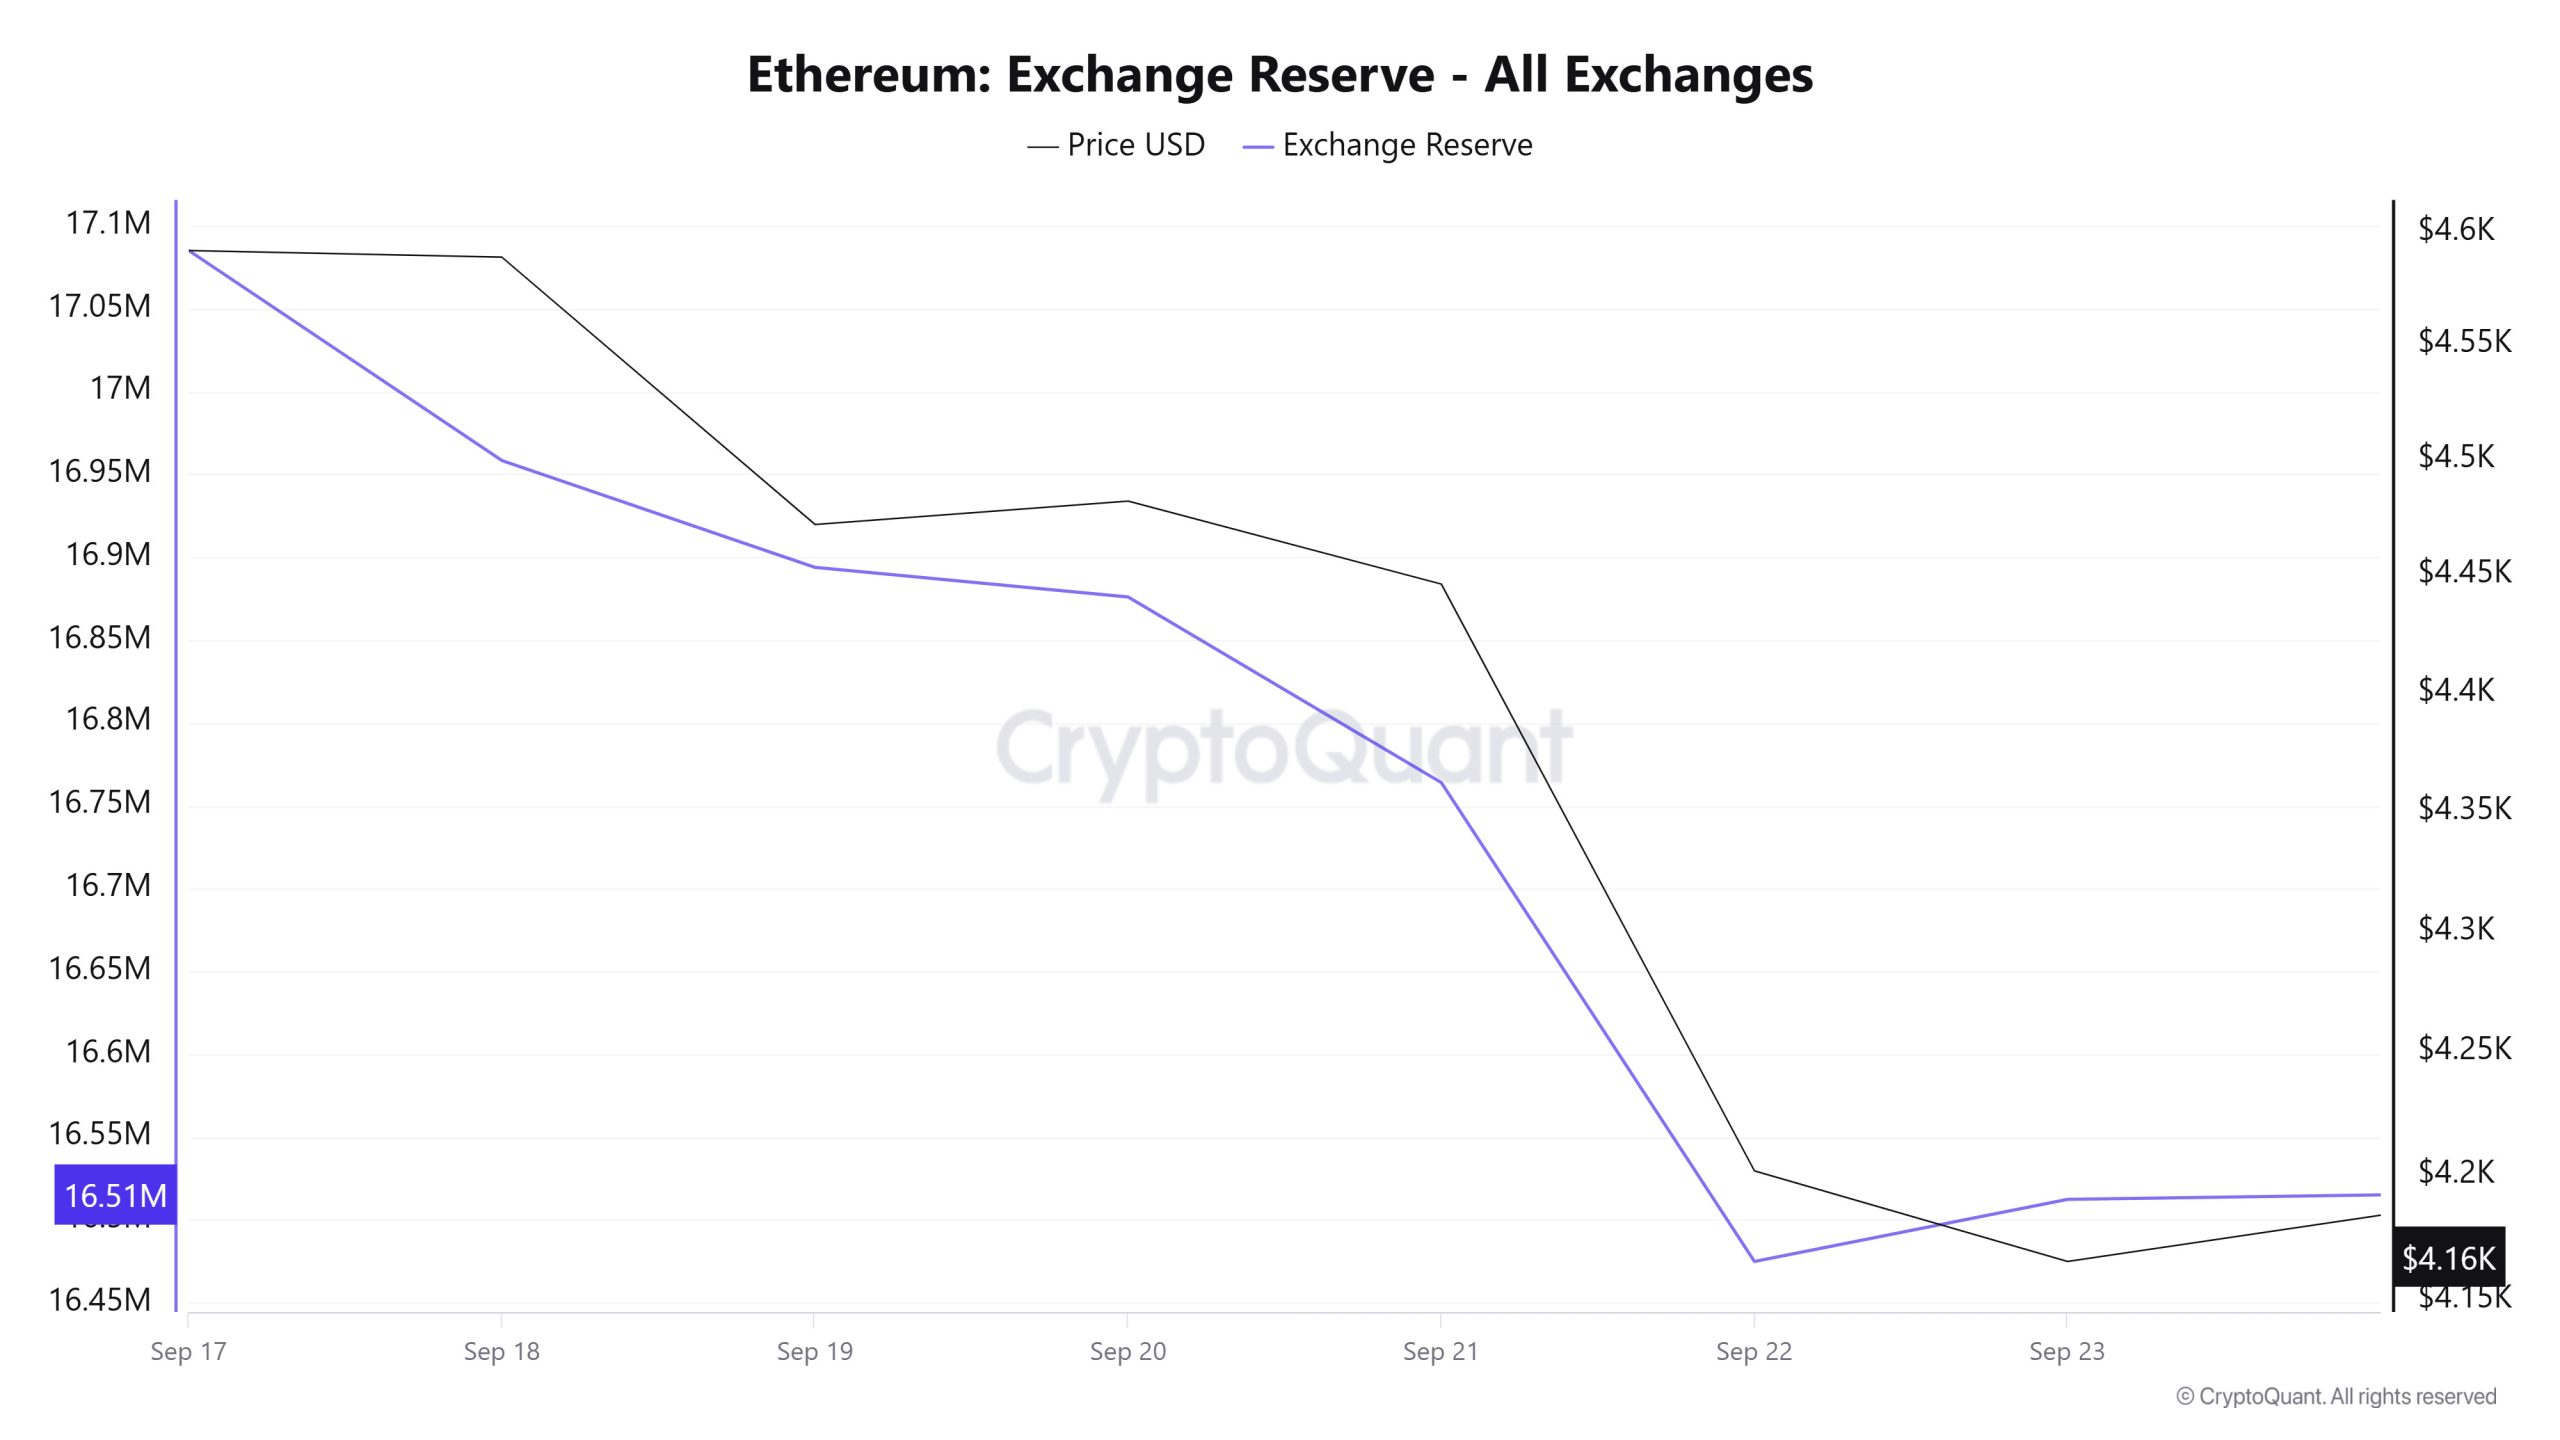
Between September 17-23, 2025, Ethereum reserves on exchanges decreased from 17,085,025 ETH to 16,512,464 ETH, with a total net outflow of 572,561 ETH. During this period, reserves decreased by approximately 3.35%. In the same period, the Ethereum price fell from $4,502 to $4,165, a loss of about 7.49%. The sharp drop in exchange reserves as the price fell suggests that investors are more inclined to withdraw their assets from exchanges rather than sell. This indicates that despite market uncertainty, investors are adopting a long-term holding strategy rather than panic selling. Although this contraction on the supply side is insufficient to support the price in the short term, it can be considered as a positive signal in the medium-long term.
Fees and Revenues
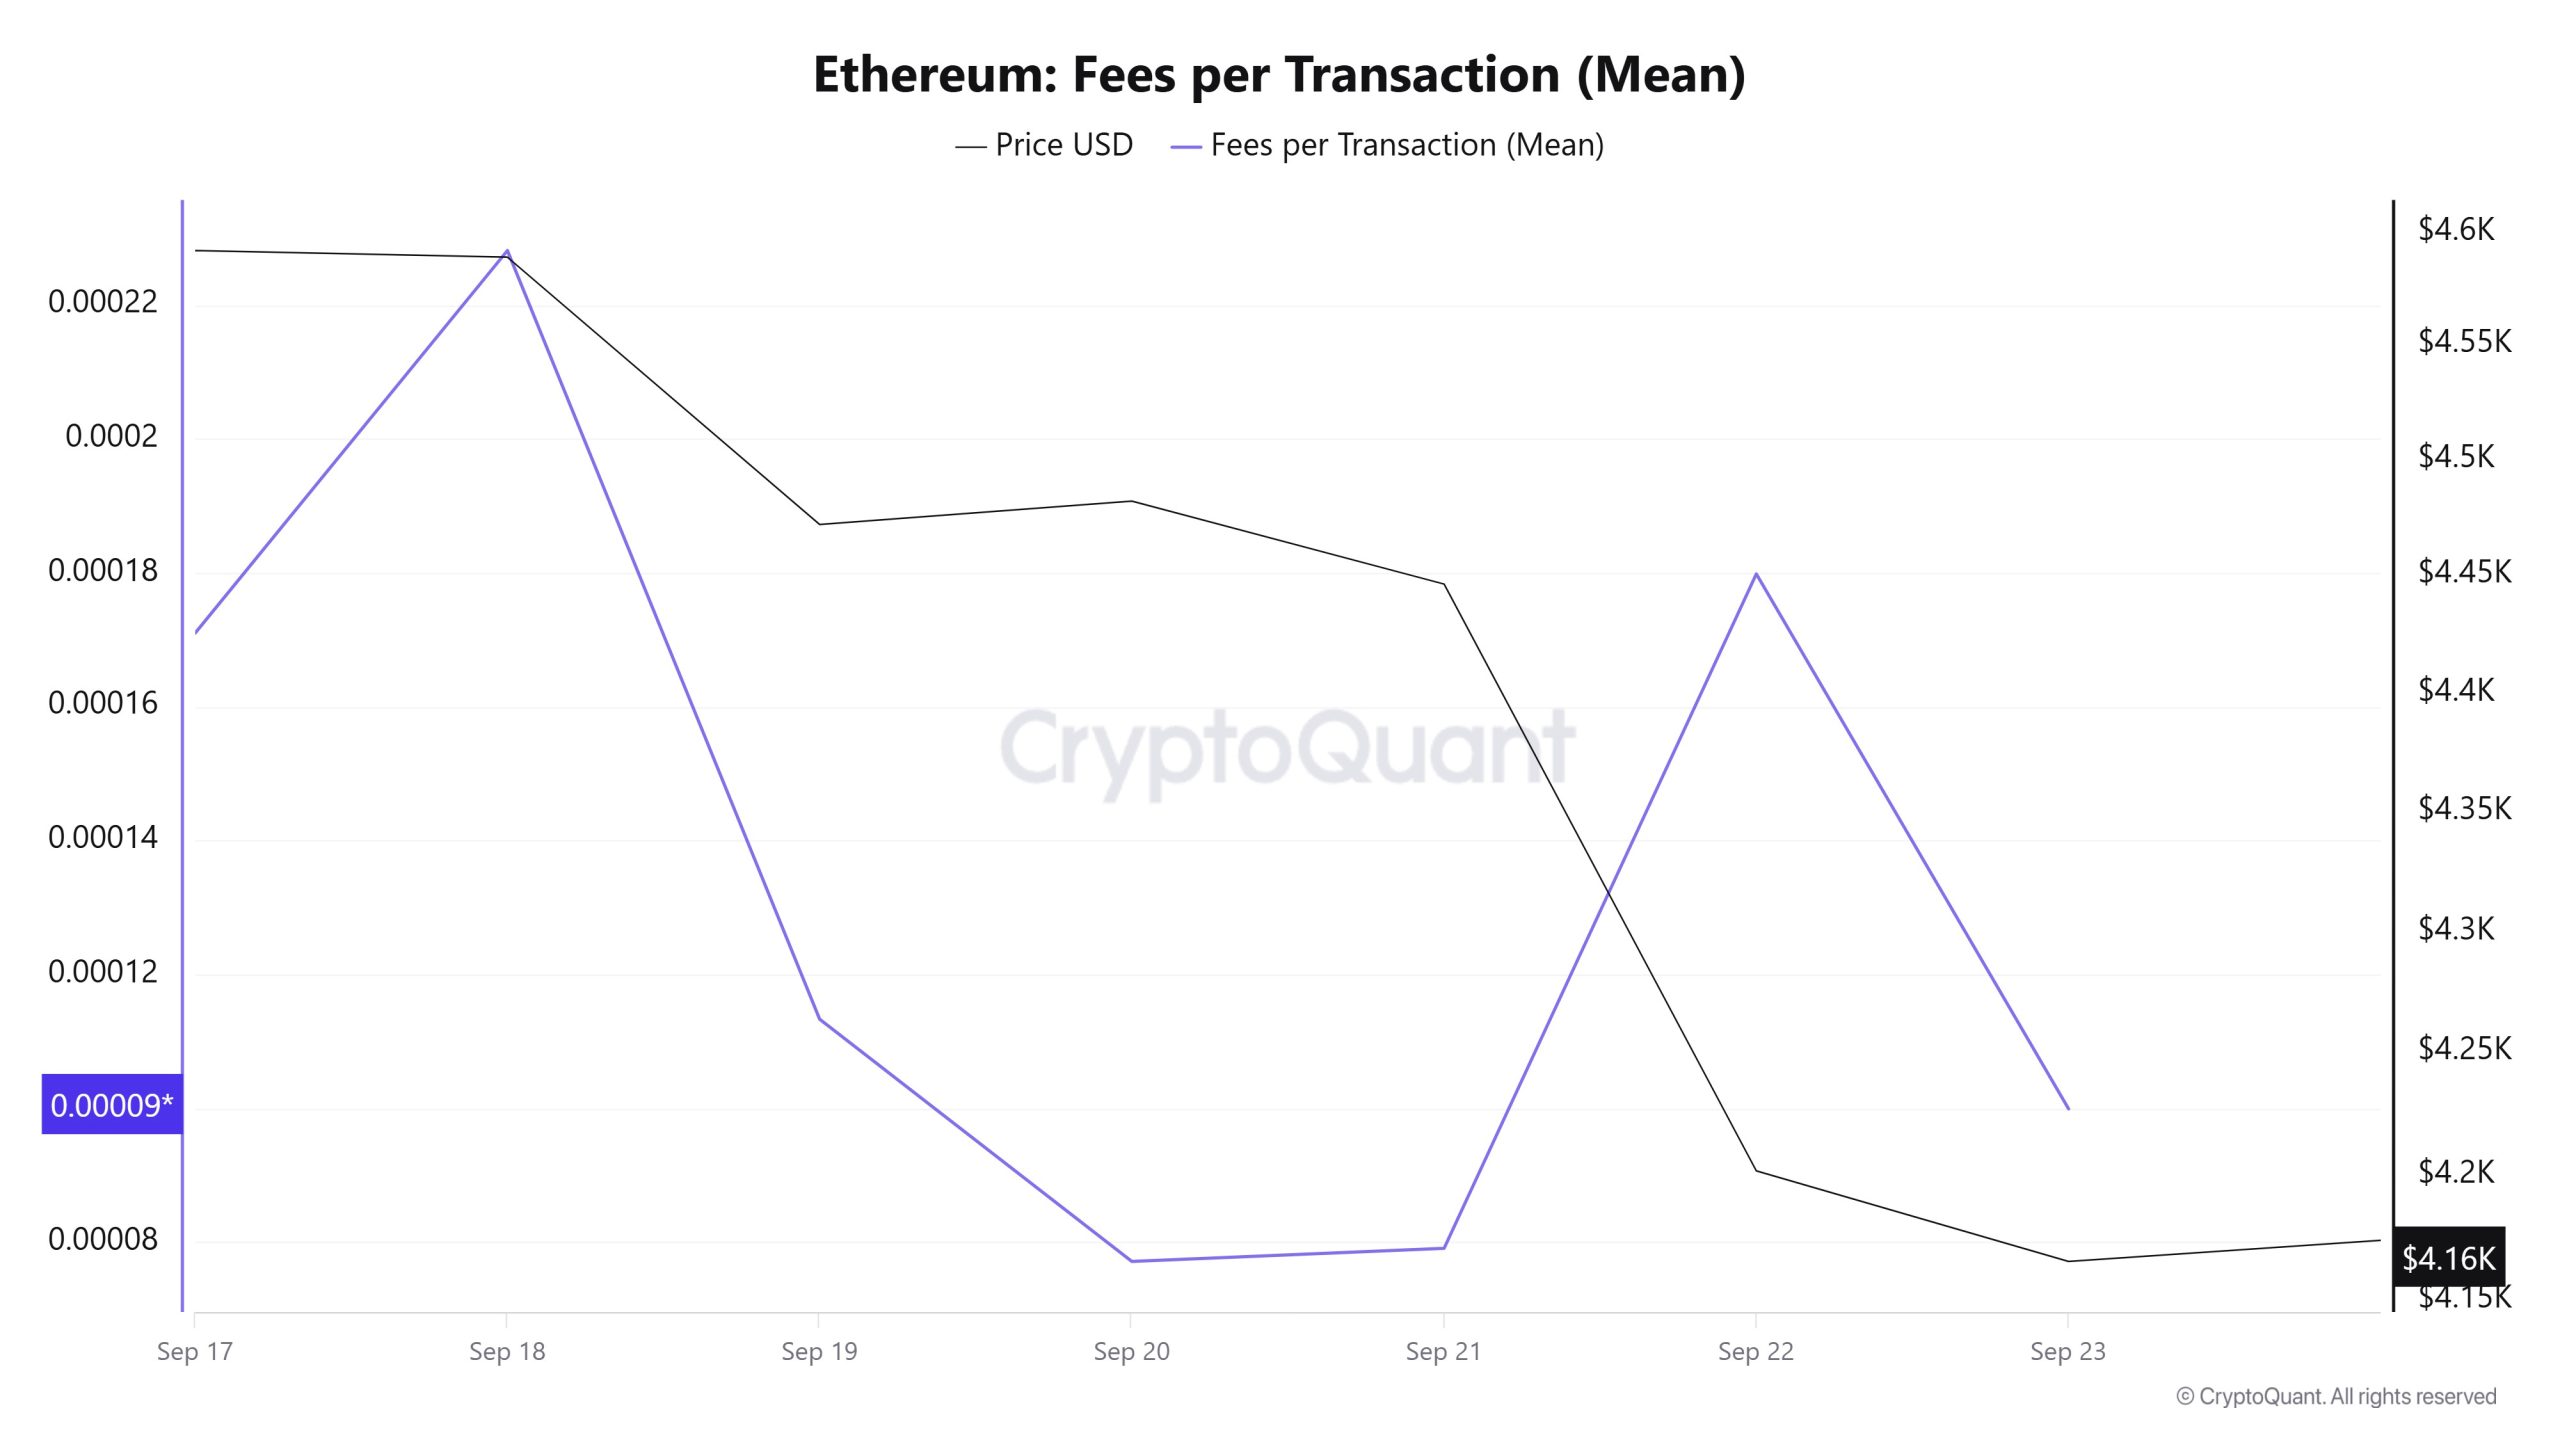
When the Ethereum Fees per Transaction (Mean) data between September 17 and 23 are analyzed, it is seen that the indicator was realized at 0.00017098047910941 on September 17, the first day of the week.
After this date, it followed a fluctuating course due to the volatility in Ethereum price. On September 20, it fell to 0.000077114700954995, recording the lowest value of the week.
In the following days, the Ethereum Fees per Transaction (Mean) indicator resumed its upward trend and closed at 0.000099906210565612 on September 23, the last day of the week.
Ethereum: Fees (Total)
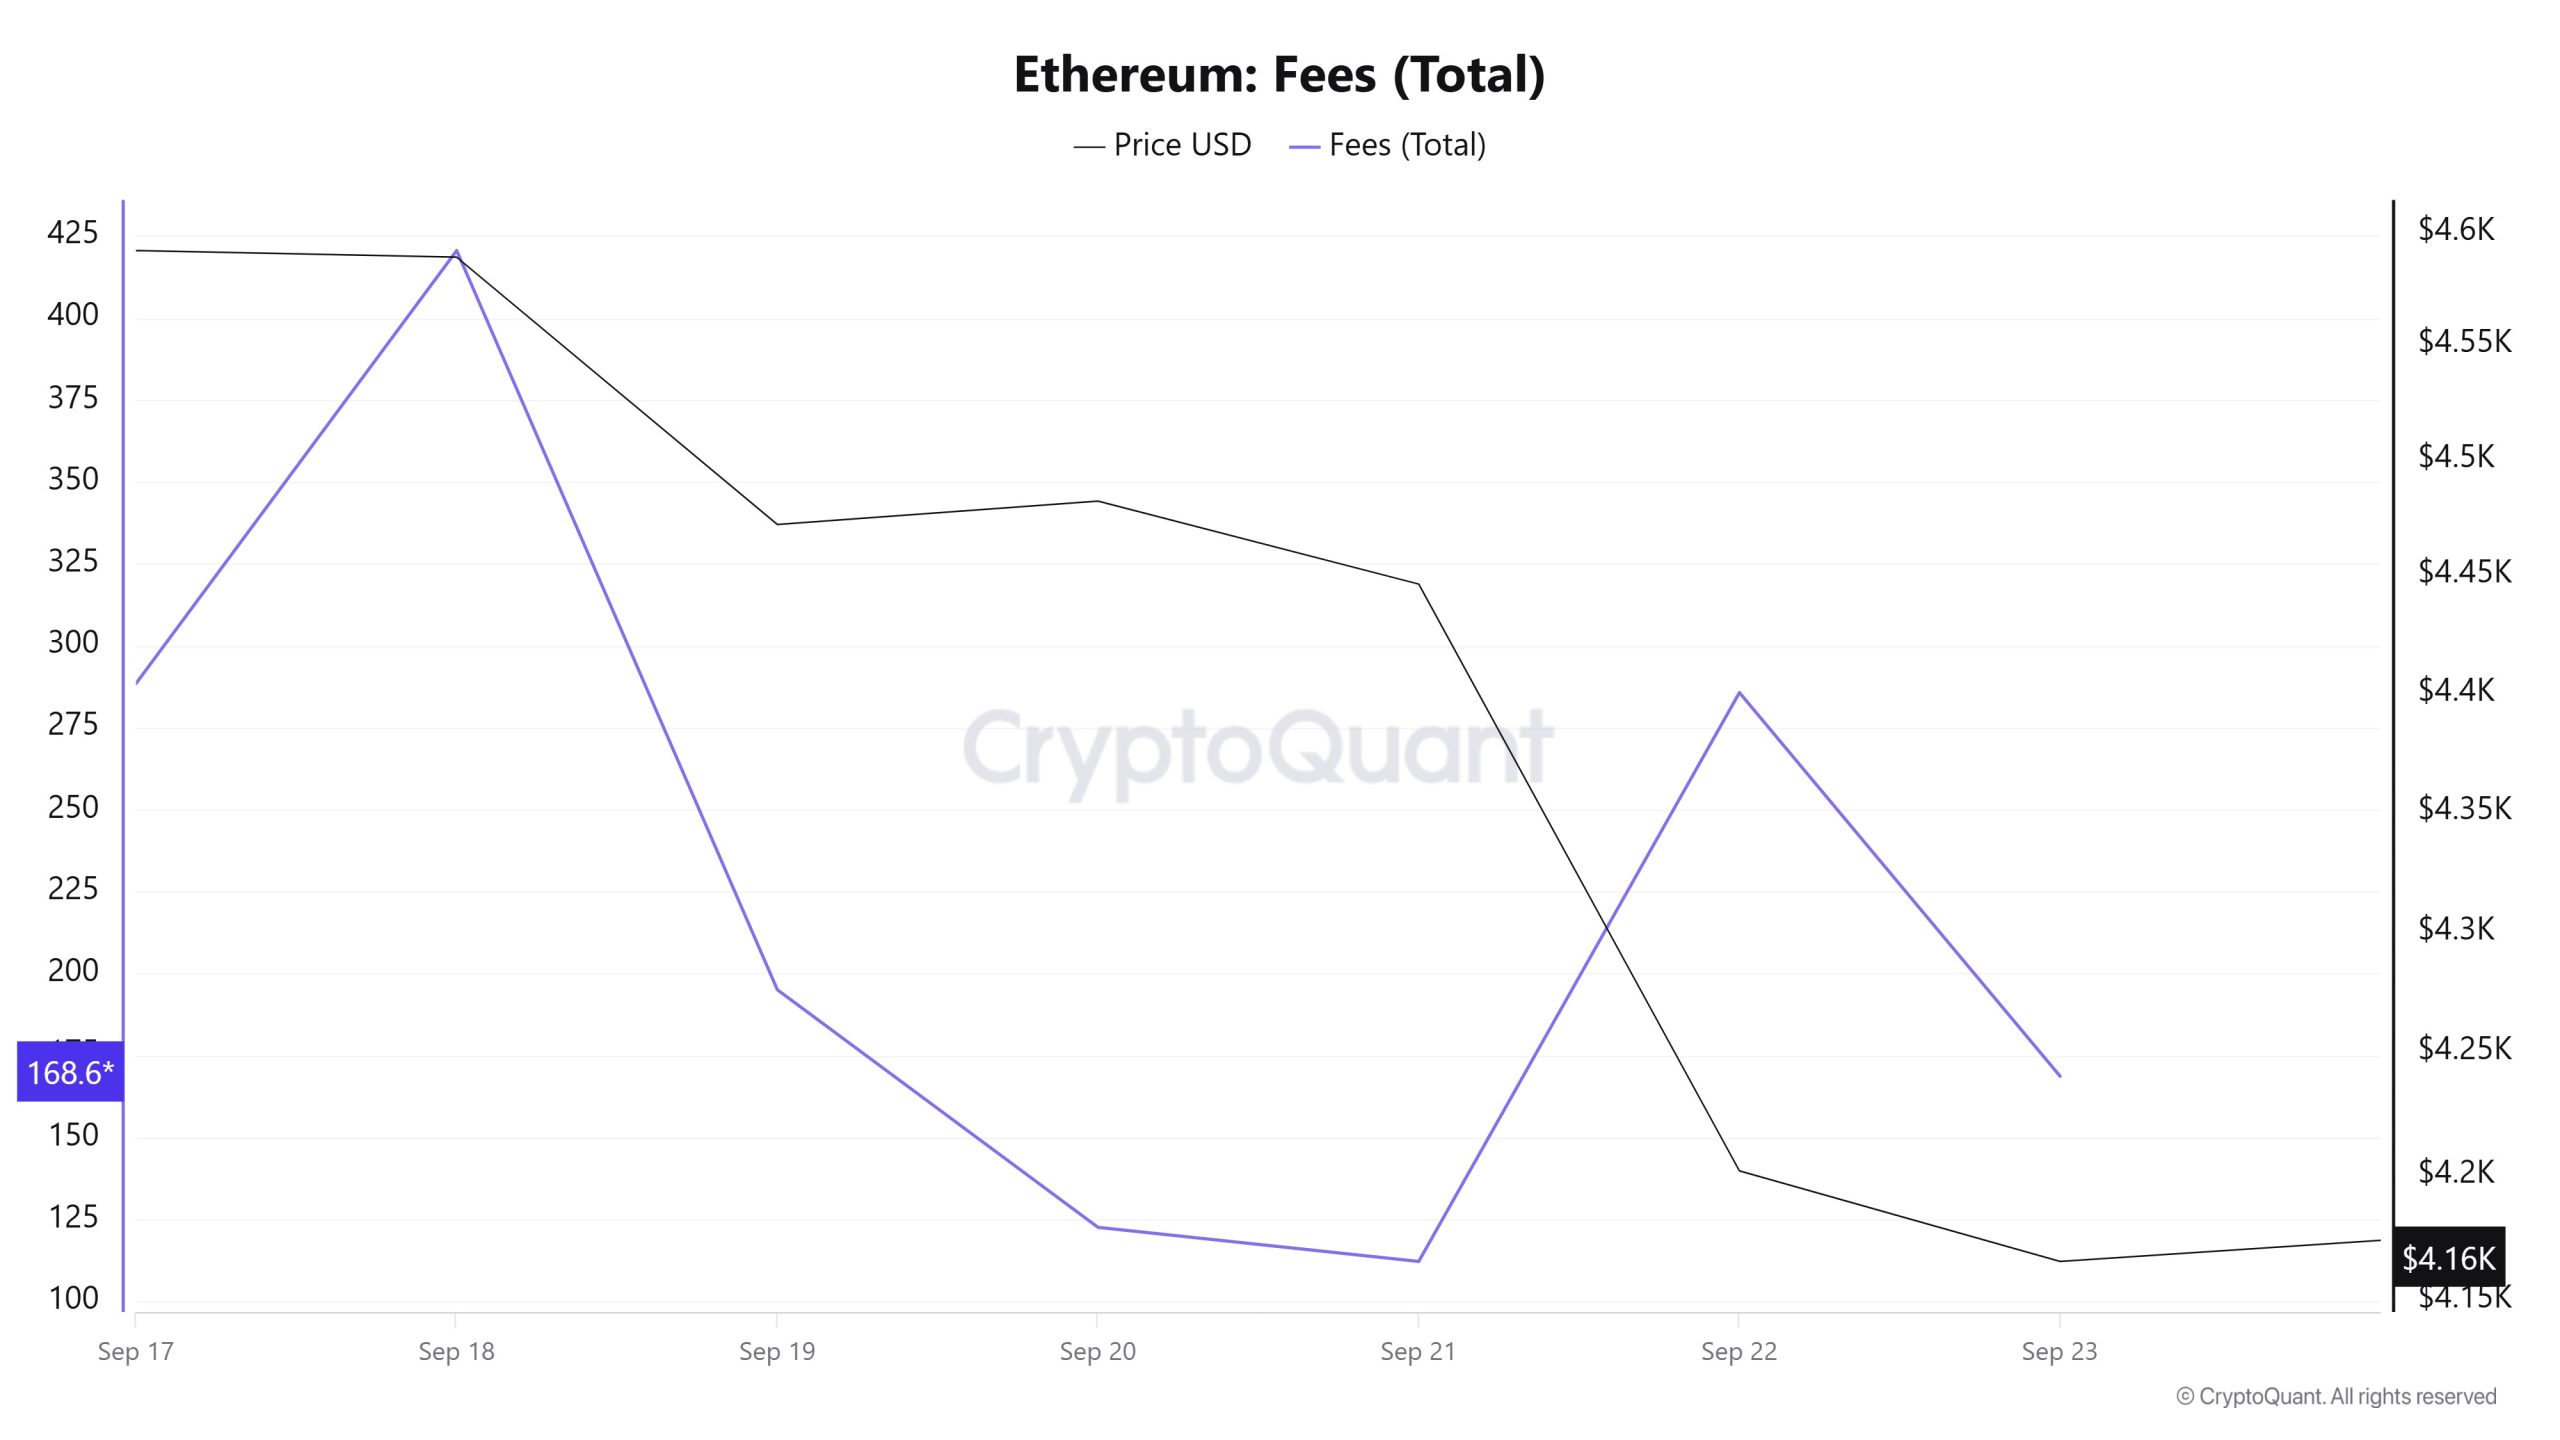
Similarly, an analysis of Ethereum Fees (Total) data between September 17 and 23 shows that on September 17, the first day of the week, the indicator was at 288,461679246923.
After this date, it followed a fluctuating course due to the volatility in Ethereum price. On September 20, it fell to 122.56579723906444, recording the lowest value of the week.
In the following days, the Ethereum Fees (Total) indicator resumed its upward trend and closed at 168.64677865149255 on September 23, the last day of the week.
Blocks Mined
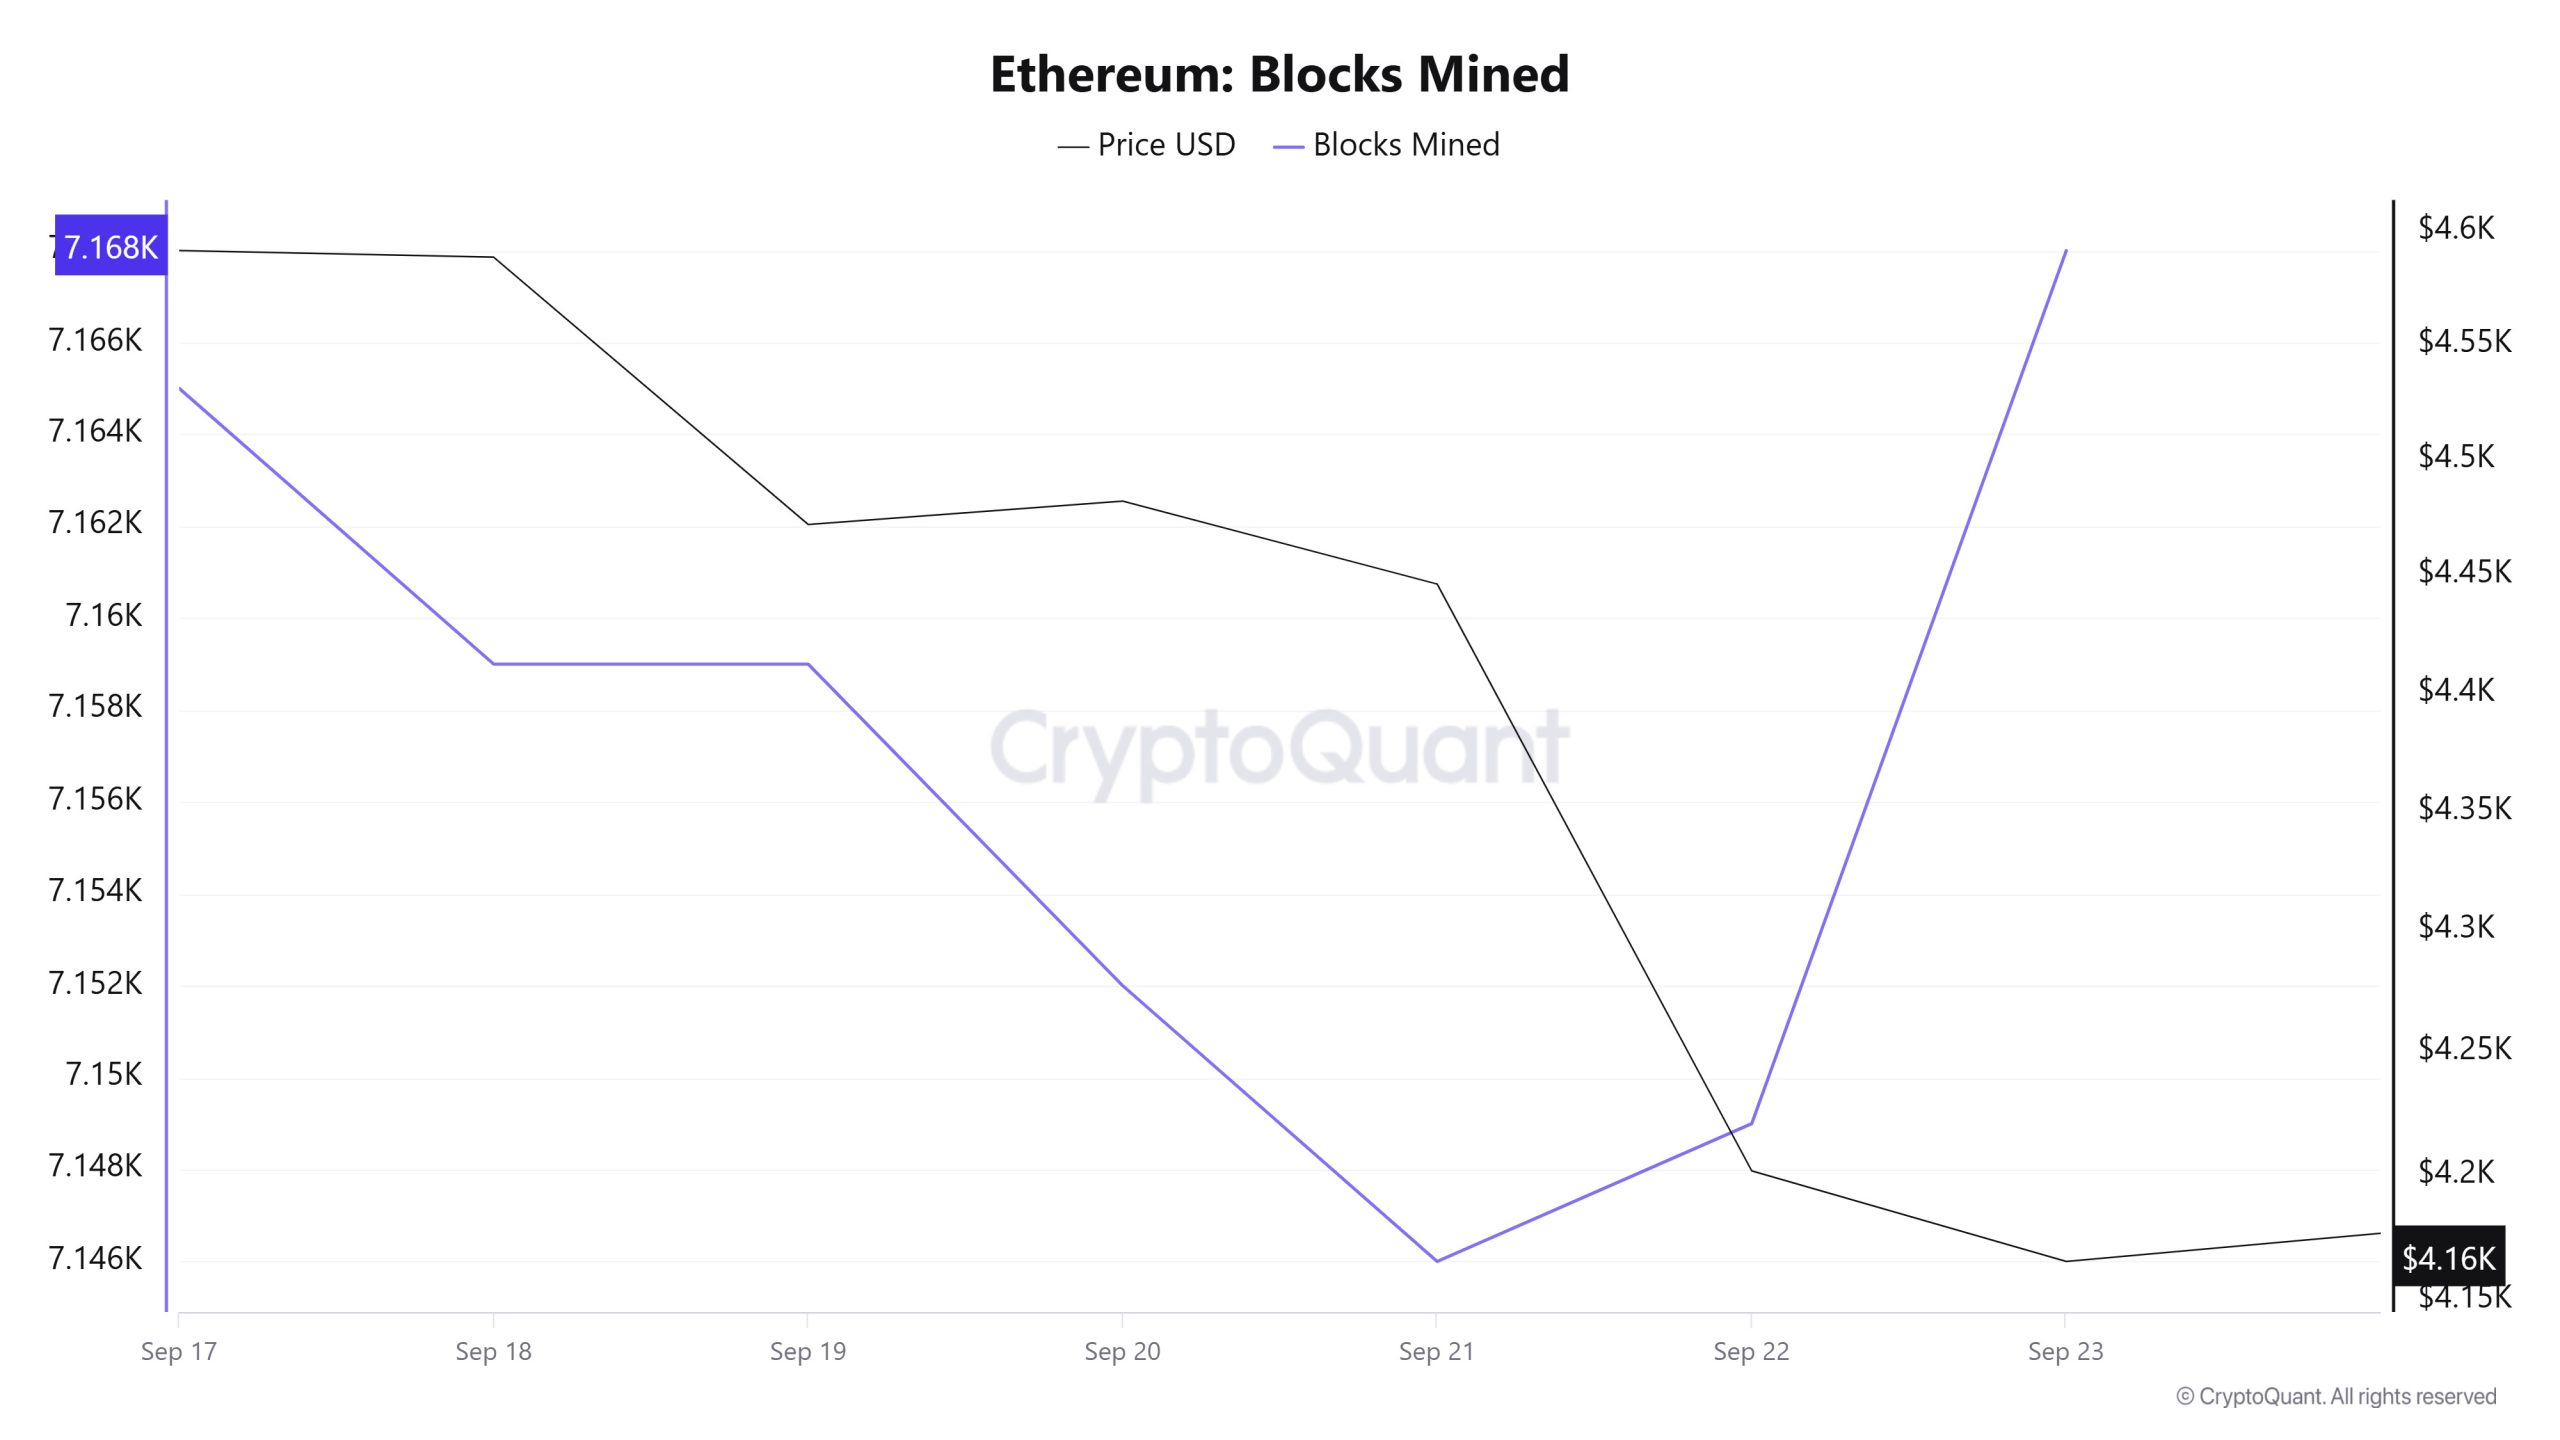
Between September 17 and September 23, Ethereum block production data showed an increase throughout the week. While 7,165 blocks were produced on September 17, this number increased to 7,168 as of September 23.
A time-varying correlation structure has been observed between the Ethereum price and the number of block productions. However, the general trend suggests that a positive correlation between these two variables is dominant.
Block Size
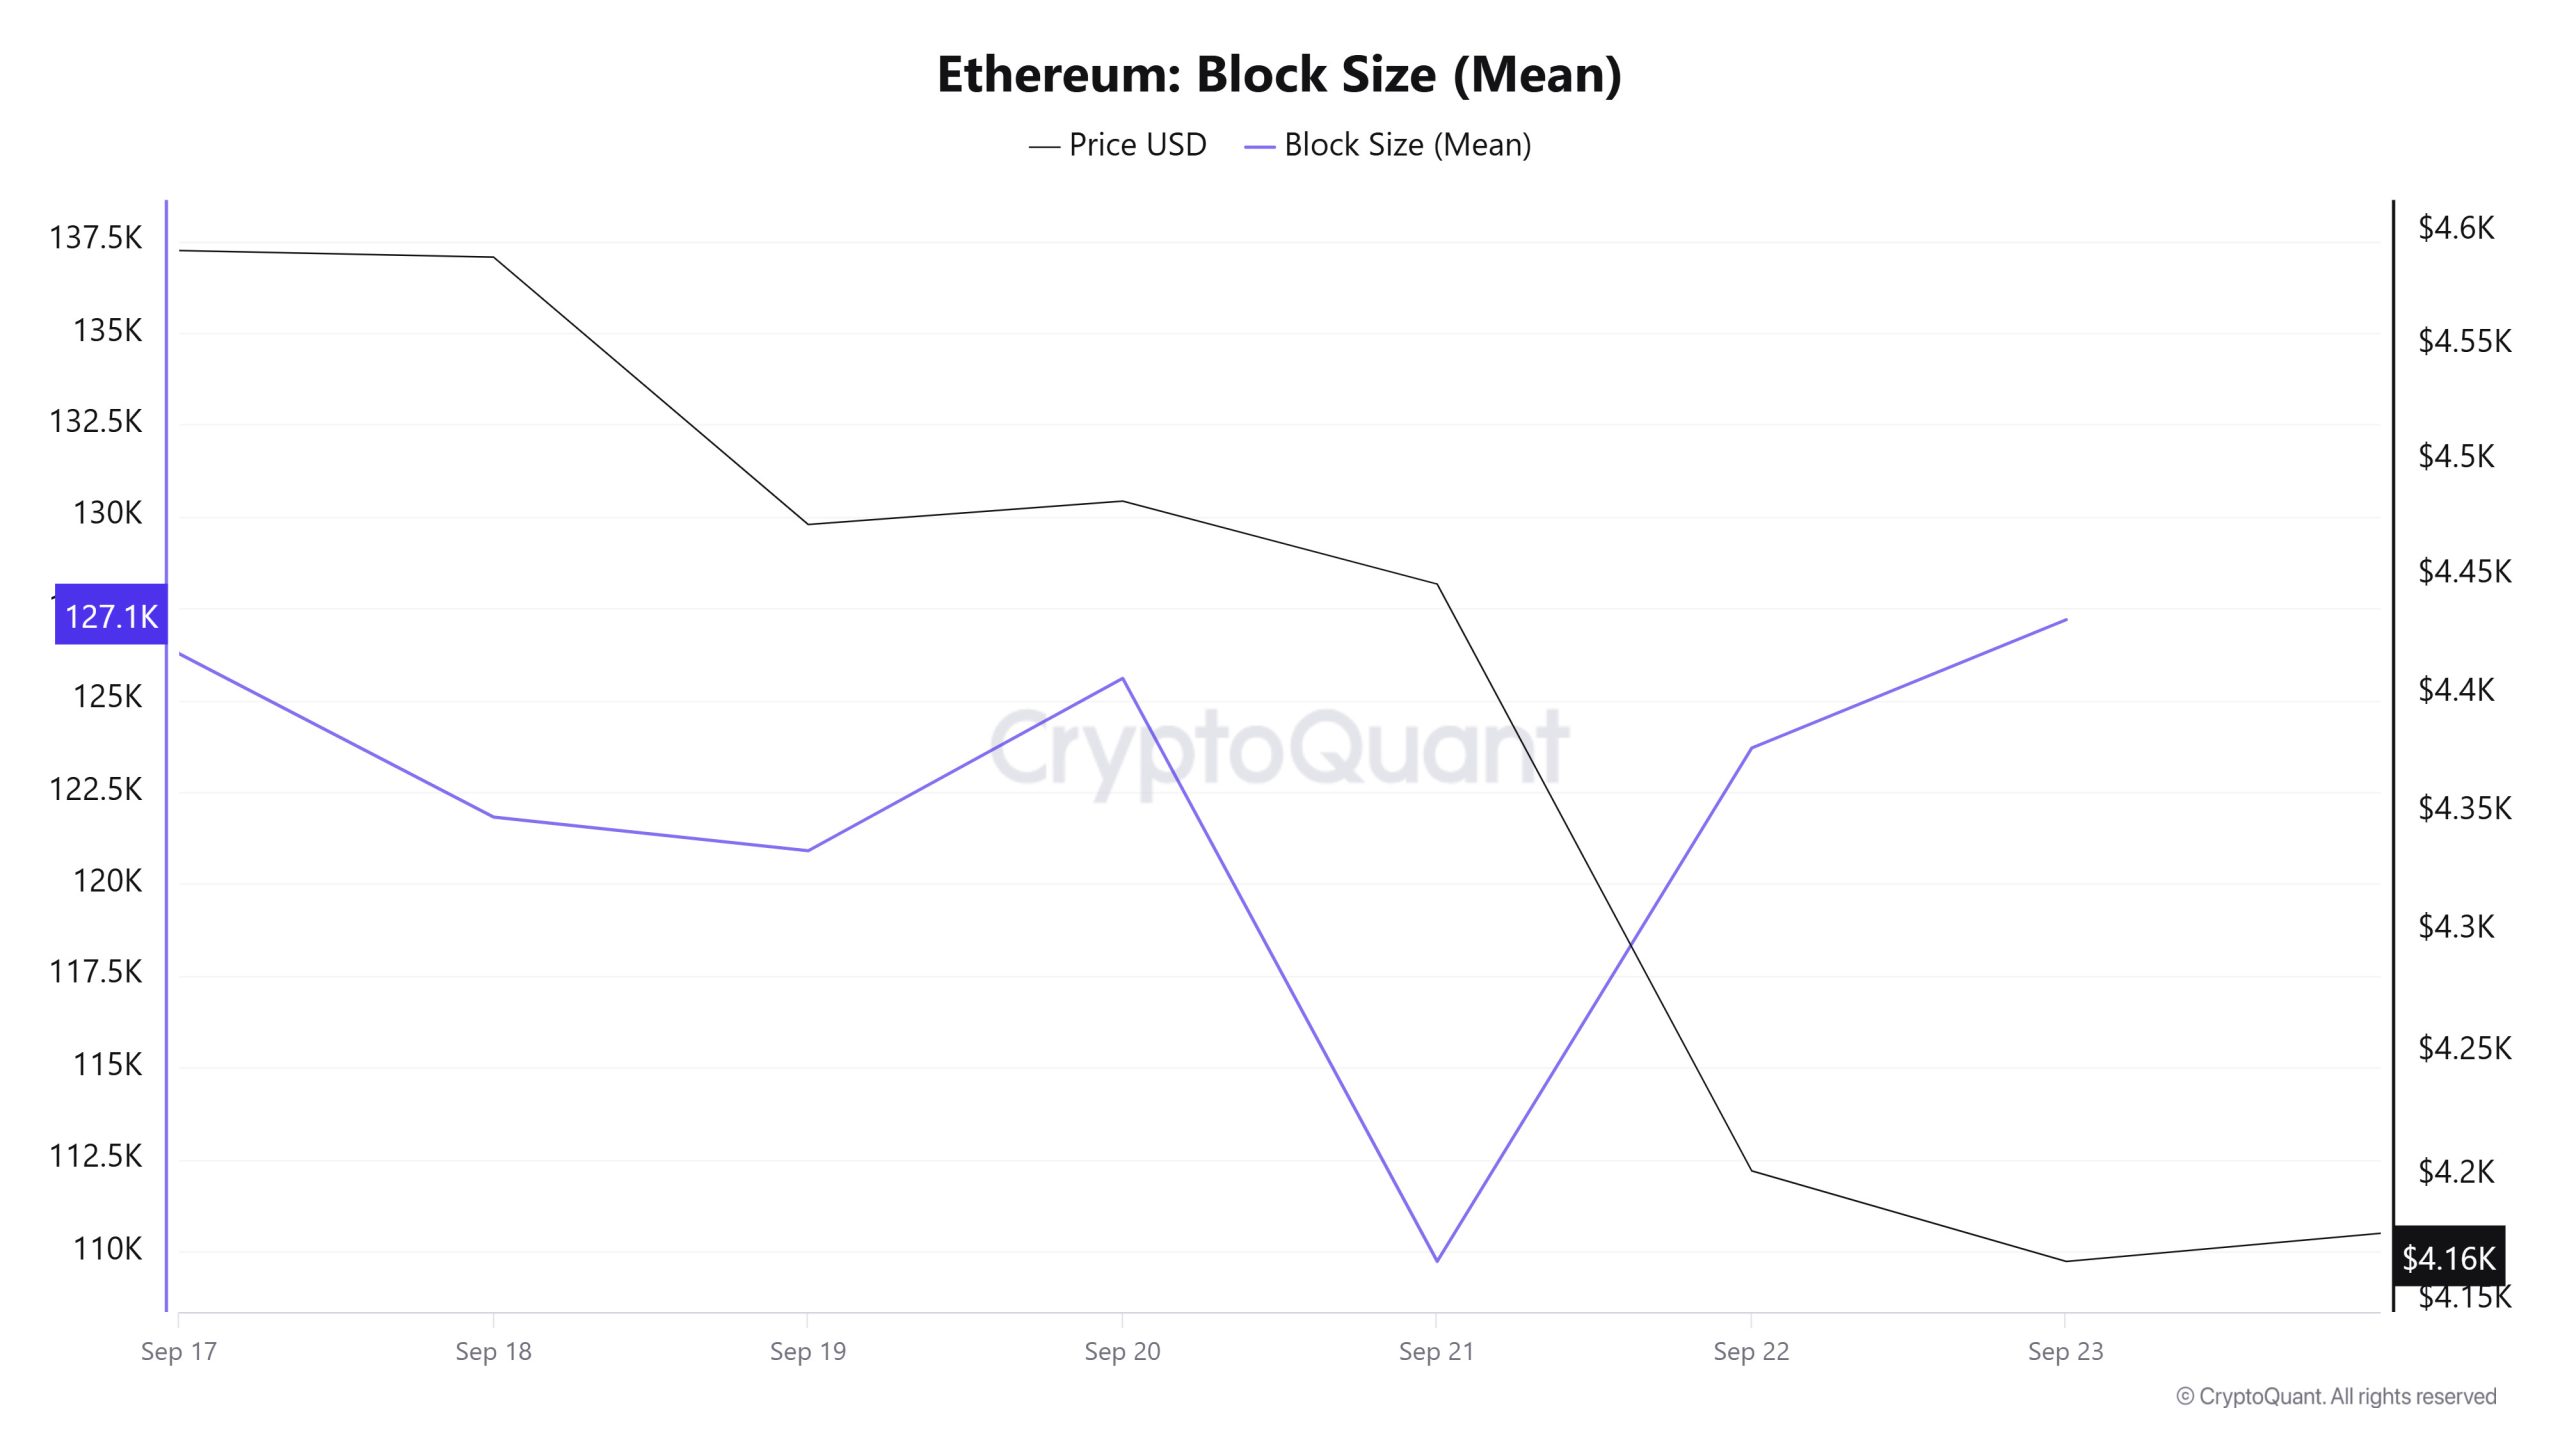
When the Ethereum block size data between September 17 and September 23 is analyzed, it is observed that there has been an increase throughout the week. On September 17, the average block size was 126,264 bytes, while this value increased to 127,193 bytes as of September 23.
A time-varying correlation structure was observed between block size and Ethereum price during the relevant period. However, the general trend suggests that a positive correlation between these two variables is dominant.
Block Interval
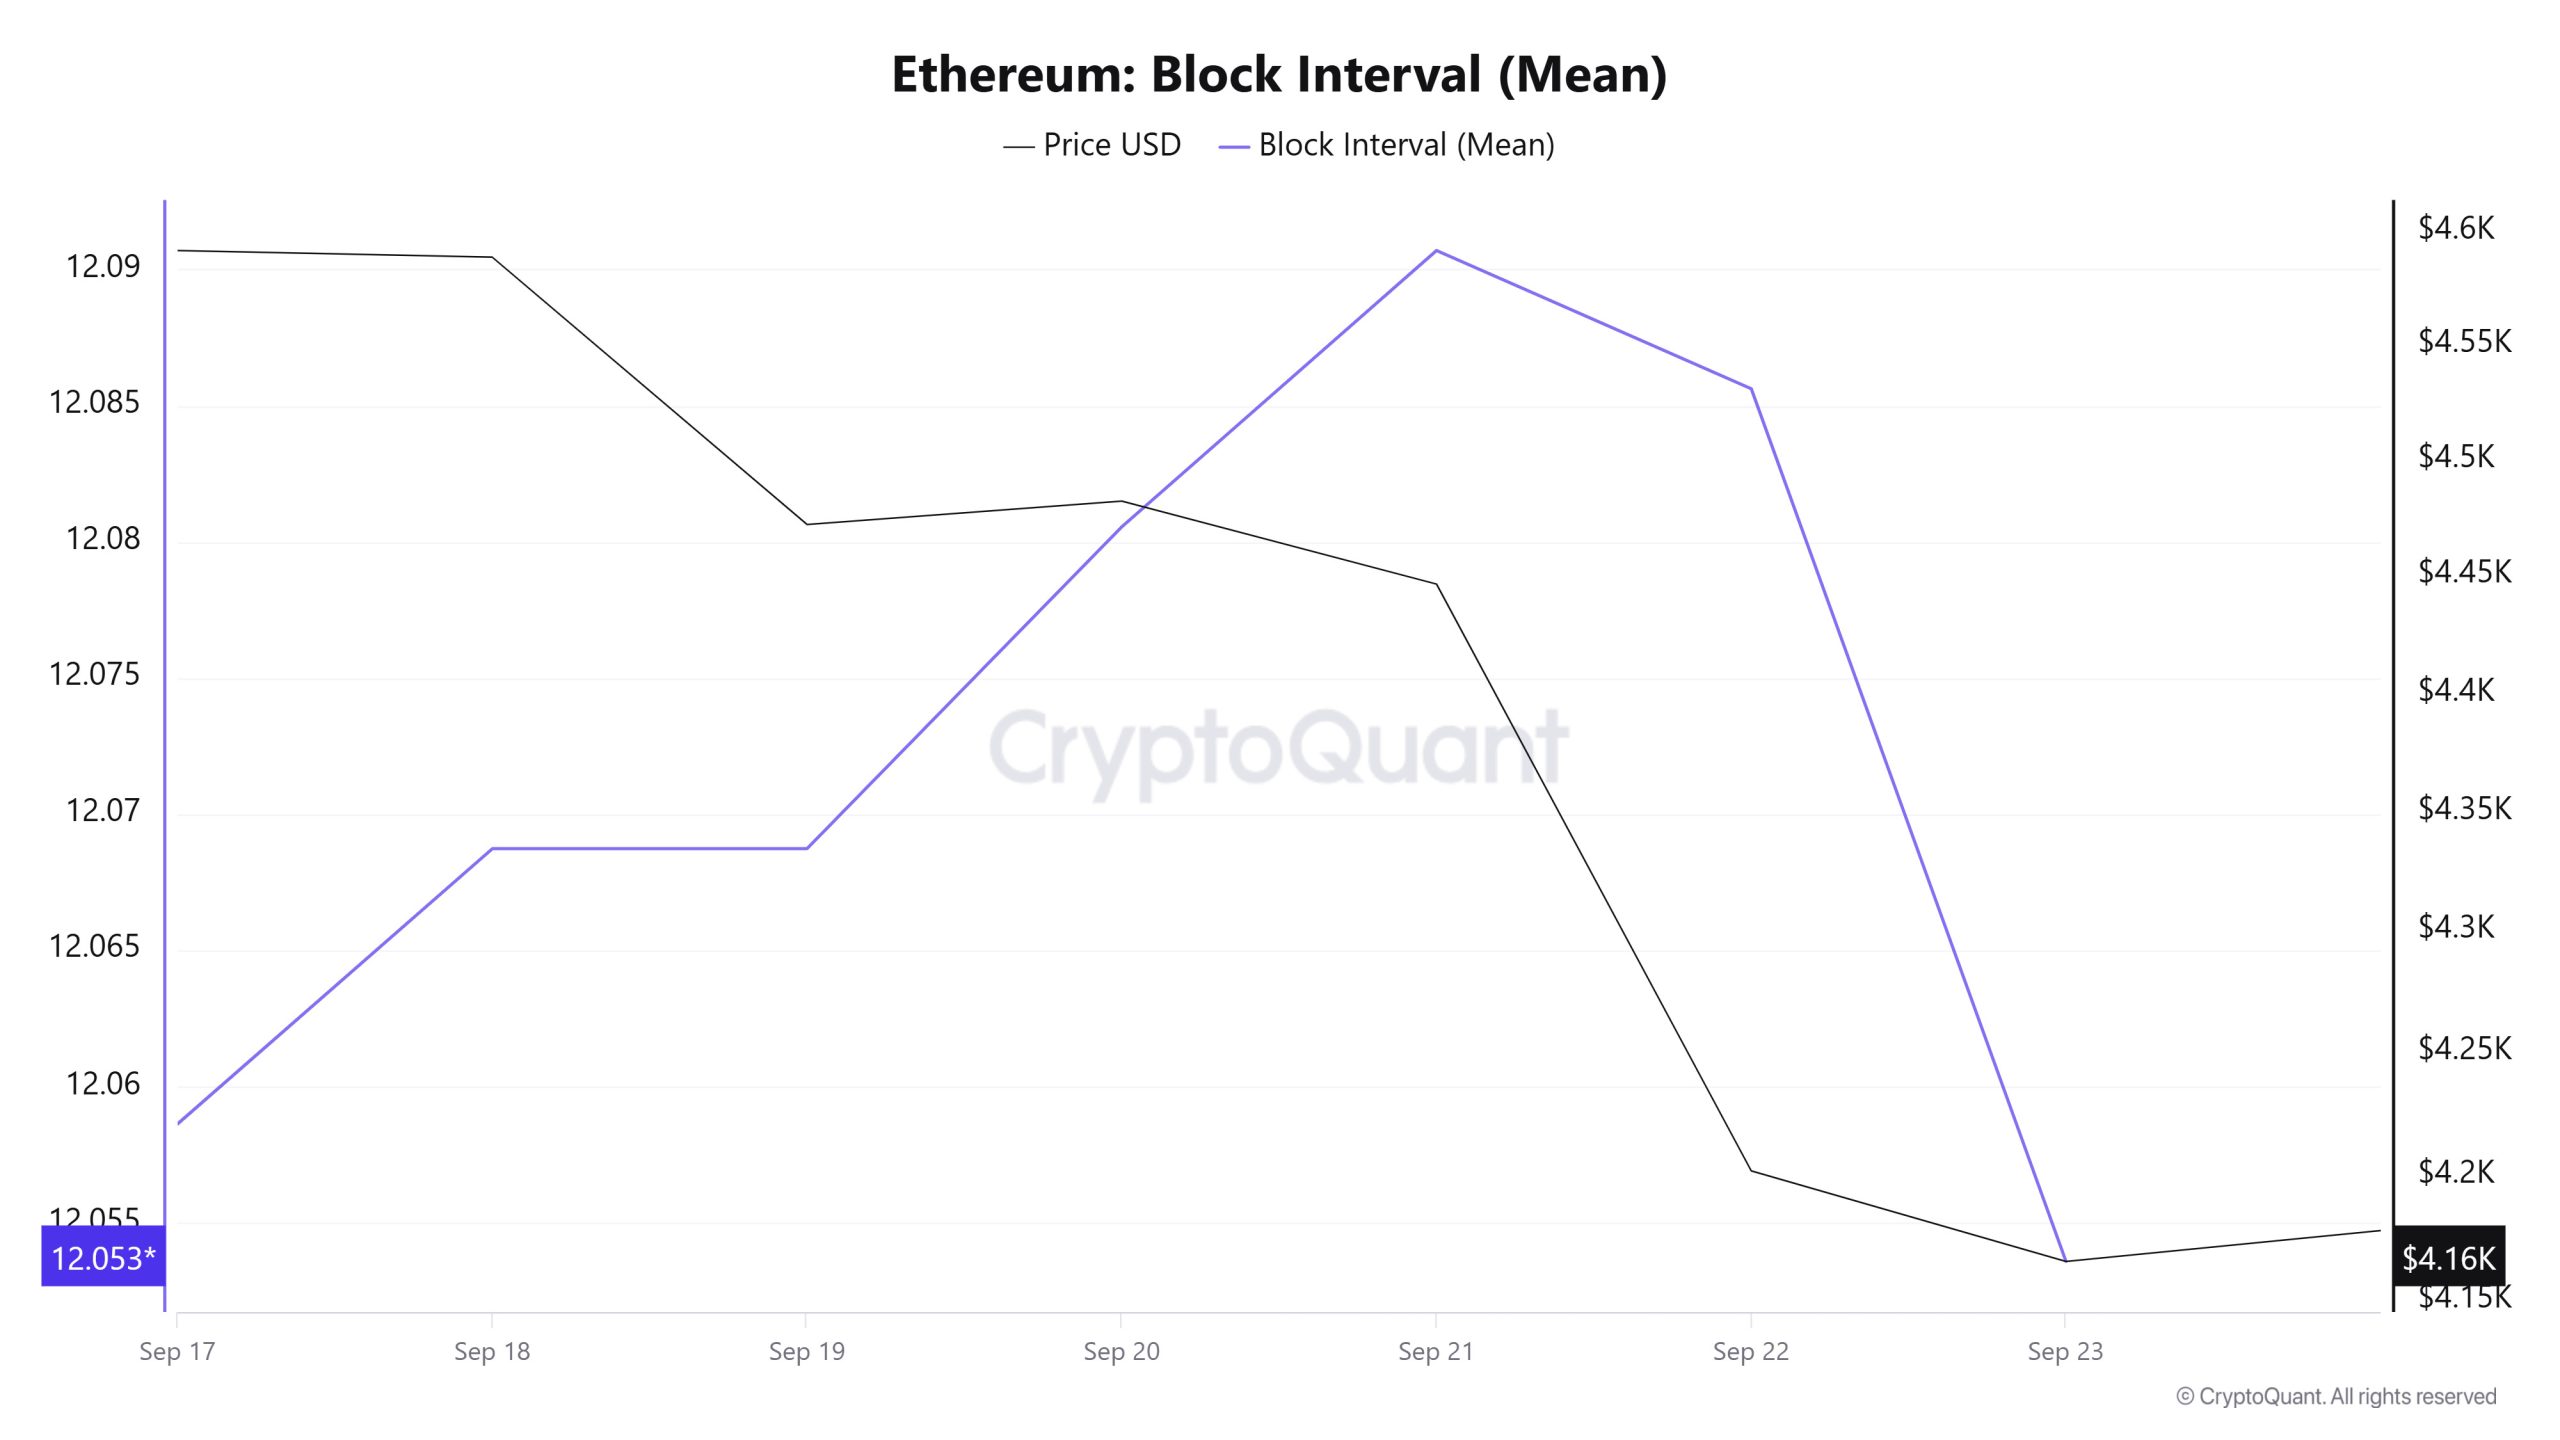
Between September 17 and September 23, Ethereum block data showed a slight decrease throughout the week. On September 17, the average block time was recorded as 12,058 seconds, while this time decreased to 12,053 seconds as of September 23.
During the period in question, a time-varying correlation structure was observed between Ethereum block duration and price movement. However, the general trend suggests that a negative correlation between these two variables is dominant.
Transaction
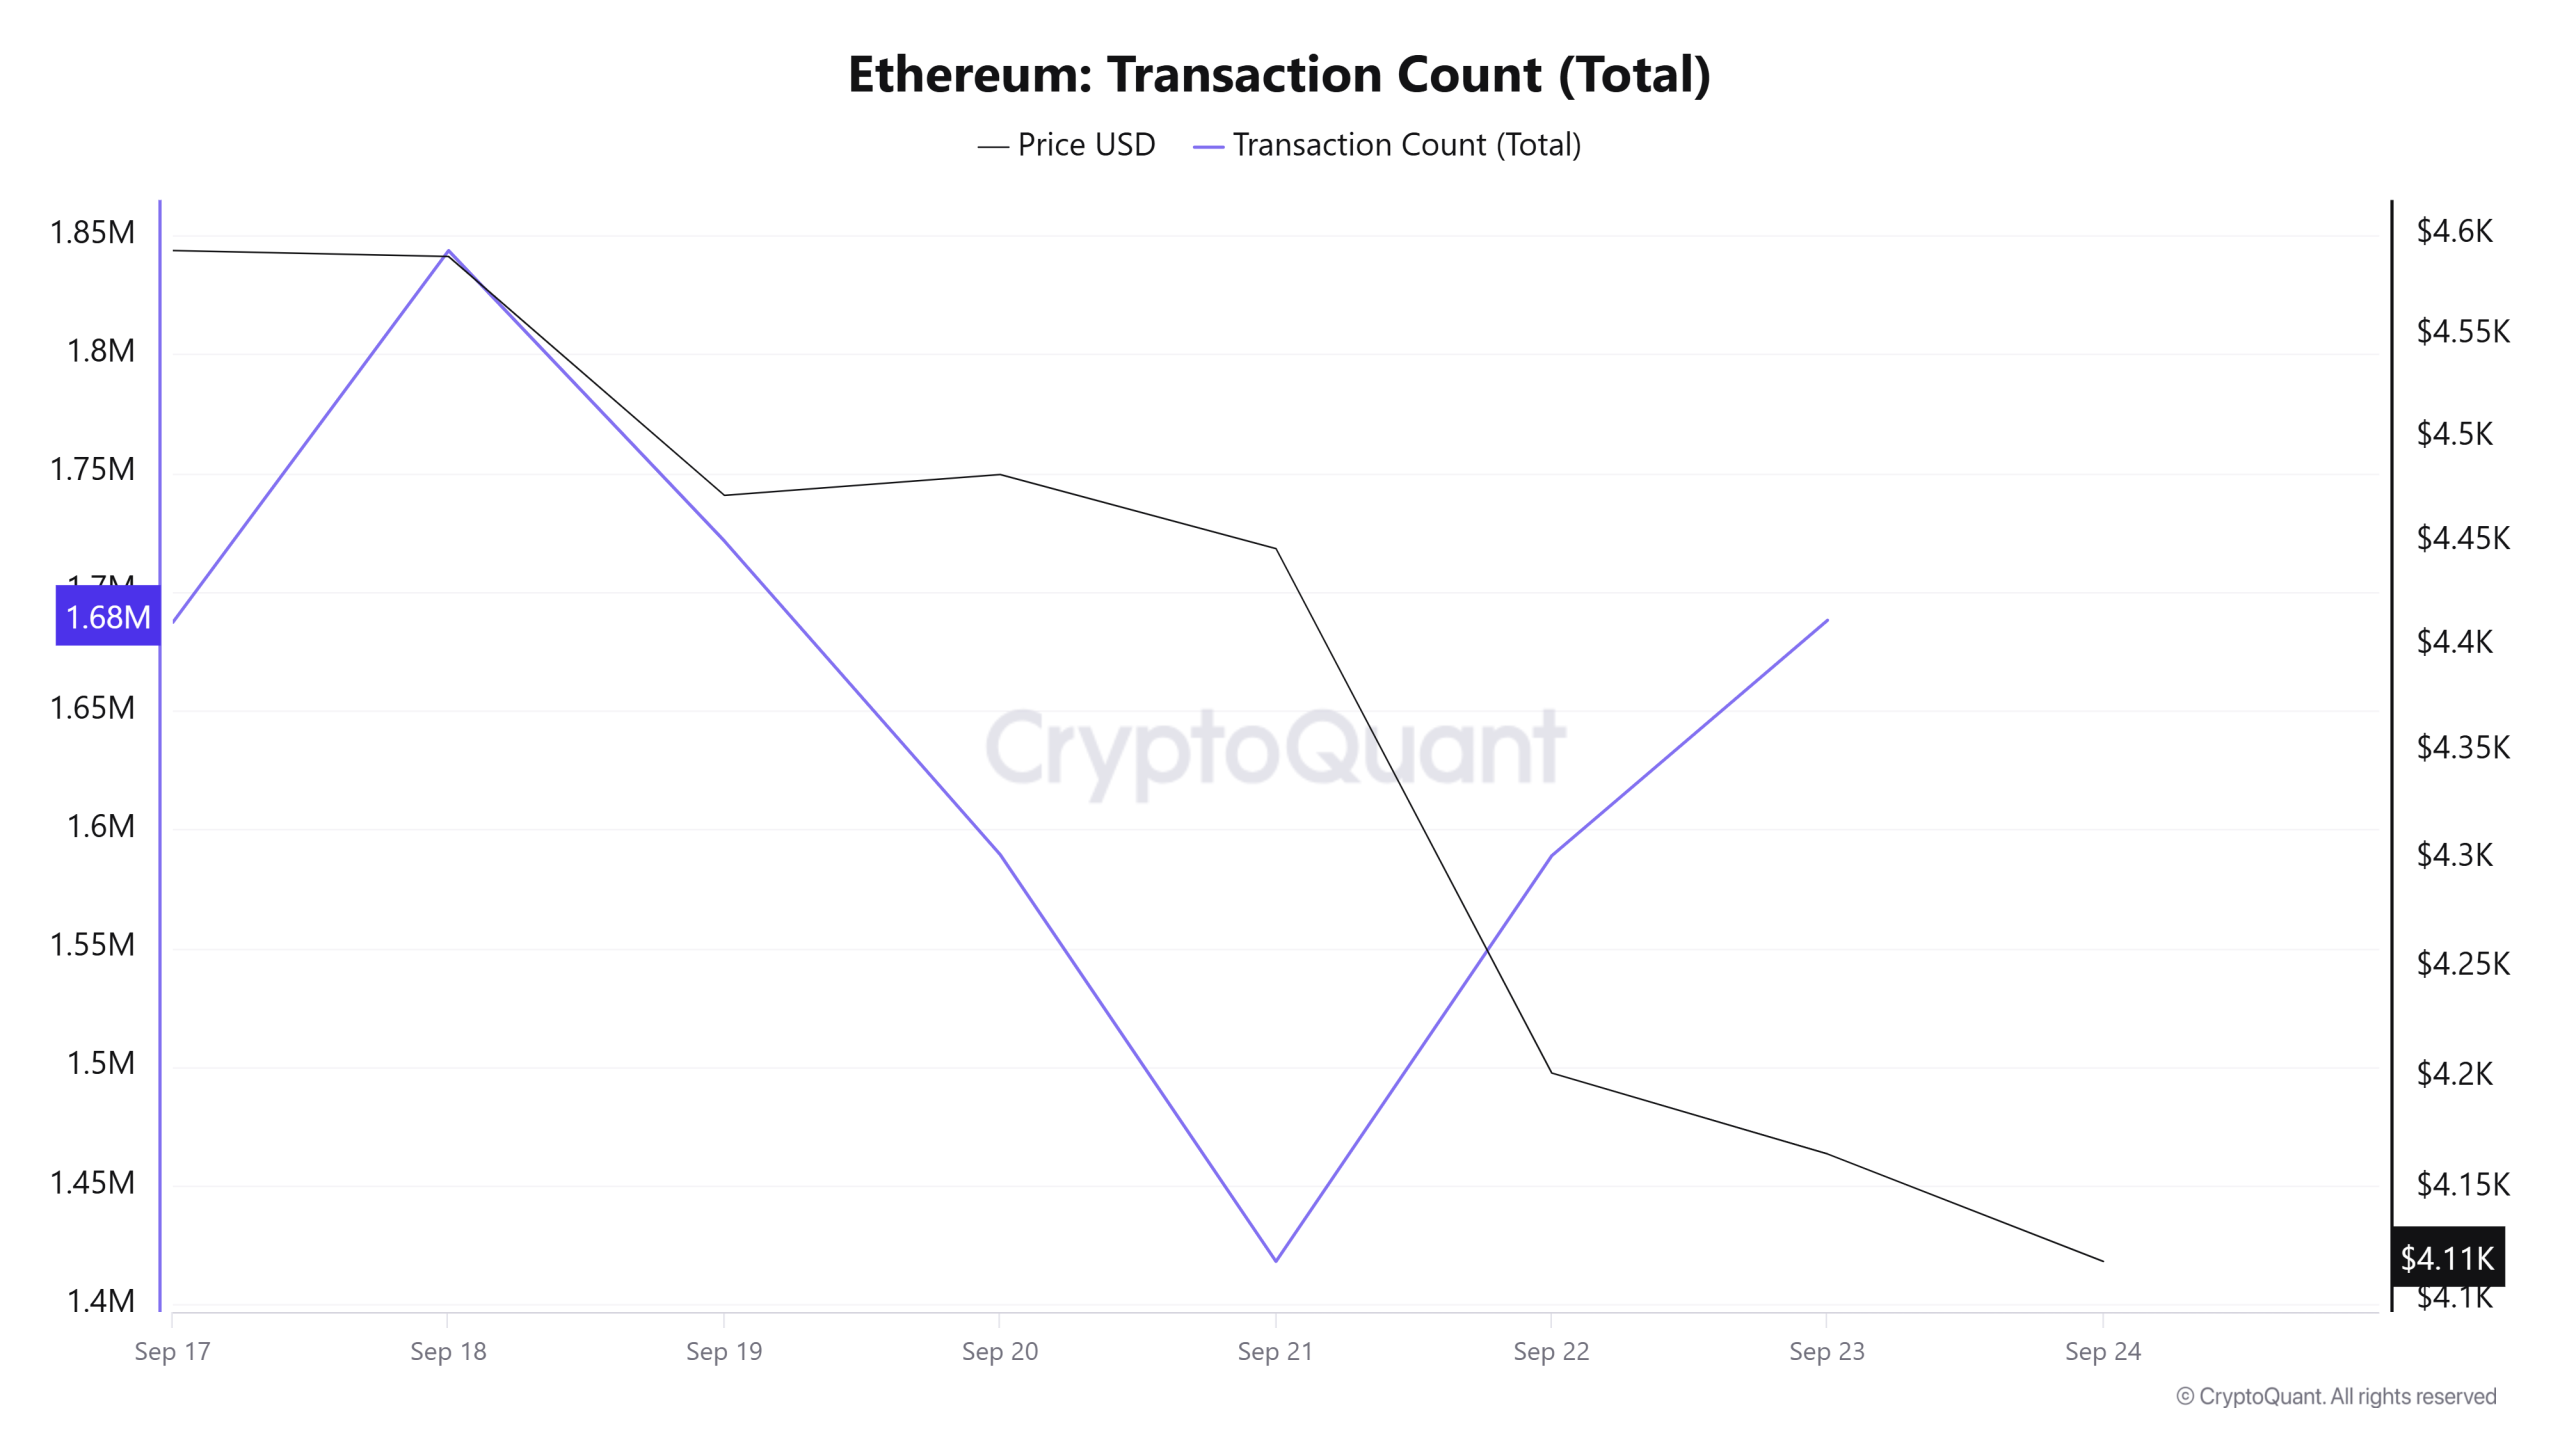
While a total of 11,011,806 transactions were made on the Ethereum network last week, the number of transactions this week increased by about 4.8% to 11,536,649. The highest weekly high was 1,843,631 on September 18, while the lowest was 1,418,164 on September 21. The correlation between the number of trades and the price was positive until the low on September 21, after which it weakened.
While the lack of accompanying prices despite the increase in transactions between periods indicates that these transactions are predominantly on the selling side; At the same time, the increase in usage on the network reveals that the Ethereum network maintains its healthy functioning. The fact that Ethereum burns remain strong indicates that network activity is rising and more Ether is coming out of supply. This indicates that both network security and overall demand in the ecosystem are growing stronger.
Tokens Transferred
The total amount of ETH transferred between last week and this week increased by approximately 9.7% from 12,434,188 to 13,645,178. The highest weekly transfer was 3,038,703 ETH on September 18, while the lowest was 672,101 ETH on September 20. On a daily basis, volatility is still evident and market movements are choppy. This week, the relationship between price and the amount of tokens transferred was negatively correlated. This indicates that the transfers have been largely dominated by selling and market players have turned to profit realizations. The increase in both the number of transactions and the amount transferred points to a week of intense activity, with investor behavior becoming more pronounced.
Estimated Leverage Ratio
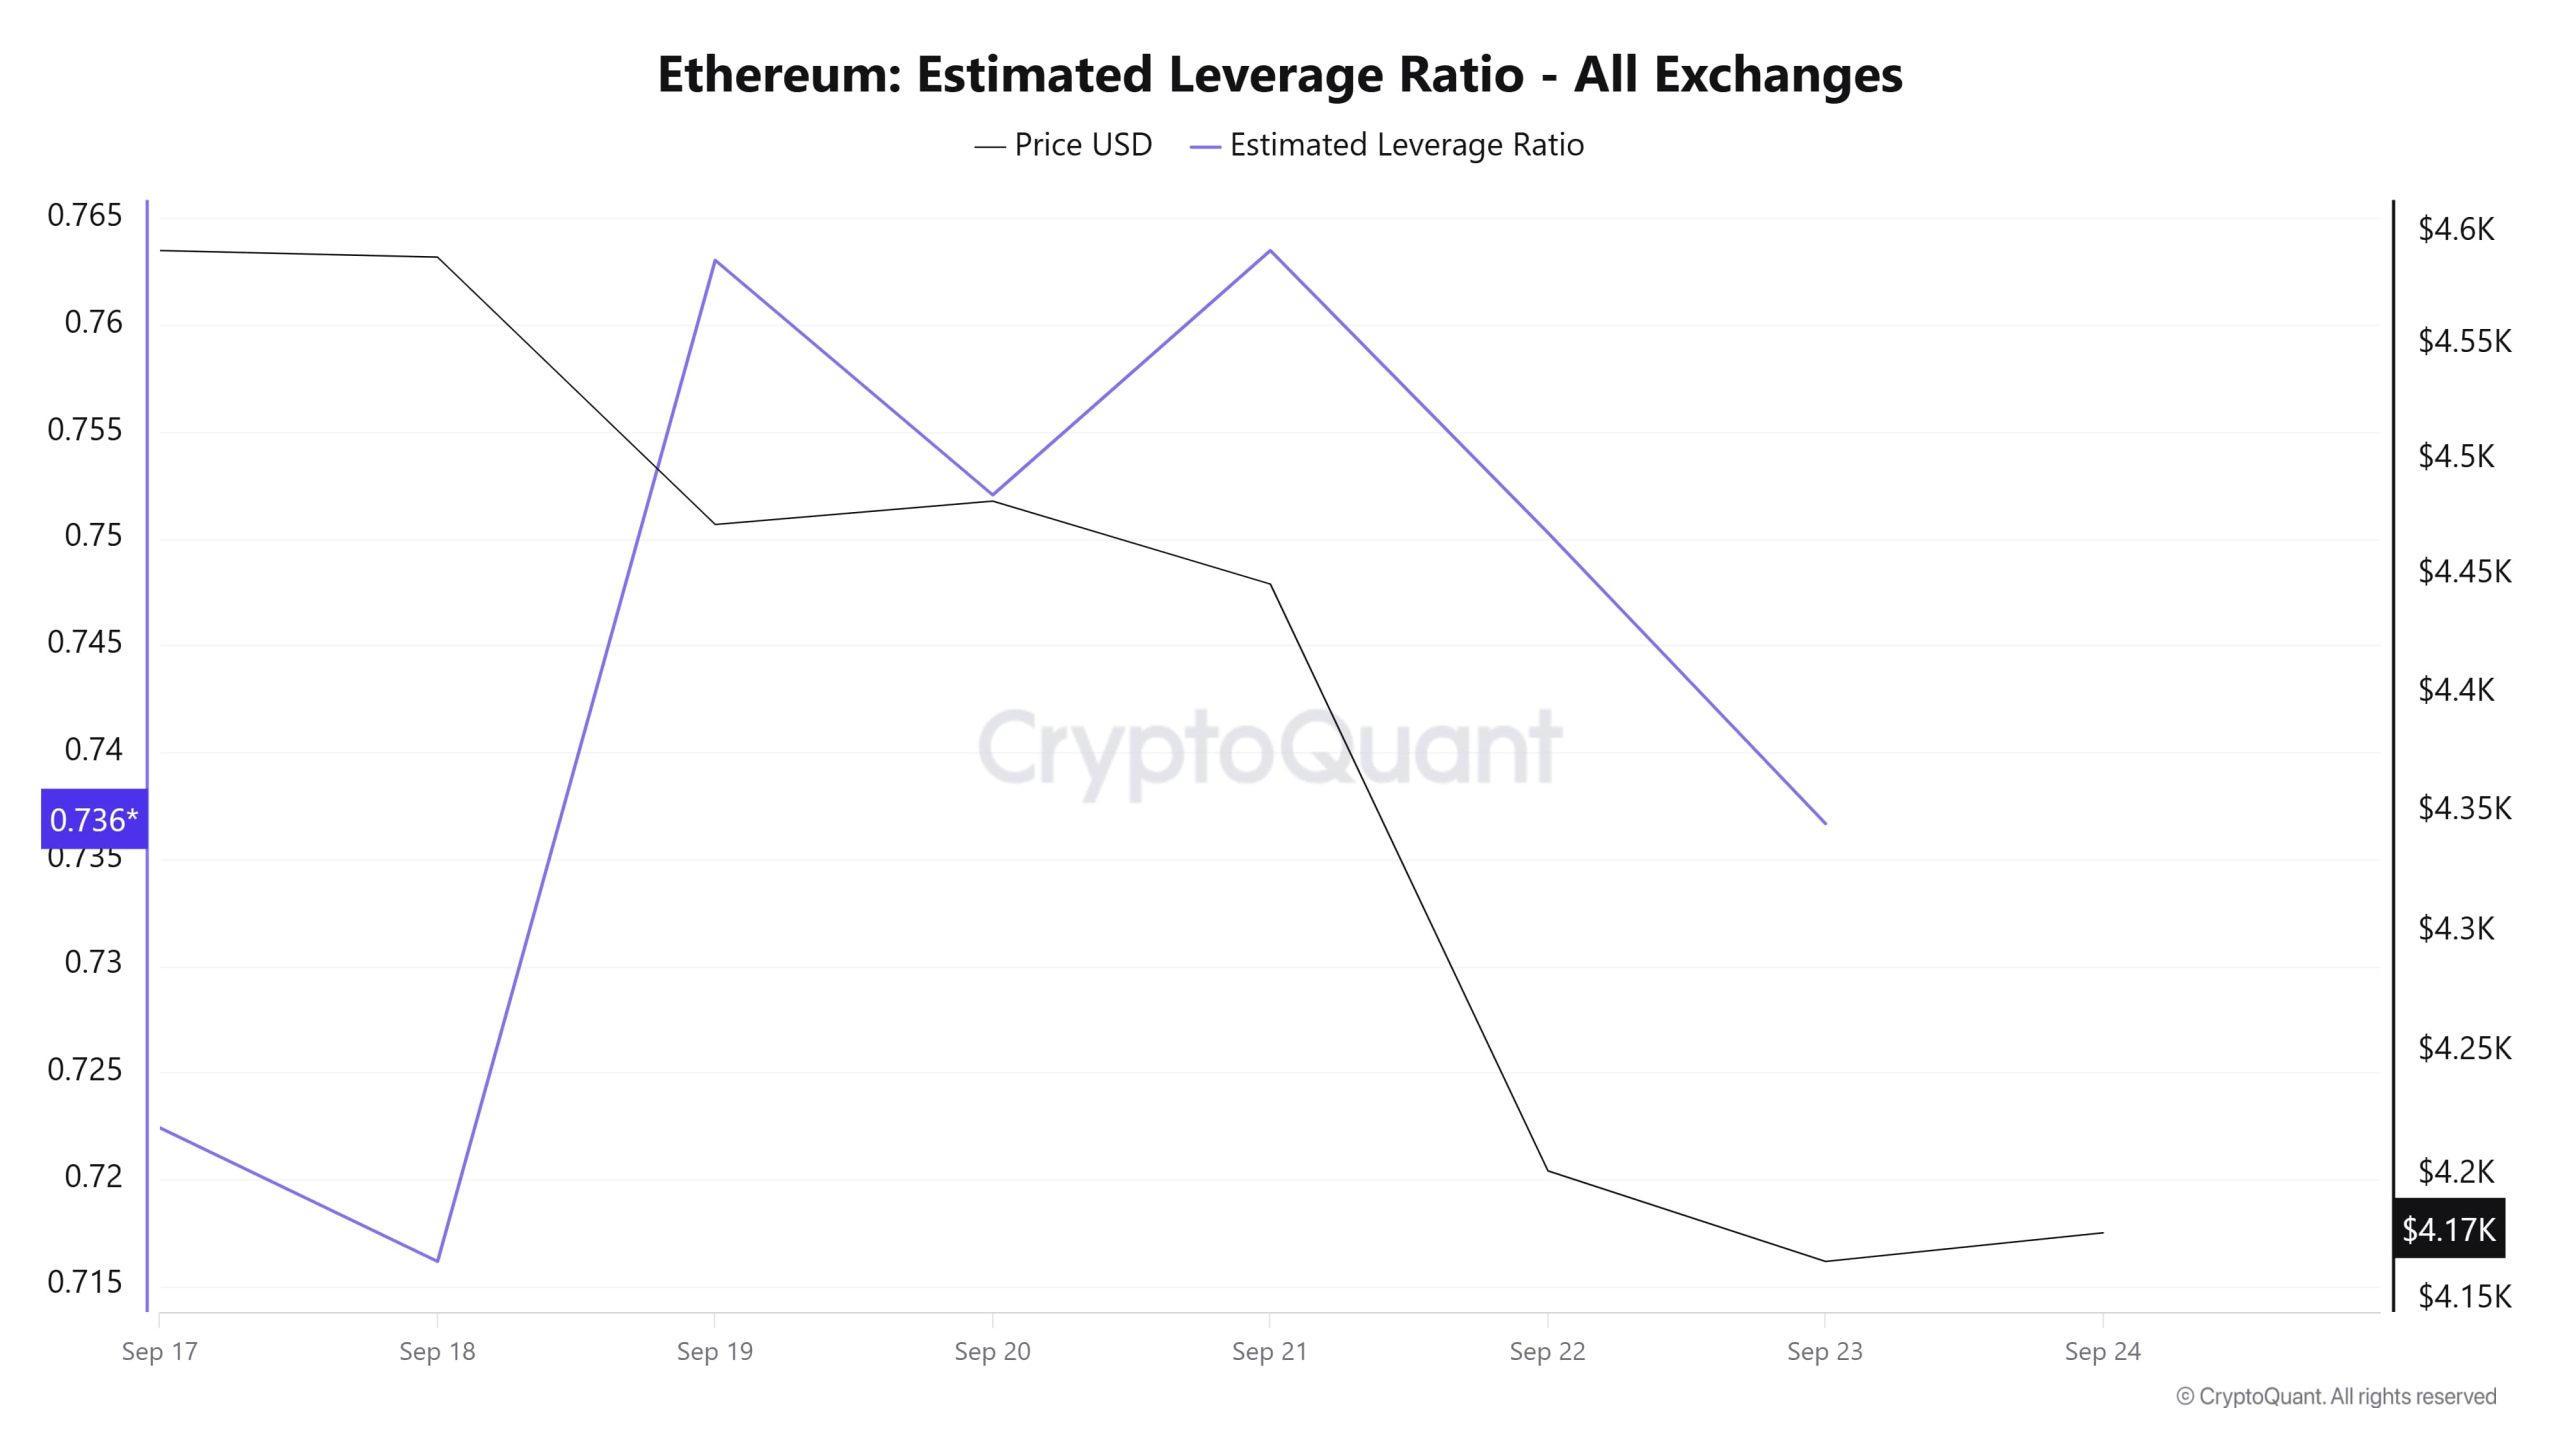
During the 7-day period, the metric rose steadily until the middle of the process and then declined. ELR (Estimated Leverage Ratio), which had a value of 0.722 at the beginning of the process, formed the lowest point of the process on September 18 and fell to 0.716. The metric, which continued to rise in the remaining period, reached its peak on September 21 and reached 0.763. After this point, the metric, which has been on a downward trend, has fallen to 0.736 as of the writing of this article. A higher ELR means that participants are willing to take on more risk and generally indicates bullish conditions or expectations. It should be noted that these rises can also be caused by a decrease in reserves. When we look at Ethereum reserves, there were 17.08 million reserves at the beginning of the process, while this figure decreased in the rest of the process and is currently seen as 16.51 million. At the same time, Ethereum’s Open Interest is seen as 63.60 billion dollars at the beginning of the process. As of now, the volume decreased in the process and the open interest value stood out as 56.74 billion dollars. With all this data, the ELR metric experienced a steady rise in the early times of the process, but declined towards the end. The price of the asset moved between $4,500 and $4,150 with all this data. At the moment, the risk appetite of investors and traders is steadily decreasing. The decline in the volume of open interest data and the decline in reserves, which appeared throughout the process, signaled to us that an increase in the ELR rate was artificial. As a result, the fact that reserves fell less than the open interest data has caused an increase in the ELR metric. This suggests that the market is pessimistic and the decline may continue.
ETH Onchain Overall
| Metric | Positive 📈 | Negative 📉 | Neutral ➖ |
|---|---|---|---|
| Active Addresses | ✓ | ||
| Derivatives | ✓ | ||
| Supply Distribution | ✓ | ||
| Exchange Supply Ratio | ✓ | ||
| Exchange Reserve | ✓ | ||
| Fees and Revenues | ✓ | ||
| Blocks Mined | ✓ | ||
| Transaction | ✓ | ||
| Estimated Leverage Ratio | ✓ |
*The metrics and guidance in the table do not, in and of themselves, describe or imply an expectation of future price changes for any asset. The prices of digital assets may vary depending on many different variables. The onchain analysis and related guidance are intended to assist investors in their decision-making process, and making financial investments based solely on the results of this analysis may result in harmful transactions. Even if all metrics produce a positive, negative or neutral result at the same time, the expected results may not be seen according to market conditions. Investors reviewing the report would be well advised to heed these caveats.
Legal Notice
The investment information, comments and recommendations contained in this document do not constitute investment advisory services. Investment advisory services are provided by authorized institutions on a personal basis, taking into account the risk and return preferences of individuals. The comments and recommendations contained in this document are of a general type. These recommendations may not be suitable for your financial situation and risk and return preferences. Therefore, making an investment decision based solely on the information contained in this document may not result in results that are in line with your expectations.
NOTE: All data used in Ethereum onchain analysis is based on Cryptoqaunt.