
Technical Analysis – September 26, 2025
BTC/USDT
US data showed strong economic growth and consumption, weakening expectations of an interest rate cut. Trump announced new tariffs on drugs, furniture, and heavy trucks starting October 1. While the risk of a federal government shutdown persists, Fed members expressed differing views on interest rate policy. 18 former Fed chairmen and officials petitioned the Supreme Court to protect the Fed’s independence. Trump signed a new restructuring order for TikTok. Tensions arose over airspace violations in US-Russia relations. Chinese Premier Li Qiang met with US CEOs and provided investment assurances.
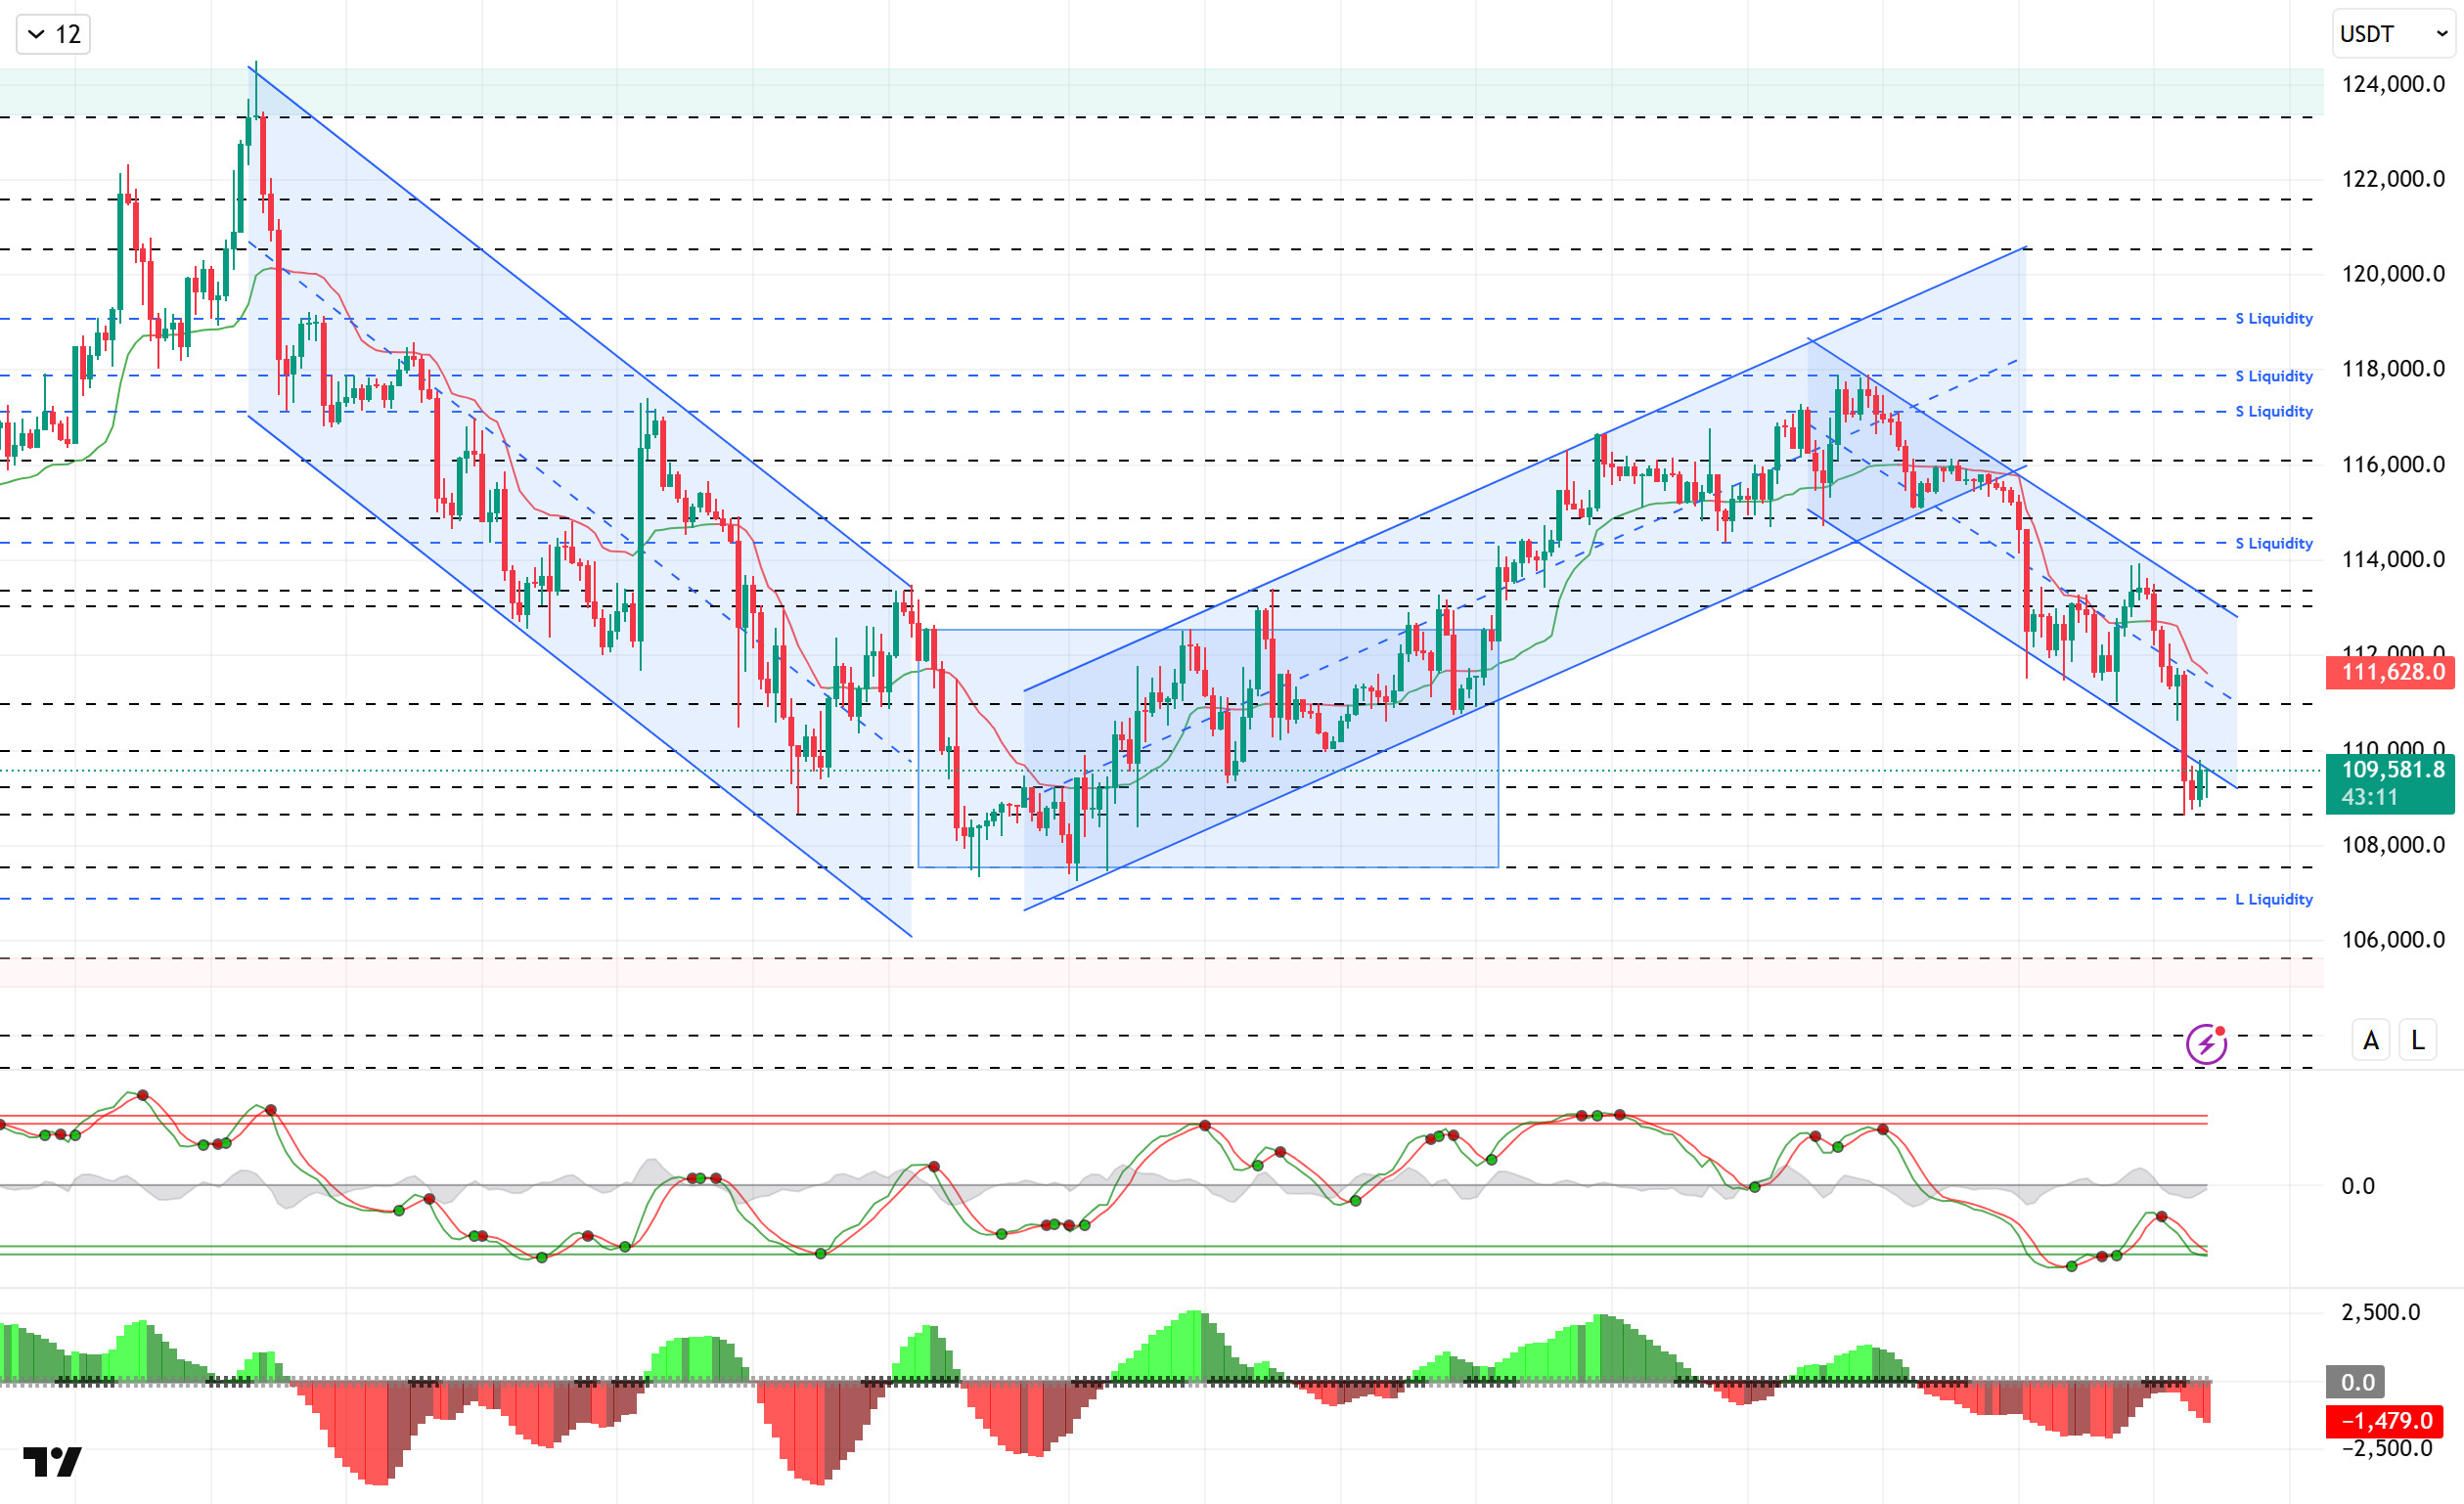
Looking at the technical picture, BTC, which was in a bearish pattern in the previous analysis, lost its support at 111,400 and faced heavy selling pressure. Moving within a descending trend channel, the price broke through the lower trend channel and tested the 108,600 level. At the time of writing, it is trading at 109,300, maintaining its bearish outlook with low volatility.
Technical indicators, with the Wave Trend oscillator (WT) giving a buy signal in the oversold zone, returned to selling after the trend reversal. The Squeeze Momentum (SM) indicator is losing momentum again within the negative area of the histogram. The Kaufman moving average is currently trading above the price at the 111,500 level.
According to liquidation data, short-term buy orders appear to be thinning out. In contrast, long-held buy orders within the monthly period underwent heavy liquidation as the price fell back to the 108,000–109,000 range. Over the past 24 hours, over $1 billion in liquidations occurred across the total market, with $236 million in long positions liquidated in BTC alone. On the other hand, on the selling side, short-term intensity is noticeable at the 114,000 level, while in the long term, the 117,800–119,000 band continues to be an accumulation zone.
In summary, looking at the fundamental developments, the decline in interest rate cut expectations, along with US macro data reducing the risk of recession, caused the market to lose its positive short-term environment. Differing views among Fed members on interest rate cuts and the reintroduction of tariffs have emerged as pessimistic developments for the market. On the technical side, the minor downtrend channel has deepened, and the price appears to have lost important support levels. In liquidity data, with the recent decline, buy orders are being liquidated, including monthly-based trades, while an increase in sell orders is prominent. In this context, with the price falling below the 110,000 level, selling pressure continues, while the 108,600 level, tested several times yesterday, acts as support. If this level is broken, the 107,500 level will be monitored as a support area, and in the event of a possible rebound, closes above the 110,000 level will be monitored.
Supports: 108,600 – 107,500 – 105,000
Resistances: 110,000 – 111,400 – 112,600
ETH/USDT
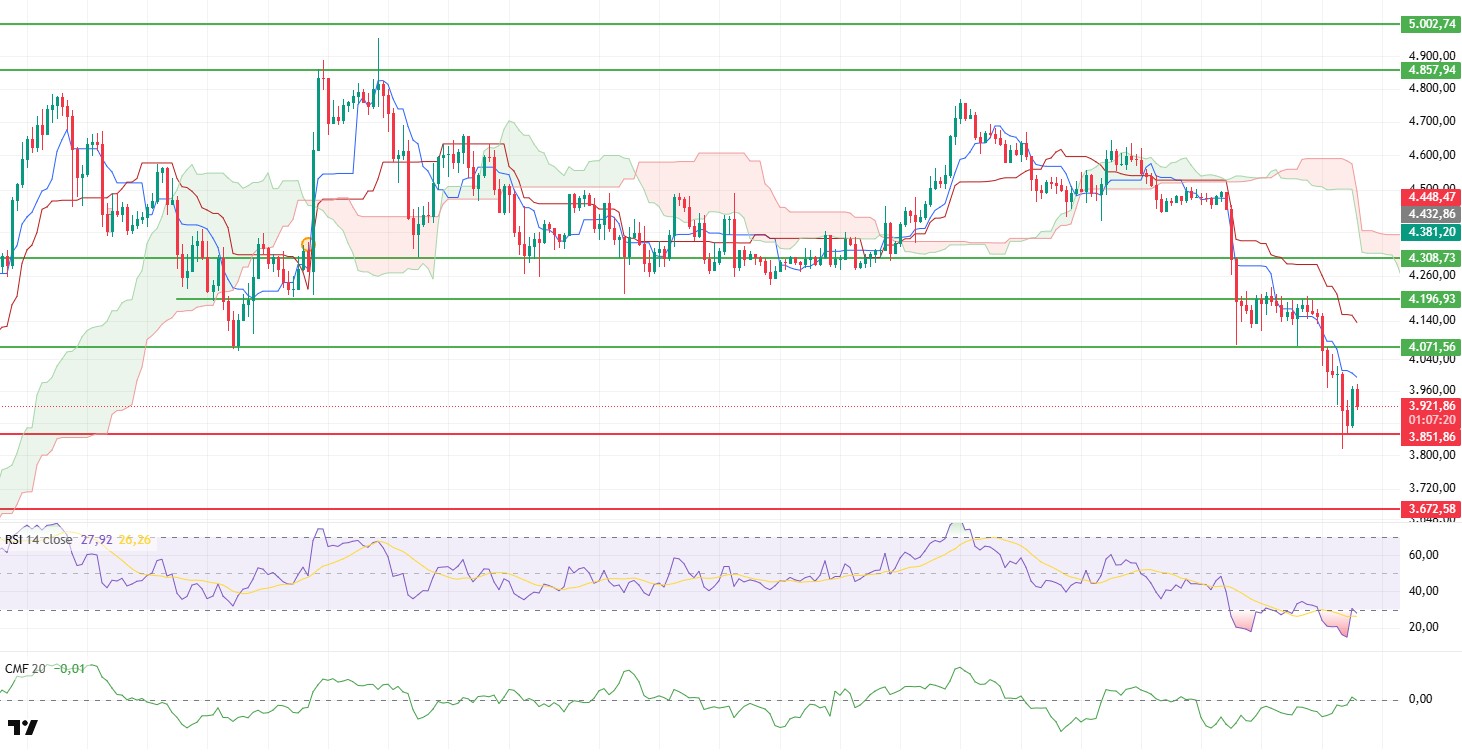
The ETH price fell below the $3,850 level yesterday evening amid heavy selling pressure, testing the anticipated critical support zone. Buying at this level triggered a short-term rebound, pushing the price up to around $3,970. However, selling pressure increased again in the morning hours, and the downward movement continued, with the price currently attempting to stabilize around the $3,925 level. This outlook reveals that the selling side remains strong and that the market structure remains weak in the short term.
Looking at momentum, the Relative Strength Index (RSI) indicator attempted a rapid exit from the oversold zone yesterday but re-entered the oversold zone with the latest wave of selling. This movement confirms that the market’s recovery power remains quite limited and that momentum continues to decline. Although the RSI hovering at these levels technically paves the way for buyers to step in in the short term, it is clear that the weak outlook persists under current conditions.
On the liquidity side, the Chaikin Money Flow (CMF) indicator is noteworthy. Although it attempted to rise above the zero line yesterday, it quickly returned to negative territory, signaling accelerated liquidity outflows from the market. This indicates that selling pressure has intensified, particularly in the spot market, and buyers are unable to maintain their presence. The CMF’s continued movement in negative territory supports the view that capital inflows are weakening and the market may be limited in its upward reactions.
Critical levels stand out in the short-term outlook. The $3,850 level remains the most important support. While the possibility of retesting this level appears quite strong, if it fails to hold, selling could accelerate, deepening towards the $3,780 – $3,720 band. On the other hand, the $3,970–$4,000 band stands out as the first resistance in upward movements. If sustainability is achieved above this region, the possibility of a short-term recovery towards the $4,070 level may gain strength.
Top of Form
Below the Form
Supports: 3,851 – 3,672 – 3,500
Resistances: 4,071 – 4,196 – 4,308
XRP/USDT
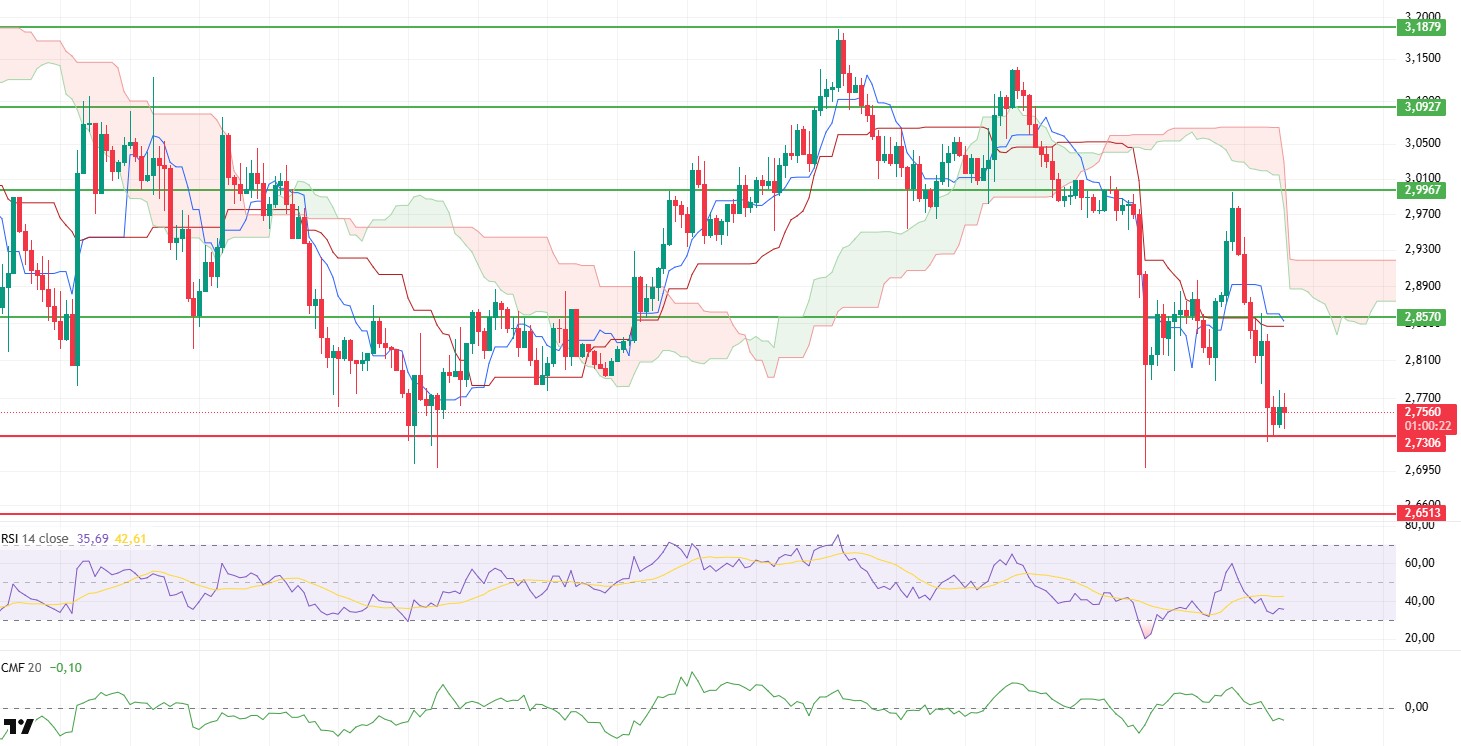
The XRP price fell below the $2.8570 level yesterday, losing its critical support, and declined to the next important level of $2.73 under the impact of selling pressure. The fact that buyers remain weak in XRP, which is currently trying to hold on to this region, indicates that the market still has a fragile structure. Whether this level can be maintained in the short term will be decisive for the direction of the price.
Technical indicators also confirm the current weakness. The Chaikin Money Flow (CMF) indicator remains in negative territory, indicating that liquidity outflows from the market continue and selling pressure persists. This suggests that any upward recovery attempts may be limited. On the momentum side, the Relative Strength Index (RSI) is showing a weak appearance near oversold levels. The RSI’s continued presence at these levels confirms that buying appetite is low and that selling pressure remains in control.
In the short term, the $2.73 level is a critical support level. A break below this level during the day could trigger accelerated selling, pushing the price back to the $2.65 level. On the upside, the first strong resistance is at the $2.8570 level. If this area is breached, the short-term negative outlook could weaken, and the price may rebound toward the $2.90–$2.99 range. Overall, while selling pressure continues to weigh on the XRP price, the critical threshold of $2.73 will be decisive for determining the direction in the short term. Persistence below this level could trigger sharper pullbacks, while possible resistance breakouts could pave the way for buyers to regain strength.
Supports: 2.7306 – 2.6513 – 2.4730
Resistances: 2.8570 – 2.9967 – 3.0927
SOL/USDT
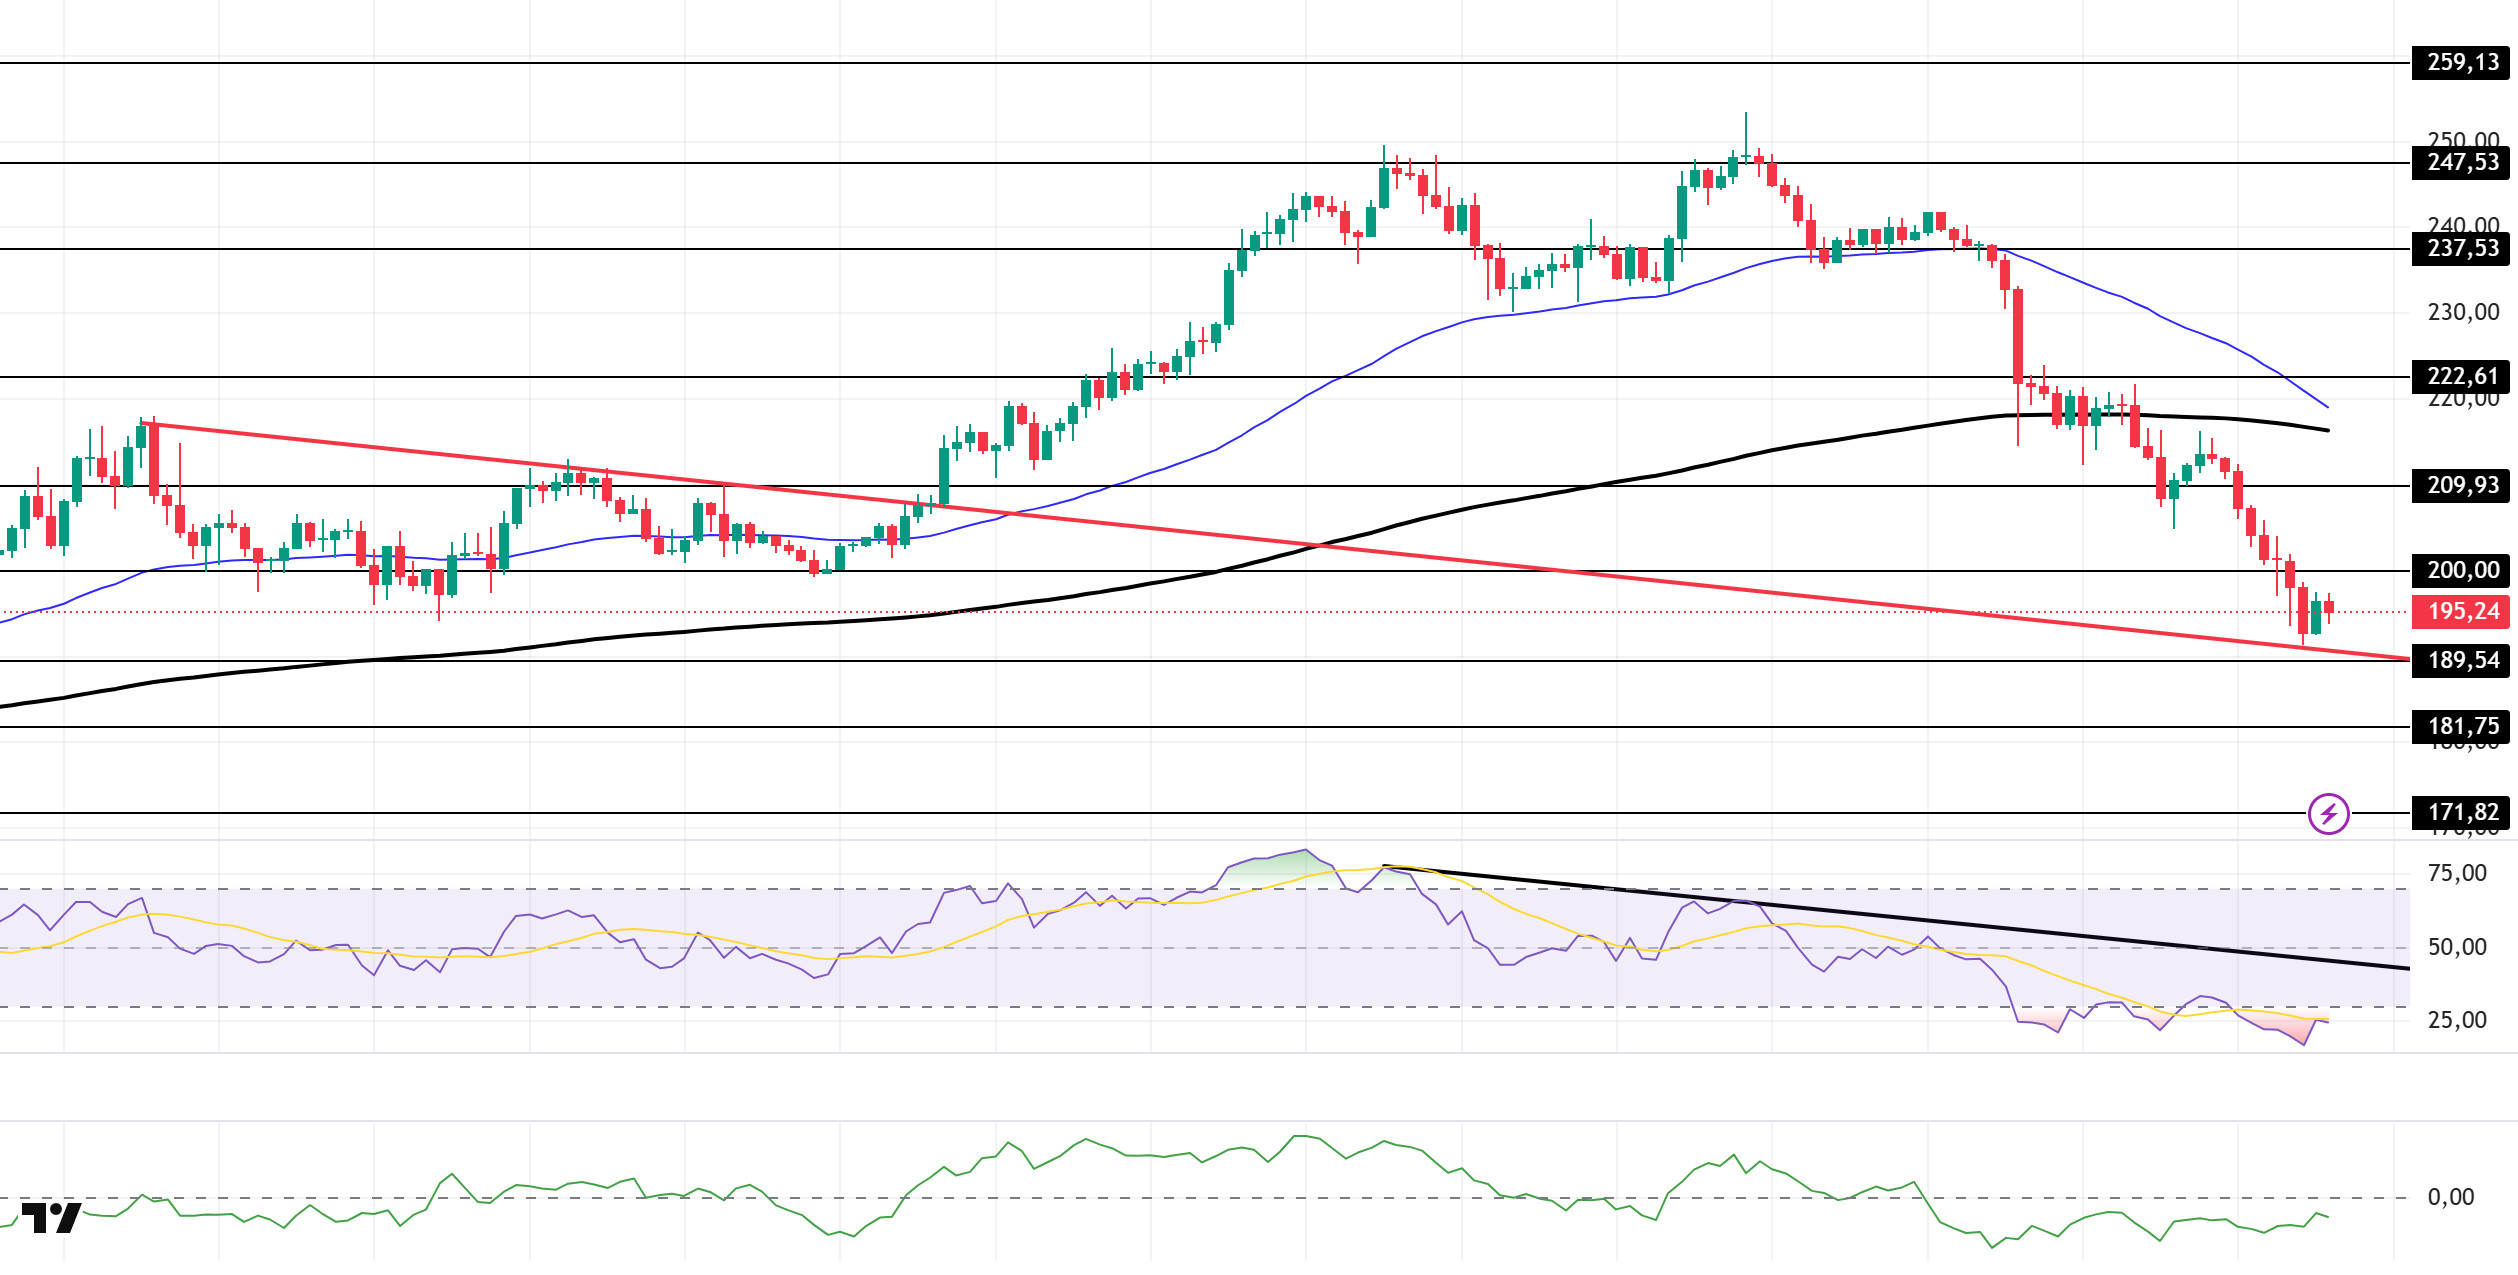
The SOL price continued its decline. The asset remains in the upper region of the downtrend that began on August 29. Currently testing the downtrend as support, the price could test the $181.75 level as support if the pullback continues. If rallies begin, the 200 EMA moving average can be monitored.
On the 4-hour chart, it remained above the 50 EMA (Exponential Moving Average – Blue Line) and 200 EMA (Black Line). This indicates that the medium-term upward trend may continue. At the same time, the price being below both moving averages shows us that the market is in a downward trend in the short term. The Chaikin Money Flow (CMF-20) remained in negative territory. However, an increase in cash inflows could push the CMF into positive territory. The Relative Strength Index (RSI-14) remained in oversold territory. This could lead to minor corrections. At the same time, it continued to remain below the downward trend that began on September 14, indicating that selling pressure continues. In the event of an upturn due to macroeconomic data or positive news related to the Solana ecosystem, the $209.93 level stands out as a strong resistance point. If this level is broken upwards, the uptrend is expected to continue. If there are pullbacks due to developments in the opposite direction or profit-taking, the $181.75 level could be tested. A decline to these support levels could increase buying momentum, presenting a potential upside opportunity.
Supports: 189.54 – 181.75 – 171.82
Resistances: 200.00 – 209.93 – 222.61
DOGE/USDT
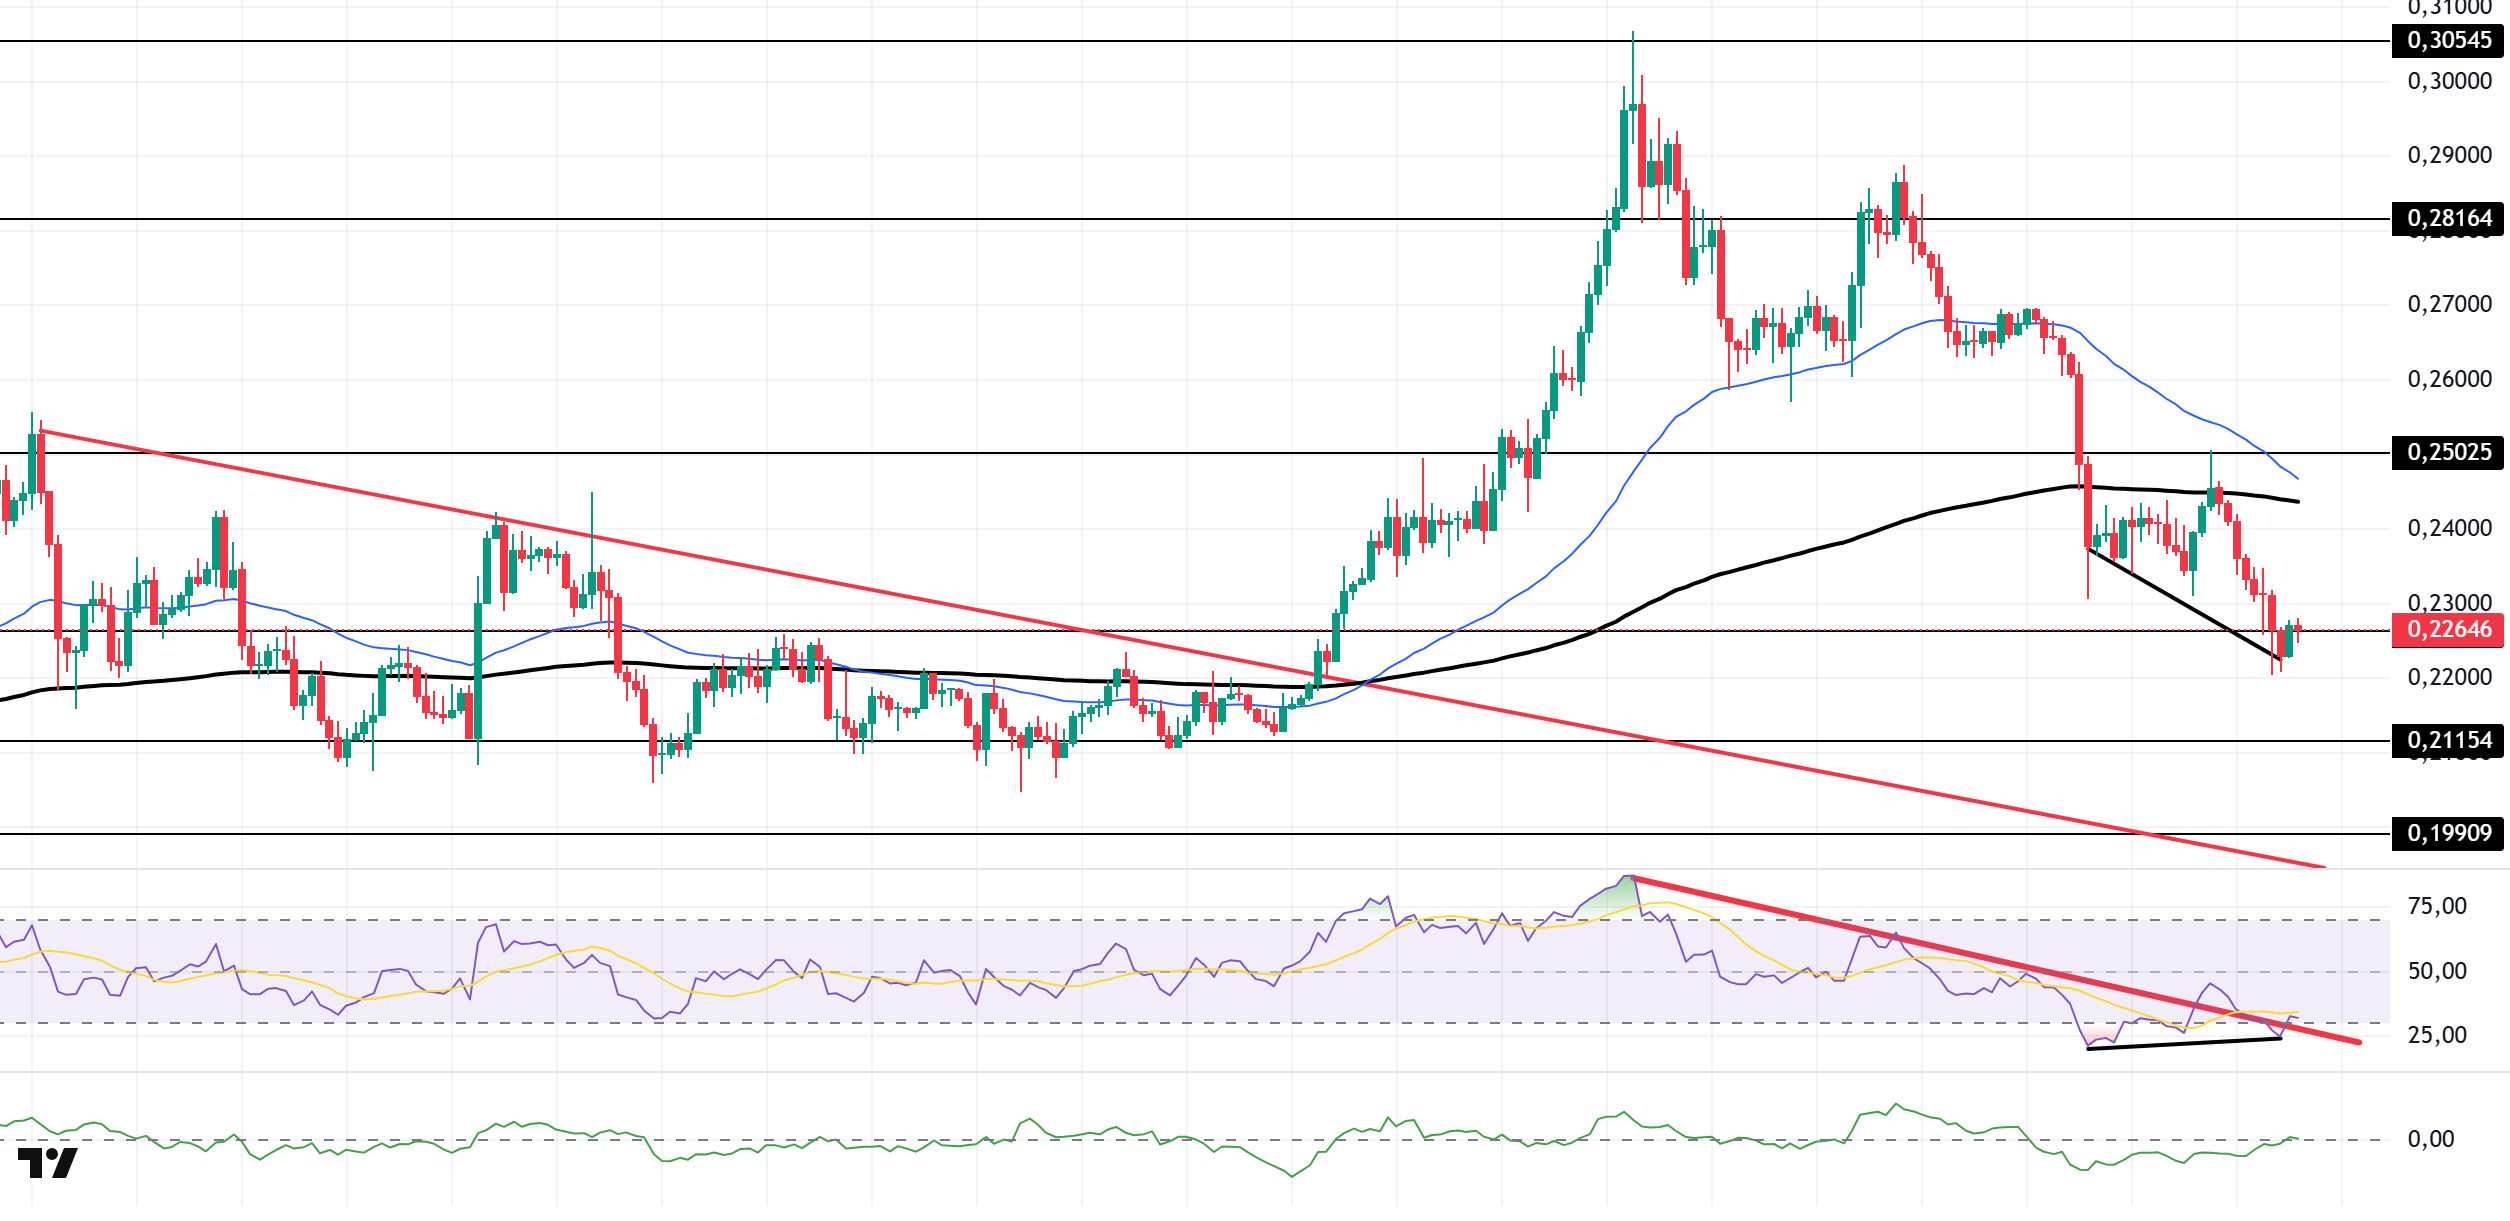
The DOGE price experienced a slight decline. The asset remained above the downward trend that began on August 14. Testing the strong support level of $0.25025 as resistance, the price failed to break through and retreated, moving below the 200 EMA (Exponential Moving Average – Black Line) moving average. Currently testing the $0.22632 level as support, the price may test the downward trend as support in the event of candle closes below this level. If the upward movement begins, it may follow the $0.25025 level.
On the 4-hour chart, the 50 EMA (Exponential Moving Average – Blue Line) remained above the 200 EMA (Black Line). This indicates that the medium-term upward trend continues. However, the price being below both moving averages indicates a short-term downward trend. The Chaikin Money Flow (CMF-20) has risen to a neutral level. Additionally, an increase in money inflows could push the CMF into positive territory. The Relative Strength Index (RSI-14) has started to re-enter the oversold zone. However, it tested the support level of the downtrend that began on September 13, indicating a decrease in selling pressure. Furthermore, positive divergence could strengthen the upward movement. In the event of an uptrend driven by political developments, macroeconomic data, or positive news flow within the DOGE ecosystem, the $0.25025 level stands out as a strong resistance zone. Conversely, in the event of negative news flow, the $0.21154 level could be triggered. A decline to these levels could increase momentum and initiate a new wave of growth.
Supports: 0.22632 – 0.21154 – 0.19909
Resistances: 0.25025 – 0.28164 – 0.30545
Legal Notice
The investment information, comments, and recommendations contained herein do not constitute investment advice. Investment advisory services are provided individually by authorized institutions taking into account the risk and return preferences of individuals. The comments and recommendations contained herein are of a general nature. These recommendations may not be suitable for your financial situation and risk and return preferences. Therefore, making an investment decision based solely on the information contained herein may not produce results in line with your expectations.


