
Technical Analysis – September 26, 2025 – Evening
BTC/USDT
The US August core PCE annual rate came in at 2.9%, in line with expectations. Fed Governor Barkin stated that uncertainties in interest rate policy persist and that there is limited information on inflation and unemployment. According to on-chain Lens data, the Bhutanese government transferred 355.51 BTC to a new wallet. In response to Trump’s TikTok executive order, China stated that it welcomes companies conducting commercial negotiations within market rules.
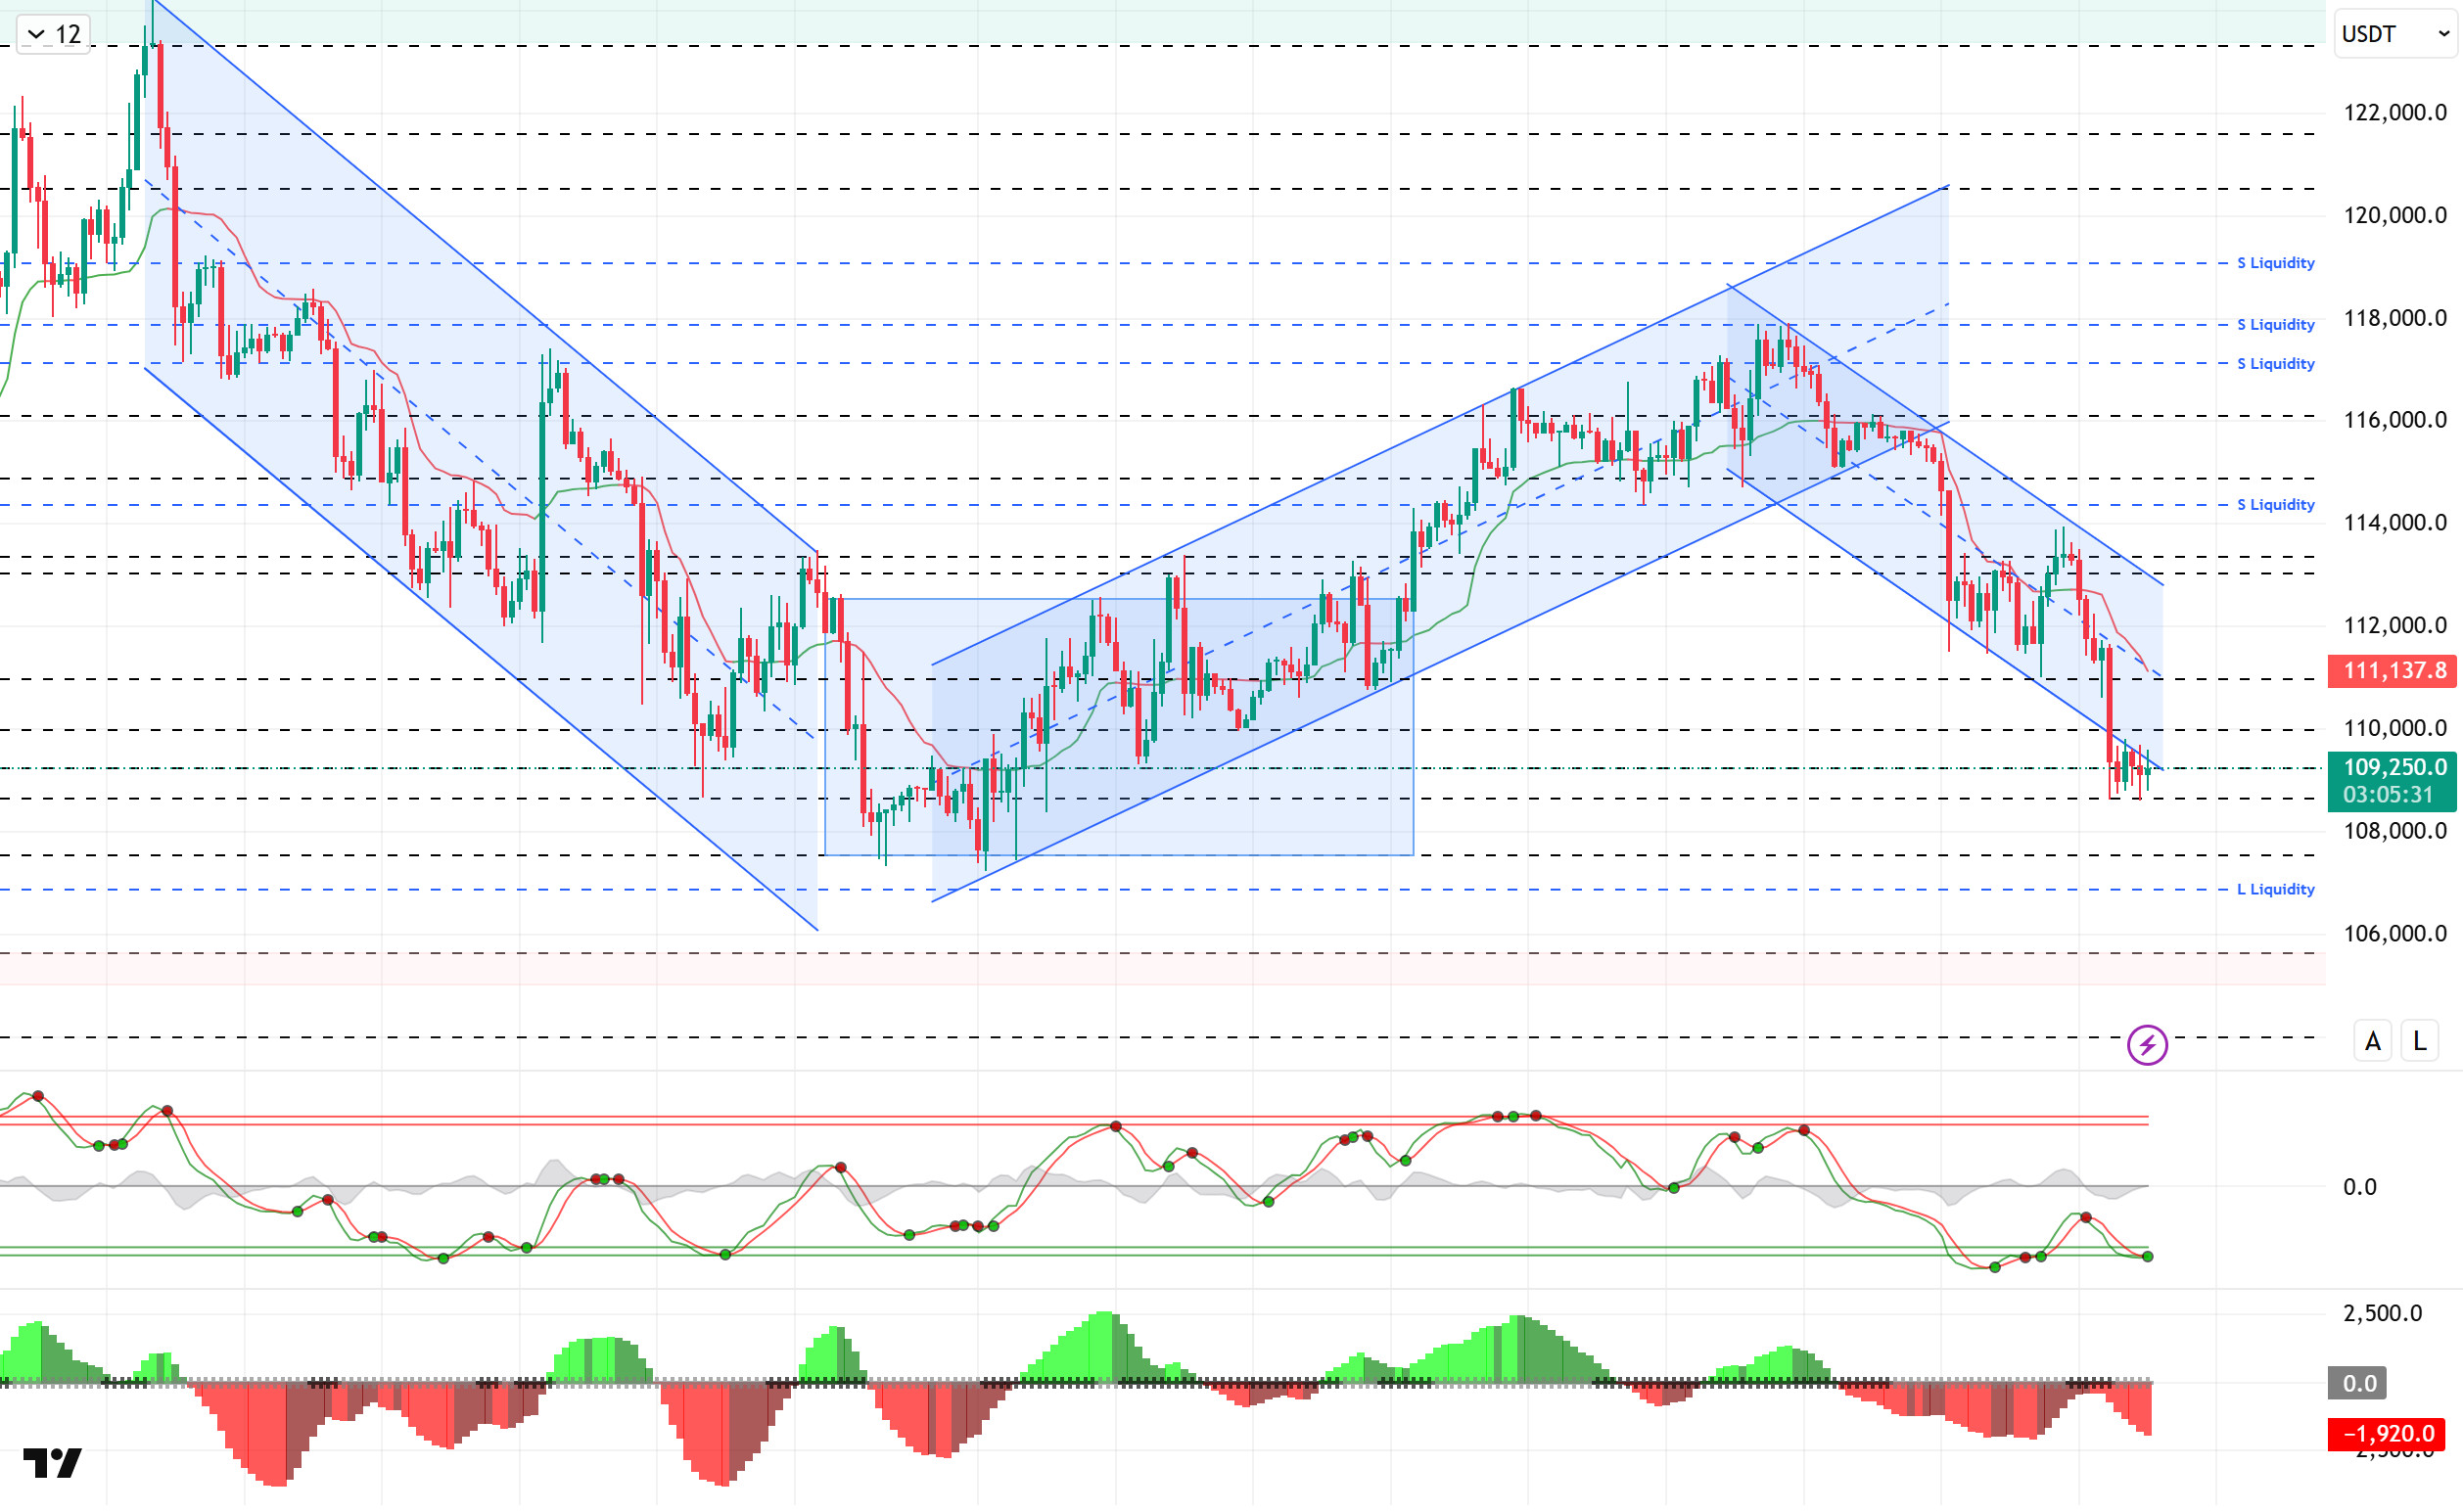
Looking at the technical picture, BTC, which has not experienced a significant change in price compared to the previous analysis, fell back to the 108,800 level once again during the day. Finding support again from this level, the price is at 109,500 at the time of writing the analysis, showing low volatility and low volume.
Technical indicators show that the Wave Trend oscillator (WT) is giving a buy signal again in the oversold zone, while the Squeeze Momentum (SM) indicator continues to lose momentum in the negative area of the histogram. The Kaufman moving average is currently trading above the price at 111,185.
According to liquidation data, short-term buy orders appear to be thinning out. In contrast, long-held buy orders within the monthly period underwent heavy liquidation as the price fell back to the $108,000–$109,000 range. Over the past 24 hours, more than $1 billion in liquidations occurred in the total market, with $236 million in long positions liquidated in BTC alone. On the other hand, on the selling side, short-term intensity is noticeable at the 114,000 level, while the 117,800–119,000 band continues to be an accumulation zone in the long term.
In summary, looking at the key developments, the decline in expectations for interest rate cuts, along with US macroeconomic data reducing the risk of recession, caused the market to lose its positive short-term environment. Differing views among Fed members on interest rate cuts and the reintroduction of tariffs have emerged as pessimistic developments for the market. On the technical side, the minor downtrend channel has deepened, while the price has lost important support levels. In liquidity data, with the recent decline, buy orders are being liquidated, including monthly-based trades, while an increase in sell orders is prominent. In this context, with the price falling below the 110,000 level, selling pressure continues, while the 108,600 level, tested several times yesterday, acts as support. A break below this level would bring the 107,500 support area into focus, while a potential rebound above 110,000 would be monitored for closes above this level.
Supports: 108,600 – 107,500 – 105,000
Resistances: 110,000 – 111,400 – 112,600
ETH/USDT
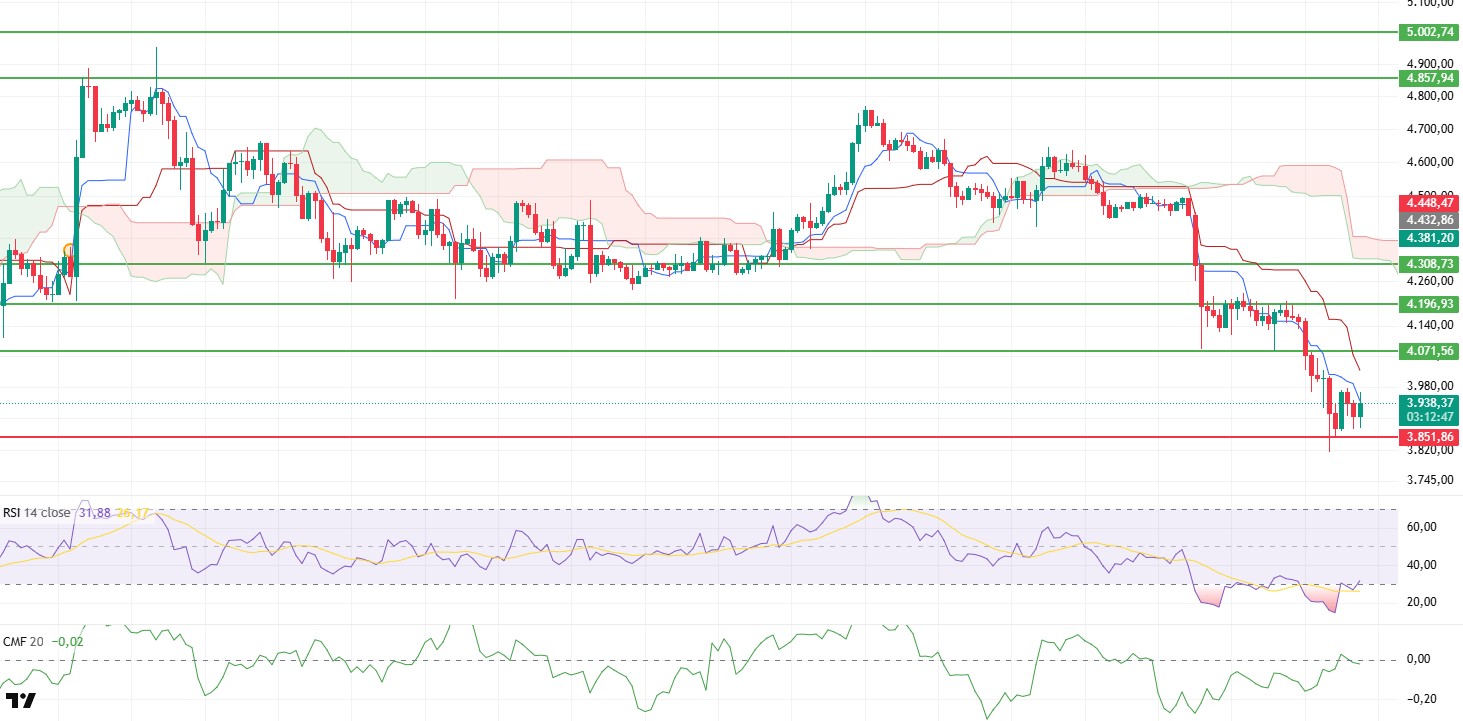
The highlight of the day was the Core Personal Consumption Expenditures Price Index (Core PCE) data from the US. The data was announced at 2.9%, in line with expectations, providing short-term relief to the market. Following this development, the price of Ethereum reacted with an upward movement towards the $3,960 level during the day. However, this rise was not sustainable, and the price faced selling pressure again. This scenario reveals that the market maintains its current weak outlook.
When examining technical indicators, the Relative Strength Index (RSI) managed to break out of the oversold zone along with the reaction in prices. However, the fact that the indicator is still moving below the 50 level indicates that buyers have not gained strength and that the rallies may remain limited. In short, although the RSI is signaling a recovery, this signal does not appear to indicate a strong trend reversal.
Looking at liquidity, it is noteworthy that the Chaikin Money Flow (CMF) indicator continues to remain in negative territory. This confirms that funds continue to flow out of the market despite attempts at price recovery. Weak investor risk appetite suggests that selling pressure on ETH may be persistent.
In terms of price levels, the $3,850 support level stands out as a critical threshold. It is likely that this level will be retested during the day. If this support level is broken, sales are likely to accelerate and deeper declines may occur. In this scenario, areas below $3,800 for ETH may be on the radar in the short term.On the other hand, the $4,070 level should be monitored as the most critical resistance point in potential recovery attempts. If the price manages to stay above this barrier, a new wave of growth towards the $4,196 level could be triggered. However, the likelihood of selling pressure re-emerging before reaching this level appears quite high. In the broader context, both technical indicators and liquidity data reveal that Ethereum maintains a negative outlook in the short term. With buying interest remaining limited and selling pressure regaining strength with each recovery, investors should remain cautious.
Top of Form
Below the Form
Support Levels: 3,851 – 3,672 – 3,500
Resistances: 4,071 – 4,196 – 4,308
XRP/USDT
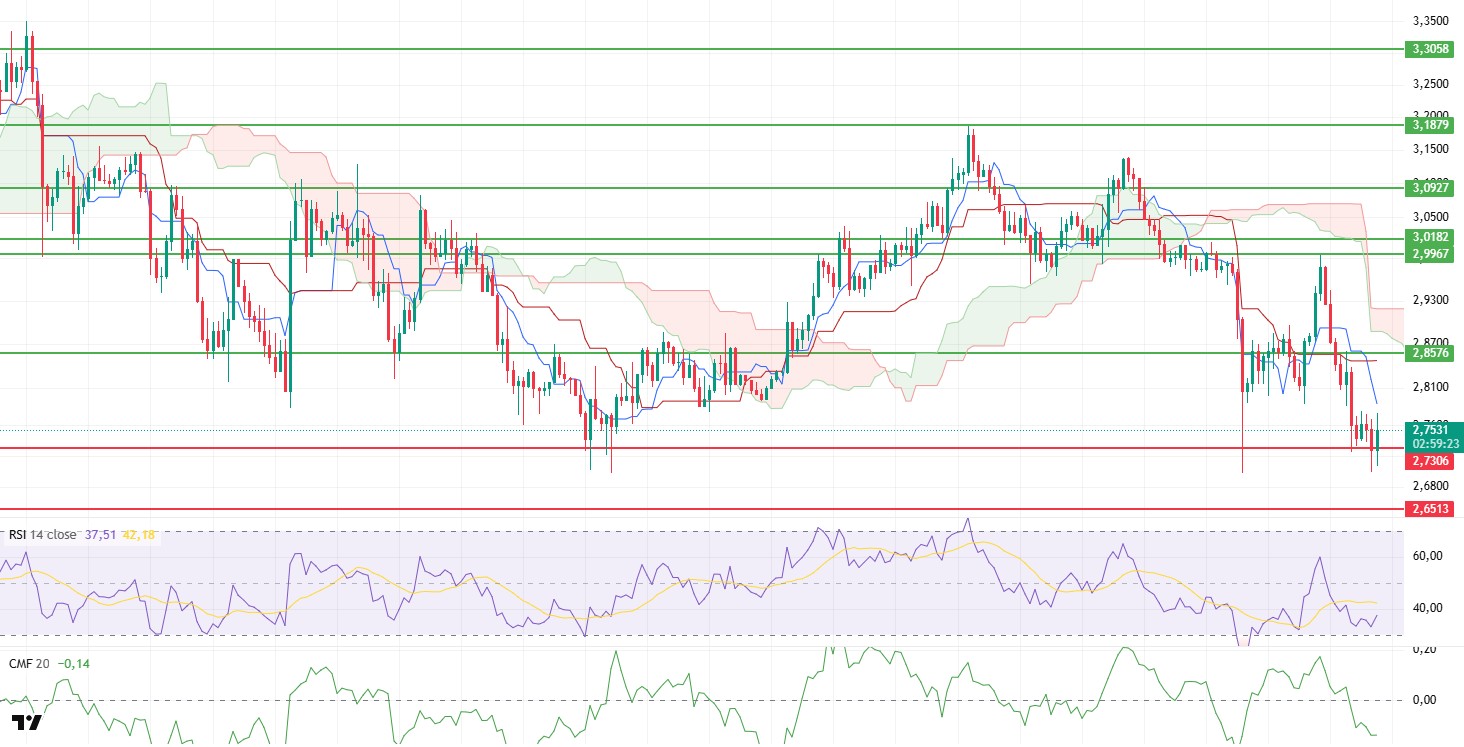
Although the XRP price breached the $2.73 level during the day, it managed to hold on in this region. However, despite the price remaining just above this support, the continued weakness in technical indicators reveals that the overall market outlook is still negative. In particular, the inability of buyers to push the price above critical resistance levels after volatile movements confirms that sellers remain in control.
Looking at liquidity, it is noteworthy that the Chaikin Money Flow (CMF) indicator continues its downward trend in negative territory. This indicates that funds continue to flow out of the market and buyers remain weak in entering the market. In other words, even though the price is trying to hold at certain support levels, selling pressure remains strong in the background.
When examining momentum indicators, although the Relative Strength Index (RSI) has shown a short-term reaction, this recovery has been limited. The fact that the RSI is still moving in low regions indicates that the market has not gained strong momentum and that the price is moving in a sideways-range-bound manner. This scenario suggests that short-term upward attempts may struggle to gain traction.
In terms of price levels, the $2.73 support level retains its critical importance. Closings below this level, especially in the evening hours, could accelerate downward momentum and cause the price to retreat towards the $2.65 level. In this scenario, sellers are likely to gain a stronger advantage. On the other hand, in a potential recovery scenario, the $2.85 level is the most critical resistance point. If the price breaks above this barrier and maintains its position , buyers may regain strength, and a recovery process towards the $2.92 to $2.99 levels could begin. However, until this happens, it would be more accurate to say that the market is predominantly under the control of sellers.
Supports: 2.7306 – 2.6513 – 2.4730
Resistances: 2.8570 – 2.9967 – 3.0927
SOL/USDT
Canary submitted an updated version of its S-1 filing for a spot Solana ETF to the U.S. Securities and Exchange Commission (SEC).
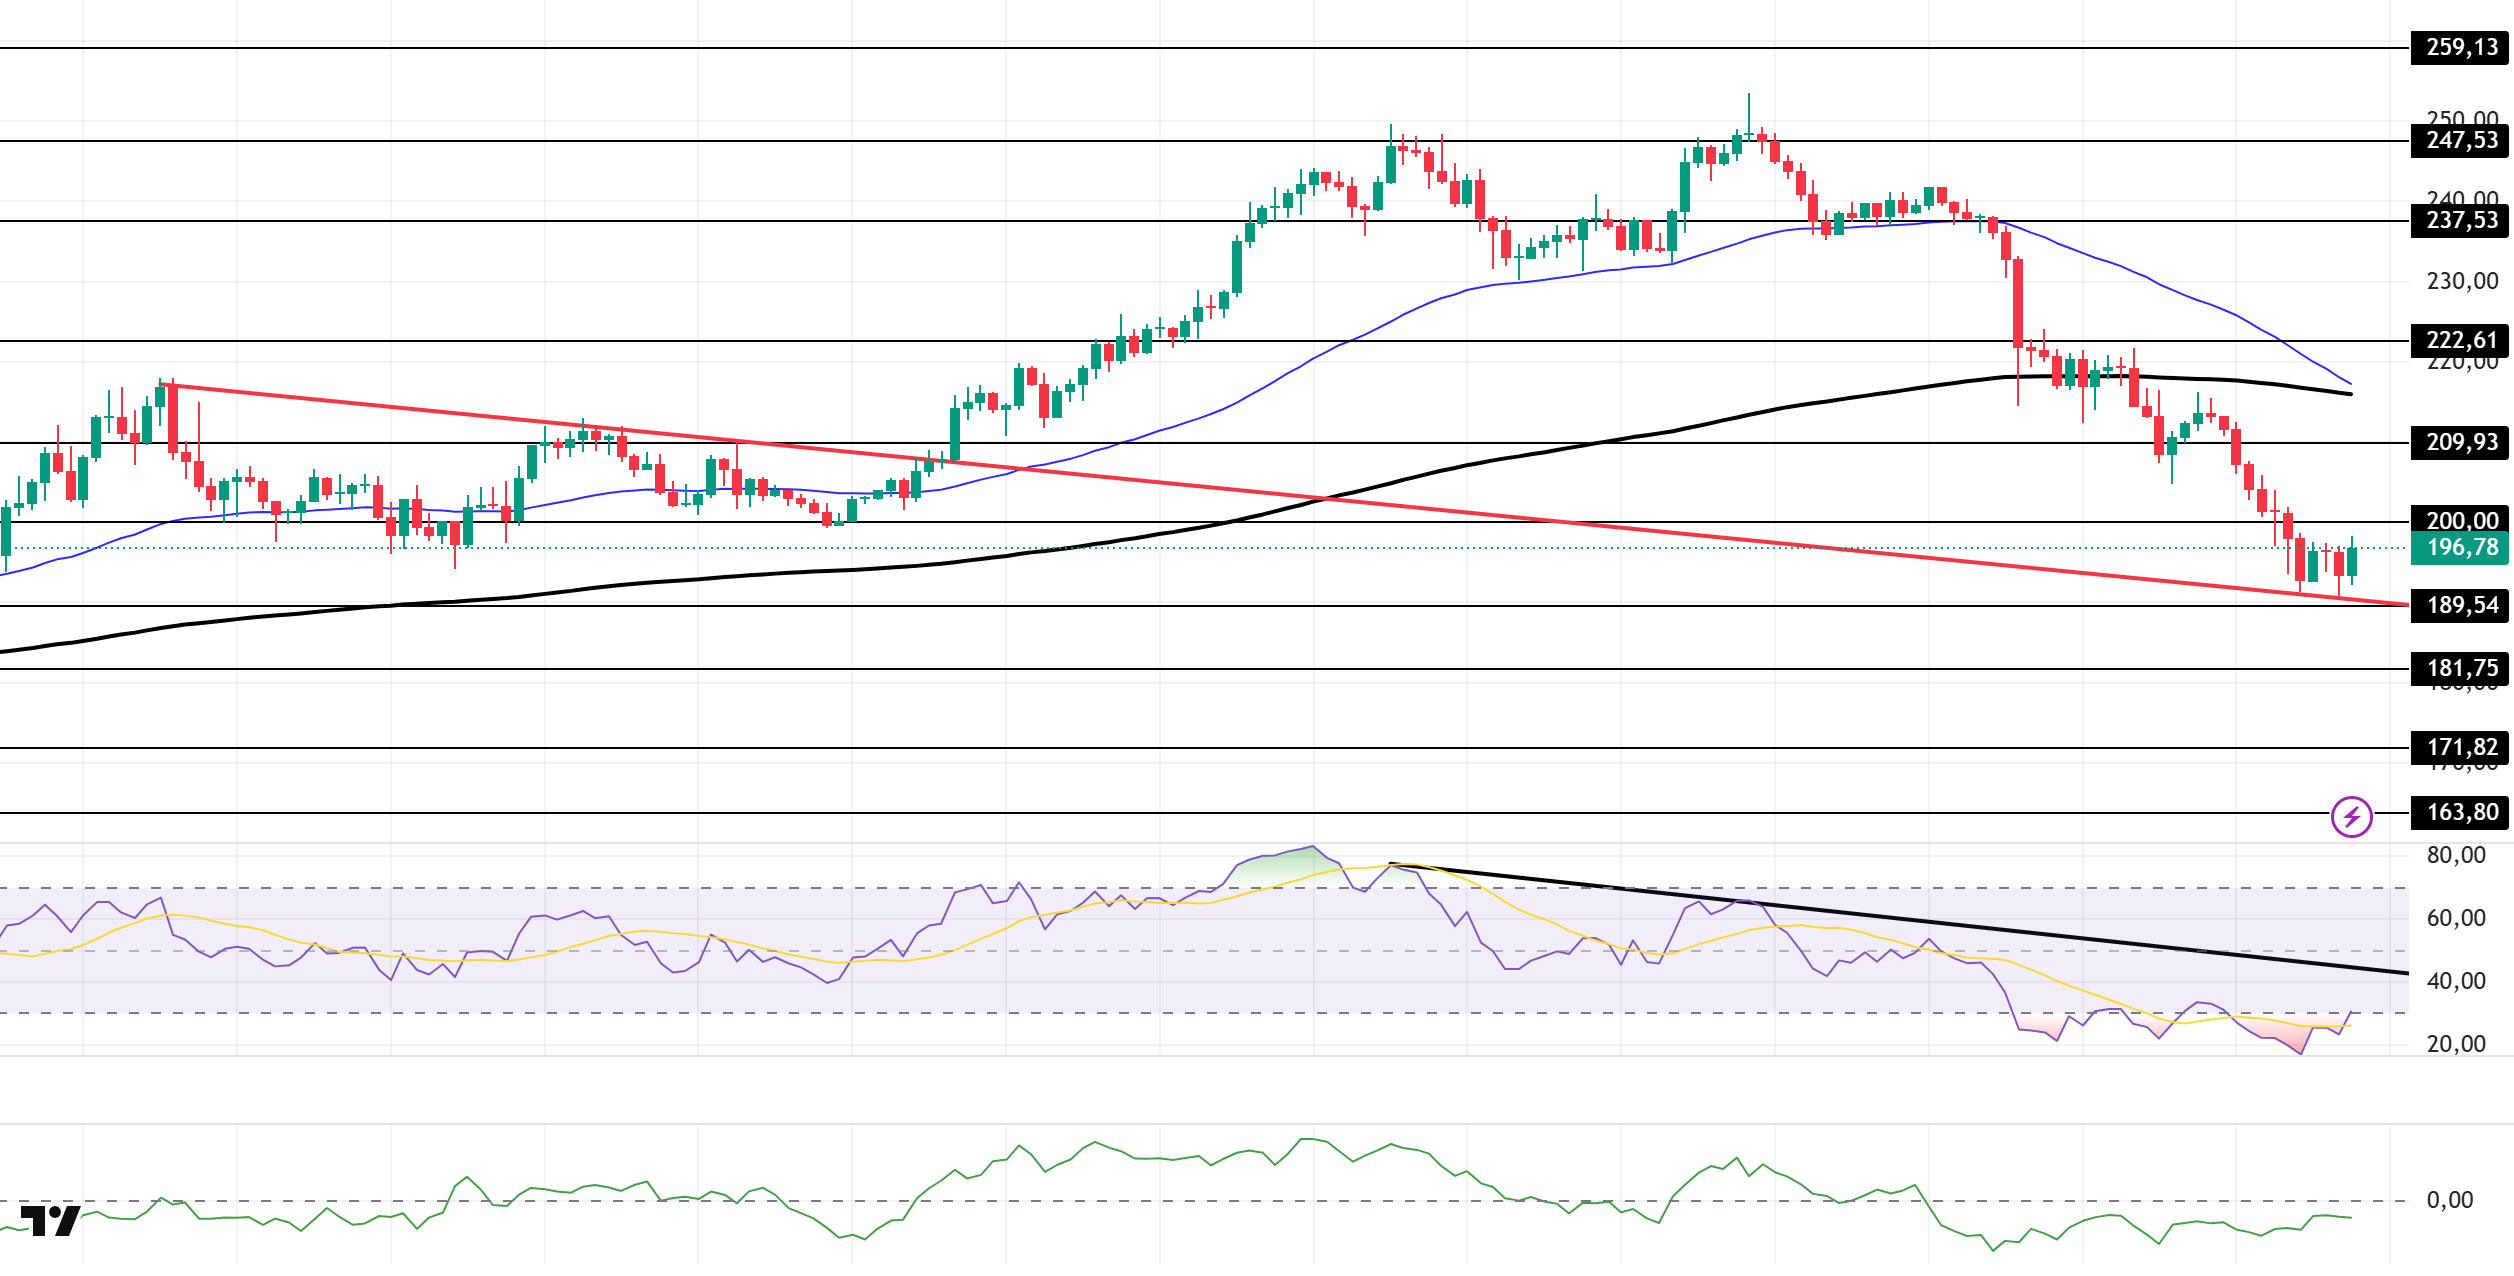
The SOL price traded sideways during the day. The asset continues to trade in the upper region of the downtrend that began on August 29. Currently testing the downtrend as support, the price could test the $181.75 level as support if the pullback continues. If the uptrend resumes, the 200 EMA moving average can be monitored.
On the 4-hour chart, it continued to trade above the 50 EMA (Exponential Moving Average – Blue Line) and 200 EMA (Black Line). This indicates that the medium-term upward trend may continue. At the same time, the price being below both moving averages shows us that the market is in a downward trend in the short term. The Chaikin Money Flow (CMF-20) remained in negative territory. However, a decrease in cash inflows could push the CMF deeper into negative territory. The Relative Strength Index (RSI-14) remained in oversold territory. This could lead to minor corrections. At the same time, it continued to remain below the downtrend that began on September 14, signaling continued selling pressure. In the event of an upturn due to macroeconomic data or positive news related to the Solana ecosystem, the $209.93 level stands out as a strong resistance point. If this level is broken upwards, the uptrend is expected to continue. If there are pullbacks due to developments in the opposite direction or profit-taking, could test the $181.75 level. A decline to these support levels could increase buying momentum, presenting a potential upside opportunity.
Supports: 189.54 – 181.75 – 171.82
Resistances: 200.00 – 209.93 – 222.61
DOGE/USDT
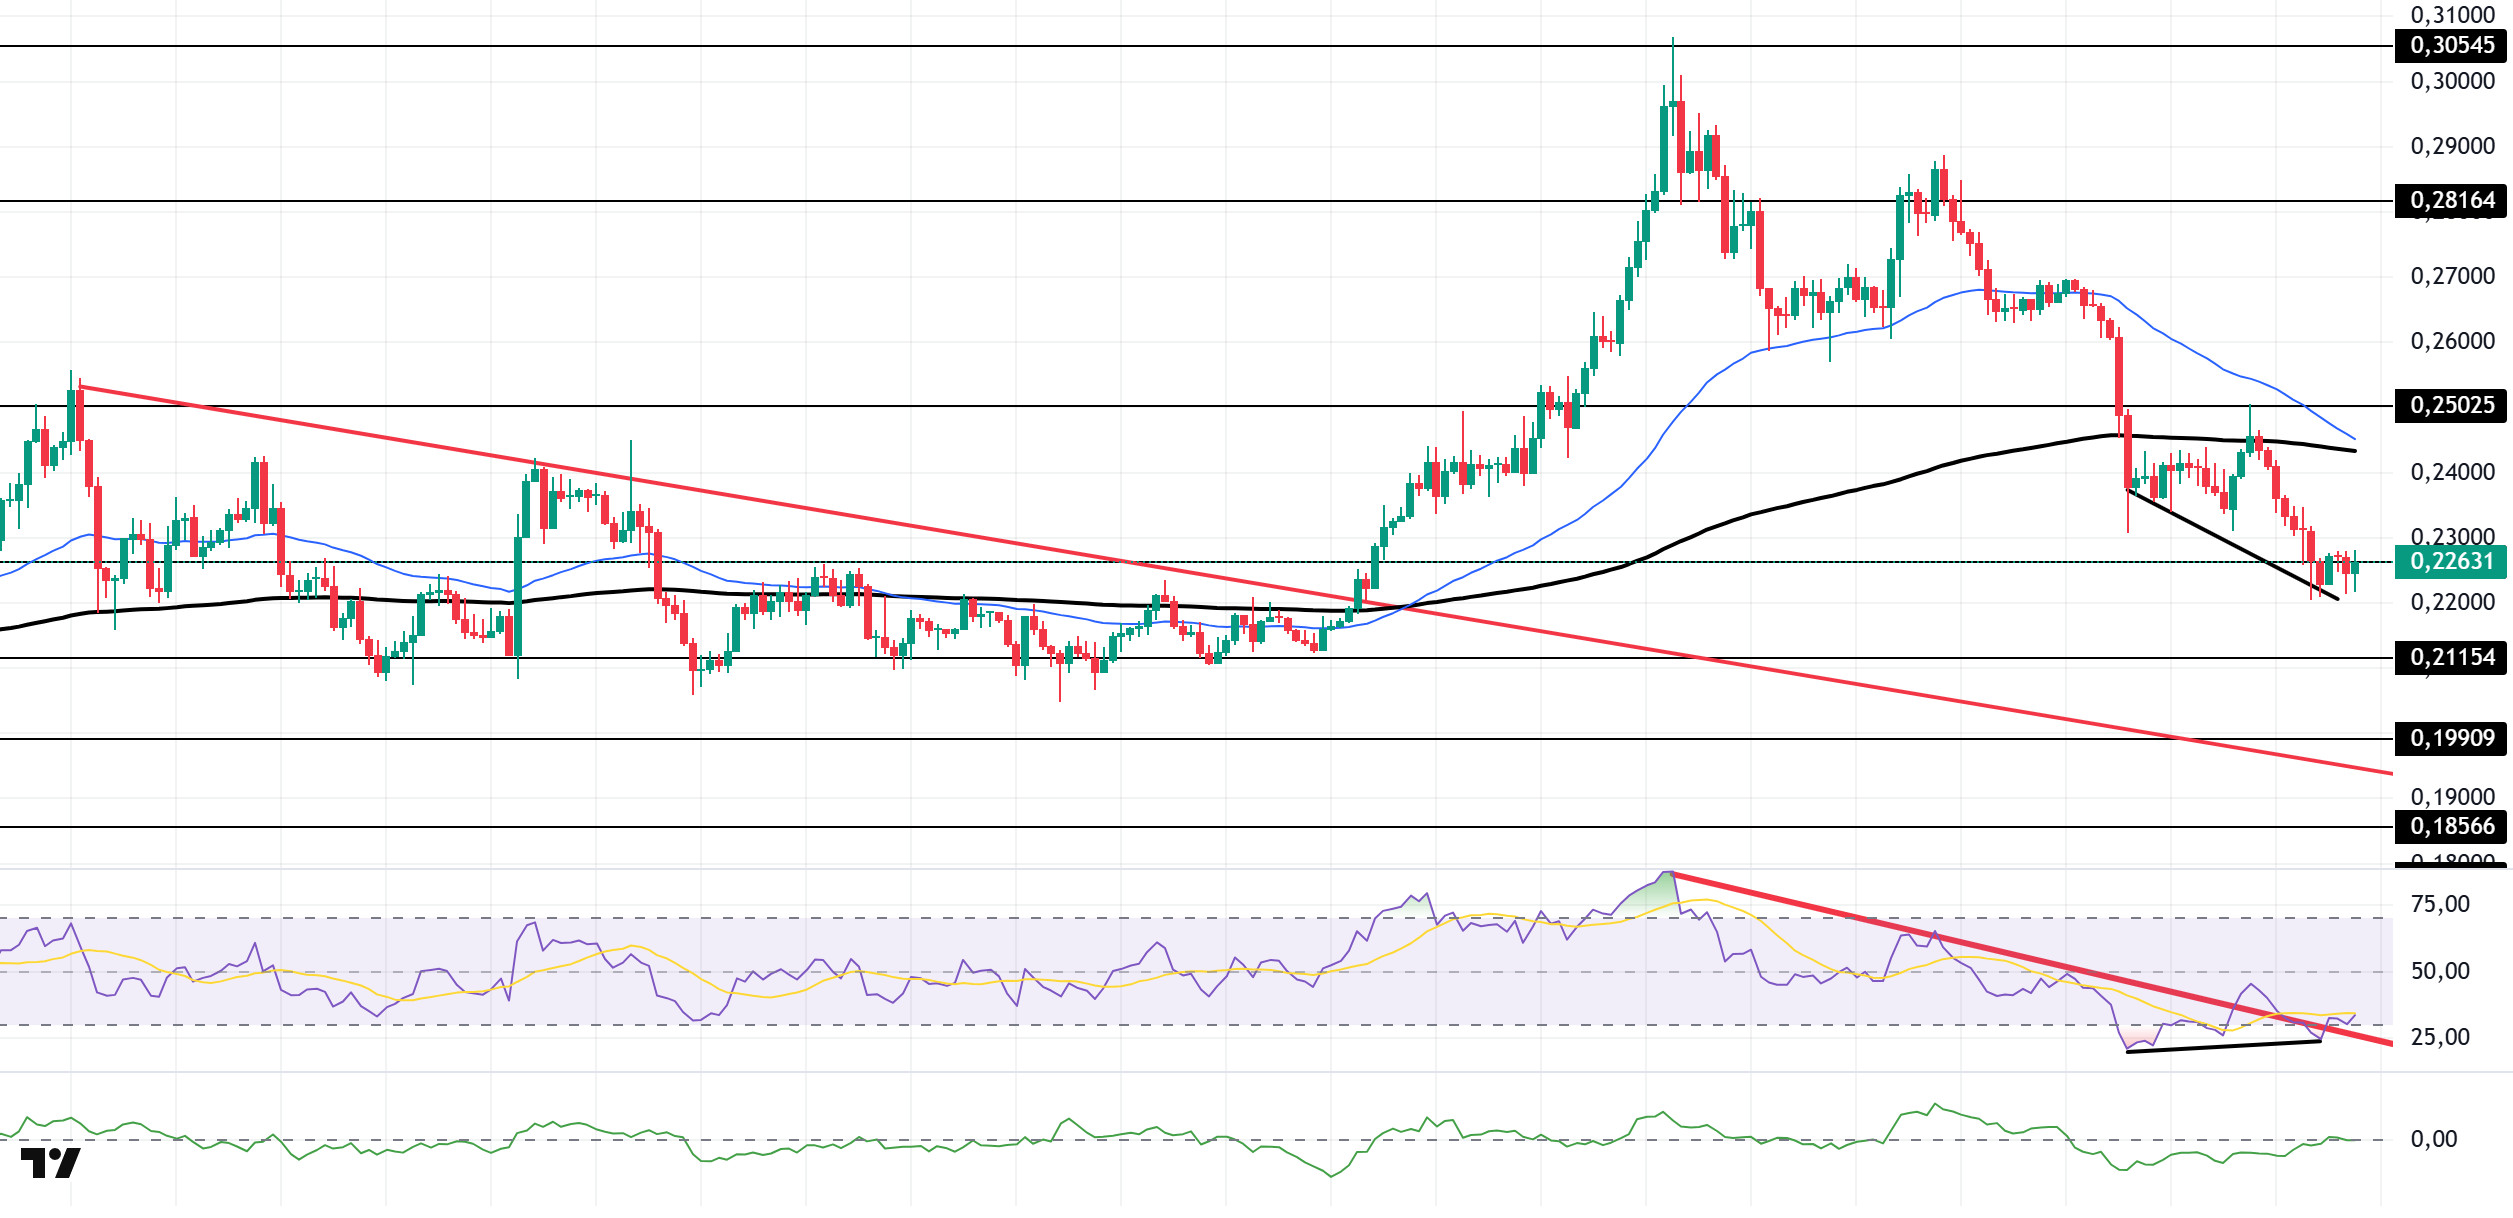
The DOGE price remained flat during the day. The asset continued to trade above the downward trend that began on August 14. Testing the strong support level of $0.25025 as resistance, the price failed to break through and retreated, moving below the 200 EMA (Exponential Moving Average – Black Line) moving average. Currently testing the $0.22632 level as support, the price may test the downward trend as support in the event of candle closes below this level. If an uptrend begins, it may follow the $0.25025 level.
On the 4-hour chart, the 50 EMA (Exponential Moving Average – Blue Line) remained above the 200 EMA (Black Line). This indicates that the medium-term upward trend continues. However, the price being below both moving averages indicates a short-term downward trend. The Chaikin Money Flow (CMF-20) remains at a neutral level. Additionally, a decrease in money inflows could push the CMF into negative territory. The Relative Strength Index (RSI-14) experienced a slight upward acceleration from the oversold zone and broke above the downward trend that began on September 13, moving into the upper region. This could create buying pressure. However, positive divergence could reinforce the upward movement. In the event of an uptrend driven by political developments, macroeconomic data, or positive news flow in the DOGE ecosystem, the $0.25025 level stands out as a strong resistance zone. Conversely, in the event of negative news flow, the $0.21154 level could be triggered. A decline to these levels could increase momentum and initiate a new wave of upward movement.
Supports: $0.21154 – $0.19909 – $0.18566
Resistances: 0.22632 – 0.25025 – 0.28164
Legal Notice
The investment information, comments, and recommendations contained herein do not constitute investment advice. Investment advisory services are provided individually by authorized institutions taking into account the risk and return preferences of individuals. The comments and recommendations contained herein are of a general nature. These recommendations may not be suitable for your financial situation and risk and return preferences. Therefore, making an investment decision based solely on the information contained herein may not produce results in line with your expectations.

