
Technical Analysis – September 29, 2025
BTC/USDT
In the US, the August PCE price index rose 2.7% annually and 0.3% monthly; core PCE remained steady at 2.9%. The University of Michigan consumer confidence index fell to 55.1, while 1-year inflation expectations dropped to 4.7% and long-term expectations fell to 3.7%. As the risk of a government shutdown continues in Washington, Trump announced new tariff plans on pharmaceuticals and semiconductors. Chinese Premier Li Qiang emphasized stability in US-China relations. While the People’s Bank of China stated that the need for additional stimulus in the short term has decreased, the US administration is considering easing arms restrictions on Ukraine. SEC Chairman Atkins brought up the transition from quarterly to semi-annual reporting requirements for companies.
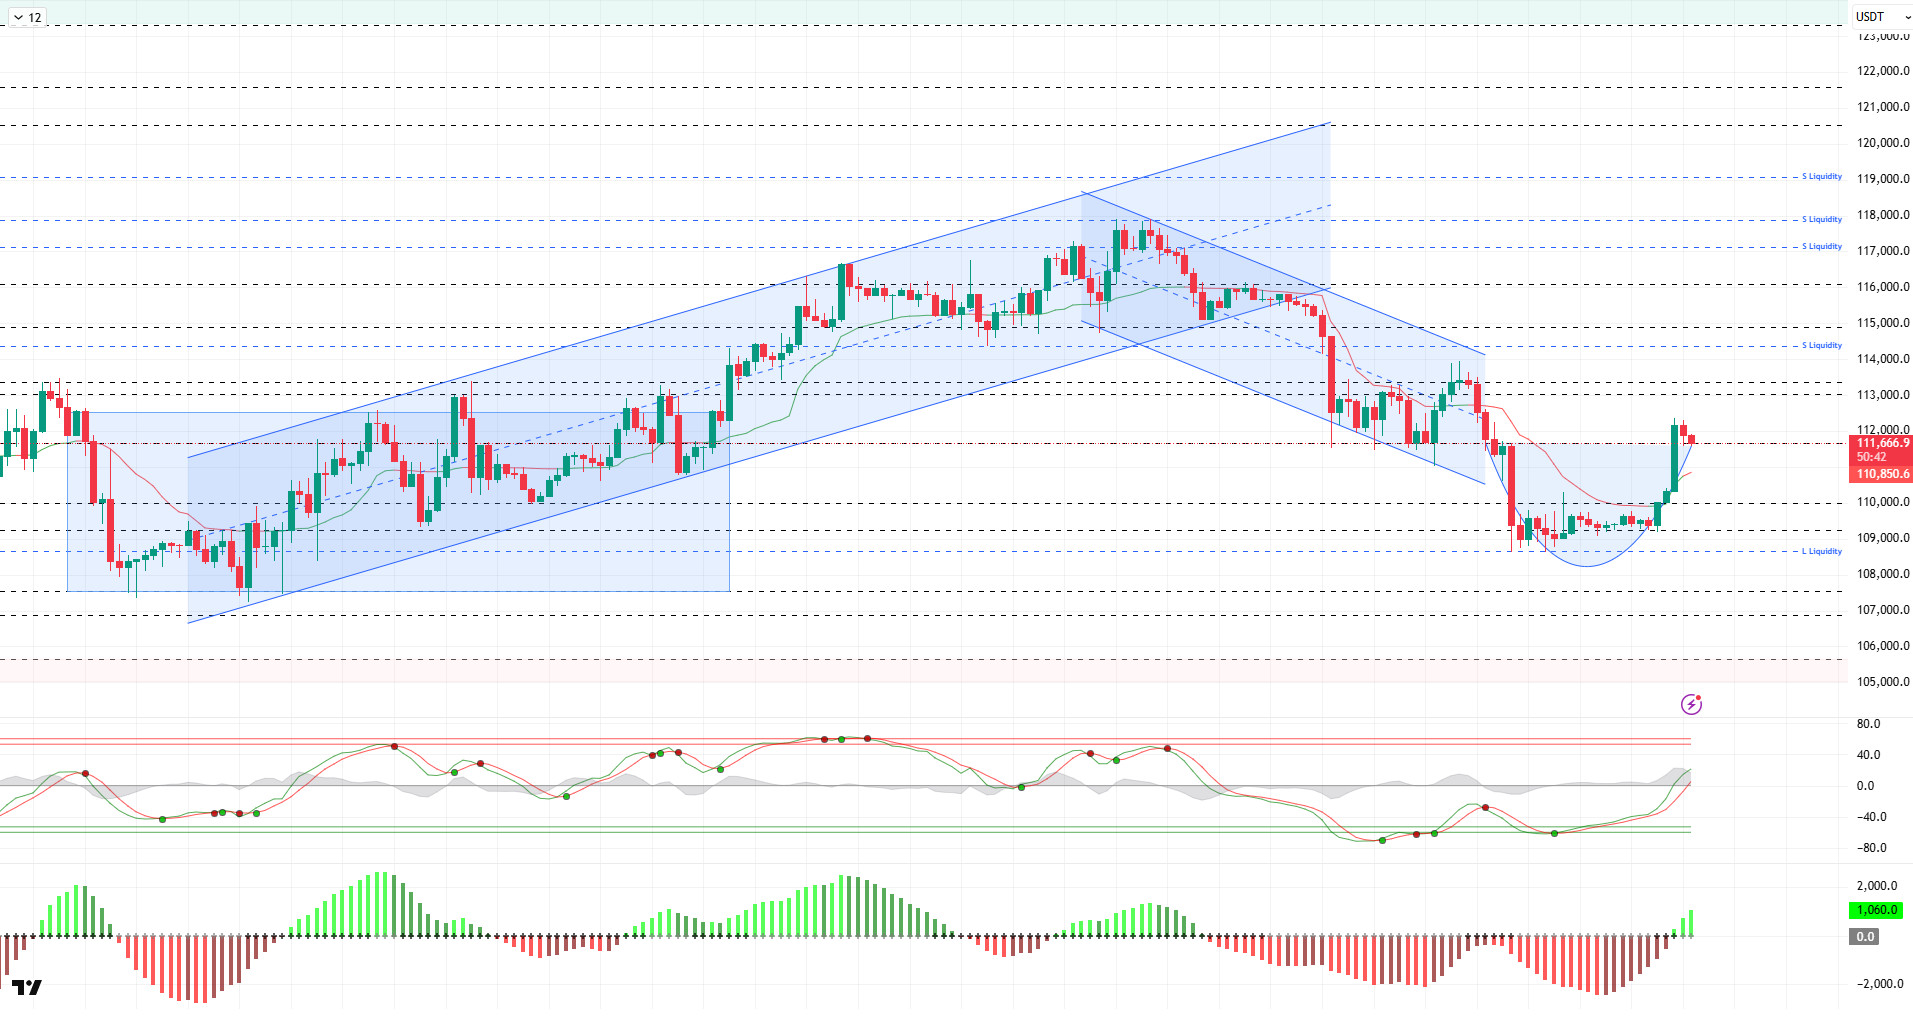
Looking at the technical picture, BTC managed to stay above the 109,000 level despite testing it several times over the weekend. Then, with the momentum it gained, the price surpassed the 110,000 level and reached 111,700. With the cup formation seen in its price, the price continues to trade at the 111,700 level.
Technical indicators show that the Wave Trend oscillator (WT) has crossed the middle band of the parallel channel, in line with the buy signal it gave in the oversold zone. The histogram on the Squeeze Momentum (SM) indicator is trying to gain momentum within the positive area. The Kaufman moving average is currently trading below the price at the 110,850 level.
According to liquidation data, short-term sell positions opened above the 110,000 level were liquidated with the latest rise. However, consolidation continues in the 114,000–115,000 range over a broader time frame. Meanwhile, increased buying activity at the 108,000–109,000 levels has transformed this area into an accumulation zone. Looking at the last 24 hours, $47 million in short positions were liquidated on the BTC side, while $4 million in long positions were liquidated. The total market liquidation size was recorded at $348 million.
In summary, looking at the key developments, the decline in expectations for interest rate cuts, along with US macroeconomic data reducing the risk of recession, led to the loss of a positive short-term environment for the market. Differing views among Fed members on interest rate cuts and the reintroduction of tariffs have emerged as pessimistic developments for the market. On the other hand, with October approaching, which has been dominated by gains in crypto, the price appears to be recovering from its low point. Technically, with the formation of a cup pattern, BTC appears to be recovering. Liquidity data shows that increasing sell-side transactions have become the target. In this context, the 112,600 level is being monitored as a resistance point in the continuation of the upward movement, while the 111,400 and then 110,000 levels will be monitored as reference points in the event of a possible selling pressure.
Supports: 111,400 – 110,000 – 108,600
Resistances: 112,600 – 114,000 – 115,000
ETH/USDT
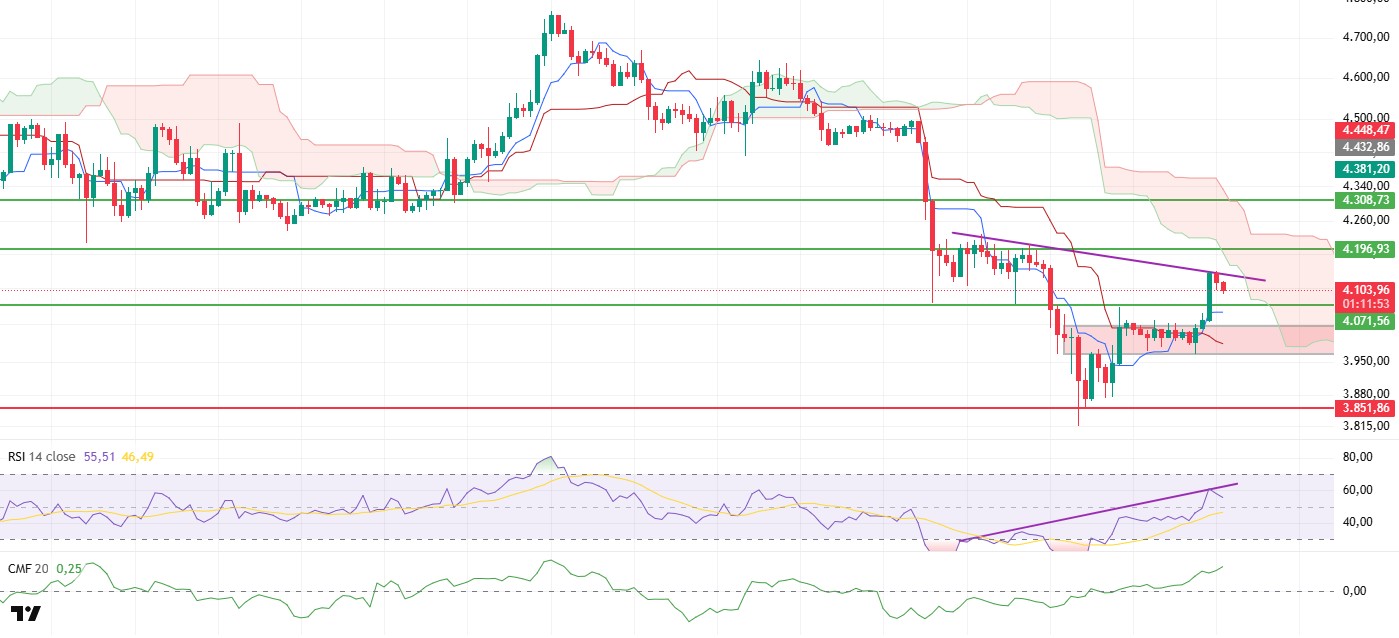
The ETH price attempted to break through the $4,070 level on Friday evening, but despite buyers’ efforts, this attempt failed. By Sunday evening, increased spot buying appetite pushed the price above this level, reaching over $4,140. However, selling pressure from this region caused some of the gains to be reversed, and the price found equilibrium around the $4,100 level. This price movement not only indicates that buyers have returned to the market strongly, but also signals that the recovery in technical indicators and on-chain data has begun to be priced in. In particular, the recovery of momentum, which had weakened during the recent decline, and the renewed strength of spot demand stand out as key factors determining the market’s short-term direction.
The Cumulative Volume Delta (CVD) indicator reveals that buying pressure in the spot market is quite strong. This data is one of the most important indicators supporting the view that the price’s upward potential remains strong.
When examining the Ichimoku indicator, it is seen that the price has risen above both the Tenkan and Kijun levels, supporting the short-term positive outlook. The tenkan level settling above the kijun is an important technical signal for the market, indicating that buyer pressure may continue in the short term. Furthermore, the position of the kumo cloud around the price supports the uptrend, and the price holding in this area may contribute to strengthening the trend.
The Chaikin Money Flow (CMF) indicator also shows a sharp rise in positive territory, clearly indicating a high influx of liquidity. This outlook shows that new funds are entering the market and that buyer appetite has strengthened significantly compared to the previous period.
The Relative Strength Index (RSI) indicator showed positive divergence along with the recent rise. However, it also approached the overbought zone, reminding us that the price may need a technical correction in the short term. This outlook on the RSI suggests that there may be some profit-taking in the market and that the price may retest the $4,070 level.
From a technical perspective, the $4,070 level remains a critical threshold. If the price holds above this level, it will keep the upward momentum alive, and the $4,196 level is expected to be tested as the first major resistance point. If this level is breached, a stronger upward momentum could form, and the market could move towards sustained pricing above $4,200. On the other hand, closing below the $4,070 level could lead to increased selling pressure. In such a scenario, the price could initially retreat to the $3,851 support level. If it falls below this level, the declines could become more severe, and the market’s short-term outlook could deteriorate.
Supports: 4,071 – 3,851 – 3,672
Resistances: 4,196 – 4,308 – 4,441
XRP/USDT
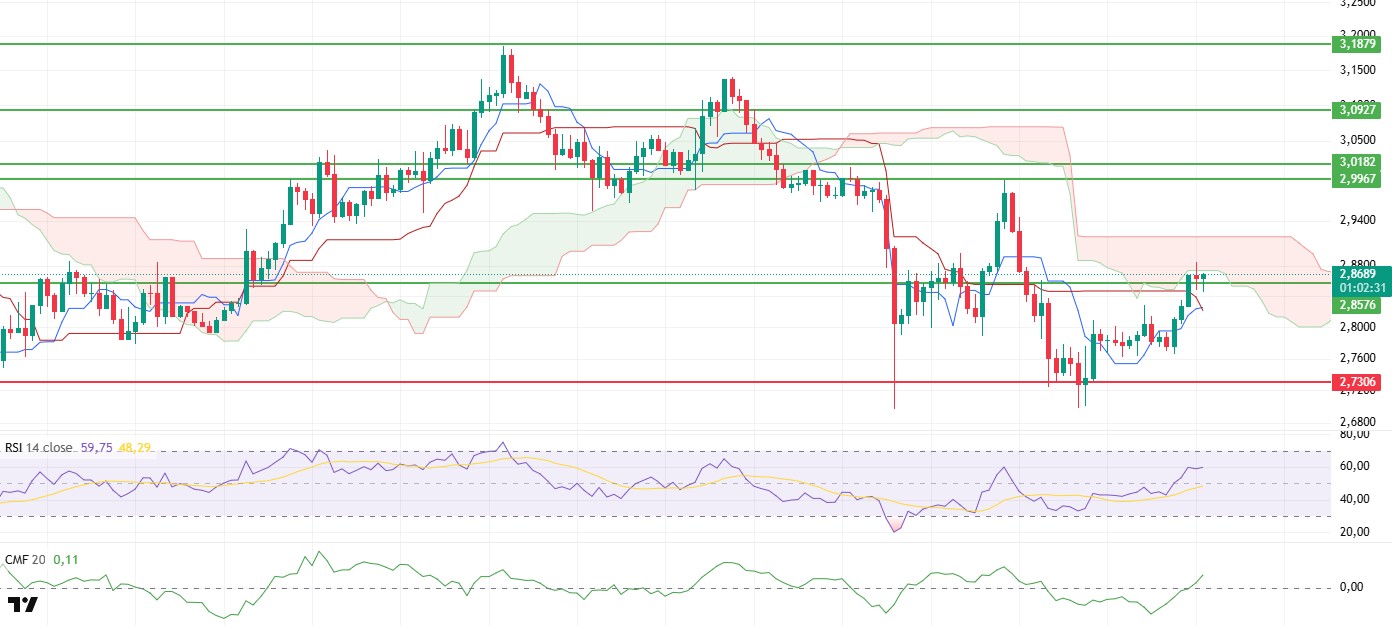
The XRP price had retreated to the $2.73 level in recent days, in line with the general downward trend in the cryptocurrency markets. However, strong buying from this level over the weekend pushed the price back up and enabled it to break through the critical $2.85 resistance level. This movement indicates that selling pressure is beginning to weaken and that buyers are once again playing an active role in the market.
Technical indicators are also producing strong signals supporting this recovery. The Chaikin Money Flow (CMF) indicator’s sharp rise into positive territory indicates that significant liquidity has re-entered the market and buyer appetite has increased significantly. In the Ichimoku indicator, the tenkan level cutting above the kijun level has produced a positive signal and provides important confirmation in favor of the short-term trend.
The current position of the Relative Strength Index (RSI) indicator supports the upward trend and clearly signals that momentum is strengthening.
In terms of price movements, it seems possible that the lower band of the cloud at $2.8730 and the upper band at $2.91 could be targeted during the day. If these levels are broken, the upward momentum could strengthen further, and the price could move towards the main resistance zone of $ $2.99. On the other hand, the $2.85 level remains a critical resistance area, and whether this level holds or not will be decisive for the short-term direction. Overall, both the positive signals from technical indicators and the strong support the price has received at the $2.73 level increase the likelihood of an upward movement for XRP in the short term. However, as long as sustainability above $2.85 is not achieved, the possibility of continued volatility remains high.
Supports: 2.8570 – 2.7306 – 2.6513
Resistances: 2.9183 – 2.9967 – 3.0927
SOL/USDT
Franklin, Fidelity, Coin Shares, Bitwise, Grayscale, VanEck, and Canary submitted S-1 amendments that include staking features. Solana developers are considering removing block limits after the Alpenglow update.
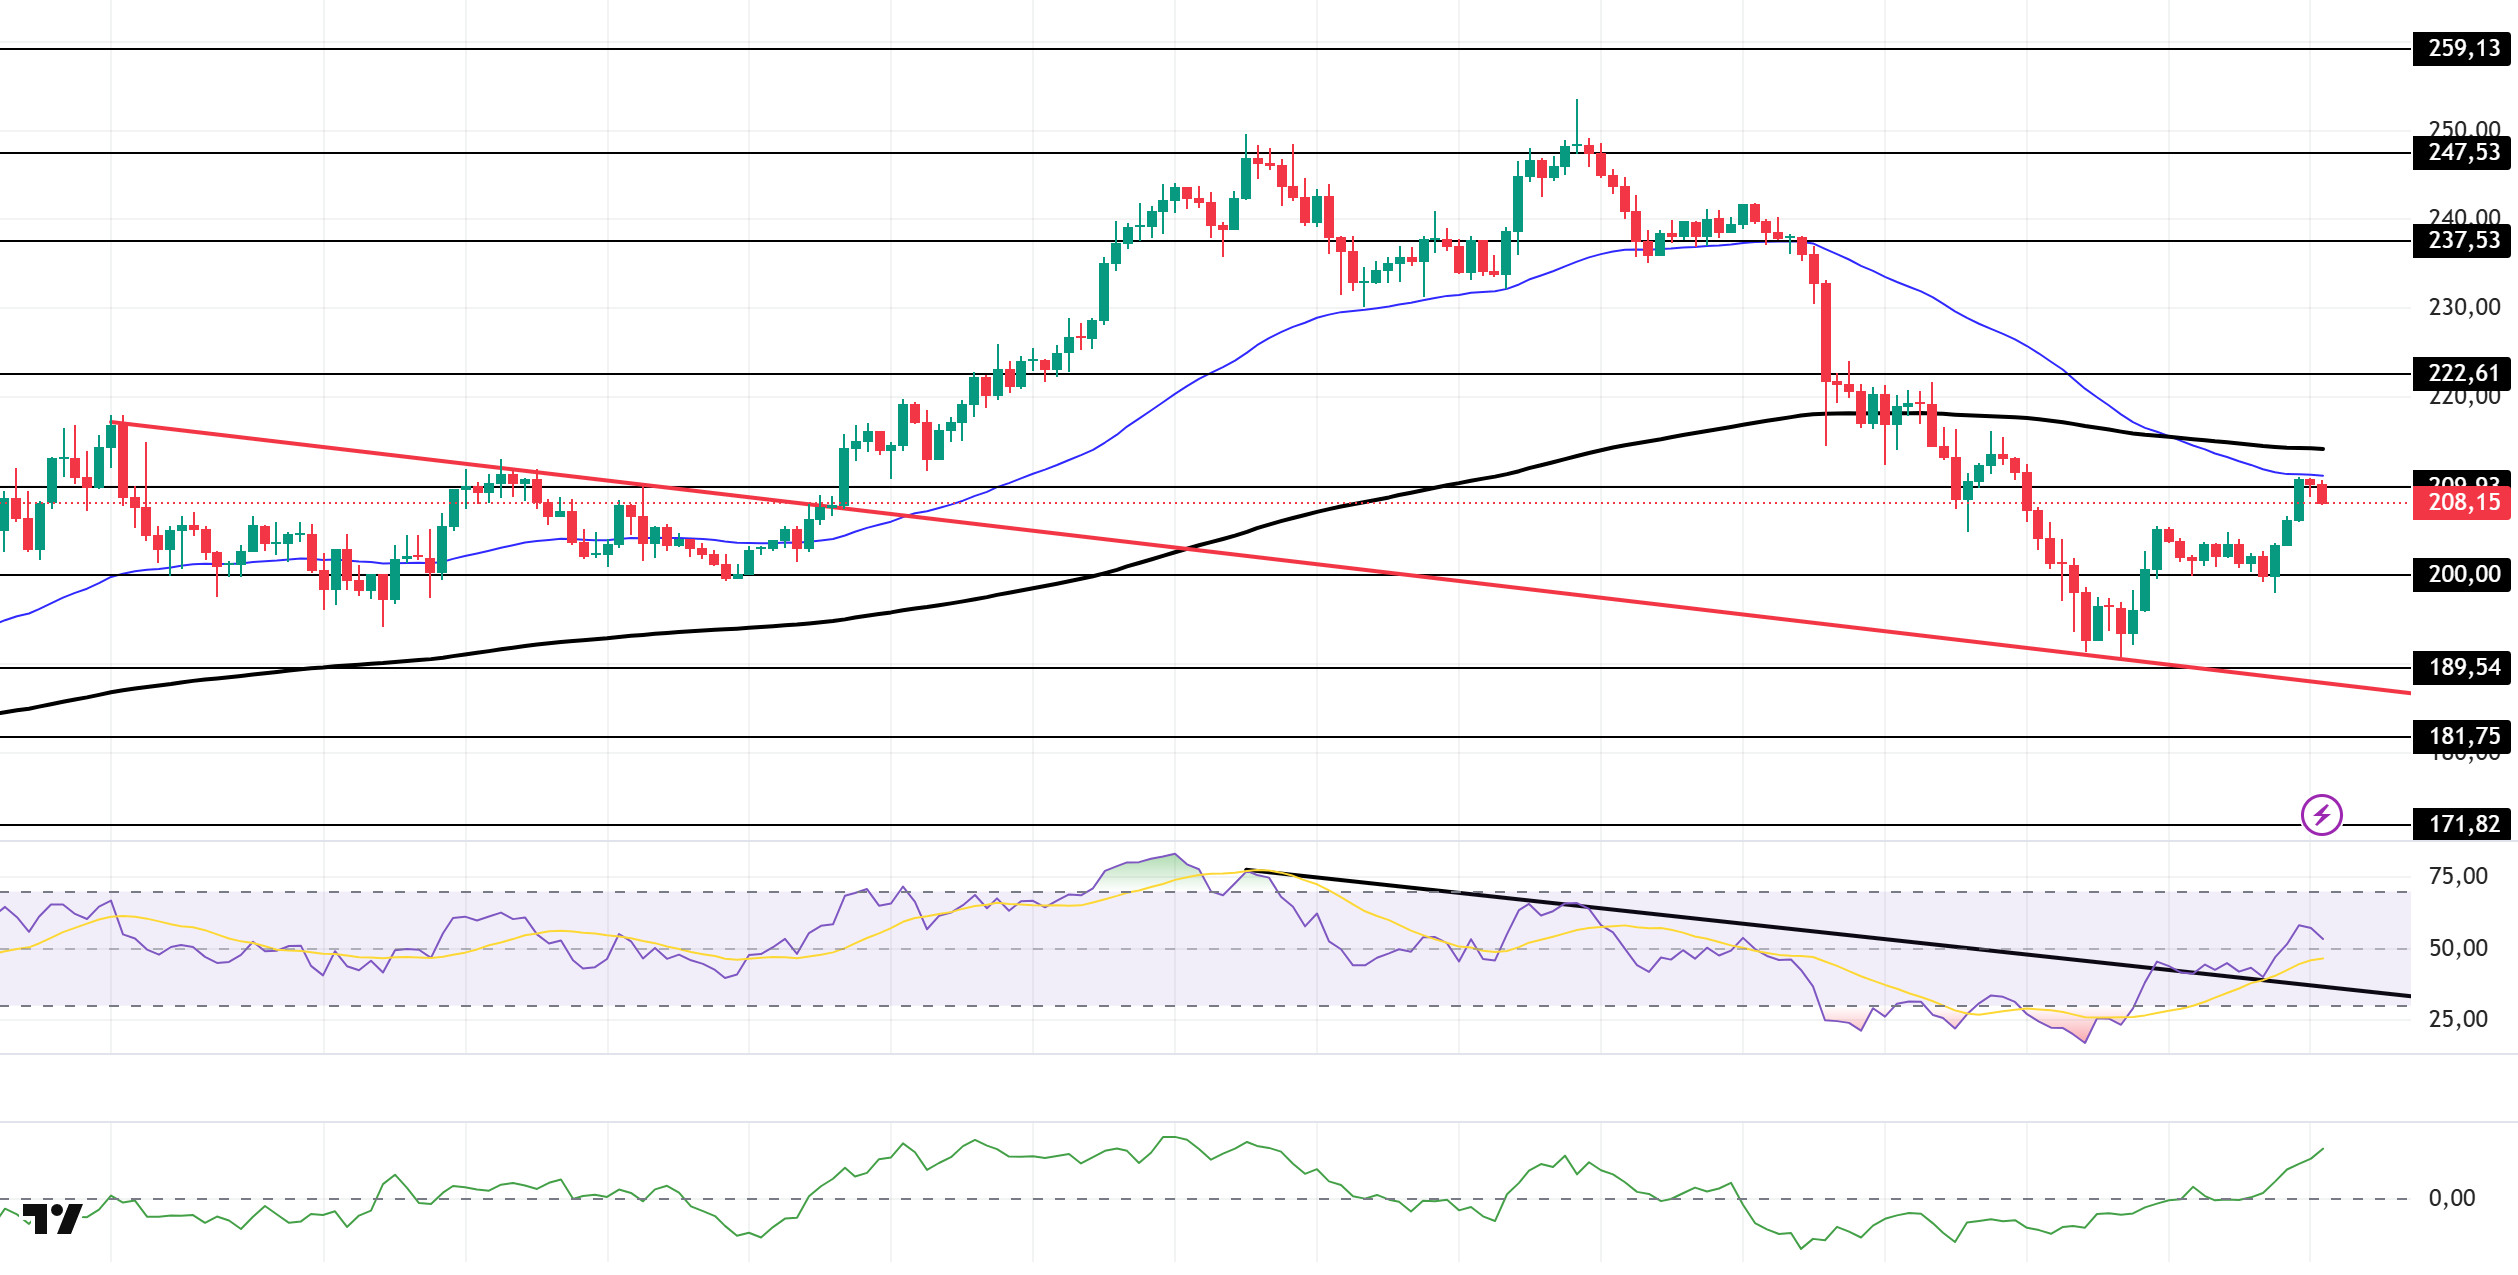
The SOL price showed an upward trend. The asset continues to be in the upper region of the downward trend that began on August 29. Testing the downward trend as a support level, the price accelerated upward from there and is currently testing the 50 EMA (Blue Line) moving average as resistance. If the price closes above the 50 EMA, it could test the 200 EMA (Black Line) moving average. If a pullback begins, the $200.00 level could be monitored.
The price has moved below the 50 EMA (Exponential Moving Average – Blue Line) and 200 EMA (Black Line) on the 4-hour chart. This indicates a possible downtrend in the medium term. At the same time, the price being below both moving averages shows us that the market is in a downtrend in the short term. The Chaikin Money Flow (CMF-20) has moved into positive territory. However, a decrease in money inflows could push the CMF into negative territory. The Relative Strength Index (RSI-14) has moved into positive territory. At the same time, the indicator, which moved into the upper region of the downward trend that began on September 14, strengthened its rise by taking support from this trend. If there is an increase due to macroeconomic data or positive news related to the Solana ecosystem, the $222.61 level stands out as a strong resistance point. If this level is broken upwards, the rise is expected to continue to . If there are pullbacks due to developments in the opposite direction or profit-taking, the $200.00 level may be tested. If there is a decline to these support levels, an increase in buying momentum may present a potential upside opportunity.
Supports: 209.93 – 200.00 – 189.54
Resistances: 222.61 – 237.53 – 247.53
DOGE/USDT
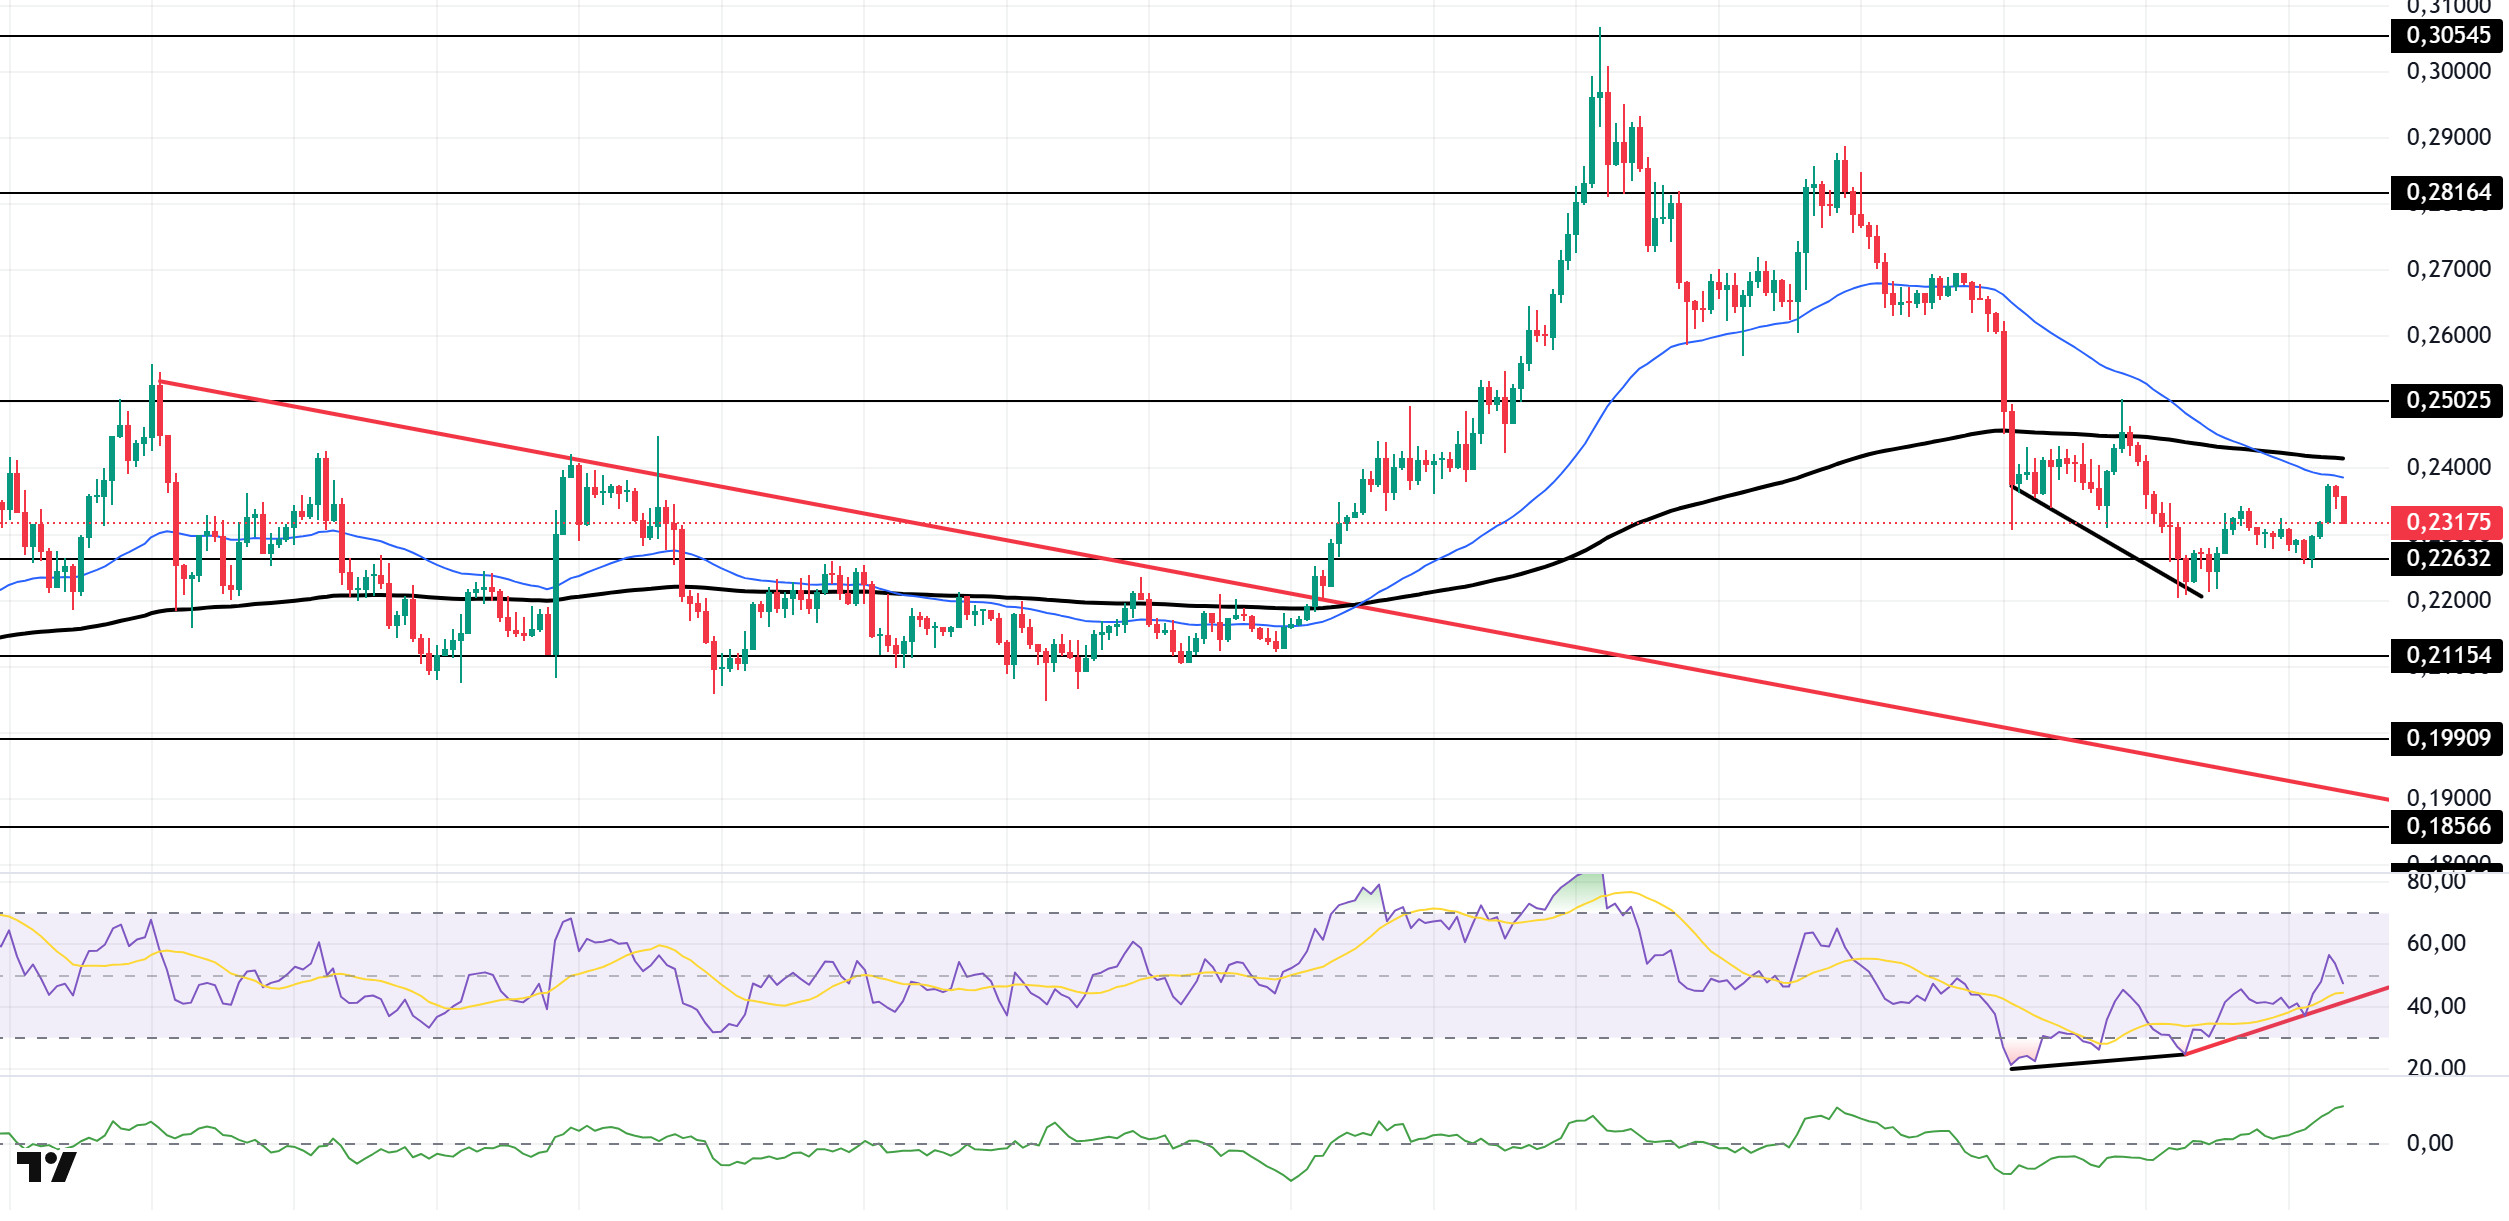
The DOGE price experienced an uptrend. The asset continued to trade above the downtrend line that began on August 14. Testing the strong support level of $0.22632, the price failed to break through and experienced an uptrend, and is currently testing the 50 EMA (Exponential Moving Average – Blue Line) moving average as resistance. If the moving average closes above the candle, it could test the $0.25025 level as resistance. If a pullback begins, the $0.22632 level could be monitored.
On the 4-hour chart, the 50 EMA (Exponential Moving Average – Blue Line) has started to move below the 200 EMA (Black Line). This indicates that a medium-term downward trend has begun. The price being below both moving averages shows that the price is trending downward in the short term. The Chaikin Money Flow (CMF-20) has risen into positive territory. Additionally, a decrease in money inflows could push the CMF into negative territory. The Relative Strength Index (RSI-14) has risen to neutral levels and continues to remain in the upper region of the upward trend that began on September 25. This could create buying pressure. However, positive divergence could strengthen the upward movement. In the event of an uptrend driven by political developments, macroeconomic data, or positive news flow in the DOGE ecosystem, the $0.25025 level stands out as a strong resistance zone. Conversely, in the event of negative news flow, the $0.21154 level could be triggered. A decline to these levels could increase momentum and initiate a new wave of upward movement.
Supports: 0.22632 – 0.21154 – 0.19909
Resistances: 0.25025 – 0.28164 – 0.30545
TRX/USDT
As of September 28, 2025, the total amount of TRX staked is 44,595,738,048, which is 47.11% of the circulating supply. Compared to the previous day, there has been an increase of approximately 0.01% in the amount staked. However, the market value of TRX has reached $31.8 billion.
Furthermore, a total of 2,387,144 TRX was burned yesterday, and a net 1,528,568 TRX was added to the circulating supply. This situation is leading to increased inflationary pressure on Tron.
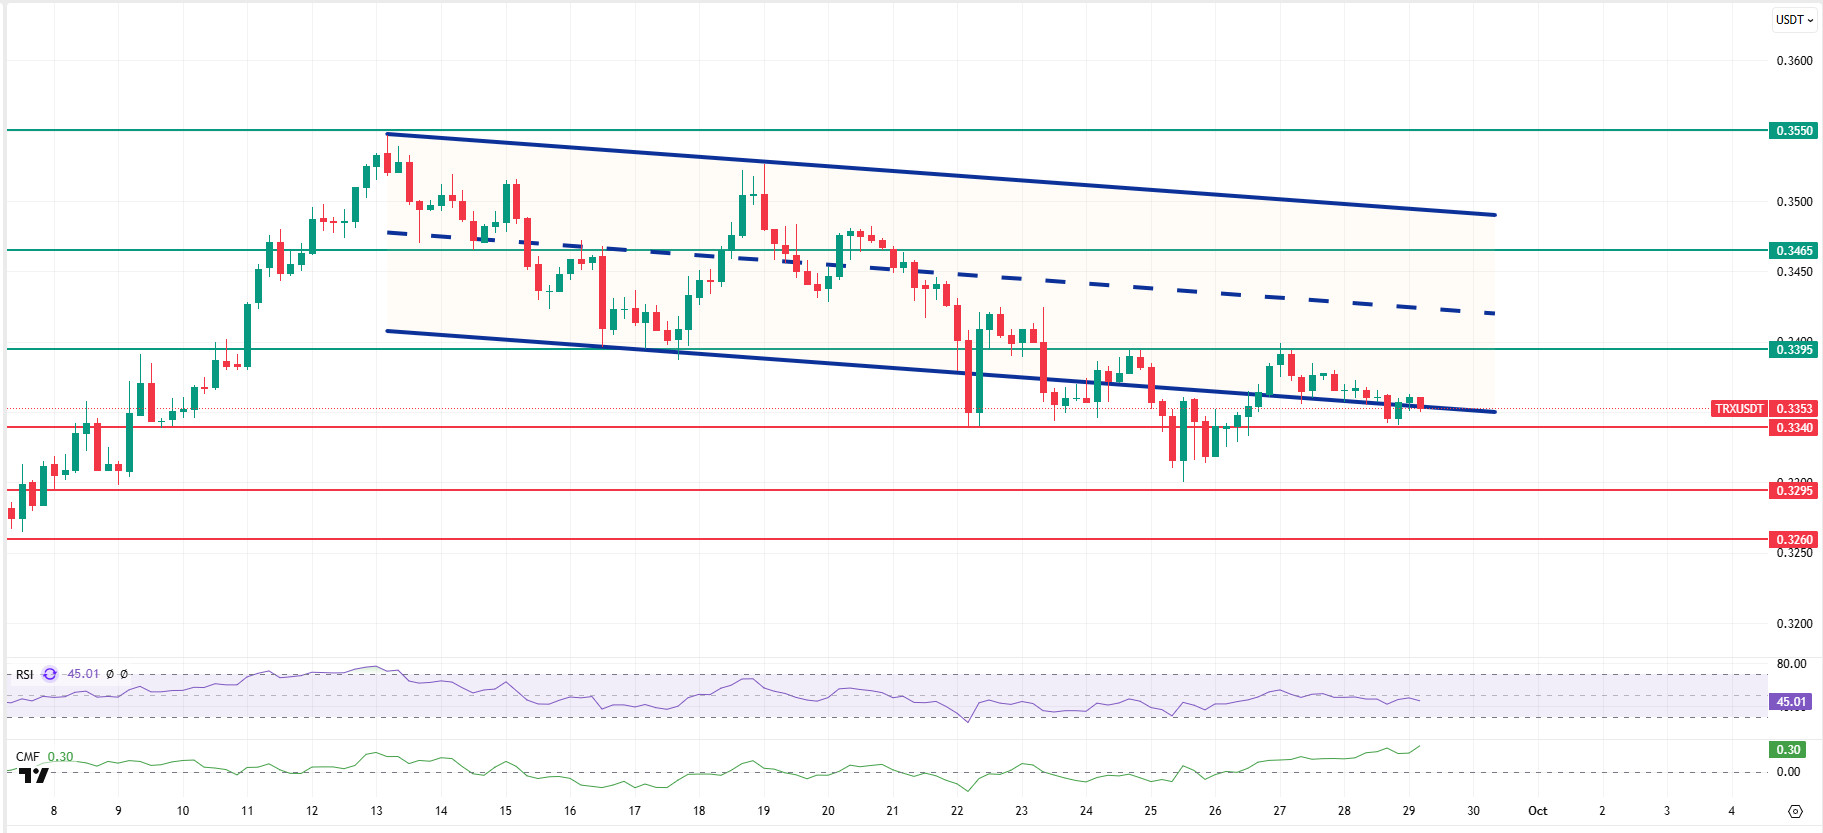
Technically speaking, TRX closed yesterday at $0.3357 after the decline, retreated a little more in the morning hours, and is currently trading at $0.3353. Currently in the lower band of the bearish channel, TRX is priced just above the $0.3340 support on the 4-hour chart. The Relative Strength Index (RSI) value is 45, indicating a sell zone. In addition, the Chaikin Money Flow (CMF) indicator is above zero at 0.30, indicating increased money inflows. This suggests that buyer pressure in the market is increasing and that buying movements could gain short-term momentum.
In light of all these indicators, TRX may rise slightly in the first half of the day, moving towards the middle band of the channel, given its current zone and CMF value. It could then test the 0.3395 resistance level. A candle close above the 0.3395 resistance could extend the uptrend, moving towards the upper band of the bearish channel and testing the 0.3465 resistance. If it fails to close above the 0.3395 resistance level and the CMF indicator moves into negative territory, it may decline slightly due to potential selling pressure and test the 0.3340 and 0.3295 support levels in sequence.
On the 4-hour chart, 0.3260 is an important support level, and as long as it remains above this level, the upward momentum is expected to continue. If this support level is broken, selling pressure may increase.
Supports: 0.3340 – 0.3295 – 0.3260
Resistances: 0.3395 – 0.3465 – 0.3555
SHIB/USDT
Today’s agenda for Shiba Inu is busy with security, product updates, and on-chain flows. The Shibarium bridge is still on hold after the flash loan attack on September 12, and the team limited the damage by rotating the validator keys and freezing 4.6 million BONE. No schedule has been shared for its reopening. On the BONE side, it is stated that the frozen amount is locked in staking and that validator funds have been moved to a multi-signature hardware wallet. The LEASH v2 migration is proceeding steadily and automatically, accompanied by security audits, with the goal of transitioning to fixed-supply v2 tokens without intervention from old owners.
ShibaSwap stands out today with its multi-chain swap features and new mobile-friendly interface, enhancing the direct swap experience on Ethereum, Polygon, Arbitrum, Avalanche, and other networks with its Positions page. The team is preparing to implement the Chainlink Cross Chain Interoperability Protocol integration for Shibarium, which aims to securely bridge SHIB, LEASH, and BONE assets across more than 20 blockchains. On the market side, daily SHIB burn volume fell to 69,690, showing a decline of approximately 99.02%. However, with 9,008,428 burned in the last seven days, the weekly pace recorded an increase of approximately 365%, and the total supply stands at 589,247,696,994,906.
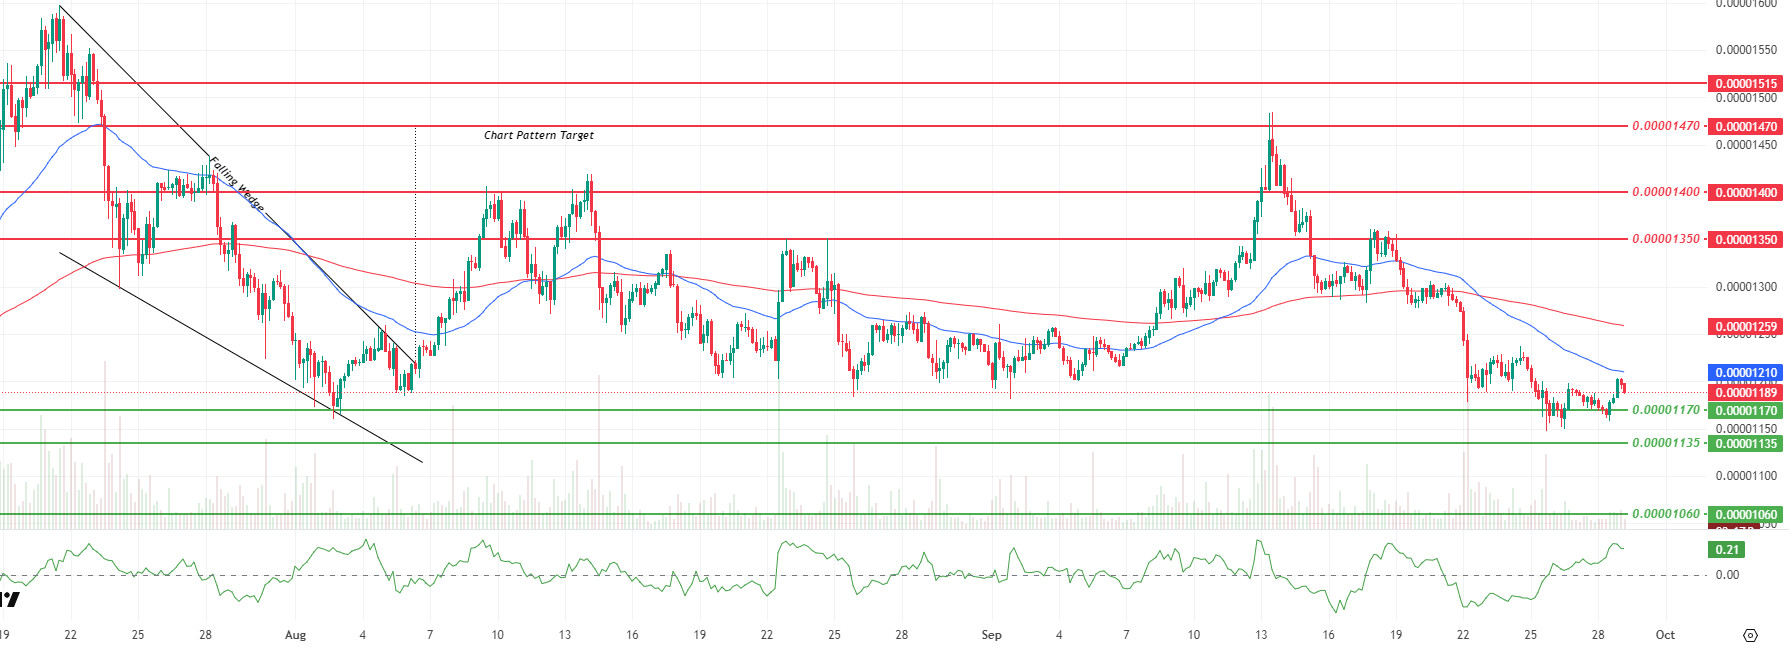
The technical outlook shows that the increase in momentum and the narrowing of volatility indicate that the price is reacting in a more controlled manner. The pullback seen after the completion of the Falling Wedge target was met at the $0.00001170 level, and this area is acting as the first support level. Below, the support levels at $0.00001135 and $0.00001060 retain their importance; a drop below this region could deepen the weakness. Upward, the $0.00001210 level is the first resistance position, followed by the $0.00001240 region, which is a critical threshold for short-term equilibrium. If hourly closes occur above this level, intermediate resistances at $0.00001350 and $0.00001400 could come into play. The target zone at $0.00001470 and $0.00001515 can only be tested with strong momentum.
The Chaikin Money Flow (CMF) remains in positive territory, confirming that inflows are supporting the price. However, the price’s movement below the 50-day Exponential Moving Average (EMA) and 200-day Exponential Moving Average (EMA) indicates that medium-term pressure persists. Therefore, for the positive scenario to gain strength, it is necessary to first see sustainability above $0.00001240 and settlement above EMA 50. (EMA50: Blue line, EMA200: Red line)
Supports: 0.00001170 – 0.00001135 – 0.00001060
Resistances: 0.00001350 – 0.00001400 – 0.00001470
Legal Notice
The investment information, comments, and recommendations contained herein do not constitute investment advice. Investment advisory services are provided individually by authorized institutions taking into account the risk and return preferences of individuals. The comments and recommendations contained herein are of a general nature. These recommendations may not be suitable for your financial situation and risk and return preferences. Therefore, making an investment decision based solely on the information contained herein may not produce results in line with your expectations.

