
Technical Analysis – October 06, 2025
BTC/USDT
The U.S. federal government shutdown continues into its third day. The Senate’s failure to pass a temporary funding bill has resulted in federal agencies remaining closed. Democrats want health insurance subsidies extended, while Republicans insist on a short-term budget solution. Meanwhile, Fed officials stated that the shutdown would not affect their policy assessments, but they expressed differing views on inflation and employment risks. China offered to provide new investment and import commitments in exchange for the US easing trade restrictions. On the Asian front, Japan is preparing for its first female government leader with Sanae Takaichi’s election as prime minister. In Europe, Russia-Ukraine tensions are escalating with new attacks on Lviv.
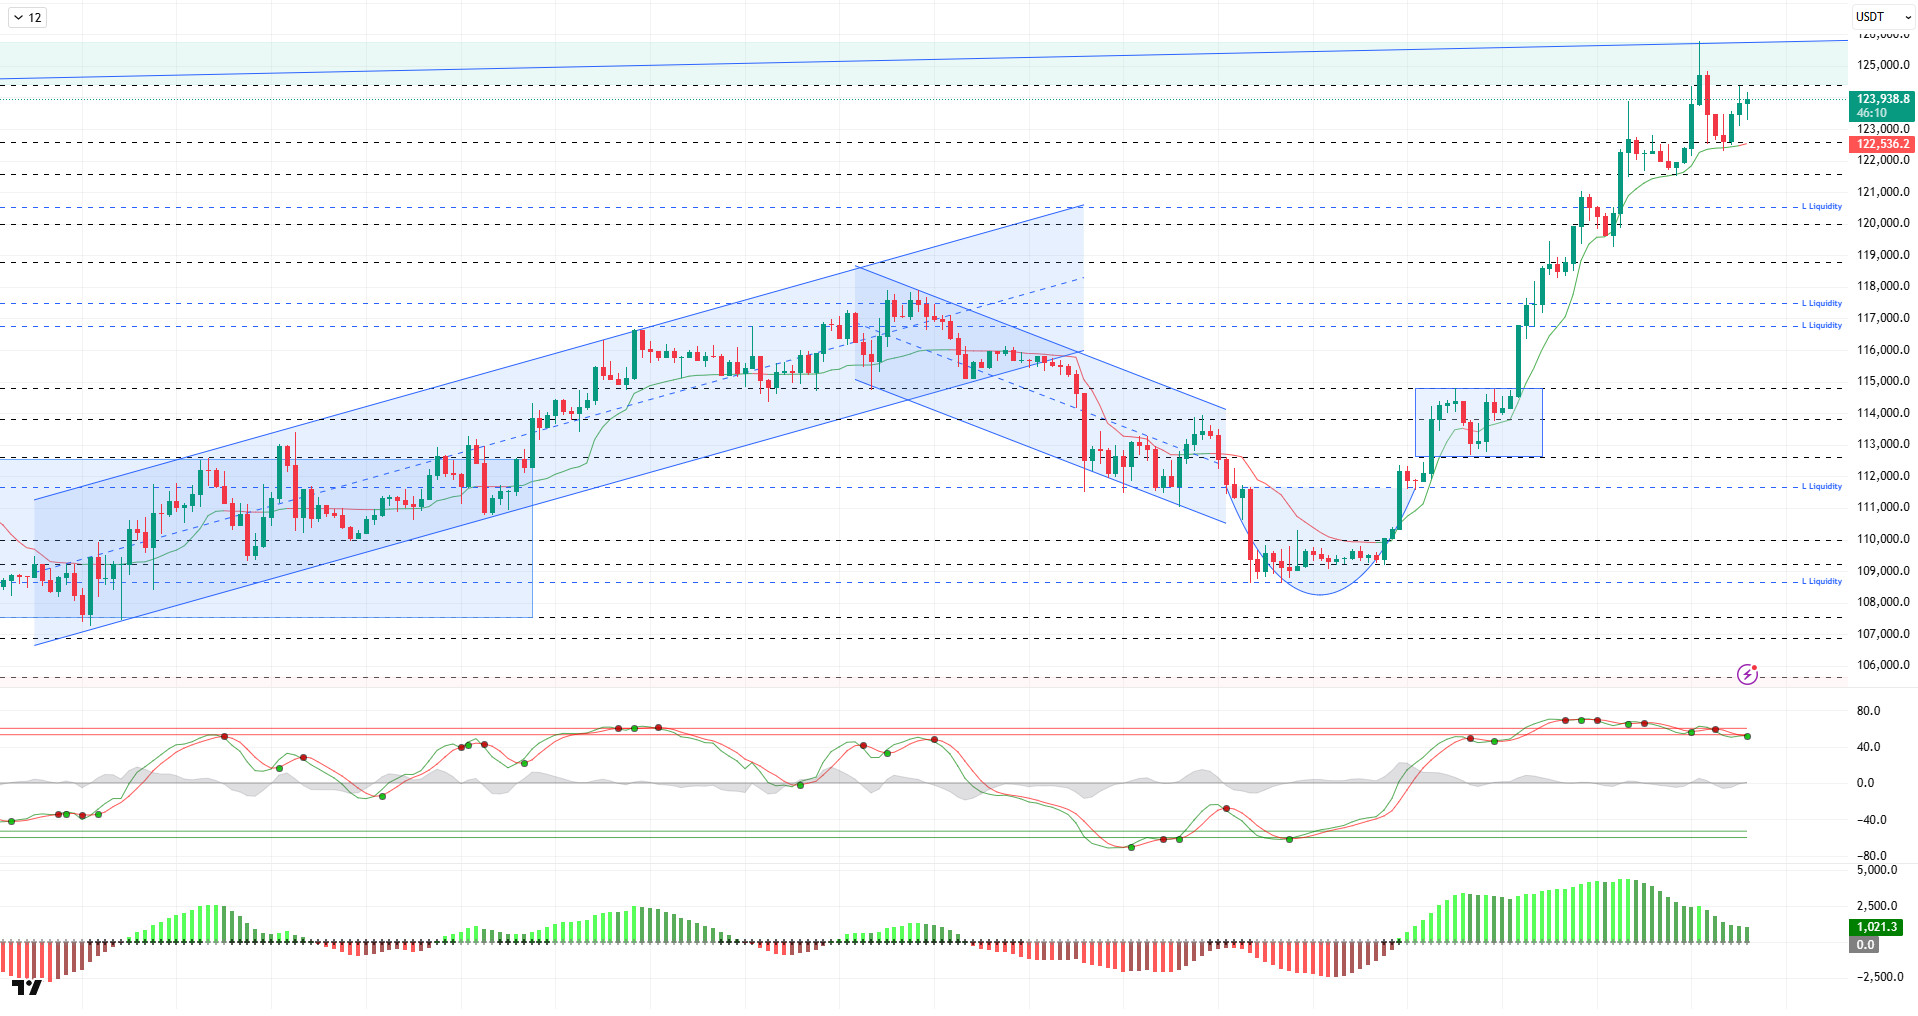
Looking at the technical picture, BTC continued the rally it started in the last week of September, attempting a new high and reaching an all-time high (ATH) of $125,750. BTC, which surpassed its previous peaks on July 14 and August 13, continues to consolidate near the peak. Gaining momentum in parallel with the cup formation in price movements, BTC completed the Gartley formation and broke through the $120,500 level, completing a “W” type movement. At the time of writing, it continues to trade at the $124,000 level.
Technical indicators show indecisive movements, with the Wave Trend oscillator (WT) producing consecutive buy-sell signals in the overbought zone. The Squeeze Momentum (SM) indicator continues its momentum within the positive area of the histogram while showing negative divergence. The Kaufman moving average is currently trading below the price at the 122,500 level.
When examining liquidation data, the recent upward movement has led to accumulation at the 120,000 level, while the intensity previously recorded at the 117,800 and 116,600 levels continues. In a broader time frame, the 112,200 level stands out as an accumulation zone. In contrast, the selling level continues to maintain its volatility. Looking at the last 24 hours, $17 million worth of BTC short positions were liquidated, while $48 million worth of long positions were liquidated. Thus, the total liquidation amount in the market reached approximately $259 million.
In summary, while the US government shutdown has not had a significant impact on the markets, the differing views of Fed members on interest rate cuts and the return of tariffs to the agenda are among the prominent developments. The negative outlook for short-term interest rate cut expectations regained strength with interest rate cut expectations rising to 98%. On the BTC side, it recorded an 8.24% increase in October, a month in which double-digit averages were achieved in terms of cyclical movements, making a strong entry and testing a new ATH level. The technical outlook reached saturation point with the price testing the 125,750 ATH level, while liquidity data set a precedent by rising and resisting the cycle. From this point on, in the event of a possible correction, the minor support level will be 122,700, while 120,500 will be monitored as a critical reference area. If the rise continues, we will follow the ATH level and then the psychological resistance areas.
Supports: 122,700 – 121,400 – 120,500
Resistances: 124,300 – 125,700 – 129,000
ETH/USDT
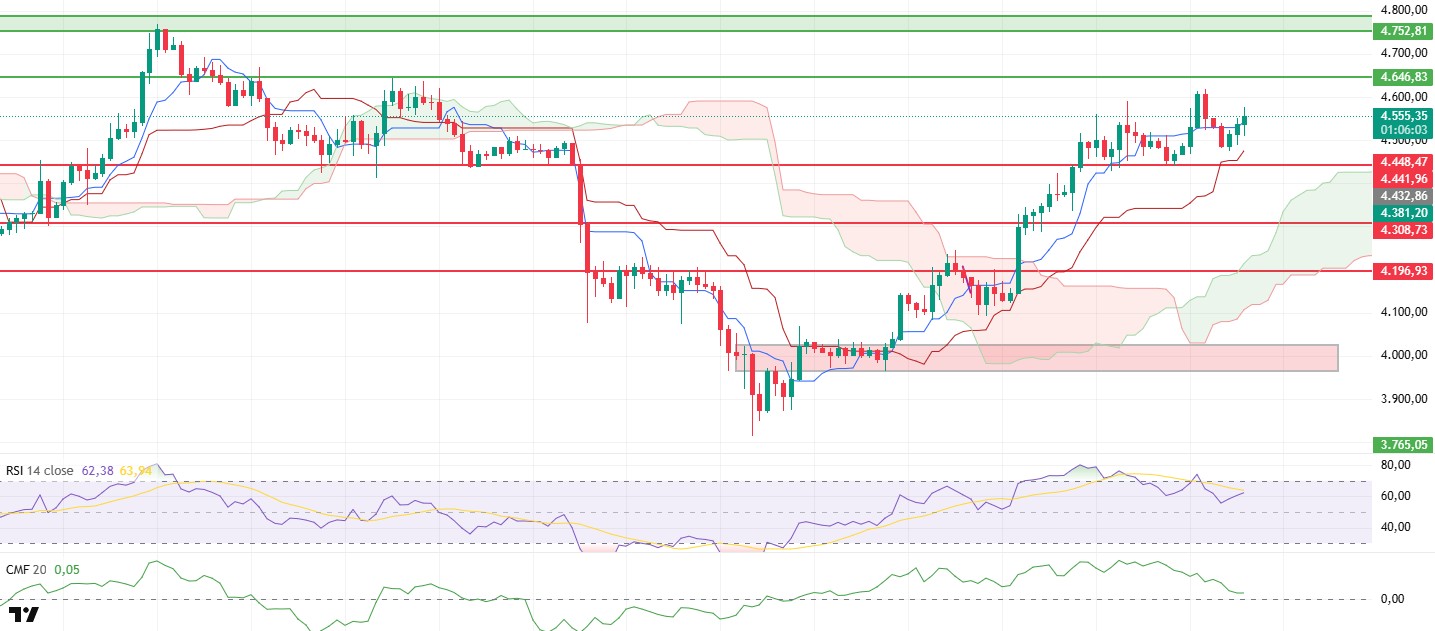
The ETH price maintained its positive trajectory throughout the weekend, rising to $4,618 on Sunday. Although the price fell back to $4,477 at this point due to selling pressure, it regained upward momentum after the weekly close and reached $4,560. This outlook shows that buyers still dominate the market and the trend remains generally positive.
Looking at technical indicators, the most notable signal came from the Chaikin Money Flow (CMF) indicator. Despite the price increase, the downward movement of the CMF indicator reveals that liquidity inflows on the spot side remained weak and that the rise was mainly fueled by purchases in the futures market. The Cumulative Volume Delta (CVD) data also supports this picture. In other words, while the price is rising, there is insufficient support on the spot volume side. This is a weakness signal that should be noted in terms of sustainability in the short term.
On the other hand, the Relative Strength Index (RSI) indicator has broken its downward trend and turned upward again. This outlook indicates that momentum is regaining strength and that the price may maintain its momentum in the short term.
The overall structure of the Ichimoku indicator remains intact. The price still trading above the Kumo cloud confirms that the trend remains positive and the market continues to be buyer-driven.
Overall, ETH prices are expected to continue rising towards the $4,646 resistance level during the day. However, weakness in the CMF indicator and limited liquidity inflows on the spot side make the $4,441 level a critical support. A drop below this level could increase the risk of a short-term correction. However, as long as it remains above this level, the likelihood of maintaining the overall upward trend appears stronger.
Top of Form
Below the Form
Supports: 4,441 – 4,308 – 4,196
Resistances: 4,646 – 4,752 – 4,857
XRP/USDT
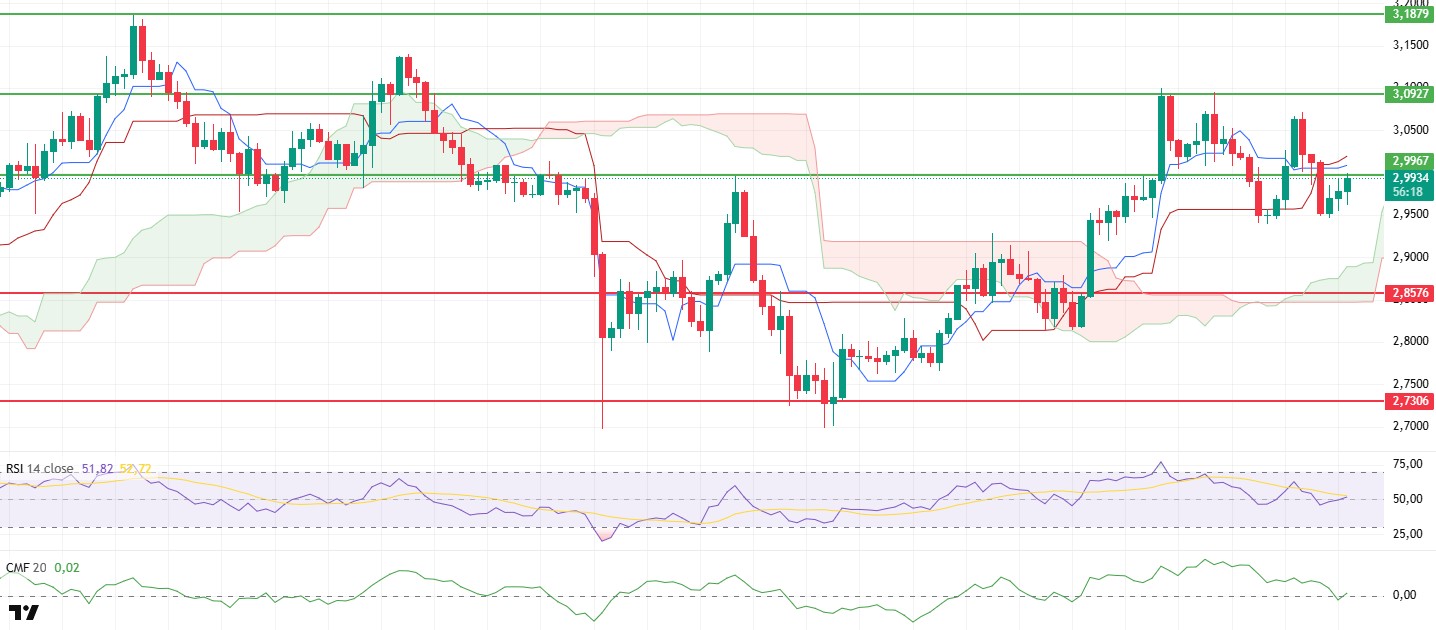
The XRP price experienced a highly volatile weekend after being rejected from the $3.09 resistance level on Friday. Although the $2.99 support level was breached several times, the price rebounded towards this area following the weekly close. This pattern indicates that buyers are stepping in at certain intervals, and the price is attempting to stabilize in the short term.
The Chaikin Money Flow (CMF) indicator presented a noteworthy picture during this process. The indicator’s decline into negative territory revealed strong liquidity outflows from the market. However, with the recent price recovery, the CMF has moved back into positive territory, signaling the start of new liquidity inflows into the market, albeit limited. This indicates that buyers are slowly regaining strength.
The Relative Strength Index (RSI) indicator rising above the 50 level signals that momentum is strengthening and that the price has established a healthier foundation for upward movement. This picture supports the possibility that the short-term upward trend could regain momentum.
In the Ichimoku indicator, the Tenkan level cutting below the Kijun level has created a short-term negative signal. This outlook reminds us to be cautious in the bullish scenario. The price settling back above the Tenkan level could limit the impact of this weak signal.
Consequently, as long as the XRP price maintains the $2.99 support, a retest of the $3.09 resistance level is expected during the day. However, if the $2.99 support is lost, the likelihood of increased selling pressure and a deeper pullback in the price will strengthen.
Supports: 2.8576 – 2.7306 – 2.6513
Resistances: 2.9967 – 3.0927 – 3.1879
SOL/USDT
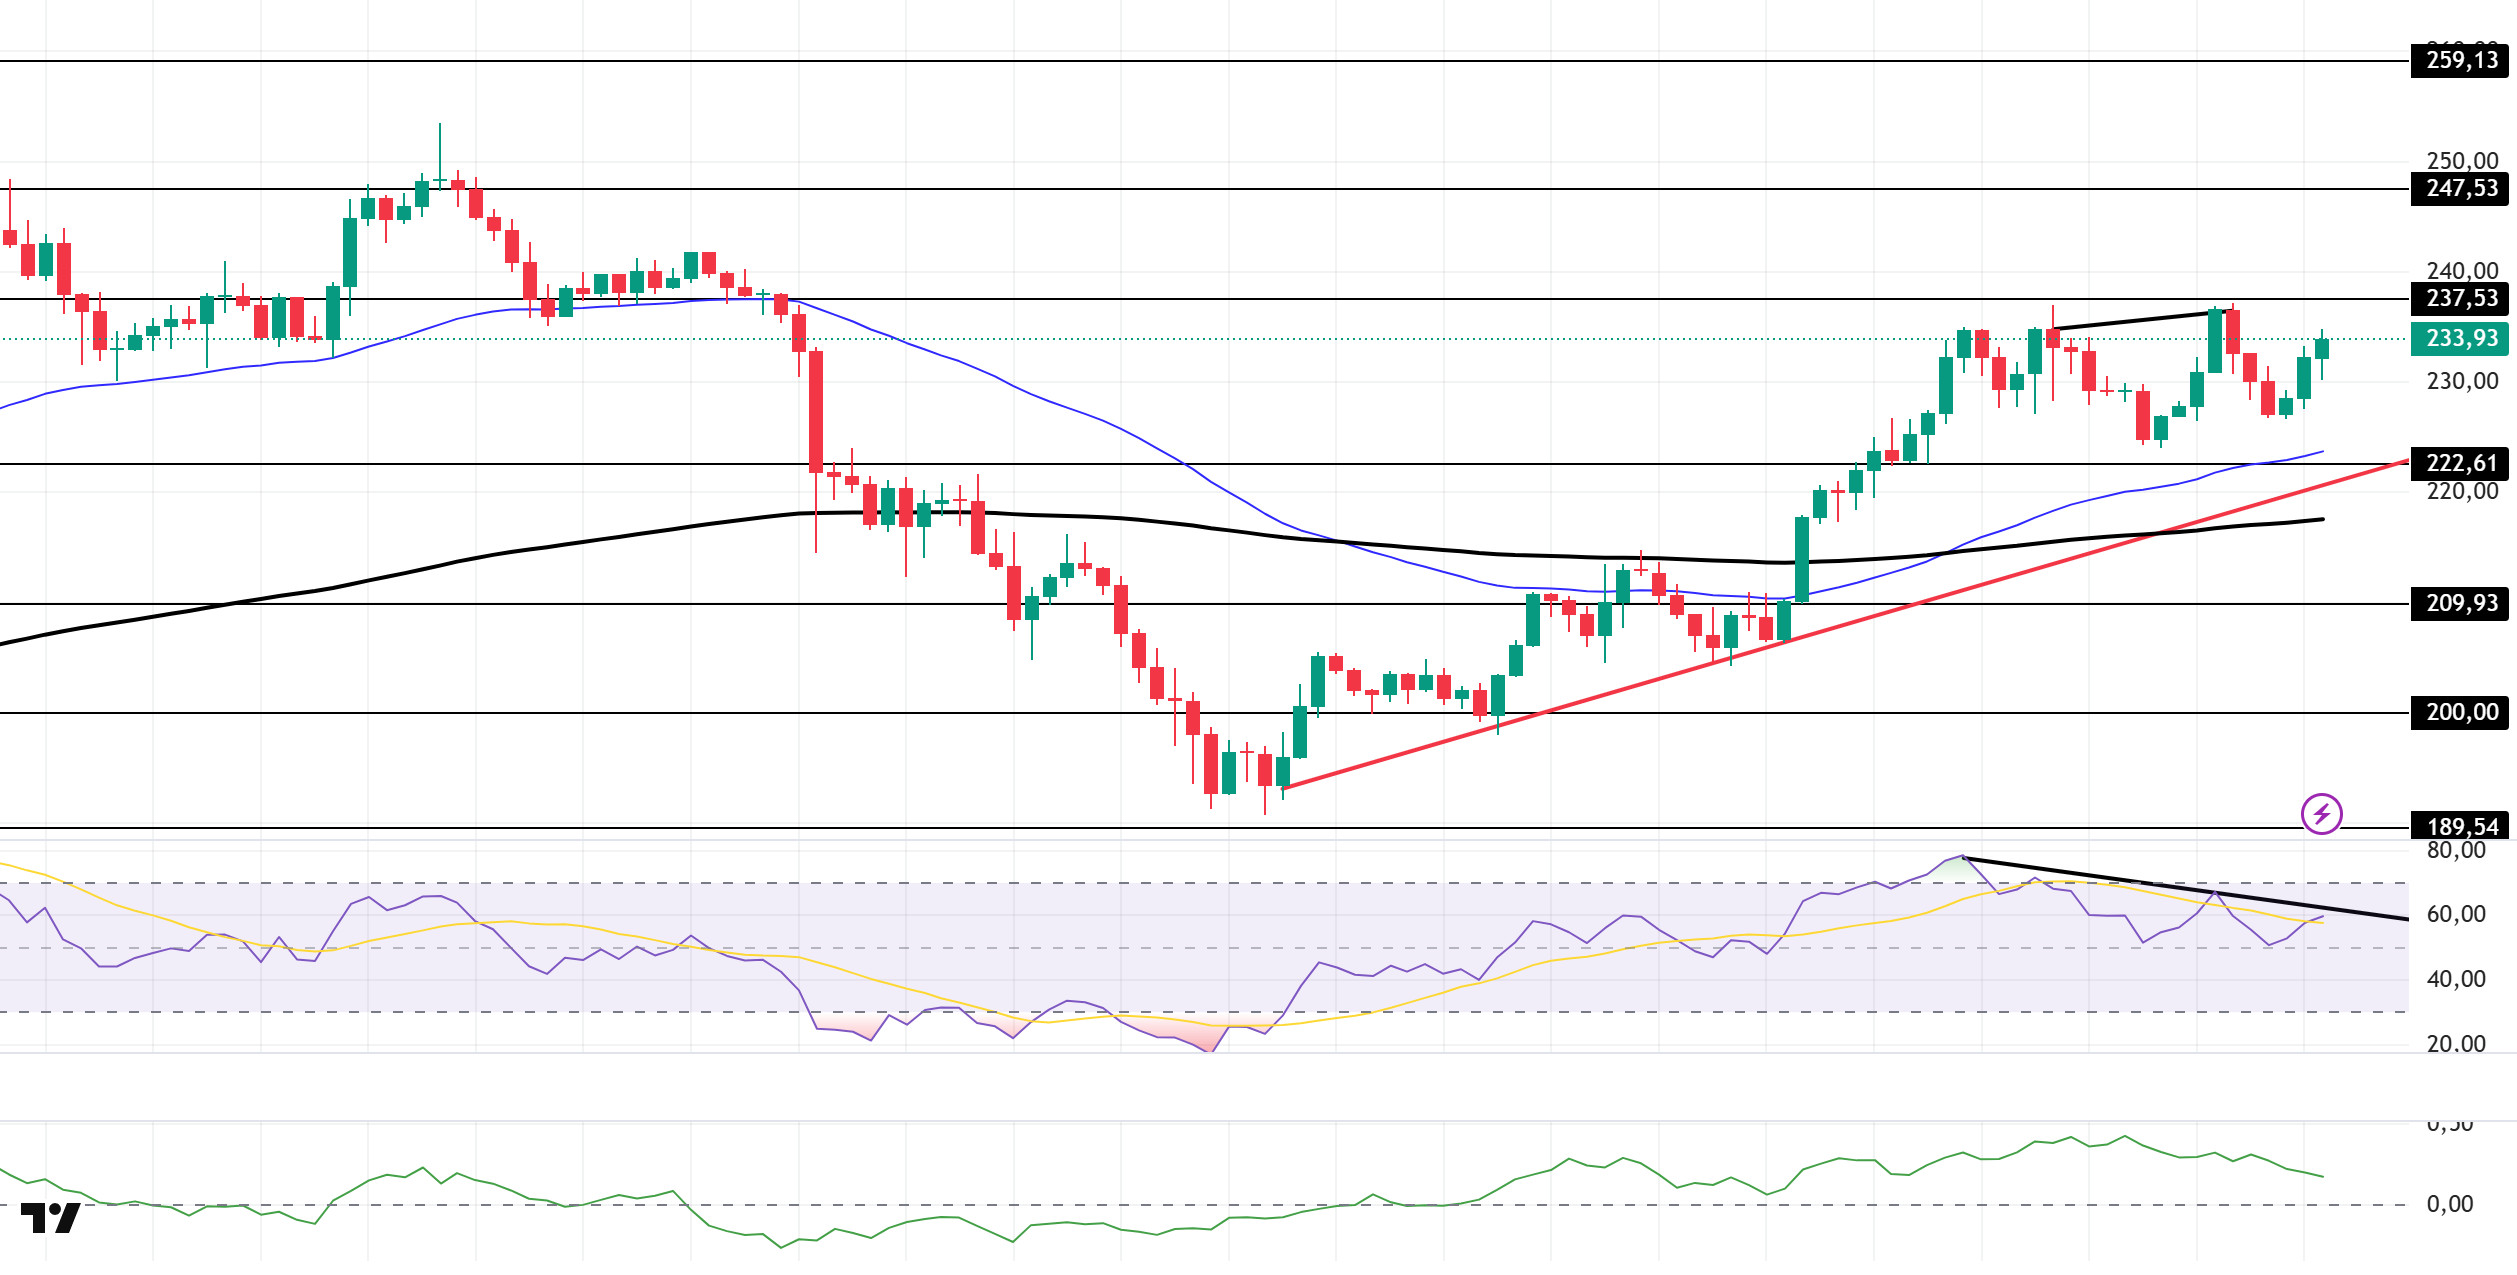
The SOL price continues its sideways movement. The asset remains in the upper region of the rising line that began on September 26. The price, which continues to be above the 50 EMA (Blue Line) moving average and the 200 EMA (Black Line) moving average, tested the strong resistance level of $237.53 but failed to break through and experienced a pullback. As of now, it continues to hold above the strong support level of $222.61, maintaining its momentum. If the upward movement continues, it may retest the $237.53 level. In case of pullbacks, the $209.93 level can be monitored.
On the 4-hour chart, it has started to trade above the 50 EMA (Exponential Moving Average – Blue Line) and 200 EMA (Black Line). This indicates that it may be in an uptrend in the medium term. At the same time, the price being above both moving averages shows us that the asset is trending upwards in the short term. The Chaikin Money Flow (CMF-20) remained in positive territory. However, balanced cash inflows may keep the CMF in positive territory. The Relative Strength Index (RSI-14) also remained in positive territory. At the same time, it continued to be in the lower region of the downward trend that began on October 2. This signaled that the downward pressure persists. However, there is a negative divergence. This could deepen the pullback. If there is an upturn due to macroeconomic data or positive news related to the Solana ecosystem, the $237.53 level stands out as a strong resistance point. If this level is broken upwards, the uptrend is expected to continue. If pullbacks occur due to developments in the opposite direction or profit-taking, the $222.61 level could be tested. If the price falls to these support levels, an increase in buying momentum could present a potential opportunity for an uptrend.
Supports: 222.61 – 209.93 – 200.00
Resistances: 237.53 – 247.53 – 259.13
DOGE/USDT
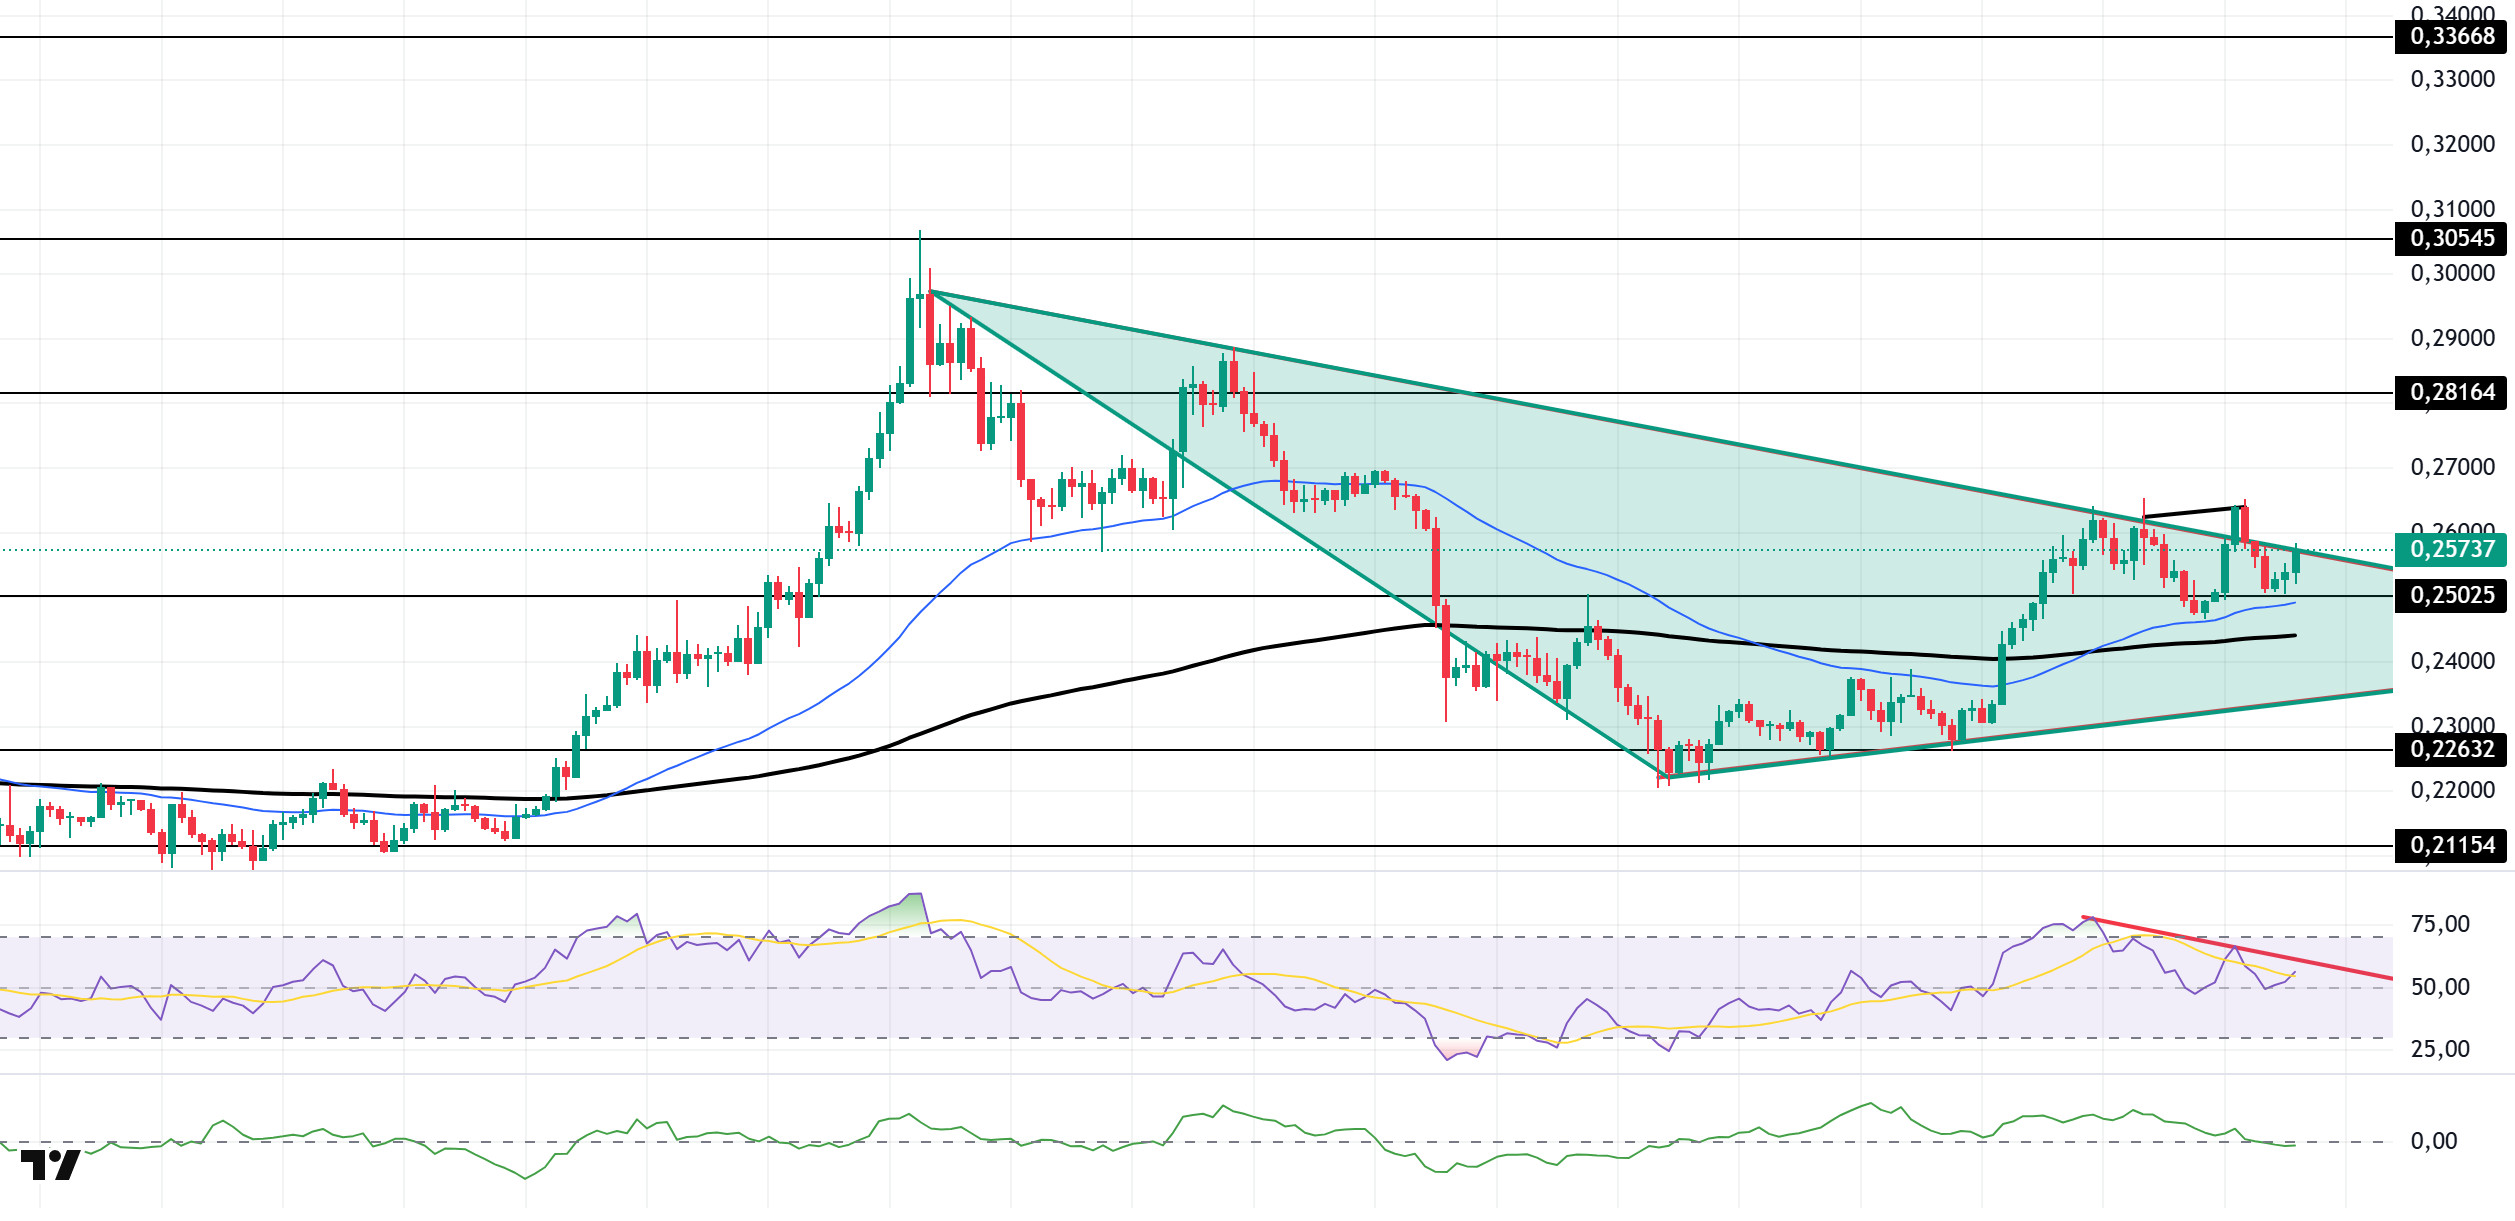
The DOGE price continued its sideways movement. The asset remained within the symmetrical triangle formation that began on September 14. Breaking above the strong resistance level of the 200 EMA (Exponential Moving Average – Black Line), the price tested the ceiling level of the symmetrical triangle formation as resistance while maintaining its momentum and then retreated from there. It is currently testing the strong support level of $0.25025. If the uptrend continues, it may test the resistance level of $0.28164. In case of a pullback, it may test the support level of $0.22632 on candle closes below the moving average.
On the 4-hour chart, the 50 EMA (Exponential Moving Average – Blue Line) remained above the 200 EMA (Black Line). This indicates that a medium-term uptrend may begin. The price being above both moving averages shows that the price is bullish in the short term. The Chaikin Money Flow (CMF-20) experienced a pullback towards negative territory. Additionally, a decrease in money inflows could push the CMF deeper into negative territory. The Relative Strength Index (RSI-14) tested the resistance line that began on October 2 but failed to break through, continuing its pullback and retreating to neutral levels. This signaled increased selling pressure. On the other hand, there is a negative divergence. In the event of a rise due to political developments, macroeconomic data, or positive news flow in the DOGE ecosystem, the $0.28164 level stands out as a strong resistance zone. Conversely, in the event of negative news flow, the $0.22632 level could be triggered. A decline to these levels could increase momentum and initiate a new wave of growth.
Supports: 0.25025 – 0.22632 – 0.21154
Resistances: 0.28164 – 0.30545 – 0.33668
LTC/USDT
LTC closed the previous day down 1.34% against USDT and down 2.24% against Bitcoin. On the futures side, the long/short position ratio opened in the last 24 hours being 1.0064 indicates that derivative market participants have not made a clear decision on their expectations, while the positive series of funding rates continues. This picture reveals that an upward expectation may be forming in the derivative markets, but it has not yet matured.
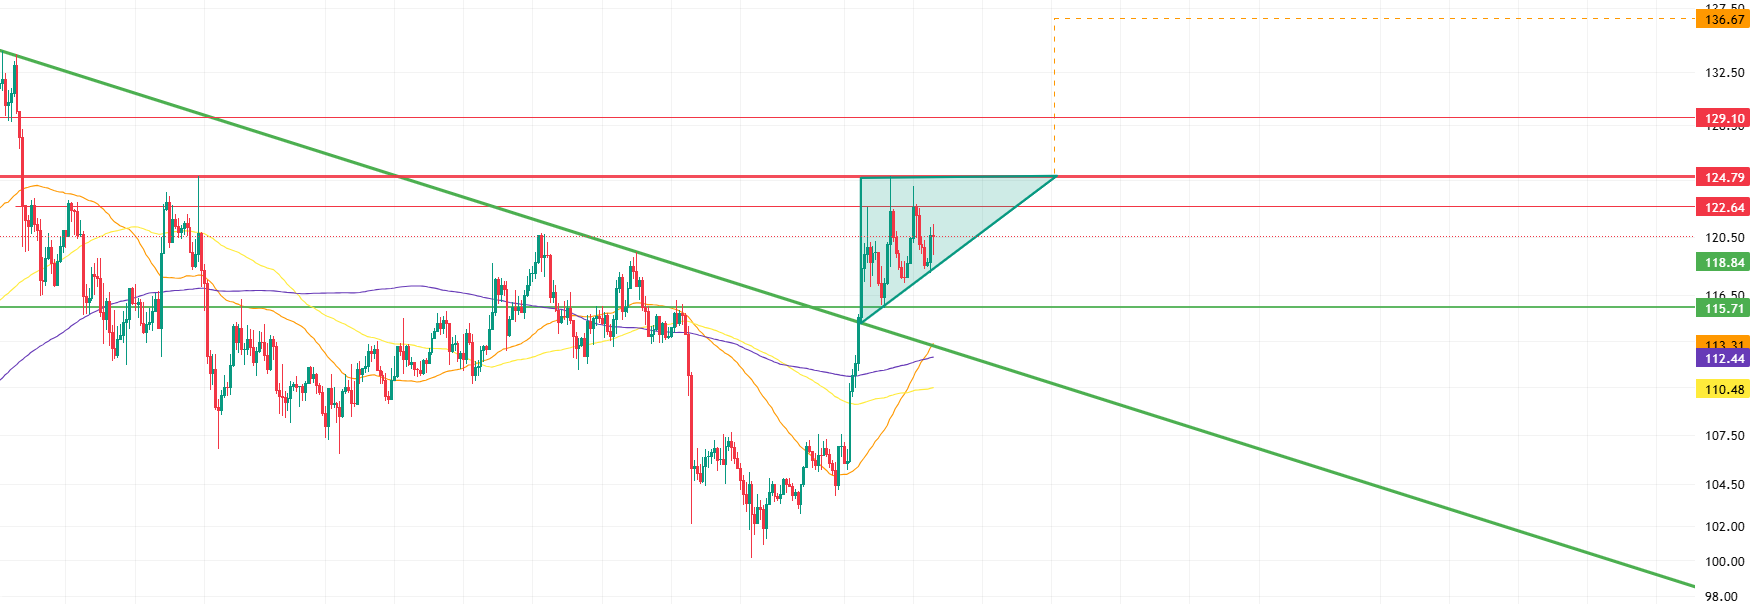
Looking at the technical picture, several important chart formations that support potential upward movements stand out. First, the horizontal resistance level at 122.64 poses a potential obstacle. Next, the upper band of the ascending triangle at the 124.79 level emerges as another important resistance point. Breaking the resistance level at 124.79 could complete the ascending triangle formation upward, increasing the potential for prices to move towards the 136.67 level. However, the first important test on this journey could be the resistance at 129.10. At this level, a short-term correction may occur, or prices may continue to rise by breaking through this level.
In possible pullback scenarios, the fact that the previously broken downtrend has not yet been retested indicates that a short-term correction may be on the agenda, even for the healthy continuation of the medium-term uptrend. In this context, the possibility of a pullback towards the 113.31 level, where the 50-period moving average passes, should not be overlooked. If such a move begins, the lower band of the ascending triangle formation at 118.84 could be considered an intermediate support level in the first stage. Below this level, the horizontal support at 115.71 stands out as another critical zone where the price could consolidate before a possible retest.
Supports: 118.84 – 115.71 – 113.31
Resistances: 122.64 – 124.79 – 129.10
Legal Notice
The investment information, comments, and recommendations contained herein do not constitute investment advice. Investment advisory services are provided individually by authorized institutions taking into account the risk and return preferences of individuals. The comments and recommendations contained herein are of a general nature. These recommendations may not be suitable for your financial situation and risk and return preferences. Therefore, making an investment decision based solely on the information contained herein may not produce results in line with your expectations.

