MARKET SUMMARY
Latest Situation in Crypto Assets

*Prepared on 2.09.2024 at 07:00 (UTC)
WHAT’S LEFT BEHIND
Binance Temporarily Suspends Deposits and Withdrawals on Horizen Network
Binance will temporarily suspend deposits and withdrawals from 10:00 am on September 12, 2024 due to the planned upgrade of the Horizen (ZEN) network. The upgrade will take place around 11:00 am on September 12, and ZEN trading will resume without interruption. Binance will resume trading once the network upgrade is complete and stable, and users will not need to take any action.
SEC Crackdown on FTX Redemption Plans!
The SEC has issued a warning against FTX’s plans to pay creditors with stablecoins or other digital assets. The SEC, along with the US Trustee, is also objecting to a discharge provision that would limit future liabilities of FTX debtors. FTX’s bankruptcy estate is over $800 million.
Bitcoin Miners Saw the Lowest Revenue in a Year in August
Bitcoin mining revenue fell by $99.75 million in August 2024 to its lowest level of the year. Of the total revenue from mining, $20.76 million came from on-chain fees. As mining revenue fell, the number of Bitcoin whales holding at least 100 BTC reached a 17-month high. As the price of Bitcoin has fallen by more than 10% in recent weeks, whales may be using the drop as an opportunity to accumulate more Bitcoin.

INFORMATION
*The calendar is based on UTC (Coordinated Universal Time) time zone. The economic calendar content on the relevant page is obtained from reliable news and data providers. The news in the economic calendar content, the date and time of the announcement of the news, possible changes in the previous, expectations and announced figures are made by the data provider institutions. Darkex cannot be held responsible for possible changes that may arise from similar situations.
MARKET COMPASS
Traditional markets had a mixed start to the trading session as we begin the week of critical employment data from the US. US stock markets rose on the last trading day of last week after the PCE Price Index. Manufacturing PMI data released for China over the weekend was below expectations. Asian markets have a mixed outlook this morning and Europe is expected to start the new day with a flat to negative opening.
The pressure seems to continue on digital currencies, which lost value after the sell-off in Asian markets as we move towards a flat end of the week. Critical data to be released for the US economy in the first week of September will continue to dominate prices, as will expectations regarding the FED’s monetary policy decisions. It is worth reminding that US markets will be closed today due to Labor Day, and we may continue to see the effects of fragile risk appetite. Therefore, it is worth noting that the pressure may continue on the crypto front, and from time to time we may see reaction purchases with weak volume.
TECHNICAL ANALYSIS
BTC/USDT
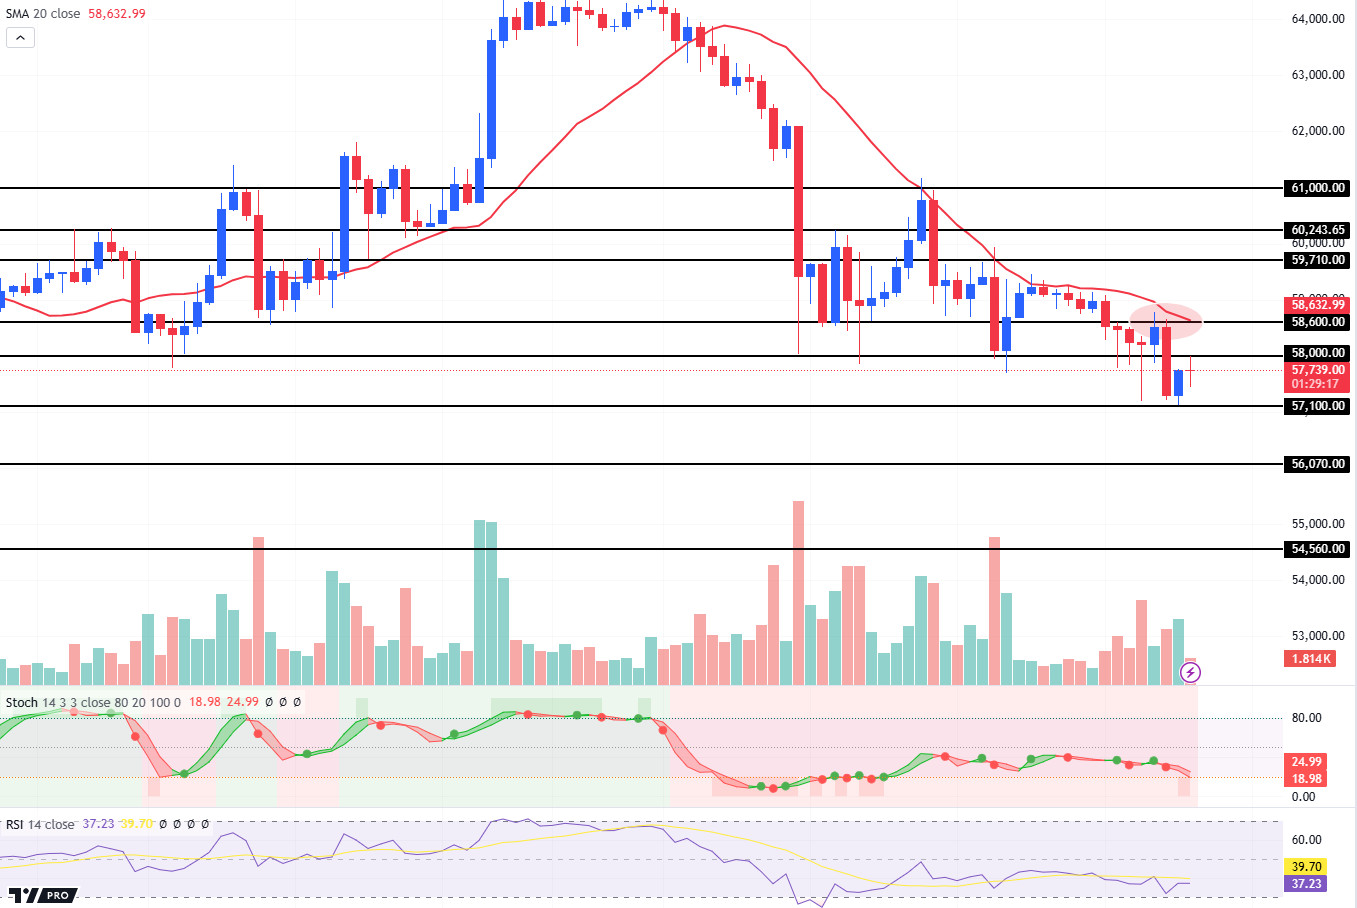
We saw that the 58,000 level, which served as support during the past week, was defended over the weekend. However, as we started the new week with the Asian session, BTC lost this critical support. This morning, the price tried but failed to break 58,000, this time acting as resistance. As for the pivot, following 58,600 (Red Line – 20 SMA) seems to be more effective. We can say that BTC price will continue to see pressure as long as it continues to stay below 58,600 resistance. 57,100 and 56,070 stand out as the closest supports. If the 58,600 barrier is crossed, 59,710 can be targeted. However, the critical 58,000 and 58,600 thresholds will need to be crossed first.
Supports 57,100 – 56,070 – 54,560
Resistances 58,000 – 58,600 – 59,710
SOL/USDT
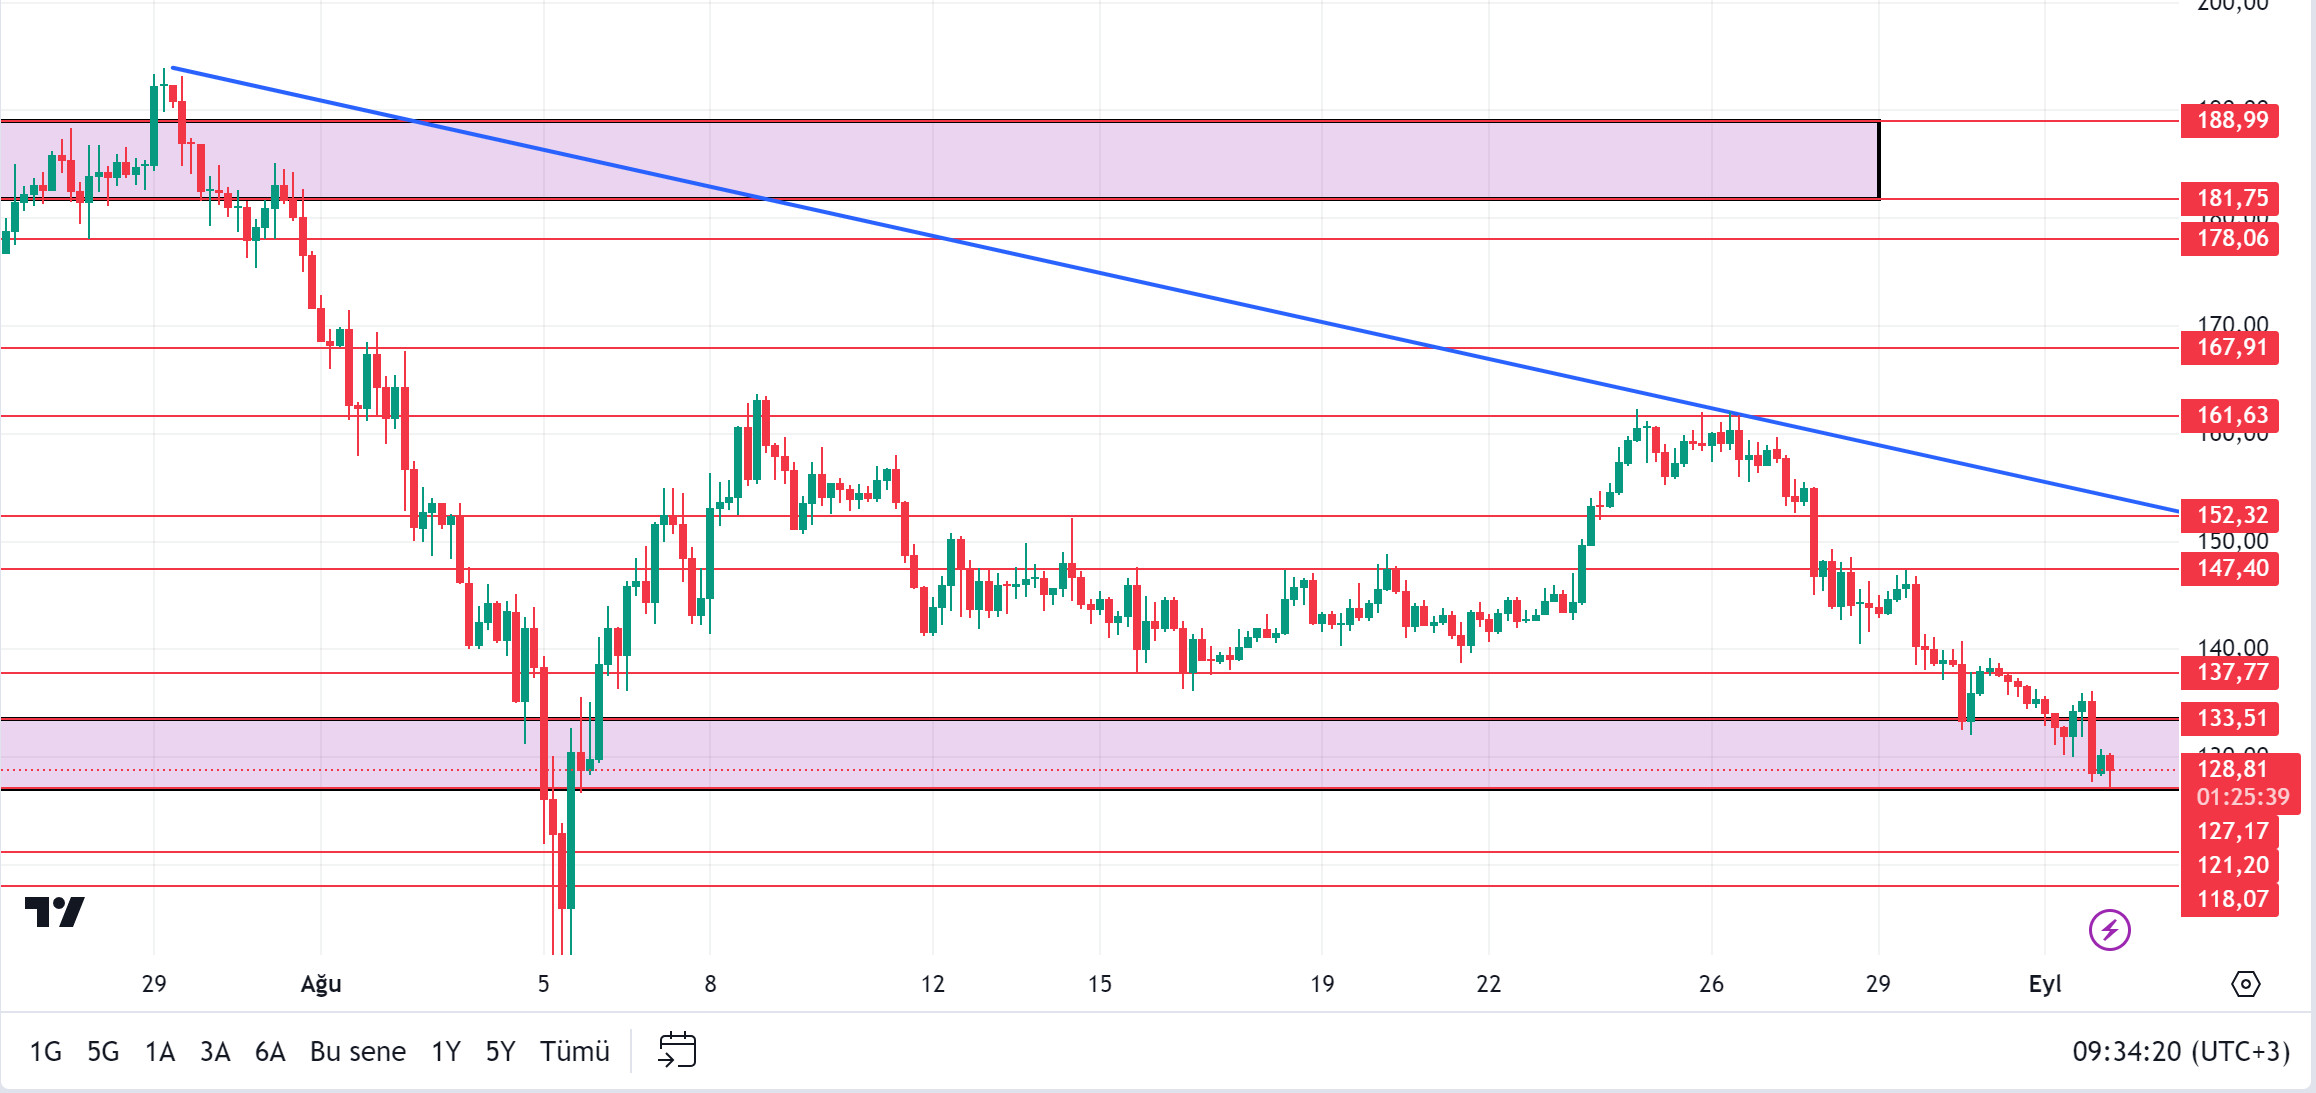
The recent consecutive declines at Solana have significantly reduced interest in cryptocurrency, as data from Santiment shows. An analysis of the open interest graph reveals a significant drop over the last five days. On August 26, SOL’s open interest data was over $987 million, but has since dropped to around $787 million as of this writing. This decline suggests that cash inflows are decreasing and fewer traders are taking part in SOL transactions. According to Lookonchain data, one whale or institution sold 139,532 SOLs worth $19.5 million on a centralized exchange at a loss of $5.5 million. Looking at the chart, if SOL closes a daily candle below the $ 127.17 level, the $ 121.20 level appears as an important support. SOL, which has been accumulating in a certain band since April, may test the support levels of 127.17 – 121.20 if the declines continue. If purchases increase in the market, 133.51 – 137.77 resistances should be followed.
Supports 127.17 – 121.20 – 118.07
Resistances 133.51 – 137.77 – 147.40
ADA/USDT
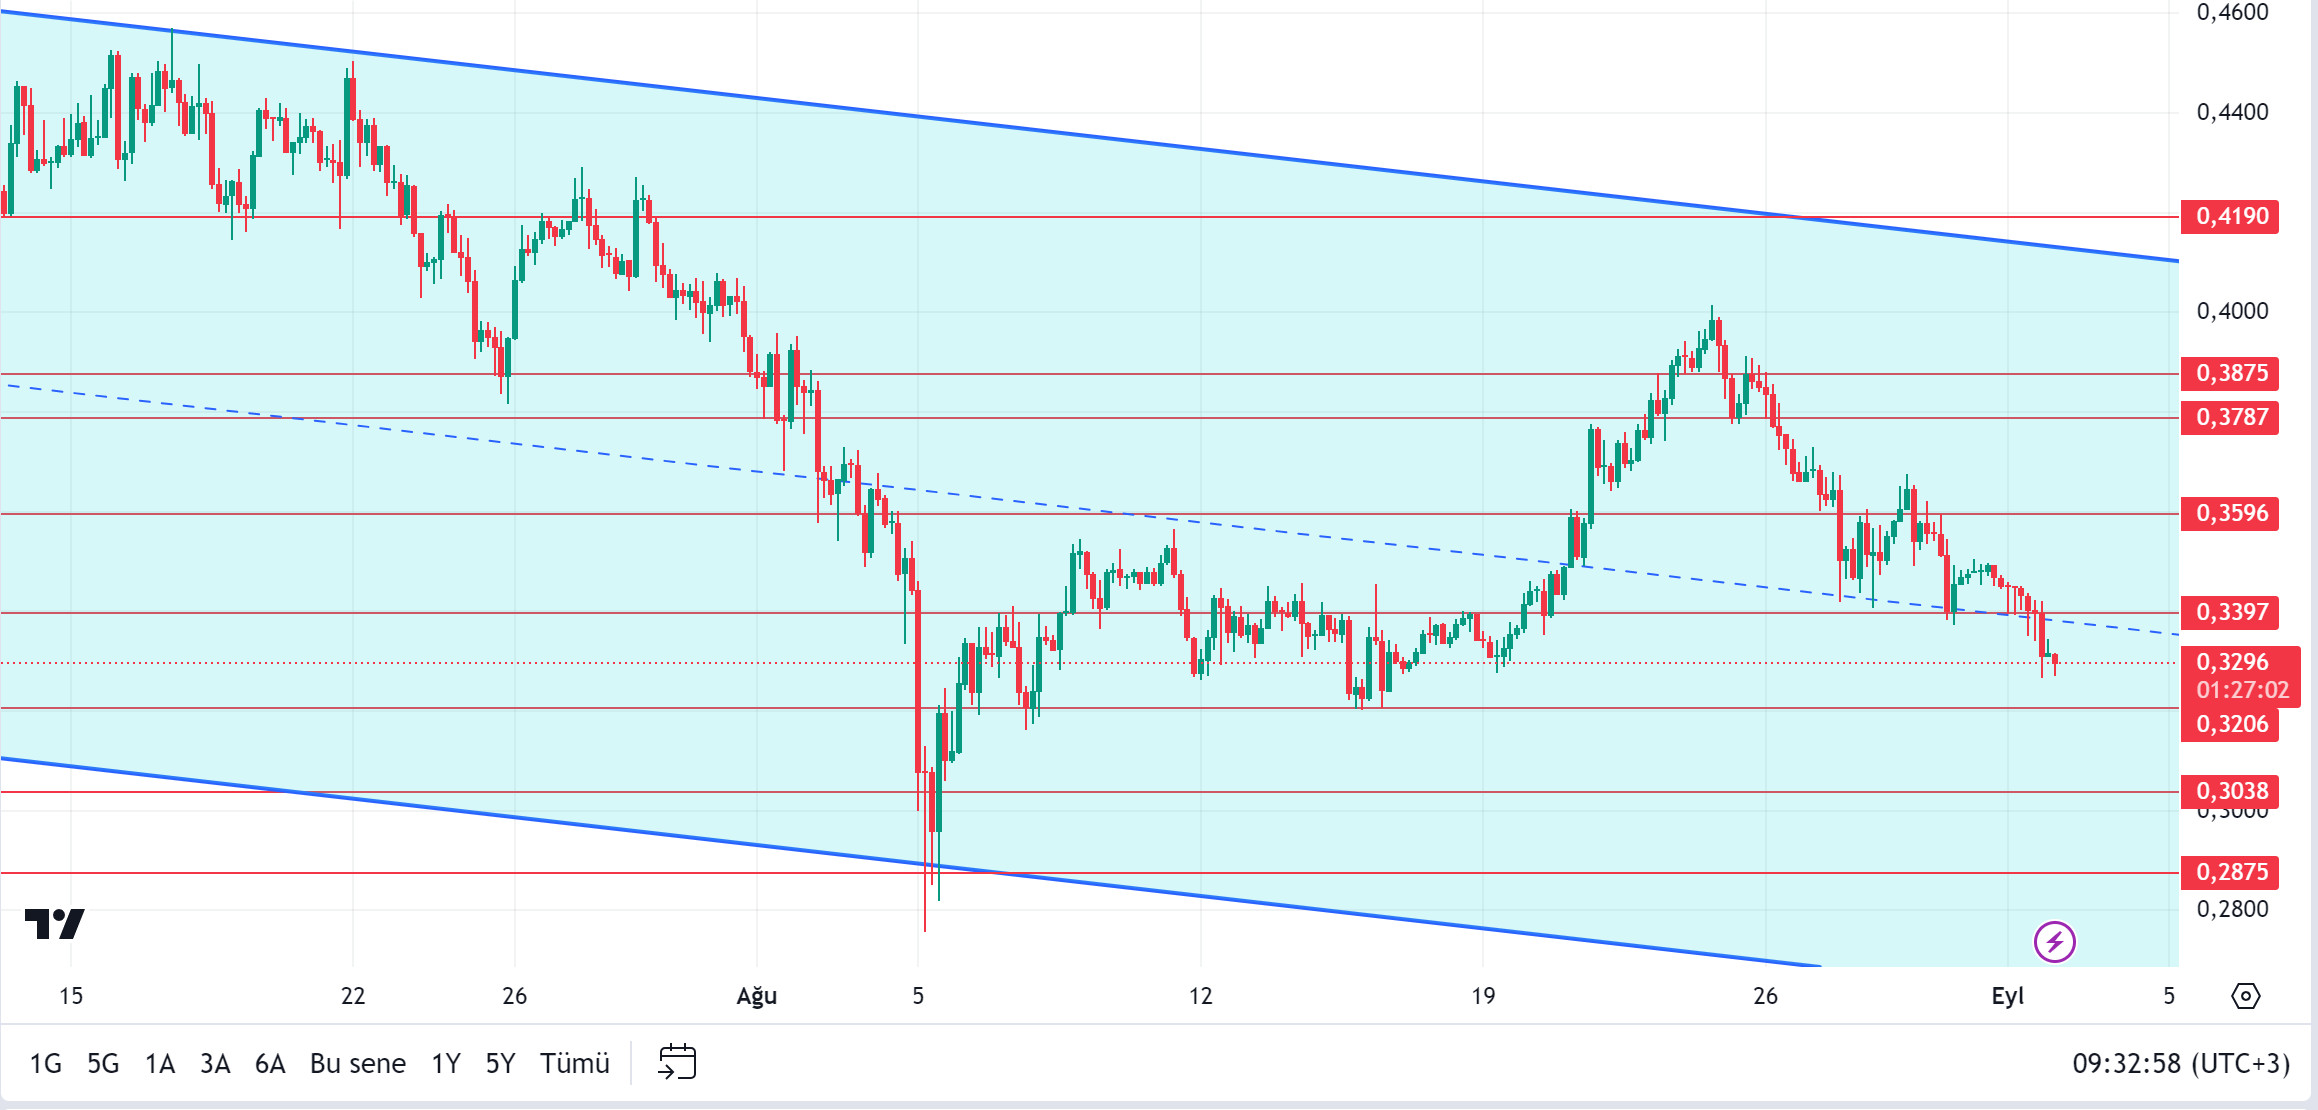
Cardano’s chang hard fork has gone live and started a major shift towards decentralized governance. The first phase has been activated and full governance is expected within 90 days. According to data from Cardanoscan, at the time of writing, 42 exchanges are ready for the chang hard fork, 6 exchanges are in progress, and 10 exchanges have not yet started any transactions for the update. On the other hand, with the closure of social media platform X in Brazil, Charles Hoskinson, a prominent figure in the cryptocurrency industry, presented an ambitious plan to build a decentralized social network aimed at supporting the freedom of expression of Brazilian citizens. “The consequences of censorship and why decentralization matters,” Hoskinson said, underscoring the critical need for alternative social media solutions amid growing regulatory pressures. When we look at the chart of ADA, it is priced at 0.3296 in the descending channel. With the expectation of the incoming update, the levels of 0.3397 – 0.3597 can be followed as resistance levels with the continued rise of ADA, which did not decline much despite the market. In the scenario where investors anticipate BTC’s selling pressure to continue and the pessimism of the actors in the market to continue, if it continues to be priced by declining in the descending channel, 0.3206 – 0.3038 levels can be followed as support.
Supports 0.3206 – 0.3038 – 0.2875
Resistances 0.3397 – 0.3596 – 0.3787
AVAX/USDT
AVAX, which opened yesterday at 22.80, fell by about 6% during the day and closed the day at 21.42.
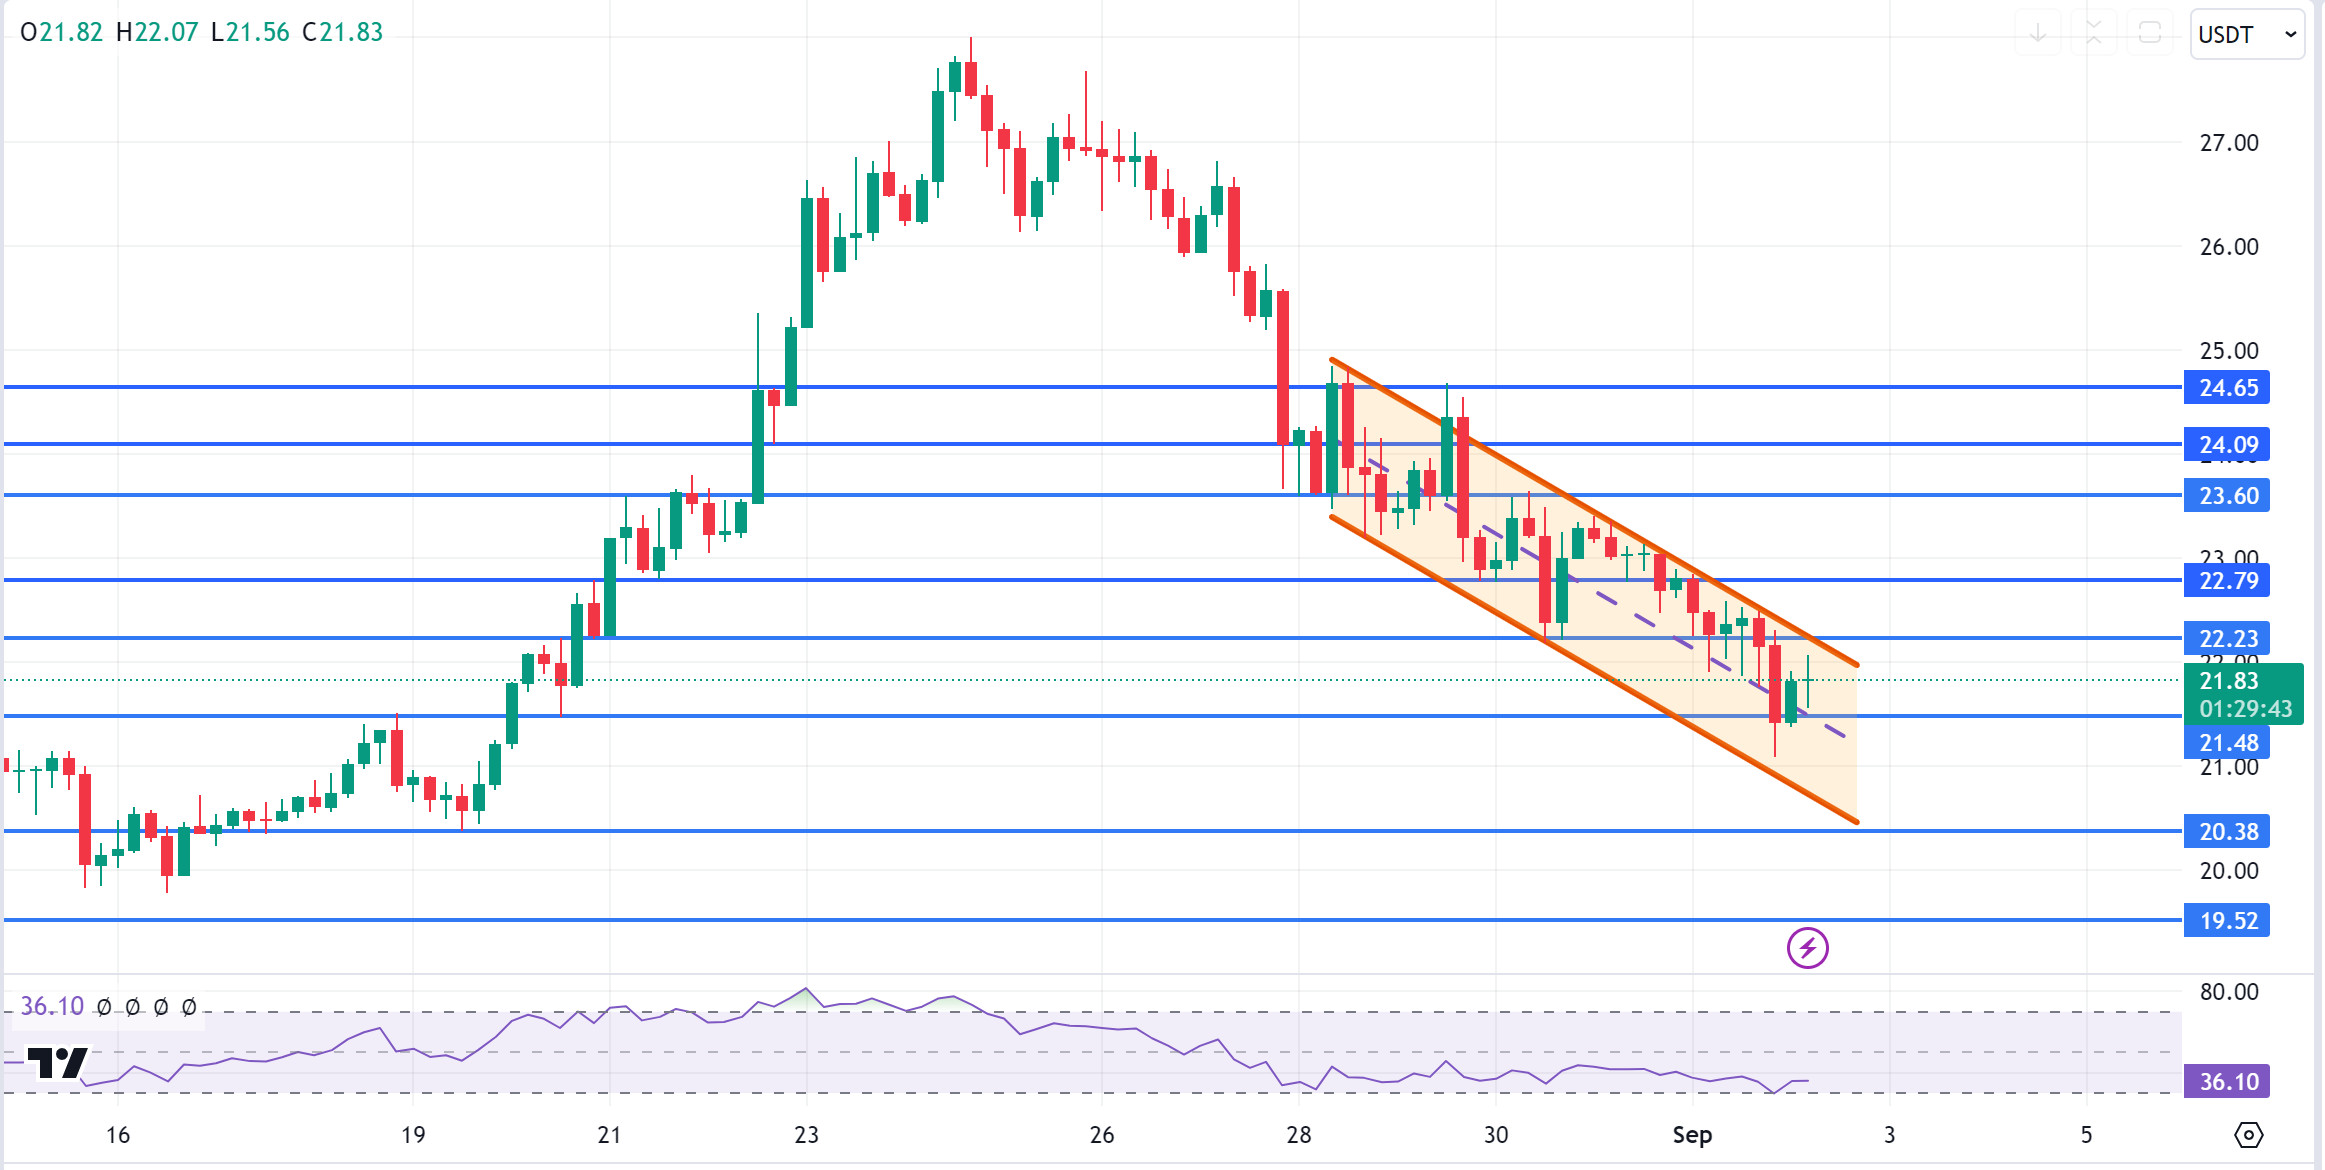
Today, US markets will be closed due to the Labor Day holiday. AVAX, priced at 21.83 on a calm day in terms of macro data, continues to move in a falling channel. On the 4-hour chart, it is approaching the upper band of the channel and may face a selling pressure here. In such a case, it may test 21.48 support. If it breaks the upper band of the channel upwards, it may test the 22.23 and 22.79 resistances. As long as it stays above 20.38 support during the day, the upward appetite may continue. With the break of 20.38 support, sales can be expected to deepen.
Supports 21.48 – 20.38 – 19.52
Resistances 22.23 – 23.79 – 23.60
TRX/USDT
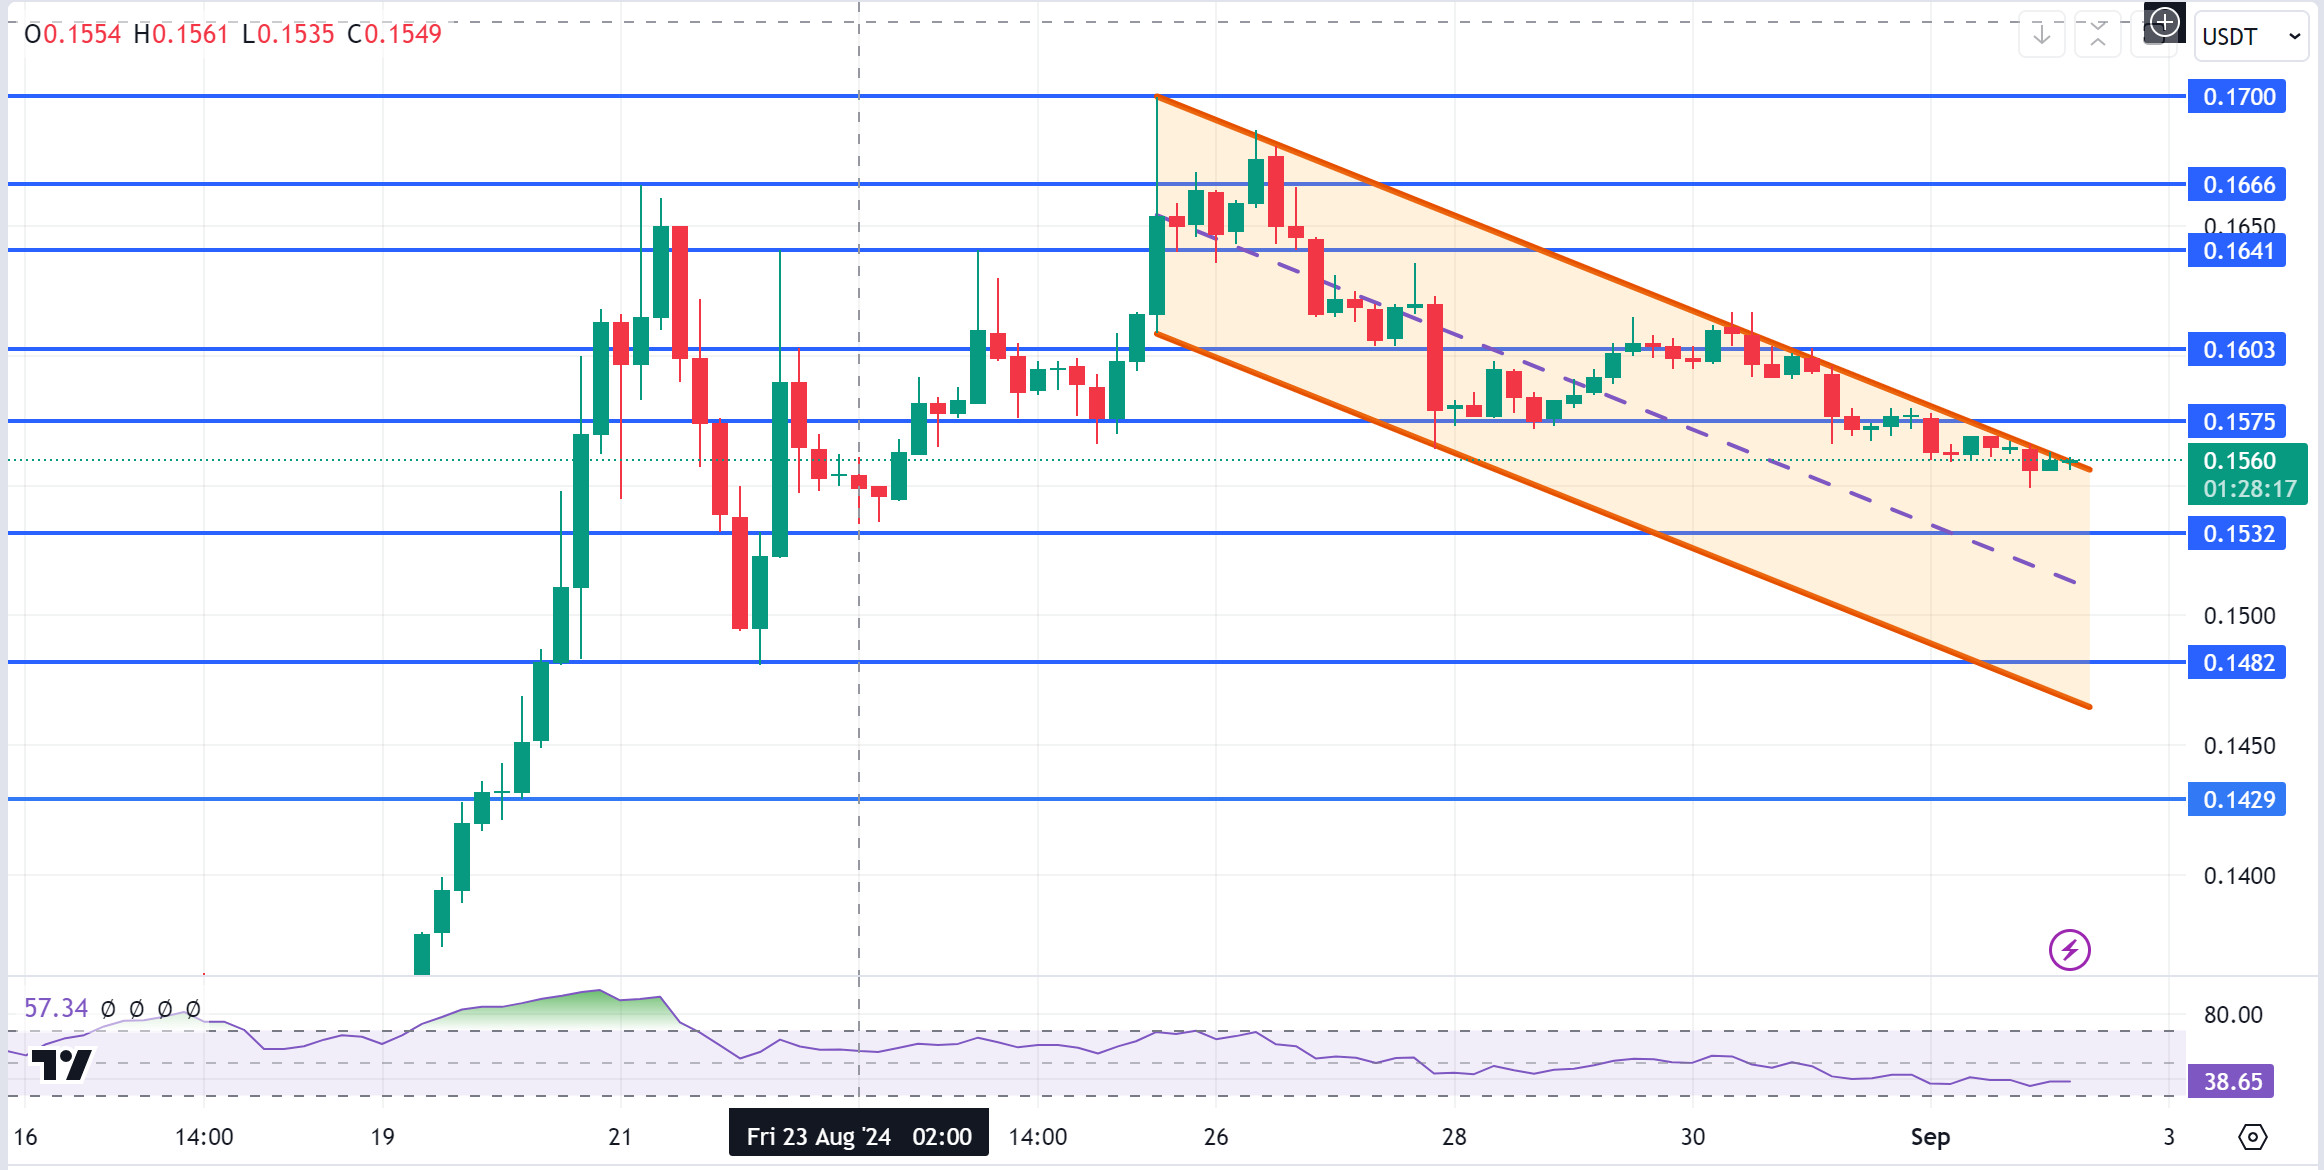
TRX, which started yesterday at 0.1576, fell slightly and closed the day at 0.1556. Today may be a low volume day as US markets are closed. On such a day, TRX is trading at 0.1560. TRX, which moves in a falling channel, is at the upper band of the channel on the 4-hour chart. Its rise may accelerate as it breaks the upper band of the channel. In such a case, it may test the 0.1575 and 0.1603 resistances. If it fails to break the upper band, it may fall back to the middle band. In this case, it may test the 0.1532 support. If it fails to hold here, it may fall to the lower band of the channel and test the 0.1482 support. As long as TRX stays above 0.1482 support, it can be expected to continue its upward demand. If it breaks this support downwards, sales may deepen.
Supports 0.1532 – 0.1482 – 0.1429
Resistances 0.1575 – 0.1603 – 0.1641
XRP/USDT
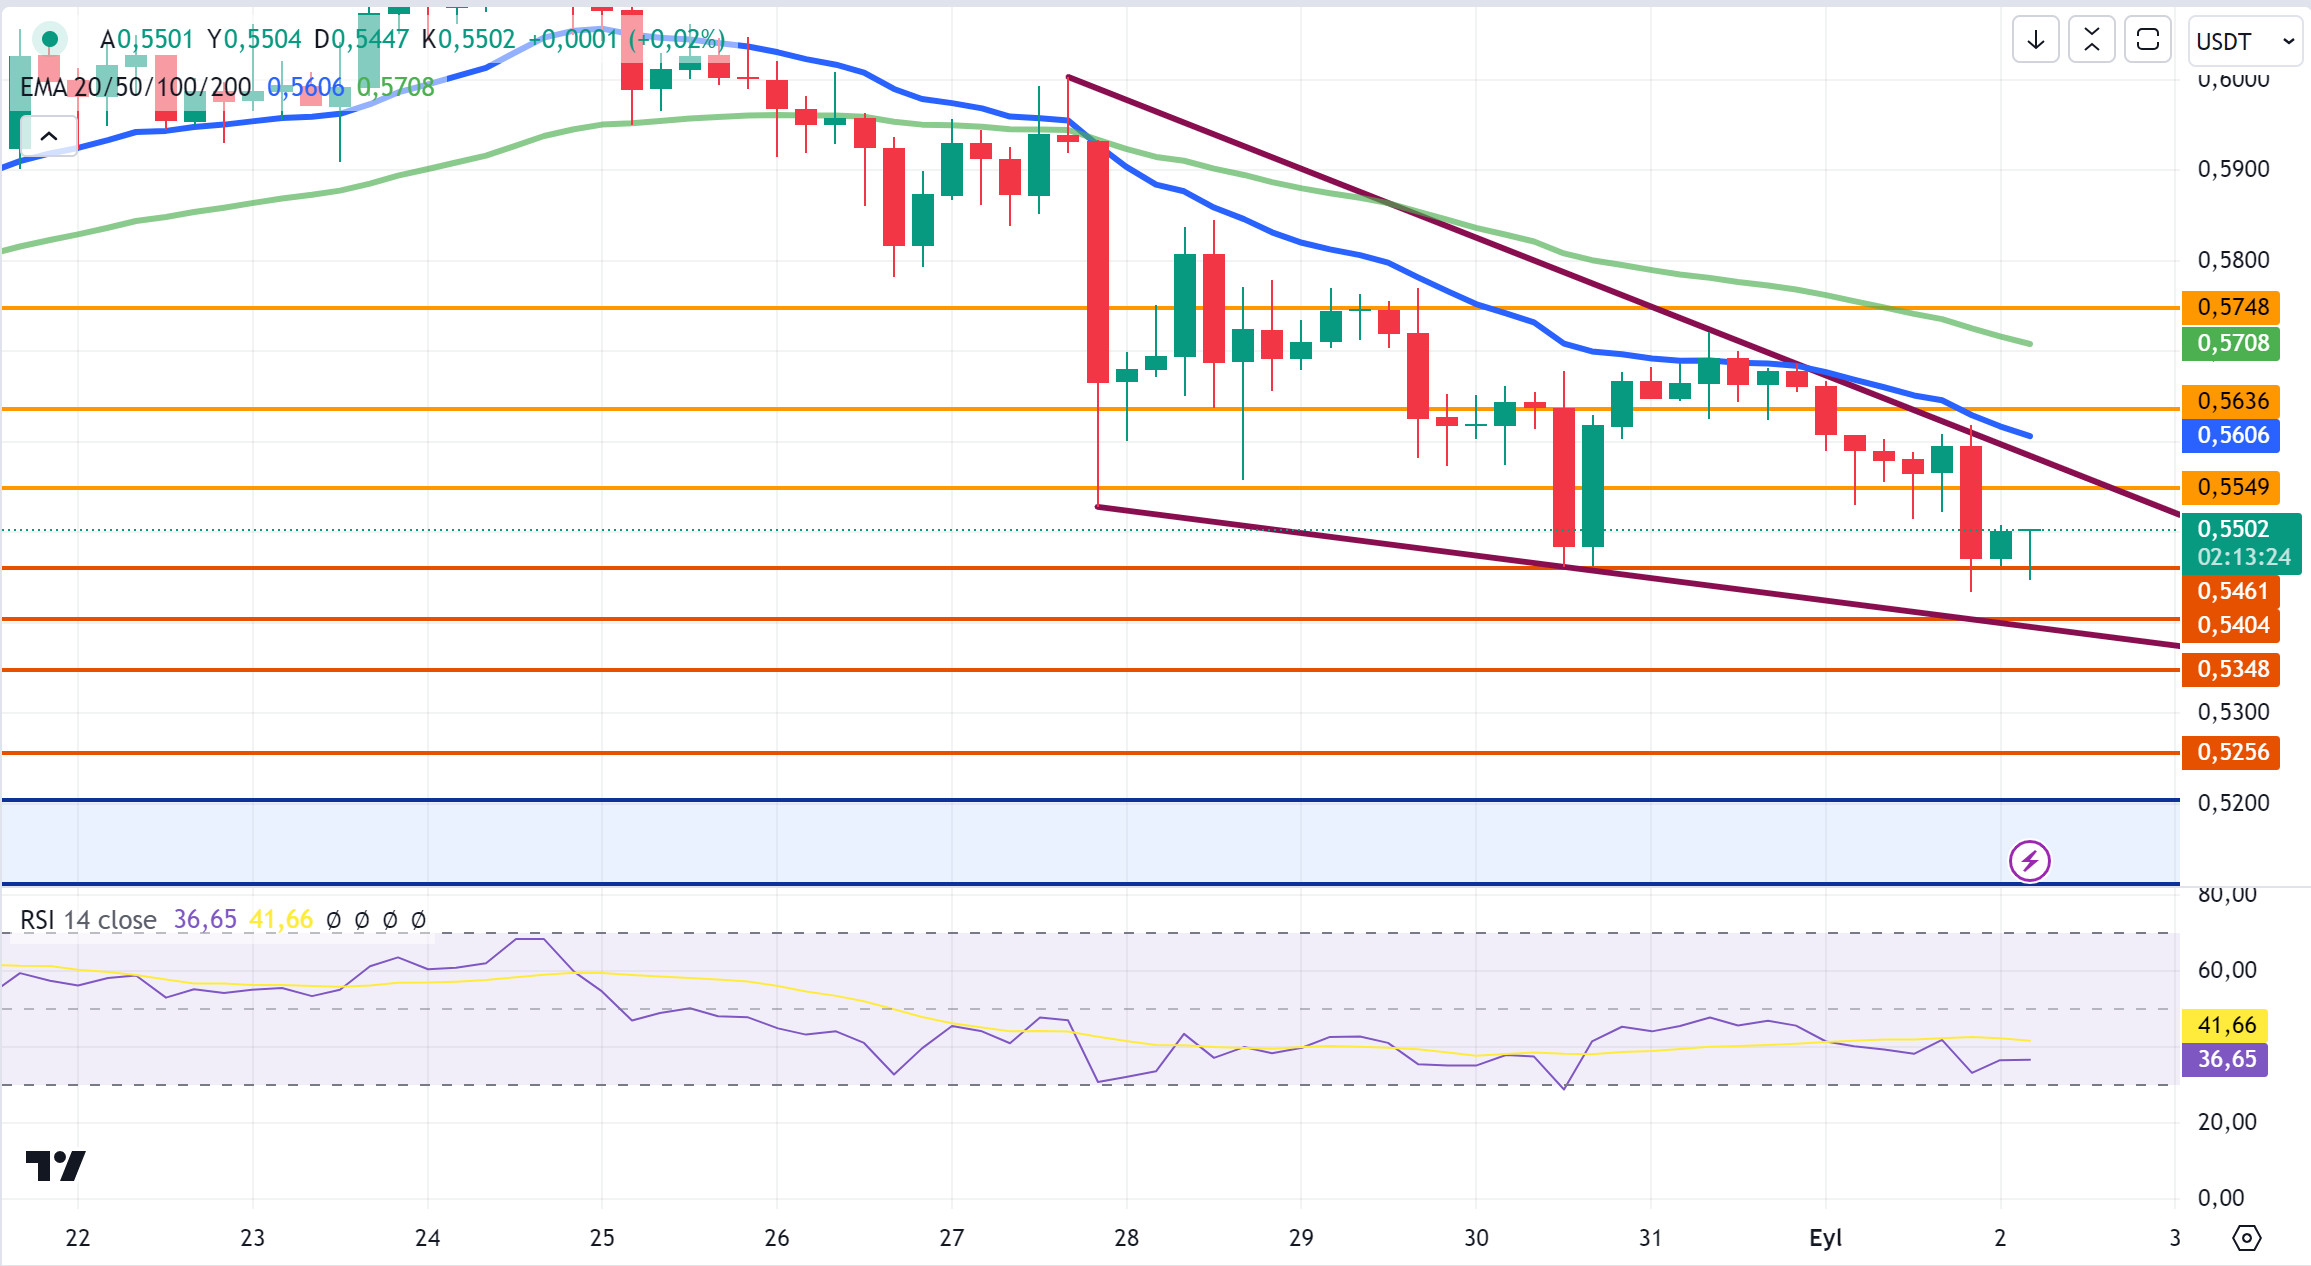
Since August 24, the downtrend that has dominated the crypto market is also showing its effect on XRP. XRP, which fell after hitting 0.6311 on August 24, fell to 0.5424 with a loss of about 2.7% in the last candle yesterday in the 4-hour analysis. XRP, which started today at 0.5467, continues to trade at 0.5502 with an increase of about 0.6%.
While the crypto market is declining due to decreased demand across the board, the XRP escrow system locked 800 million XRP yesterday against 1 billion XRP unlocks. The difference between the amount of unlocked and locked XRP was 200 million units – about 110 million dollars worth. While this was happening yesterday, XRP lost 3.4% on a daily basis.
When we examine the 4-hour analysis, we can see that the 0.5461 support level has been tested and has not yet been broken. If the 0.5461 support level is broken as the downtrend continues, XRP may test the 0.5404 – 0.5348 support levels. With positive developments, XRP may test the resistance levels of 0.5549 – 0.5636 – 0.5748 if the demand for XRP increases and the uptrend begins.
If the 0.5461 support level cannot be broken and continues to be traded in the 0.55-0.58 band, XRP may offer opportunities for long transactions. Otherwise, if the 0.5461 support level is broken, the decline towards the 0.51-0.52 band may deepen and offer short trading opportunities.
Supports 0.5461 – 0.5404 – 0.5348
Resistances 0.5549 – 0.5636 – 0.5748
DOGE/USDT
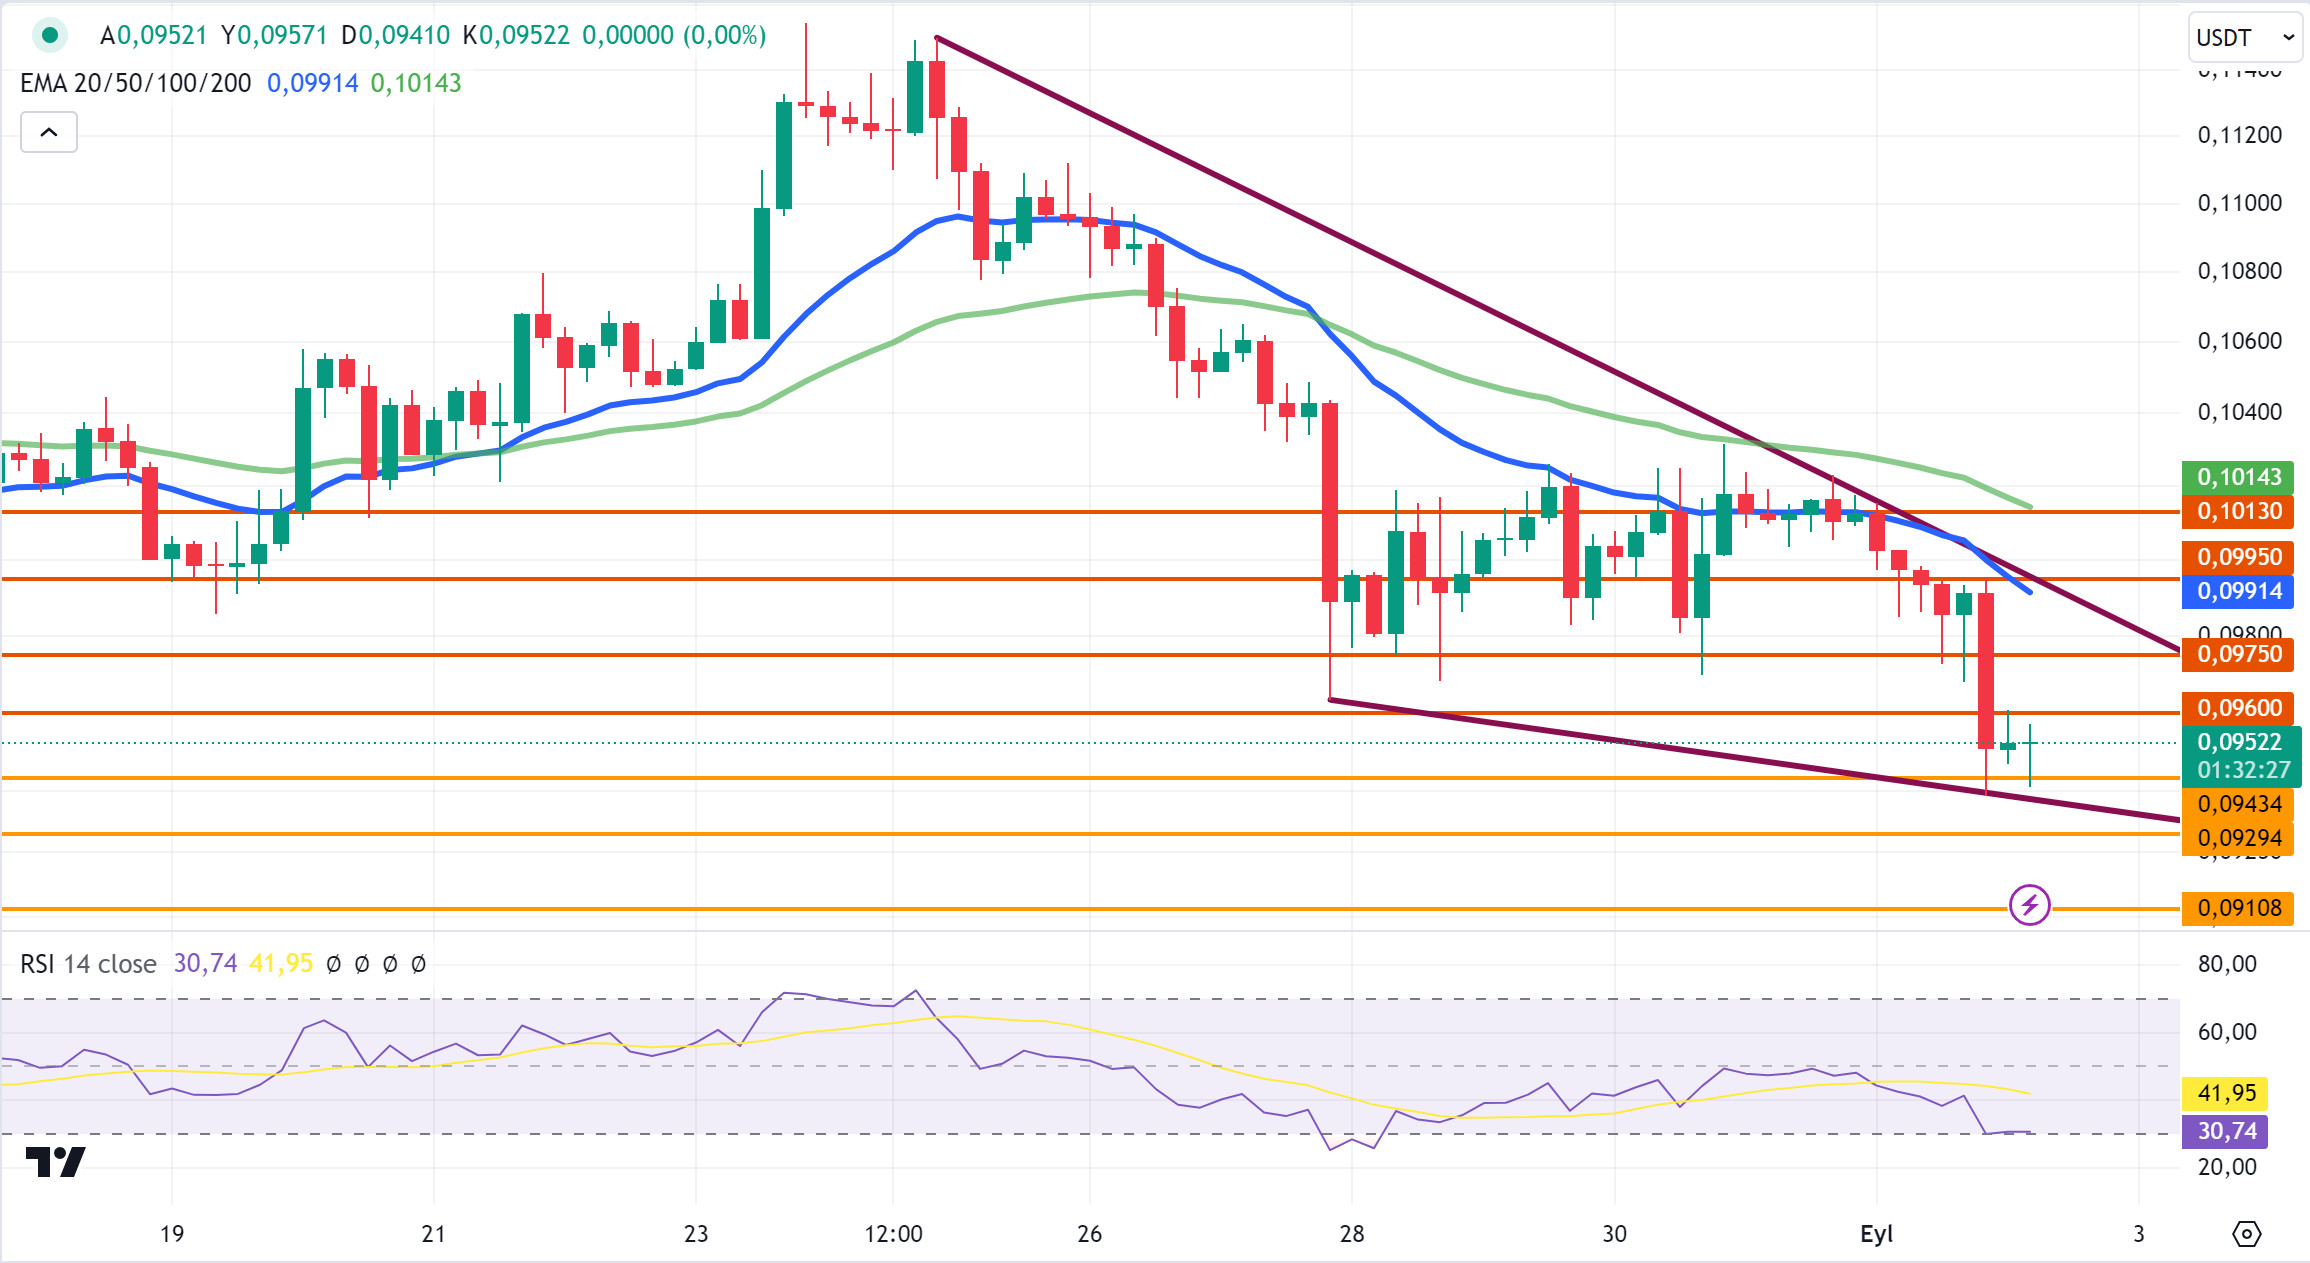
The downtrend dominating the crypto market also showed its effect on DOGE. DOGE, which started last week at 0.1095, closed last week at 0.0950 with a loss of 13.25%. DOGE is currently trading at 0.0952.
After Elon Musk won the DOGE case last week, the expectation was that DOGE would rise, but it fell as the expected demand in the market did not come. When we analyze the 4-hour analysis, DOGE fell 4% in the last candle before starting the new week. If the decline continues today, DOGE may test the support levels of 0.0943 – 0.0929 – 0.0910. If it starts to rise with positive developments, it will retest the resistance level of 0.0960 and if it breaks it may test the resistance levels of 0.0975 – 0.0995 – 0.1013.
If the decline in DOGE deepens, it may rise with the reactions at 0.0880 and may offer a long trading opportunity. In the upward movement, it may decline with the reactions at the resistance level of 0.0995 and may offer a short trading opportunity.
Supports 0.0943 – 0.0929 – 0.0910
Resistances 0.0975 – 0.0995 – 0.1013
DOT/USDT
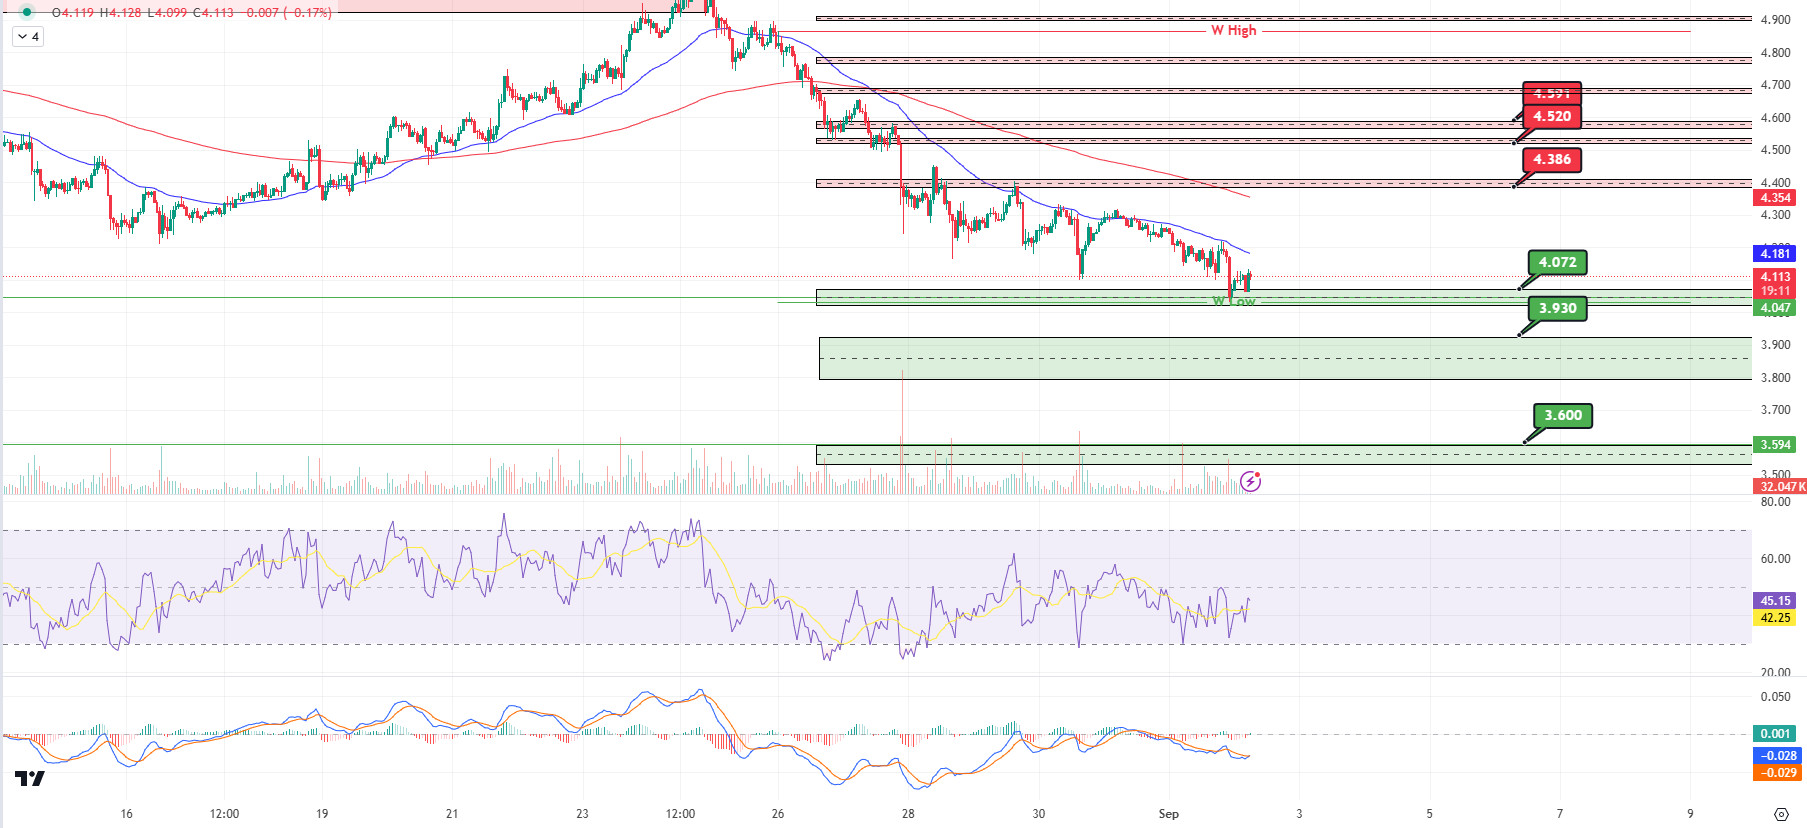
Polkadot (DOT) retreated after testing the EMA50 as resistance as we mentioned in our previous analysis. The price broke down the support levels at 4,240 and 4,165. DOT, which reacted from our last support level of 4.072, is currently flat. When we analyze the MACD, we can say that the selling pressure has decreased compared to the previous hour. In a positive scenario, the price may test 4.386 levels with the reaction from 4.072. On the other hand, if the price cannot hold on to the 4.072 support, it may retreat to 3.930 levels.
(Blue line: EMA50, Red line: EMA200)
Supports 4,072 – 3,930 – 3,600
Resistances 4.386 – 4.520 – 4.386
SHIB/USDT
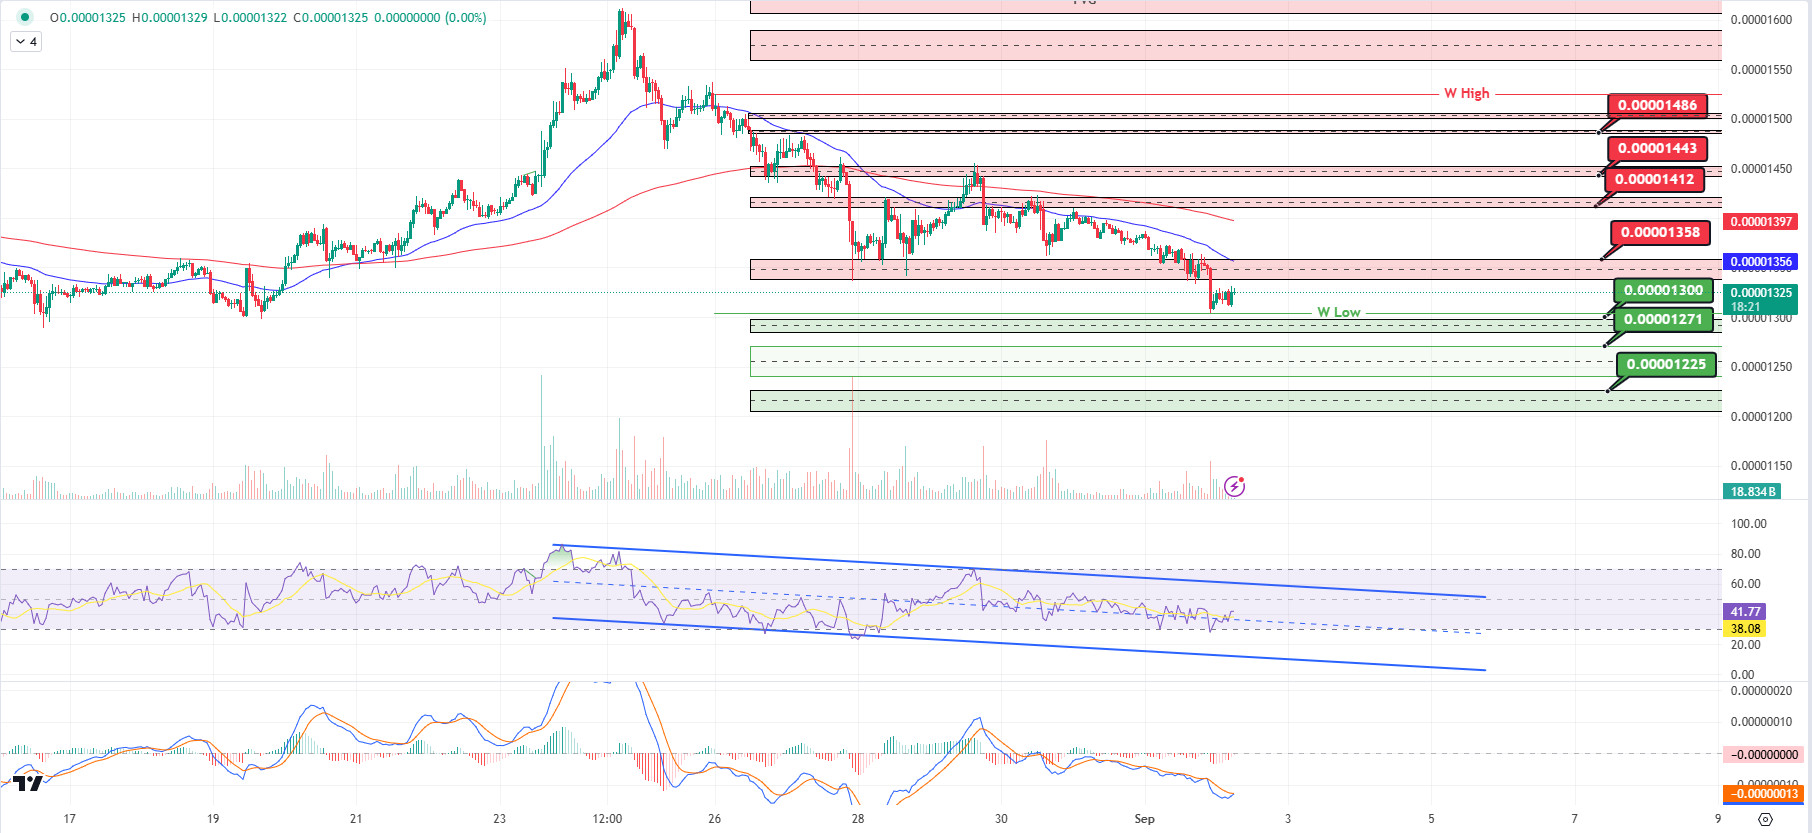
Shiba Inu (SHIB) saw a huge increase in trading volume with 3 trillion SHIBs moving in one day, but the price remained stable. This may indicate that large investors are acting deliberately to accumulate SHIB and not create volatility in the market, or it may be due to transfers between exchanges. The market may be currently in a consolidation phase or preparing for a possible move in the future.
The price was rejected at 0.00001412, the resistance level we mentioned in our last analysis. SHIB, which broke down the support level of 0.00001358 with increasing selling pressure, seems to have received a reaction from the 0.00001300 band, our 2nd support level. When we examine the MACD, we can say that the selling pressure has decreased compared to the previous hour. If the price stays above this level, its next target, the previous support level of 0.00001358 may work as resistance. On the other hand, if SHIB loses the 0.00001300 support, the next support level may be 0.00001271.
(Blue line: EMA50, Red line: EMA200)
Supports 0.00001300 – 0.00001271 – 0.00001225
Resistances 0.00001358 – 0.00001412 – 0.00001443
LEGAL NOTICE
The investment information, comments and recommendations contained herein do not constitute investment advice. Investment advisory services are provided individually by authorized institutions taking into account the risk and return preferences of individuals. The comments and recommendations contained herein are of a general nature. These recommendations may not be suitable for your financial situation and risk and return preferences. Therefore, making an investment decision based solely on the information contained herein may not produce results in line with your expectations.


