
Technical Analysis
BTC/USDT
U.S. Treasury Secretary Benson said the government shutdown is costing the economy $15 billion a day and that the AI boom is still in its early stages. A consortium including BlackRock, Nvidia, xAI, and Microsoft is acquiring data center giant Aligned Data Centers for $40 billion. Following the acquisition, the number of data campuses in the U.S. is planned to double to 50. On the crypto front, Japan-based publicly traded company Remixpoint increased its total holdings to 1,381.83 BTC by acquiring an additional 2.85 BTC.
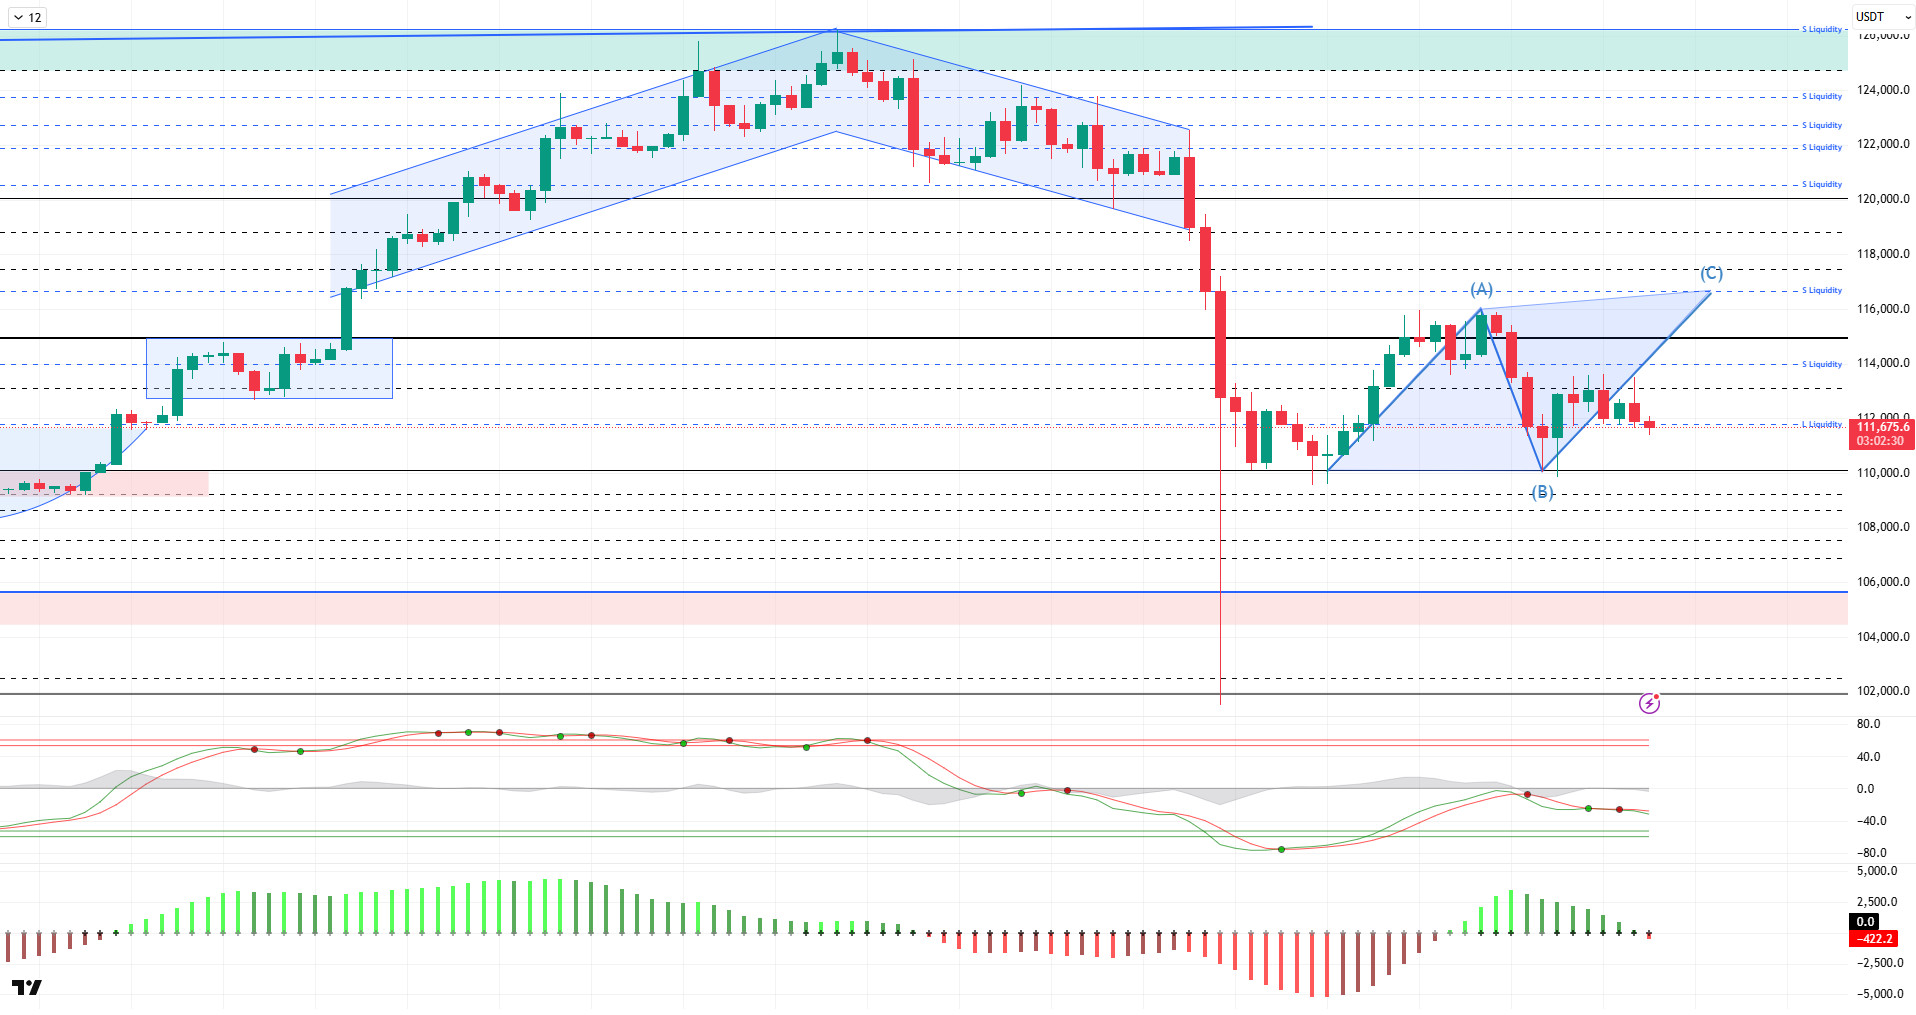
From a technical perspective, BTC tested the 113,500 level after recording an increase with an ABC structure following the second dip. The price then retreated to the 111,500 level, turning to liquidity buying again. At the time of writing, BTC continues to trade at the 111,700 level, attempting to recover.
Technical indicators show that the Wave Trend (WT) oscillator is weakening its sell signal in the middle band of the channel following a short-term trend reversal. The Squeeze Momentum (SM) indicator shows that the histogram is weakening after short-term momentum support. The Kaufman moving average (KAMA) is currently at the $112,000 level, confirming the rise by positioning itself below the price.
According to liquidation data, the price kept its desire to test the region alive with a significant accumulation of buy positions at the 111,500 level during the day, resulting in liquidation. In contrast, the sell level intensified in the 113,700–113,900 range, becoming the next target position.
In summary, the rise in BTC on the fundamental side is supported by increased institutional demand driven by ETFs, expectations of Fed interest rate cuts, a growing positive correlation with gold, and October’s historically strong cyclical structure. However, Trump’s new tariff threat against China weakened global risk appetite, creating selling pressure on markets in the short term. Technically, BTC reached saturation point by testing its all-time high (ATH) at $126,198. After this level, liquidity data became the main factor triggering a price correction. After a sharp sell-off, BTC recovered somewhat but failed to hold above the $115,000 level and faced renewed selling pressure, falling back to the $110,000 level. After this stage, it is critically important for the price not to lose the 110,000 level for a new upward movement. In this regard, 111,500 stands out as an area of demand accumulation. If demand arises from here, we will follow the 115,000 reference zone and then the liquidity zone.
Supports: 111,500 –110,000 – 109,000
Resistances: 112,600 – 113,000 – 115,000
ETH/USDT
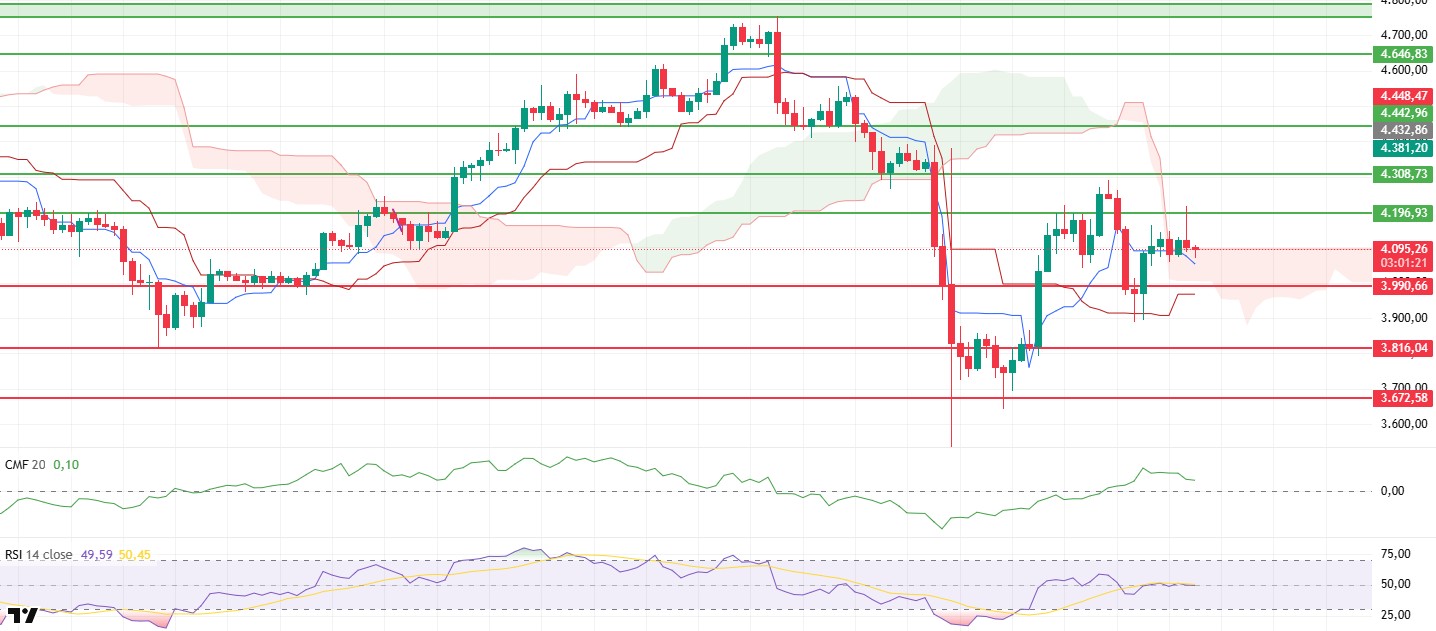
As expected, the ETH price tested the $4,196 level in the morning hours, but due to strong selling pressure in this region, it failed to sustain its rise and fell back below $4,100. This weakening seen throughout the day reveals that buyers have lost strength in the short term and that profit-taking is effective in the market. In particular, the failure to break through the $4,196 level showed that this region acts as a strong resistance and has become a critical threshold for the sustainability of the rise.
Despite remaining in positive territory, the Chaikin Money Flow (CMF) indicator’s slight pullback indicates that liquidity outflows have begun in the market, albeit limited. This structure signals that capital inflows have weakened and buyers are acting cautiously. The CMF’s continued stay in positive territory, however, reveals that there has been no major outflow from the market overall and that buyers have not completely withdrawn from the field. The Relative Strength Index (RSI) indicator is attempting to hold at the 50 level.
The Ichimoku indicator, however, presents a relatively more positive picture. The price regaining the Tenkan level and showing accumulation at the upper band of the kumo cloud indicates that the market is still holding in positive territory. This structure signals that the overall trend direction remains upward despite short-term corrections. In particular, the price not falling below the cloud reveals that the bullish scenario is technically supported.
In the overall picture, the $3,990 level is a critical support position. As long as the price remains above this region, the possibility of a market recovery is maintained. If the $4,196 level is retested and this region is breached, the uptrend is expected to gain momentum and continue towards the $4,280 and above regions. However, if the $3,990 support level is broken, sharp sell-offs towards the $3,920 and $3,850 levels could occur as selling pressure intensifies. For buyers to regain control in the short term, both the RSI needs to rise above the 50 level and the CMF needs to recover to reflect strong capital inflows. Otherwise, the likelihood of the market remaining in a sideways or downward range with weak momentum will increase.
Supports: 3,990 – 3,816 – 3,672
Resistances: 4,196 – 4,308 – 4,442
XRP/USDT
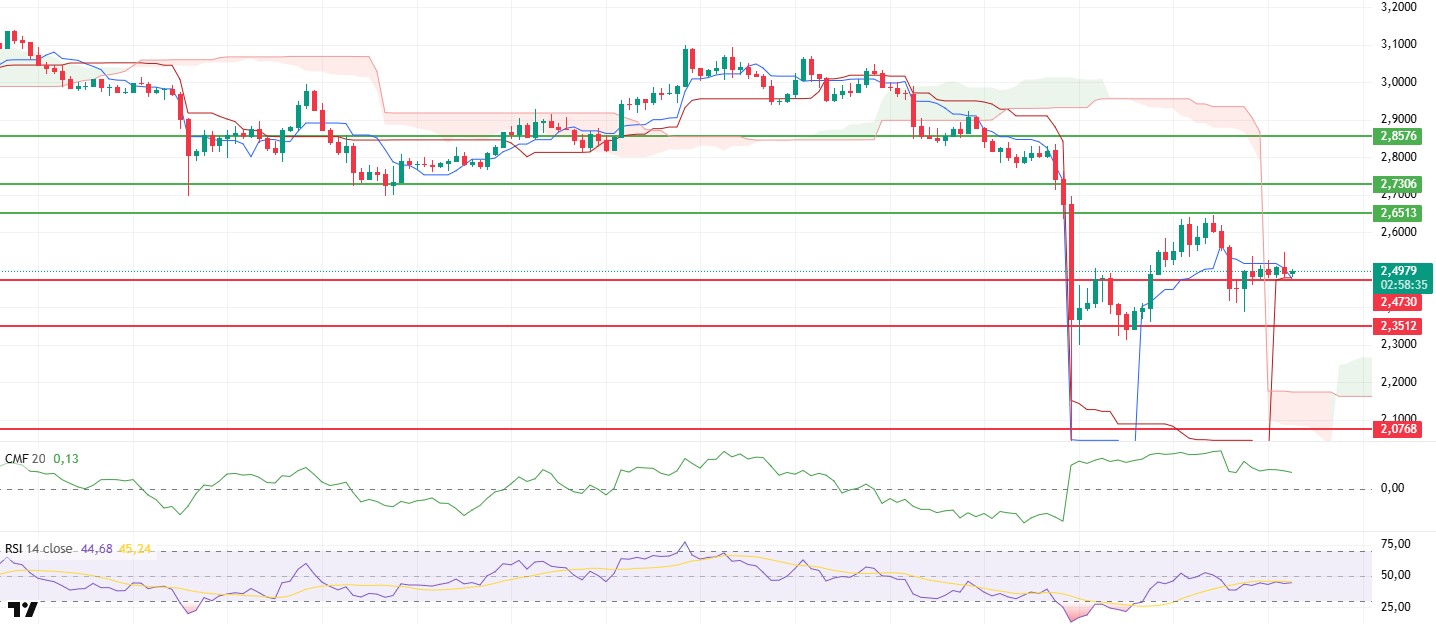
The XRP price continued its sideways movement within a narrow band above the $2.47 level throughout the day. This consolidation during the day indicates that the market balance is being maintained and that buyers are continuing their efforts to keep the price above this level. This structure, where the search for direction continues in the short term, signals that a possible breakout could trigger the start of a new movement.
Looking at the Ichimoku indicator, the overall outlook remains positive. The price staying above the Kijun level and the Tenkan line still hovering above Kijun confirm the upward trend. This technical structure shows that buyers have not completely lost control of the market and that the price is holding in supportive areas.
The Chaikin Money Flow (CMF) indicator continues its horizontal movement in positive territory. This equilibrium reflects that capital inflows into the market are continuing and that selling pressure remains limited. The CMF’s continued stay in positive territory contributes to the price maintaining its stability at current levels.
The Relative Strength Index (RSI) indicator largely maintains its morning outlook. The RSI’s horizontal movement in the weak momentum zone indicates that the upward momentum has not yet gained strength. However, maintaining this balance could pave the way for upward acceleration, along with a possible increase in volume.
The overall picture indicates that the XRP price will remain positive as long as it continues to hold above the $2.47 level. If this support holds, the price is expected to move back towards the $2.65 resistance level. However, a break below the $2.47 level could lead to increased selling pressure in the short term and cause the price to retreat rapidly.
Supports: 2.4730 – 2.3512 – 2.0768
Resistances: 2.6513 – 2.7306 – 2.8576
SOL/USDT
Nansen and Sanctum launched the Solana Liquid Staking Token. nxSOL aims to enable users to earn SOL staking rewards and additional returns in Solana’s DeFi ecosystem.
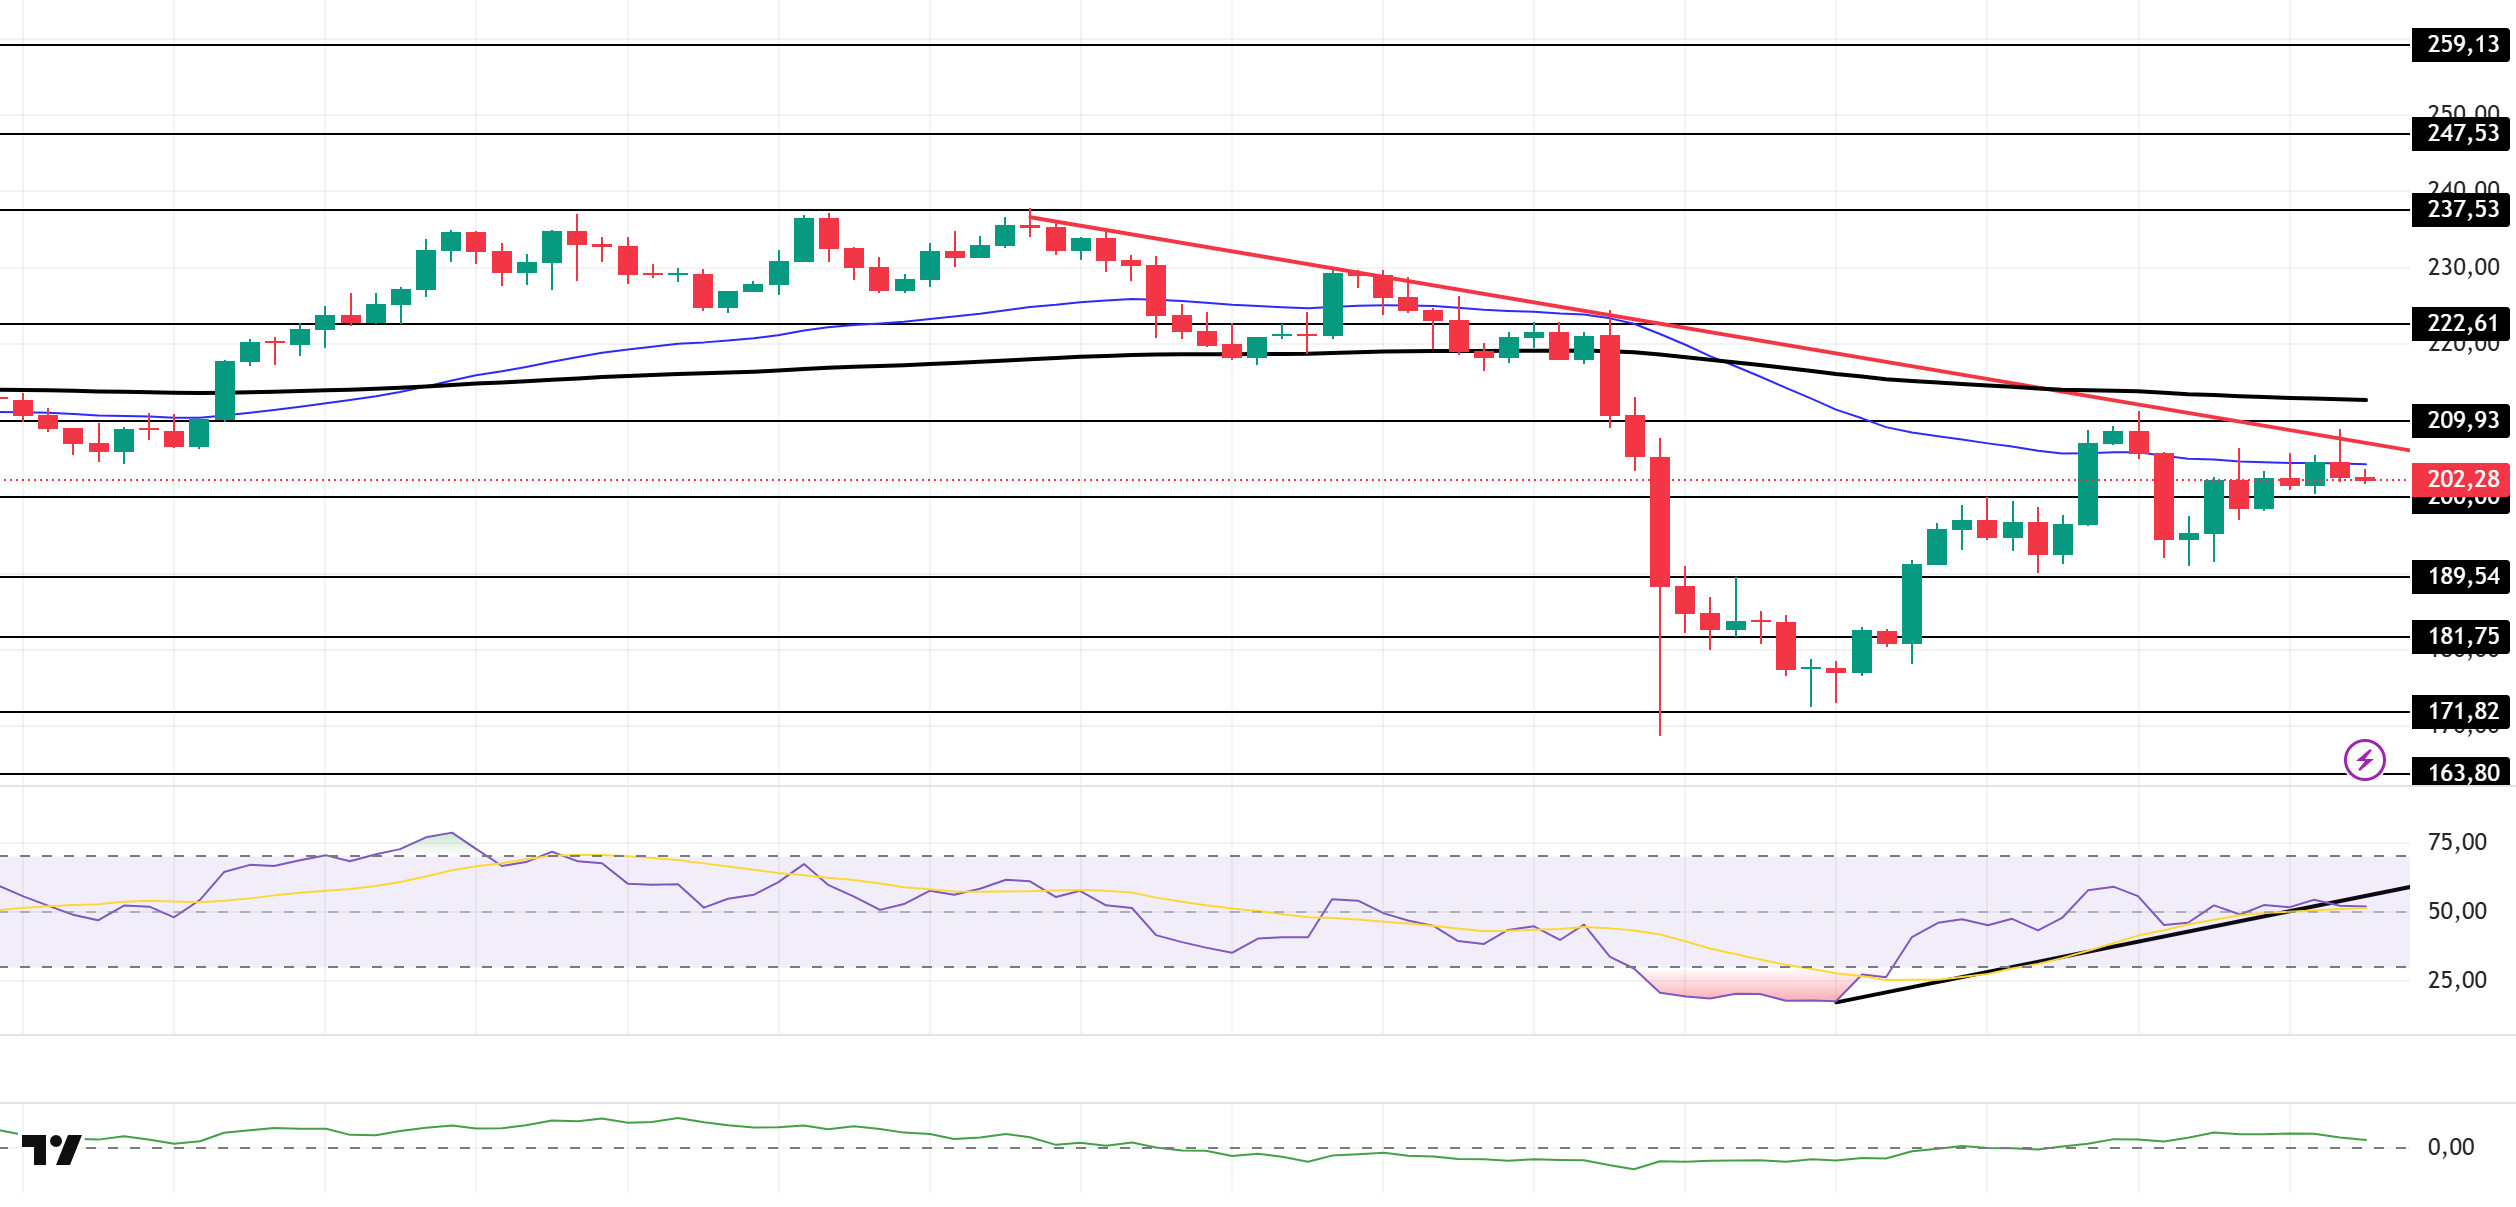
The SOL price moved sideways during the day. The asset continues to be in the lower region of the downtrend that began on October 6. Testing the downtrend as resistance, the price failed to break through and experienced a pullback, and as of now, it has started to trade below the 50 EMA (Blue Line) moving average. If the pullback continues, it could trigger the $189.54 level. Otherwise, it could test the 200 EMA (Black Line) moving average on candle closes above the downward trend line.
The price remained below the 50 EMA (Exponential Moving Average – Blue Line) and 200 EMA (Black Line) on the 4-hour chart. This indicates a possible downtrend in the medium term. At the same time, the price being below both moving averages shows us that the asset is in a downtrend in the short term. The Chaikin Money Flow (CMF-20) remained in positive territory. However, a decrease in money inflows could push the CMF into negative territory. The Relative Strength Index (RSI-14) crossed below the upward trend that began on October 12. This signaled the emergence of selling pressure. If there is an upturn due to macroeconomic data or positive news related to the Solana ecosystem, the $209.93 level stands out as a strong resistance point. If this level is broken upwards, the uptrend is expected to continue. If pullbacks occur due to developments in the opposite direction or profit-taking, the $189.54 level could be tested. A decline to these support levels could increase buying momentum, presenting a potential upside opportunity.
Supports: 200.00 – 189.54 – 181.75
Resistances: 209.93 – 222.61 – 237.53
DOGE/USDT
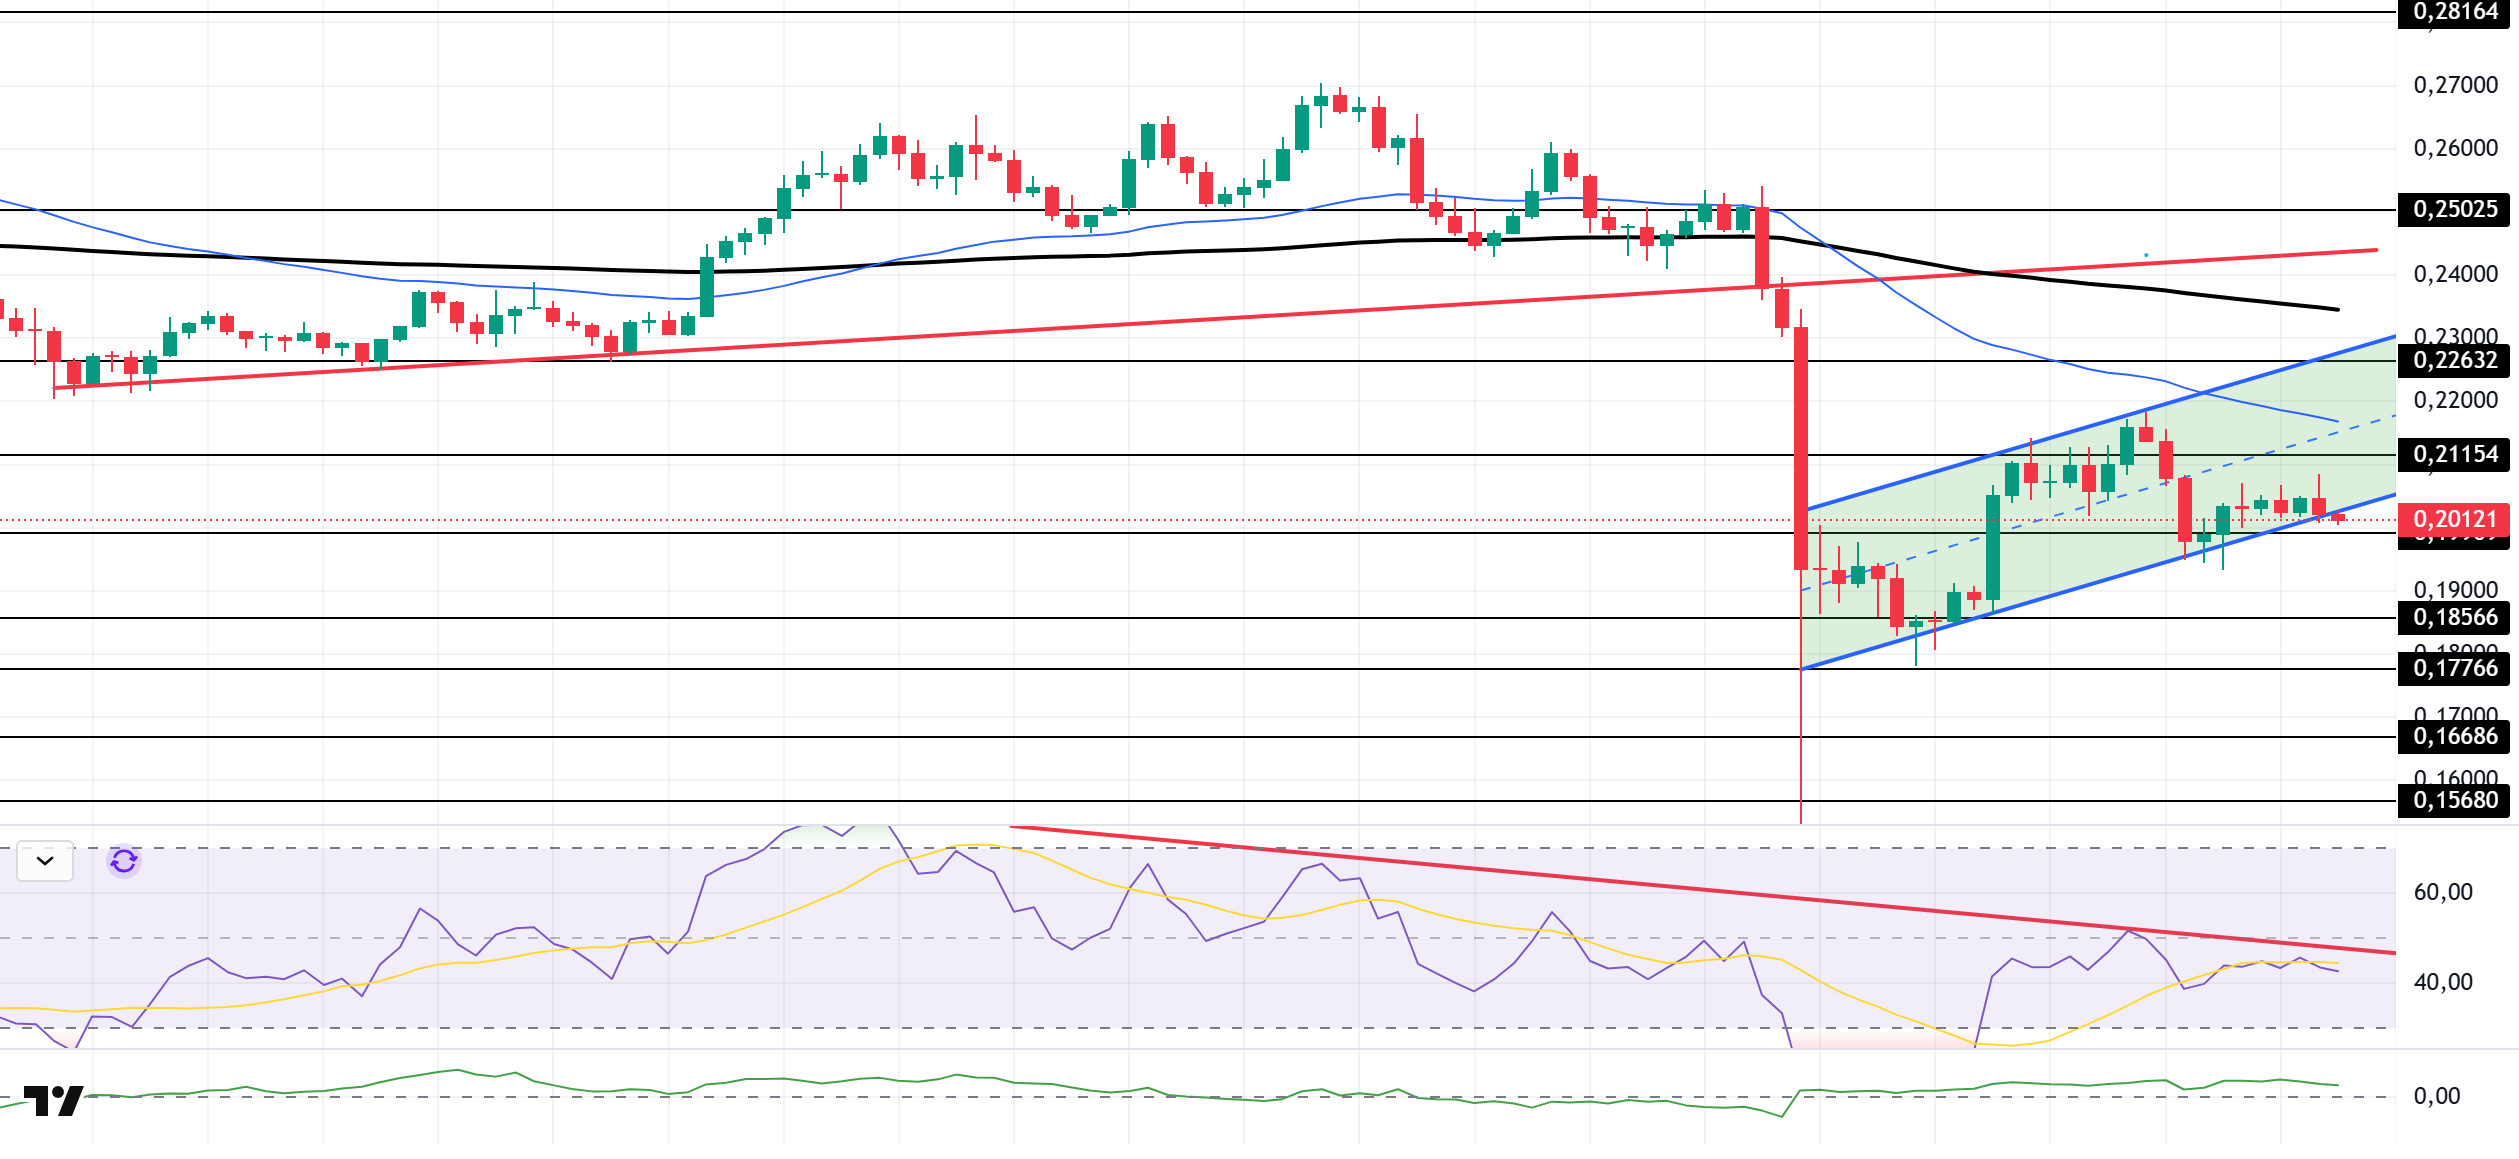
The DOGE price showed a slight decline during the day. The asset continues to trade in the lower region of the upward trend that began on September 25. It is currently testing the base level of the falling flag formation, which is a strong support level. If it breaks below this level, the pullback could deepen significantly. If it experiences an uptrend, the 50 EMA (Blue Line) moving average should be monitored.
On the 4-hour chart, the 50 EMA (Exponential Moving Average – Blue Line) remained below the 200 EMA (Black Line). This indicates that a downtrend may begin in the medium term. The price being below both moving averages shows that the price is trending downward in the short term. The Chaikin Money Flow (CMF-20) remained in positive territory. Additionally, a decrease in money inflows could push the CMF into negative territory. The Relative Strength Index (RSI-14) tested the resistance line that began on October 2 but failed to break through, remaining below the line. The metric, which remained in the middle of the negative zone, signaled continued selling pressure. In the event of an upturn driven by political developments, macroeconomic data, or positive news flow in the DOGE ecosystem, the $0.22632 level stands out as a strong resistance zone. Conversely, in the event of negative news flow, the $0.18566 level could be triggered. A decline to these levels could increase momentum and initiate a new wave of growth.
Supports: 0.19909 – 0.18566 – 0.17766
Resistances: 0.21154 – 0.22632 – 0.25025
LTC/USDT
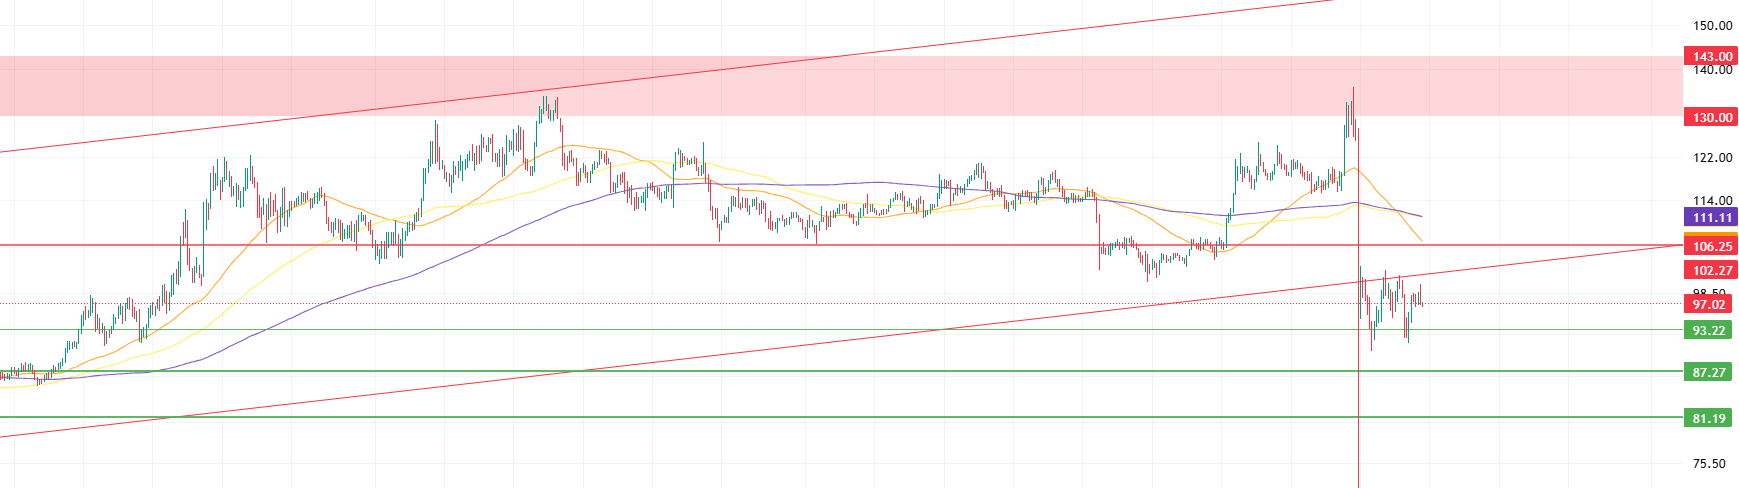
LTC ended the day down 0.32% against USDT, but gained 1.05% against Bitcoin. In the futures market, the long/short position ratio of 0.9029 over the last 24 hours indicates that the downward trend in derivatives market participants’ expectations has slowed but is still ongoing. Funding rates remain neutral. This picture shows that the decline seen in the derivatives markets in the first half of the day is expected to continue in the second half.
From a technical perspective, pricing continuing below all moving averages and the rising trend, along with the prevalence of short positions in the derivatives market, continues to support expectations of a decline, although there is also upside potential. In this scenario, the first point where selling pressure could be encountered is the rising trend lower band, currently at 102.12. Subsequently, the horizontal resistance at 106.25, reinforced by the 50-period moving average (orange line), holds potential as another resistance level that could suppress any potential upward movements. In the next stage, the 111.11 level, where the 100- and 200-period moving averages (yellow and purple lines) are located, carries the possibility of pressure increasing again.
In pullback movements that meet the general expectations of derivatives market investors, it may be possible to close or reduce short positions at 93.22, which is a point where the price could initially find support. If the price falls below this level, the decline is likely to accelerate, and the price could potentially retreat to 87.27. If the price falls below this level, the 81.19 region will become a major support level. Breaking this point could be considered a critical threshold, suggesting that the market is not just undergoing a short-term correction but that the medium-term trend is beginning to shift in favor of the bears.
Supports: 93.22 – 87.27 – 81.19
Resistances: 102.12 – 106.25 – 111.11
SUI/USDT
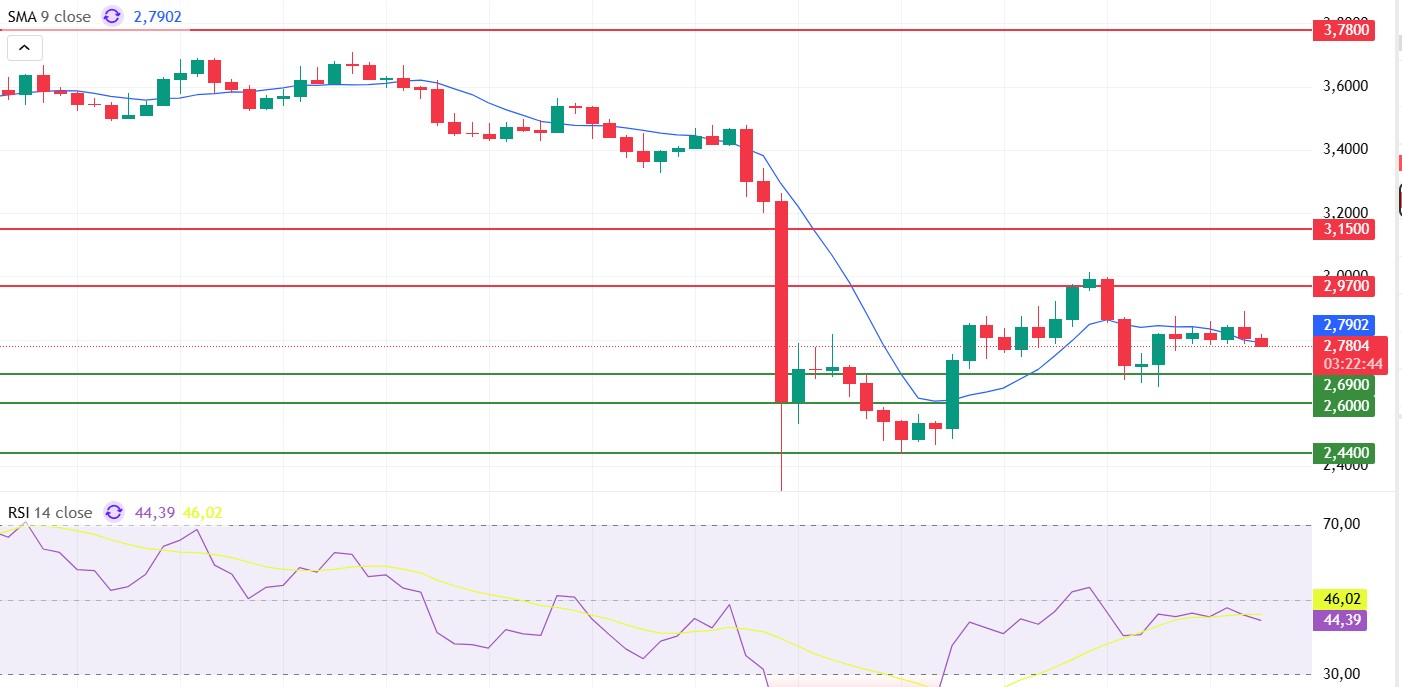
Looking at Sui’s technical outlook, we see that the price has fallen to around $2.78 on the 4-hour chart, influenced by fundamental developments. The Relative Strength Index (RSI) is currently in the 46.02 – 44.39 range. This range indicates that the market is trending in the buying zone; however, if the RSI falls to the 35.00 – 45.00 range or below, it could signal a potential buying point. If the price moves upward, the $2.97 – $3.15 – $3.78 levels can be monitored as resistance points. However, if the price falls to new lows, it may indicate that selling pressure could deepen. In this case, the $2.69 and $2.60 levels stand out as strong support zones. In particular, in the event of a sharp sell-off, a pullback to $2.44 appears technically possible.
According to Simple Moving Averages (SMA) data, Sui’s average price is currently at the $2.79 level. The price remaining above this level indicates that the current uptrend may not continue technically.
Supports: $2.44 – $2.60 – $2.69
Resistances 2.97 – 3.15 – 3.78
Legal Notice
The investment information, comments, and recommendations contained herein do not constitute investment advice. Investment advisory services are provided individually by authorized institutions taking into account the risk and return preferences of individuals. The comments and recommendations contained herein are of a general nature. These recommendations may not be suitable for your financial situation and risk and return preferences. Therefore, making an investment decision based solely on the information contained herein may not produce results in line with your expectations.

