Weekly Ethereum Onchain Report
Active Addresses
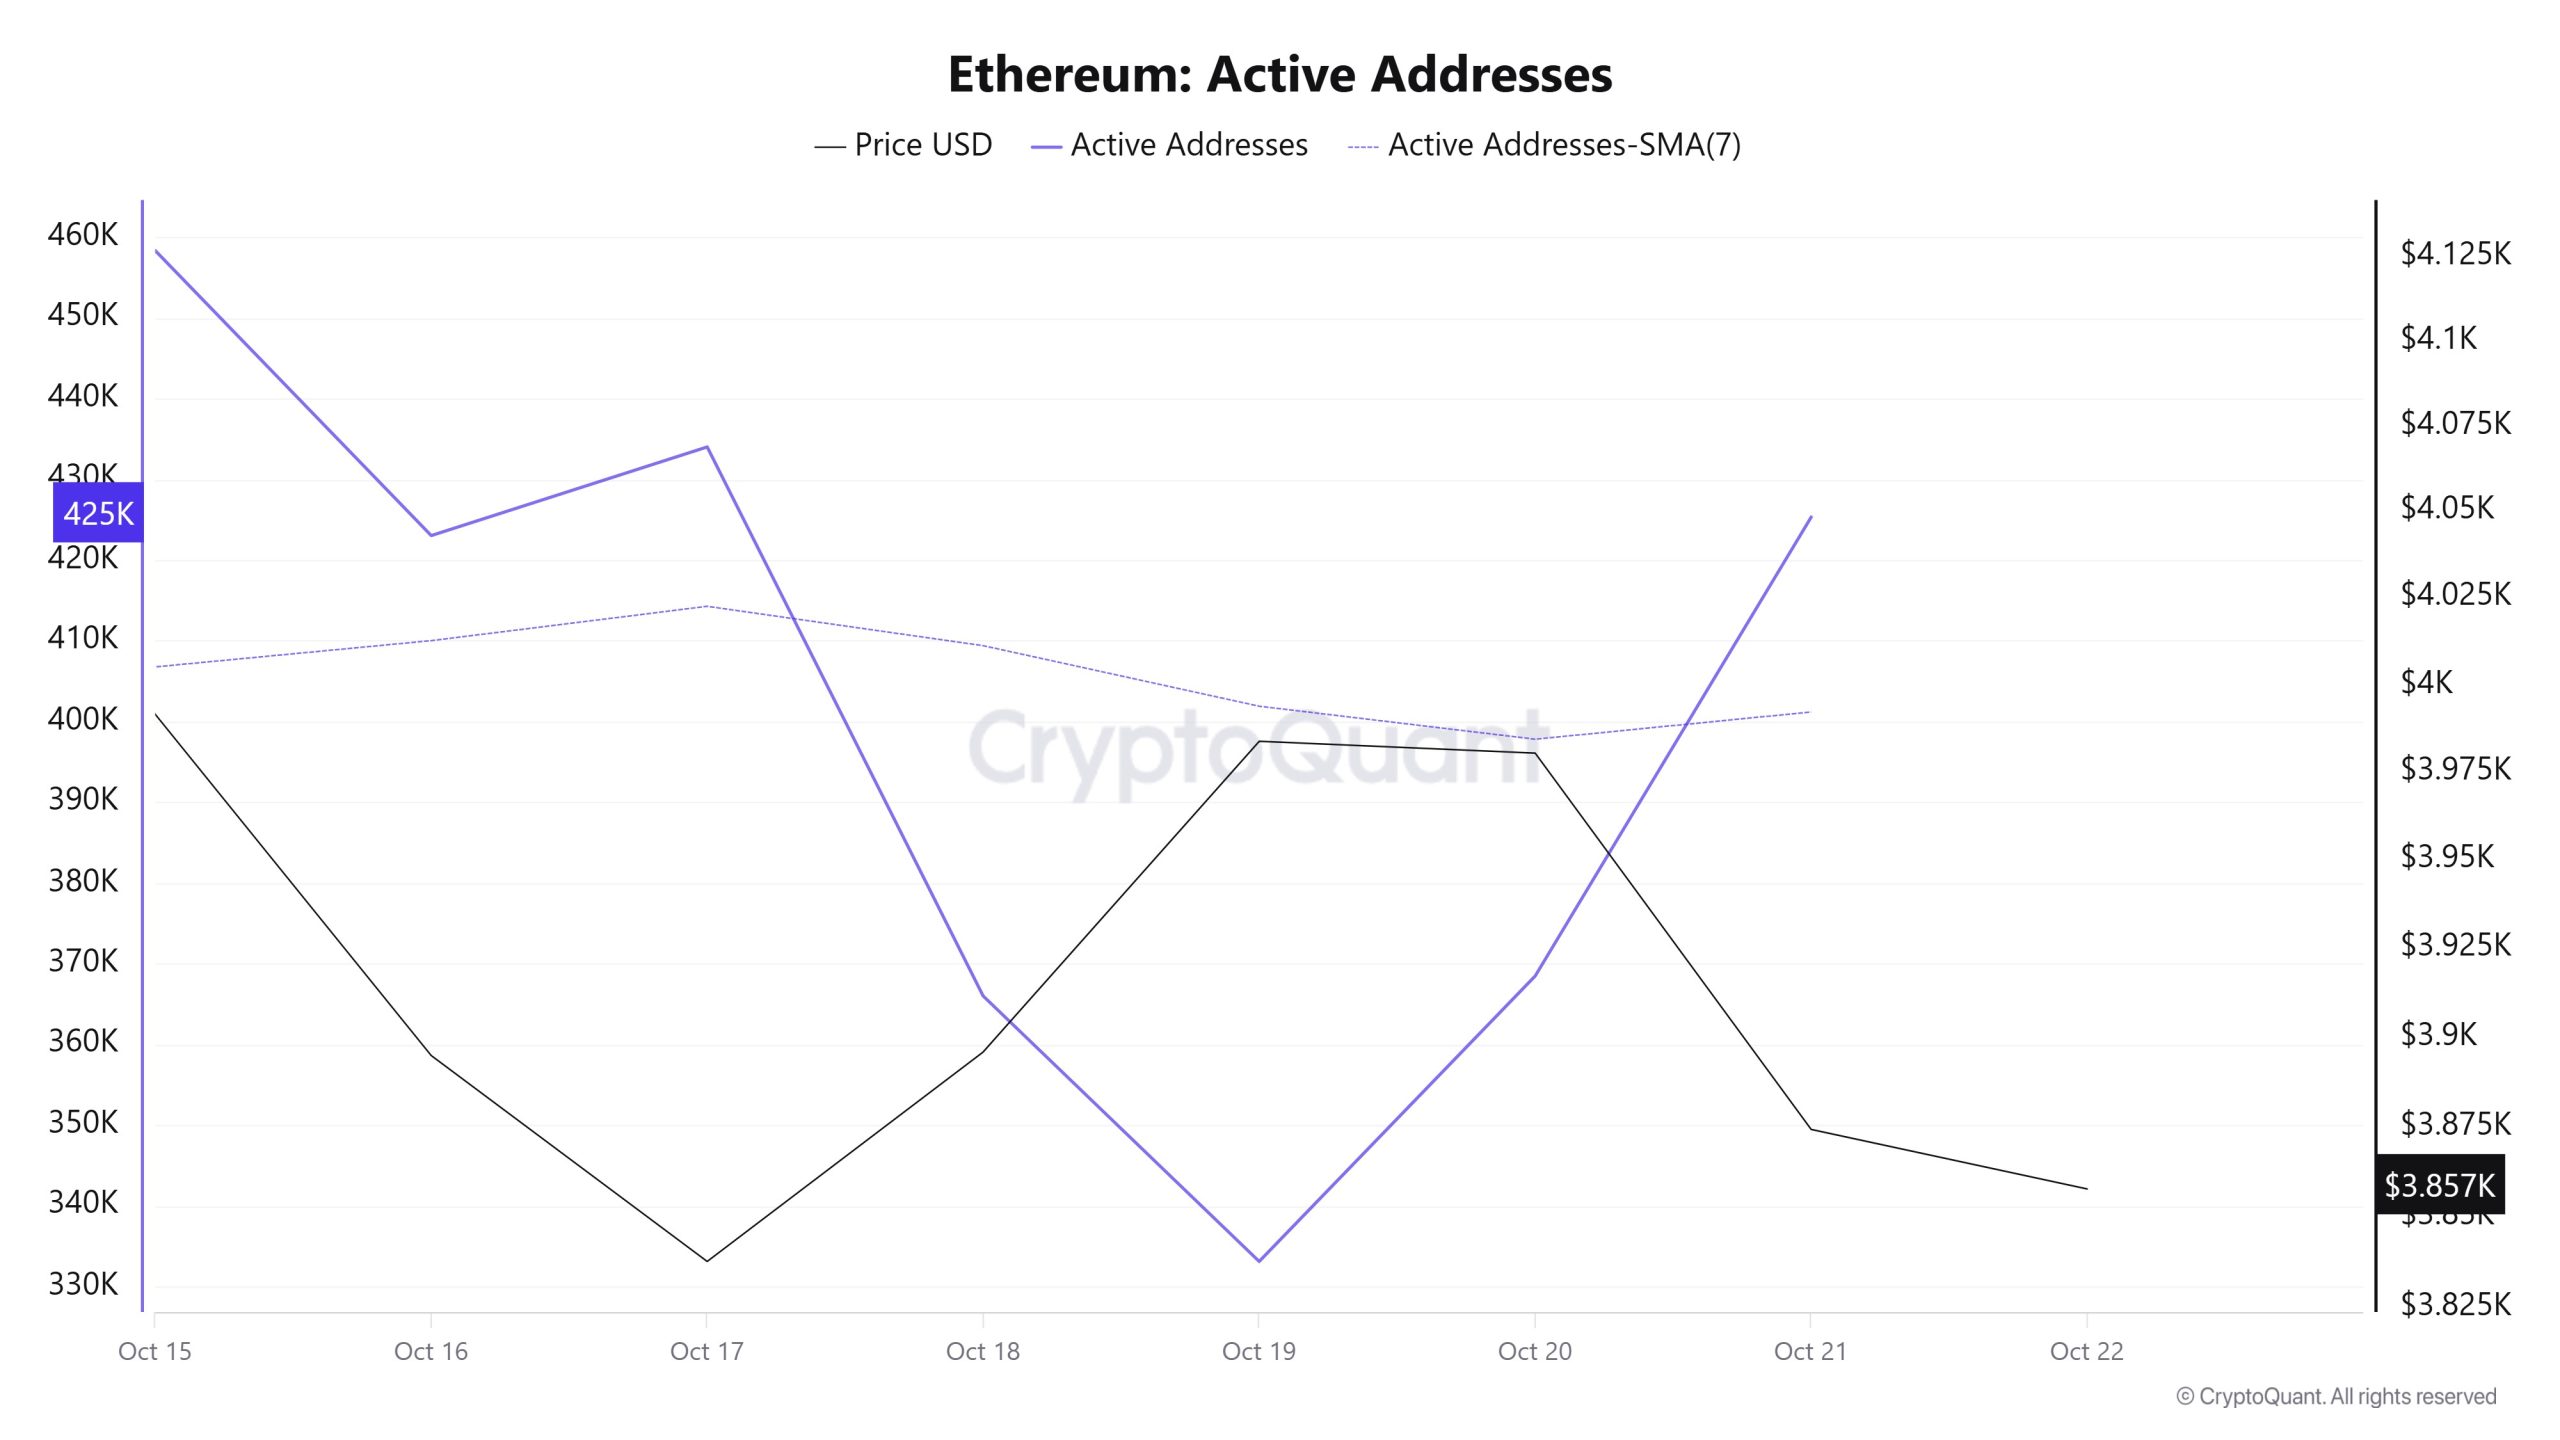
Between October 15 and October 22, a total of 458,318 active addresses were added to the Ethereum network. During this period, the Ethereum price fell from $3,991 to $3,849. On October 18, in particular, when the price hit the active address point, the number of active addresses declined, while the price rebounded. Looking at the 7-day simple moving average (SMA), the Ethereum price is generally trending upward.
Active Sending Addresses
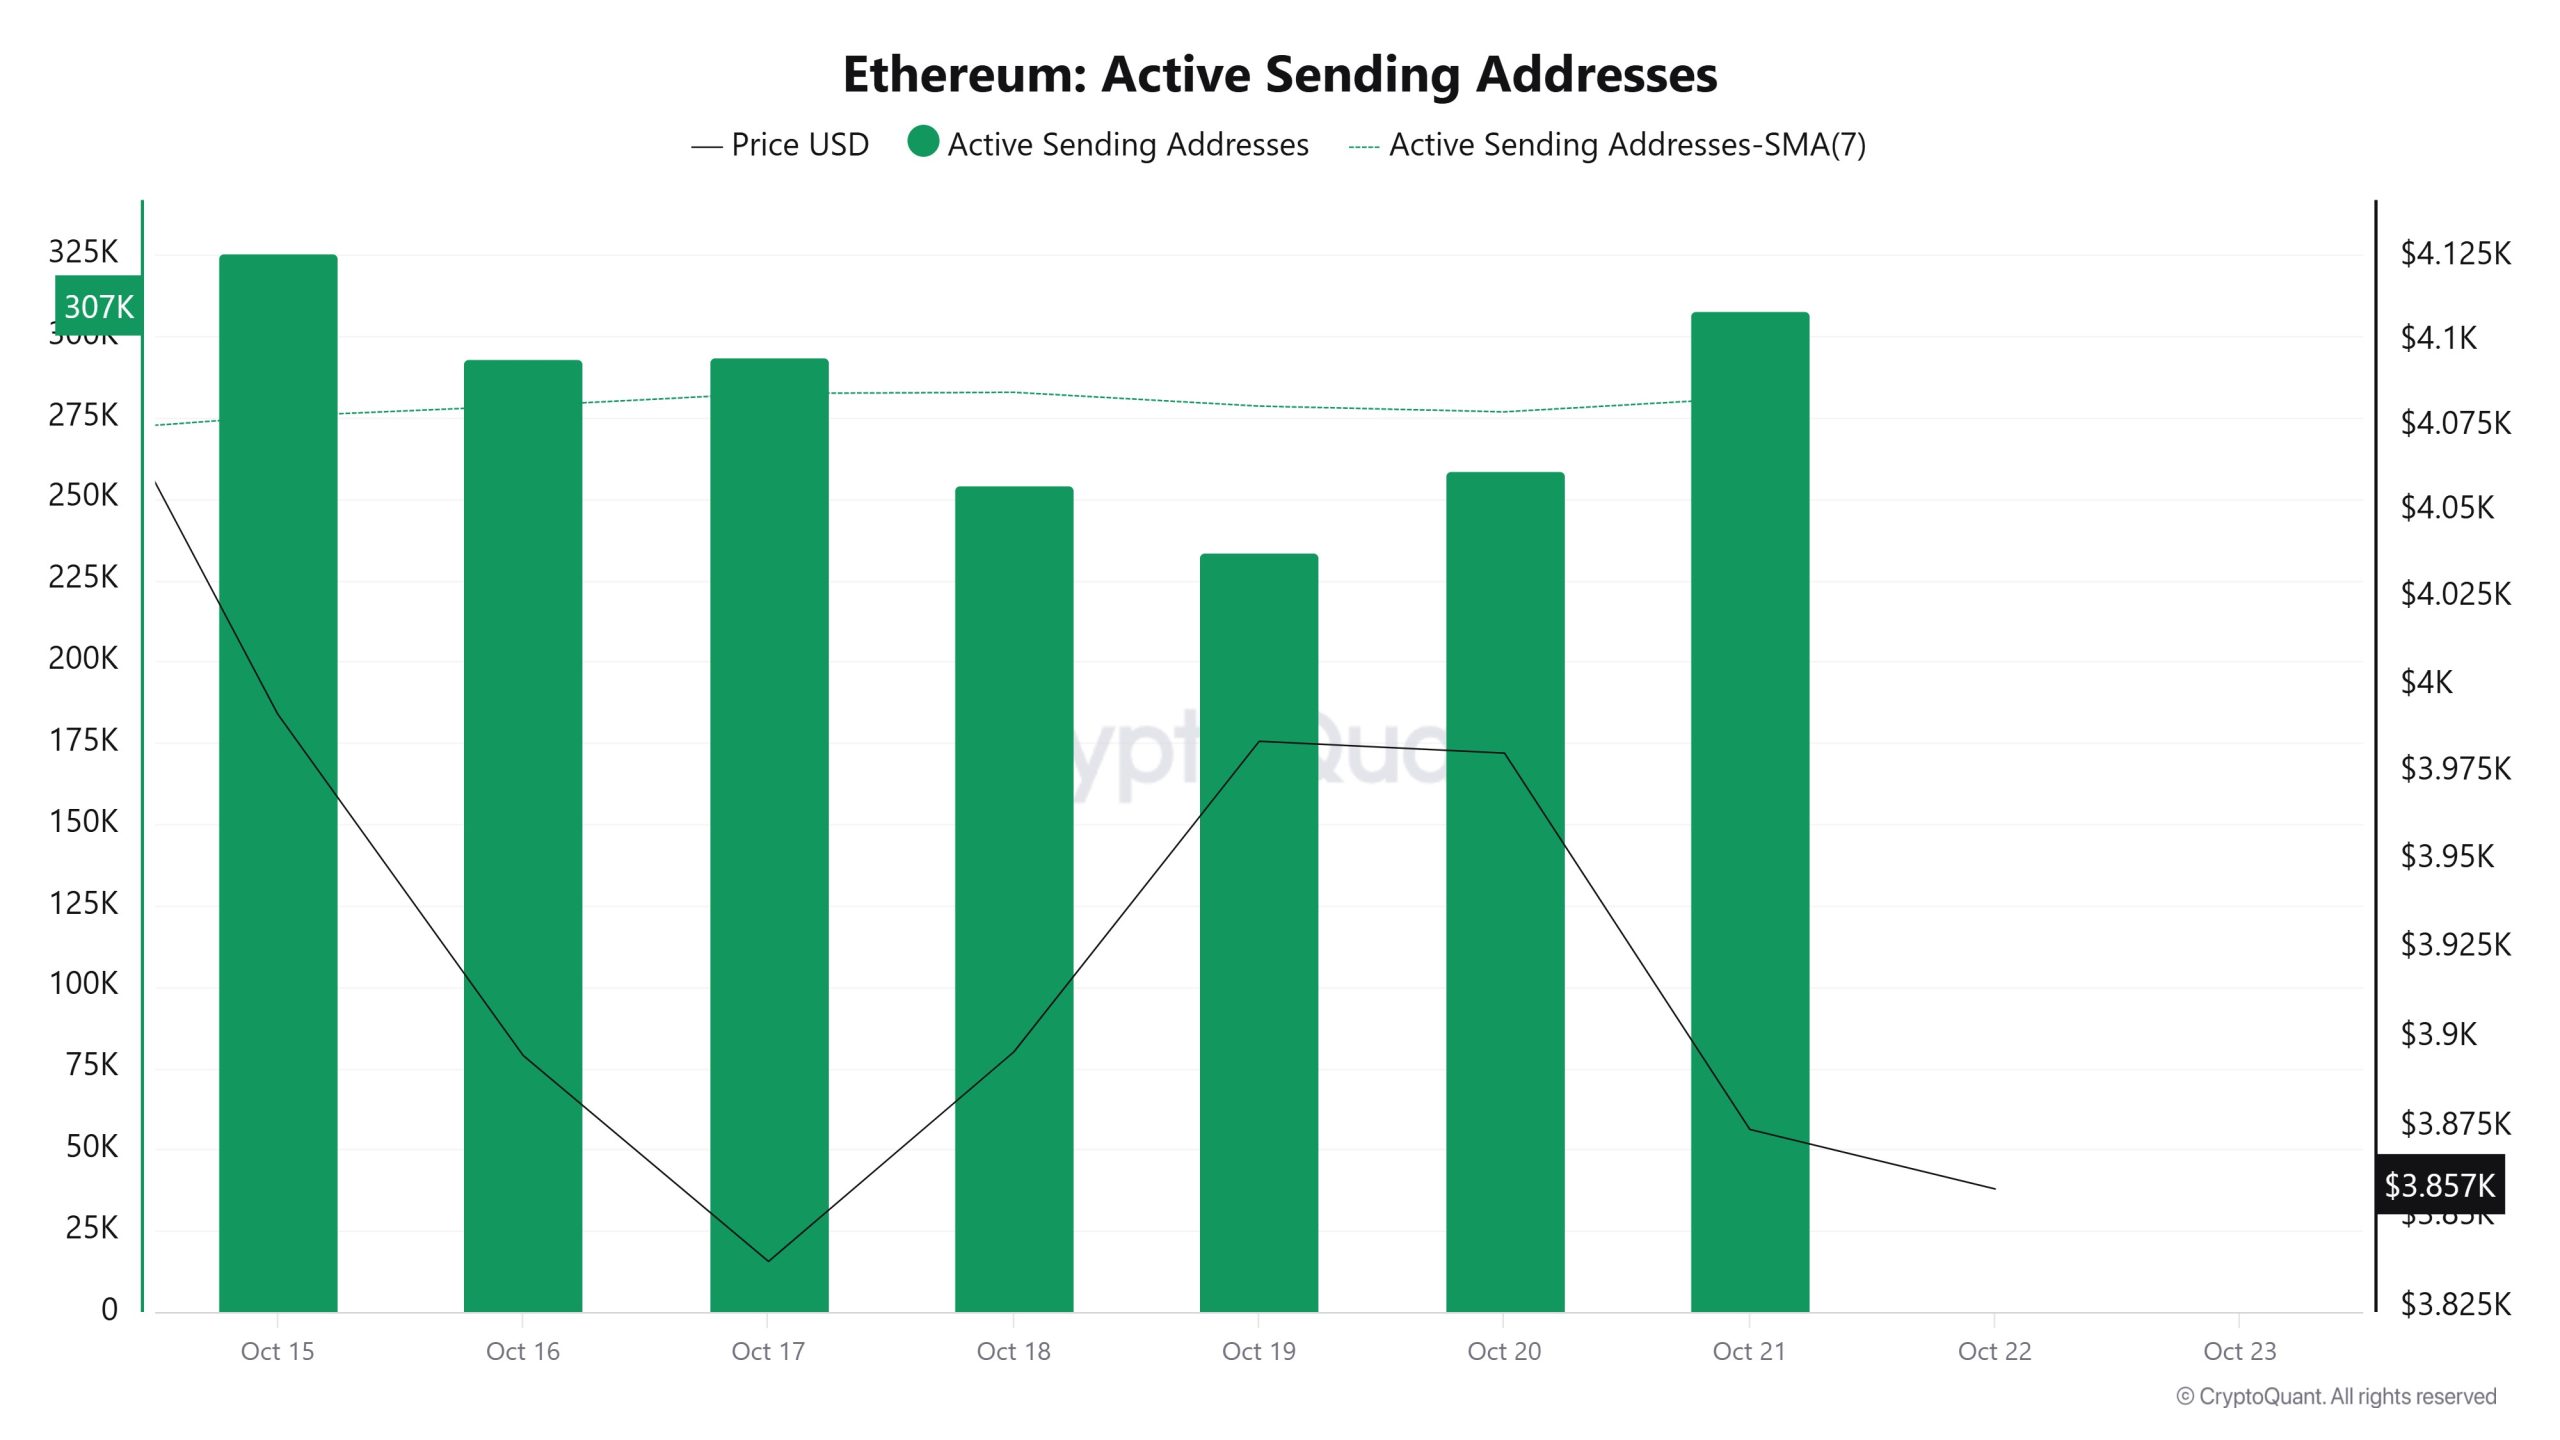
Between October 15 and October 22, high levels of active sending activity were observed in active sending addresses, along with the Black Line (price line). On the day the price reached its highest level on a weekly basis, active sending addresses reached 325,592.
Active Receiving Addresses
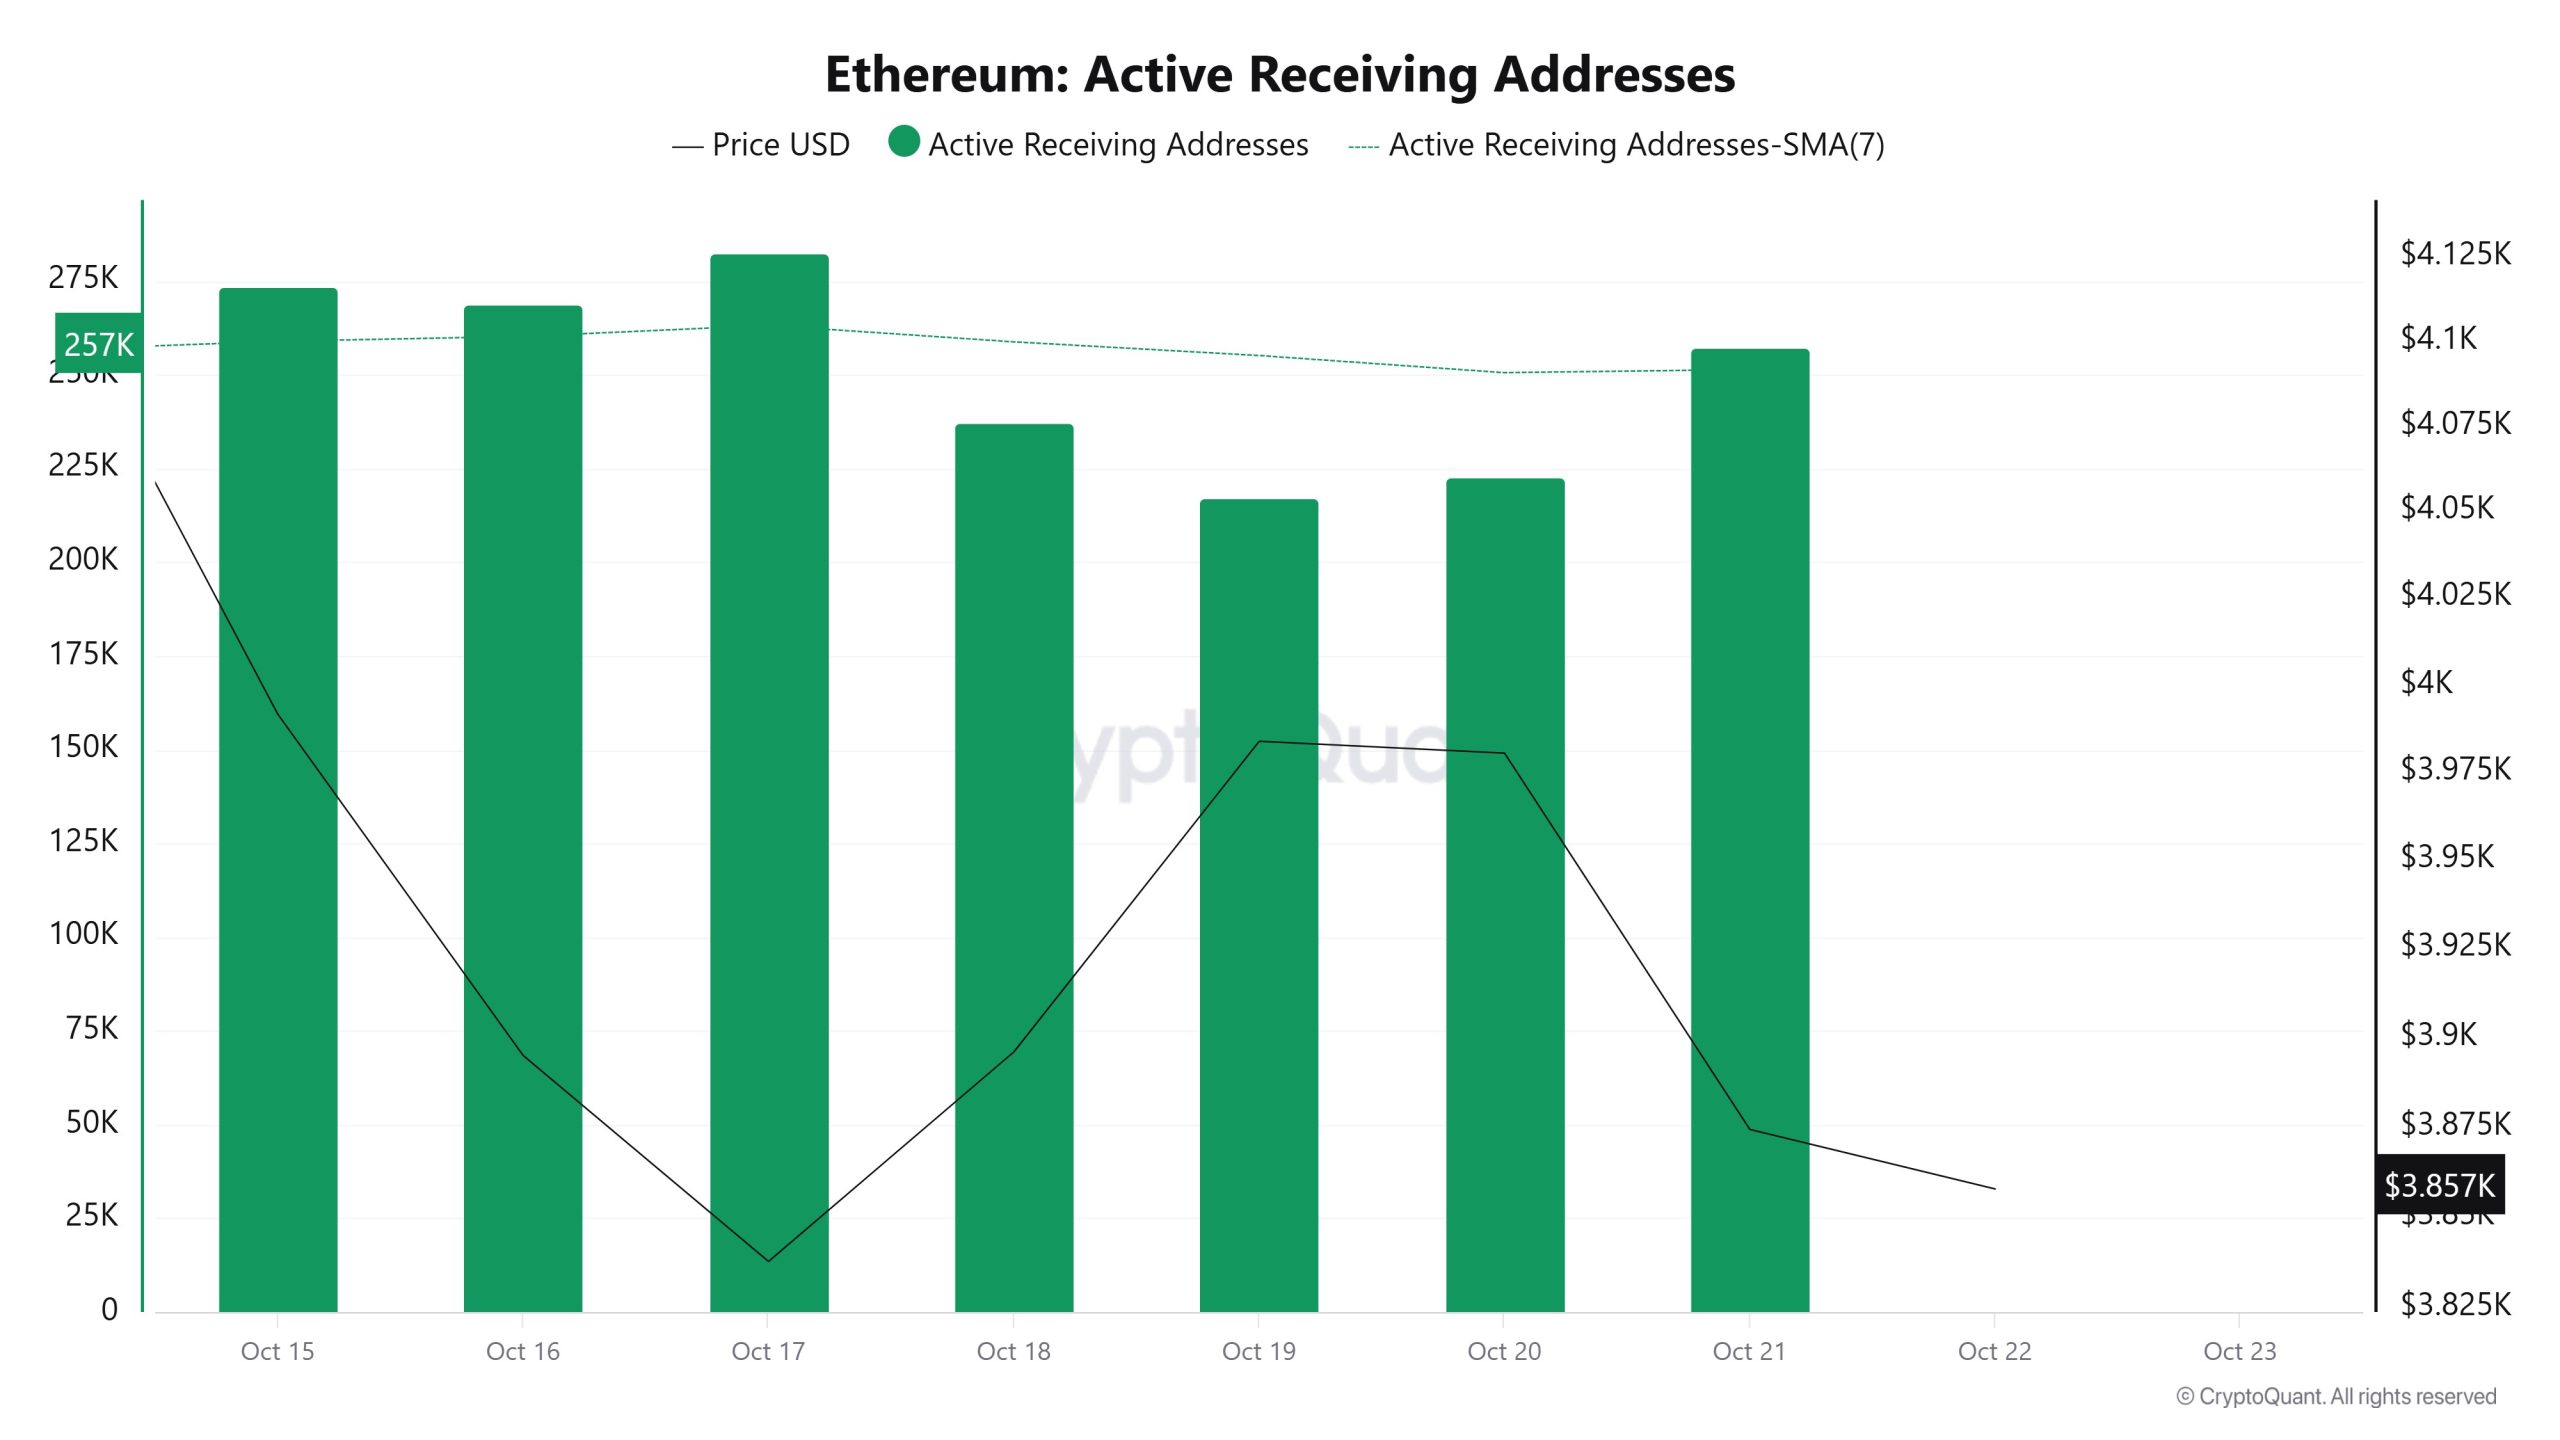
Between October 15 and October 22, there was no significant increase in active receiving addresses, while the price consolidated downward. On the day the price reached its highest level, active receiving addresses rose to 282,477, indicating an increase in purchases.
Total Value Staked
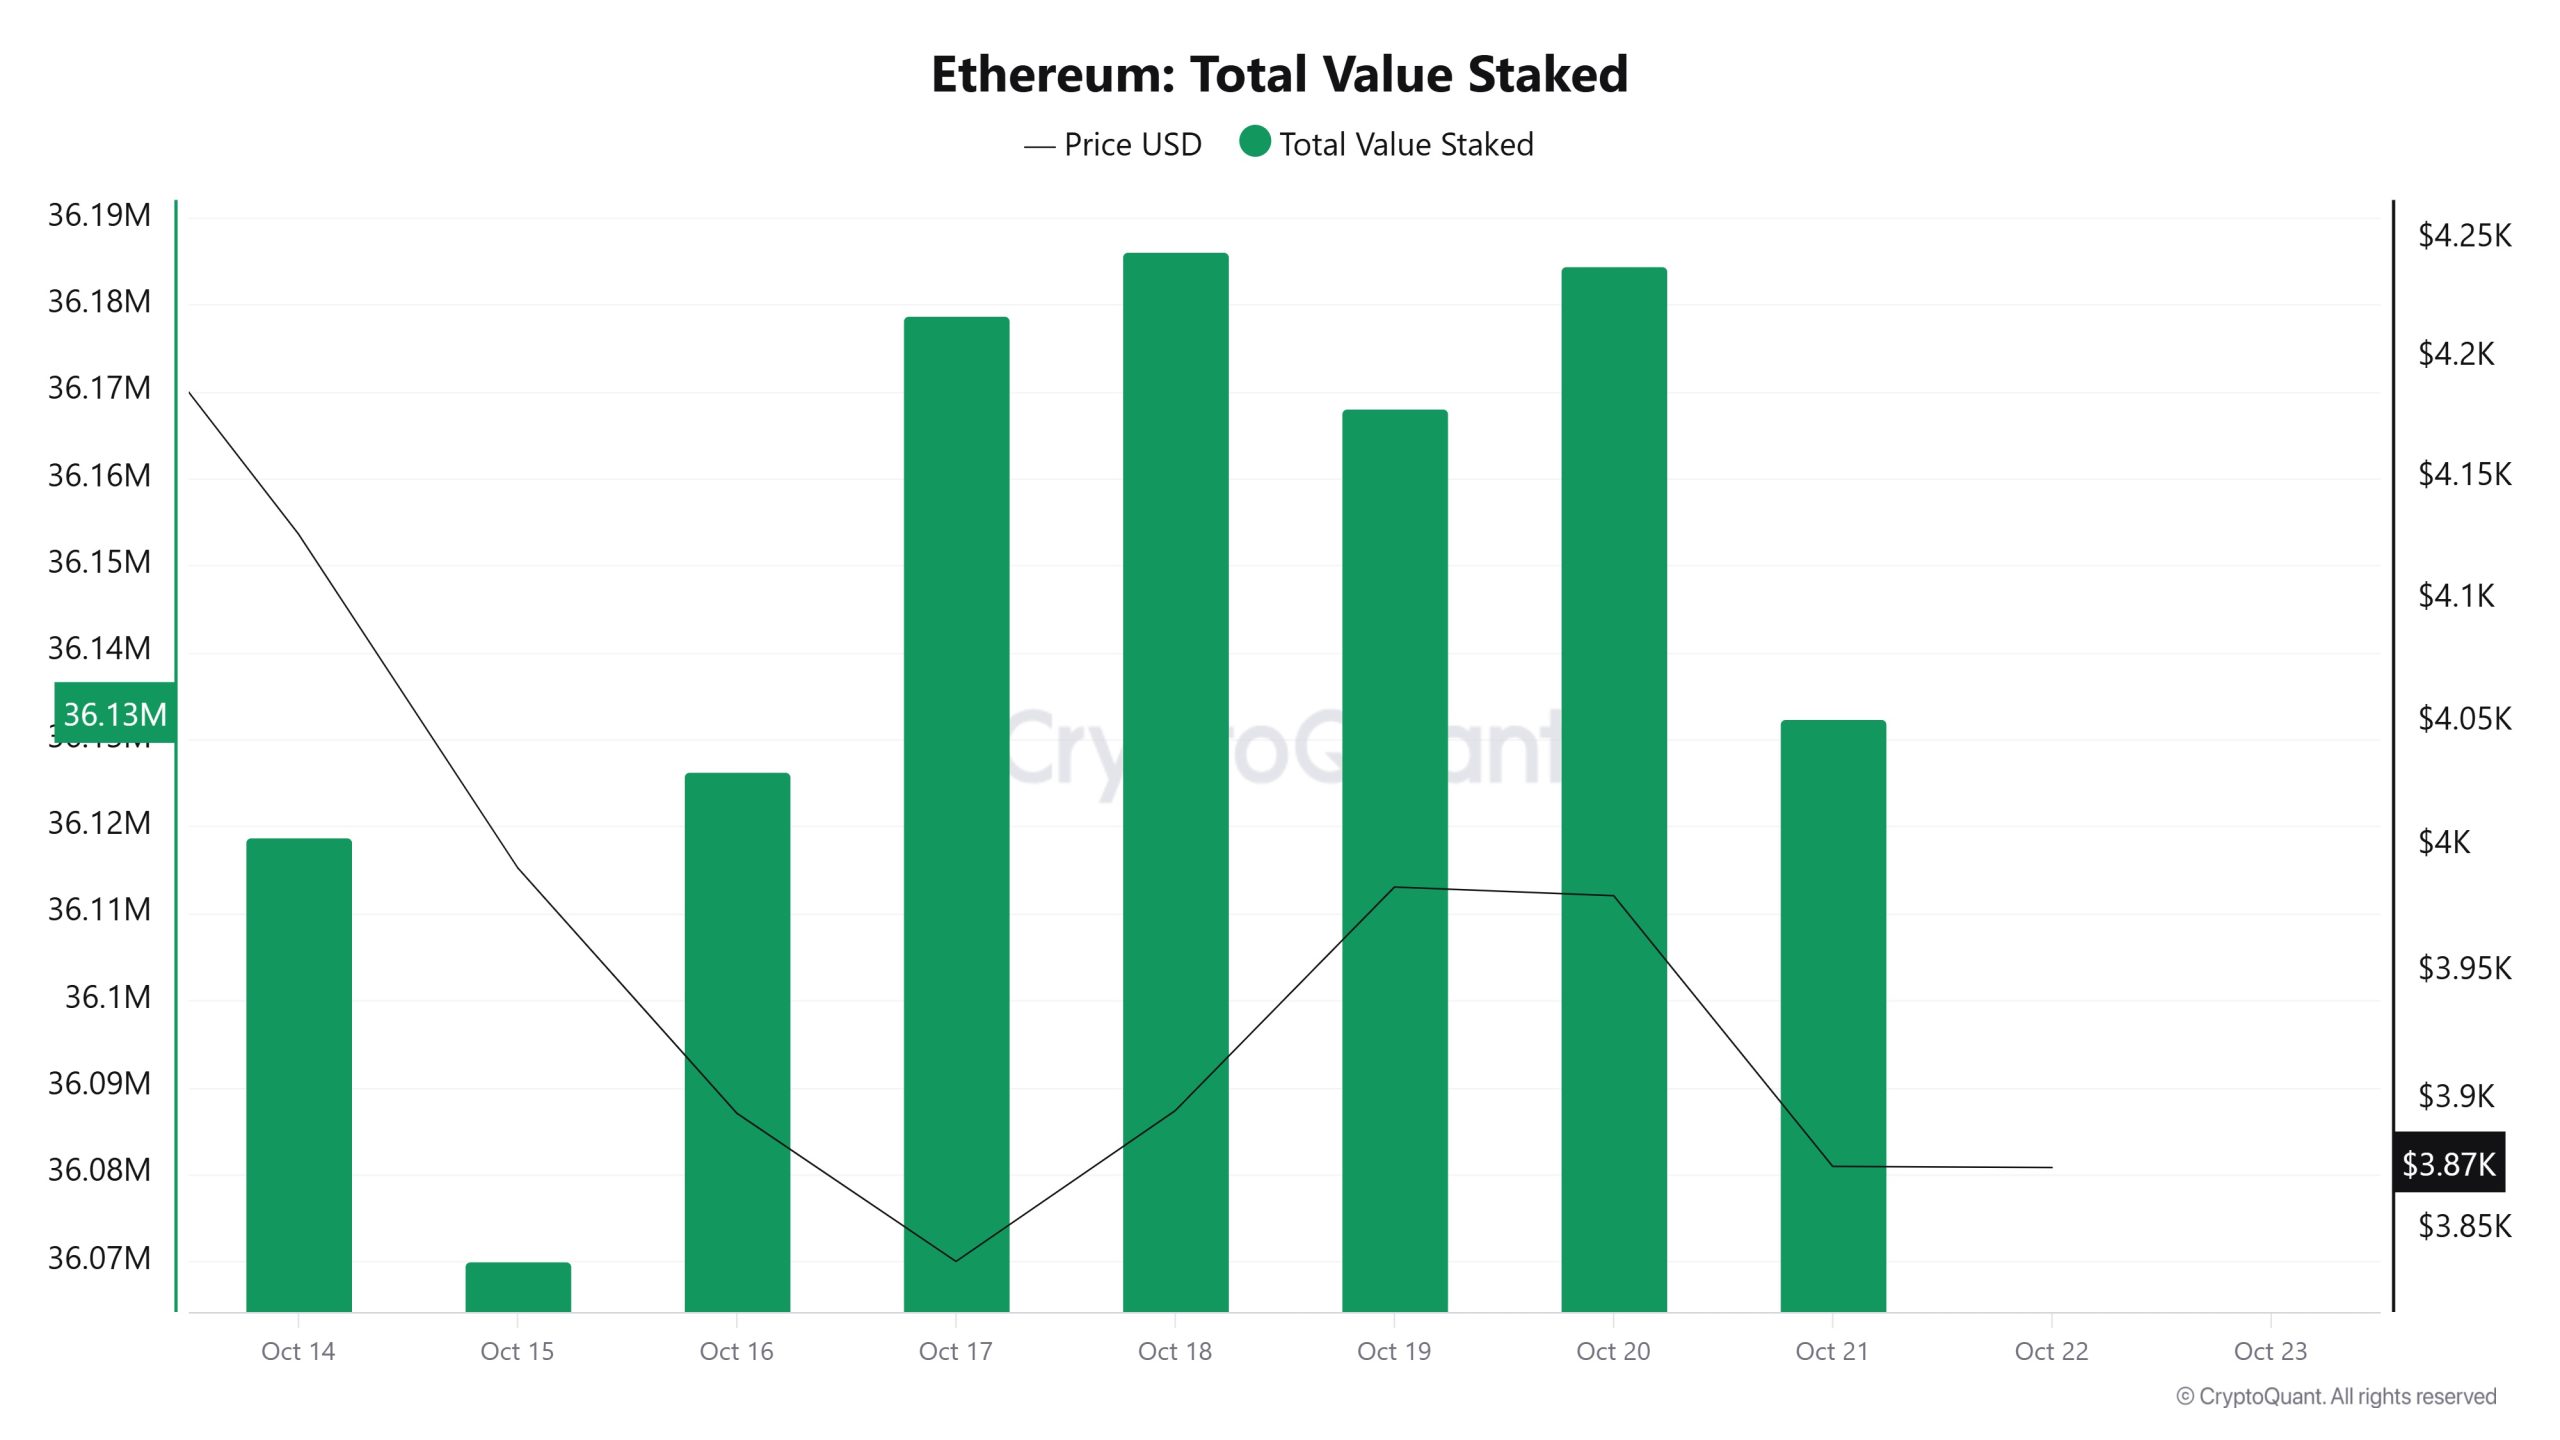
On October 15, while the ETH price was trading at $3,991, the Total Value Staked was at 36,069,999. As of October 21, the ETH price fell to $3,874, recording a 2.93% decline, while Total Value Staked rose to 36,132,426, recording a 0.17% increase.
Staking Inflows
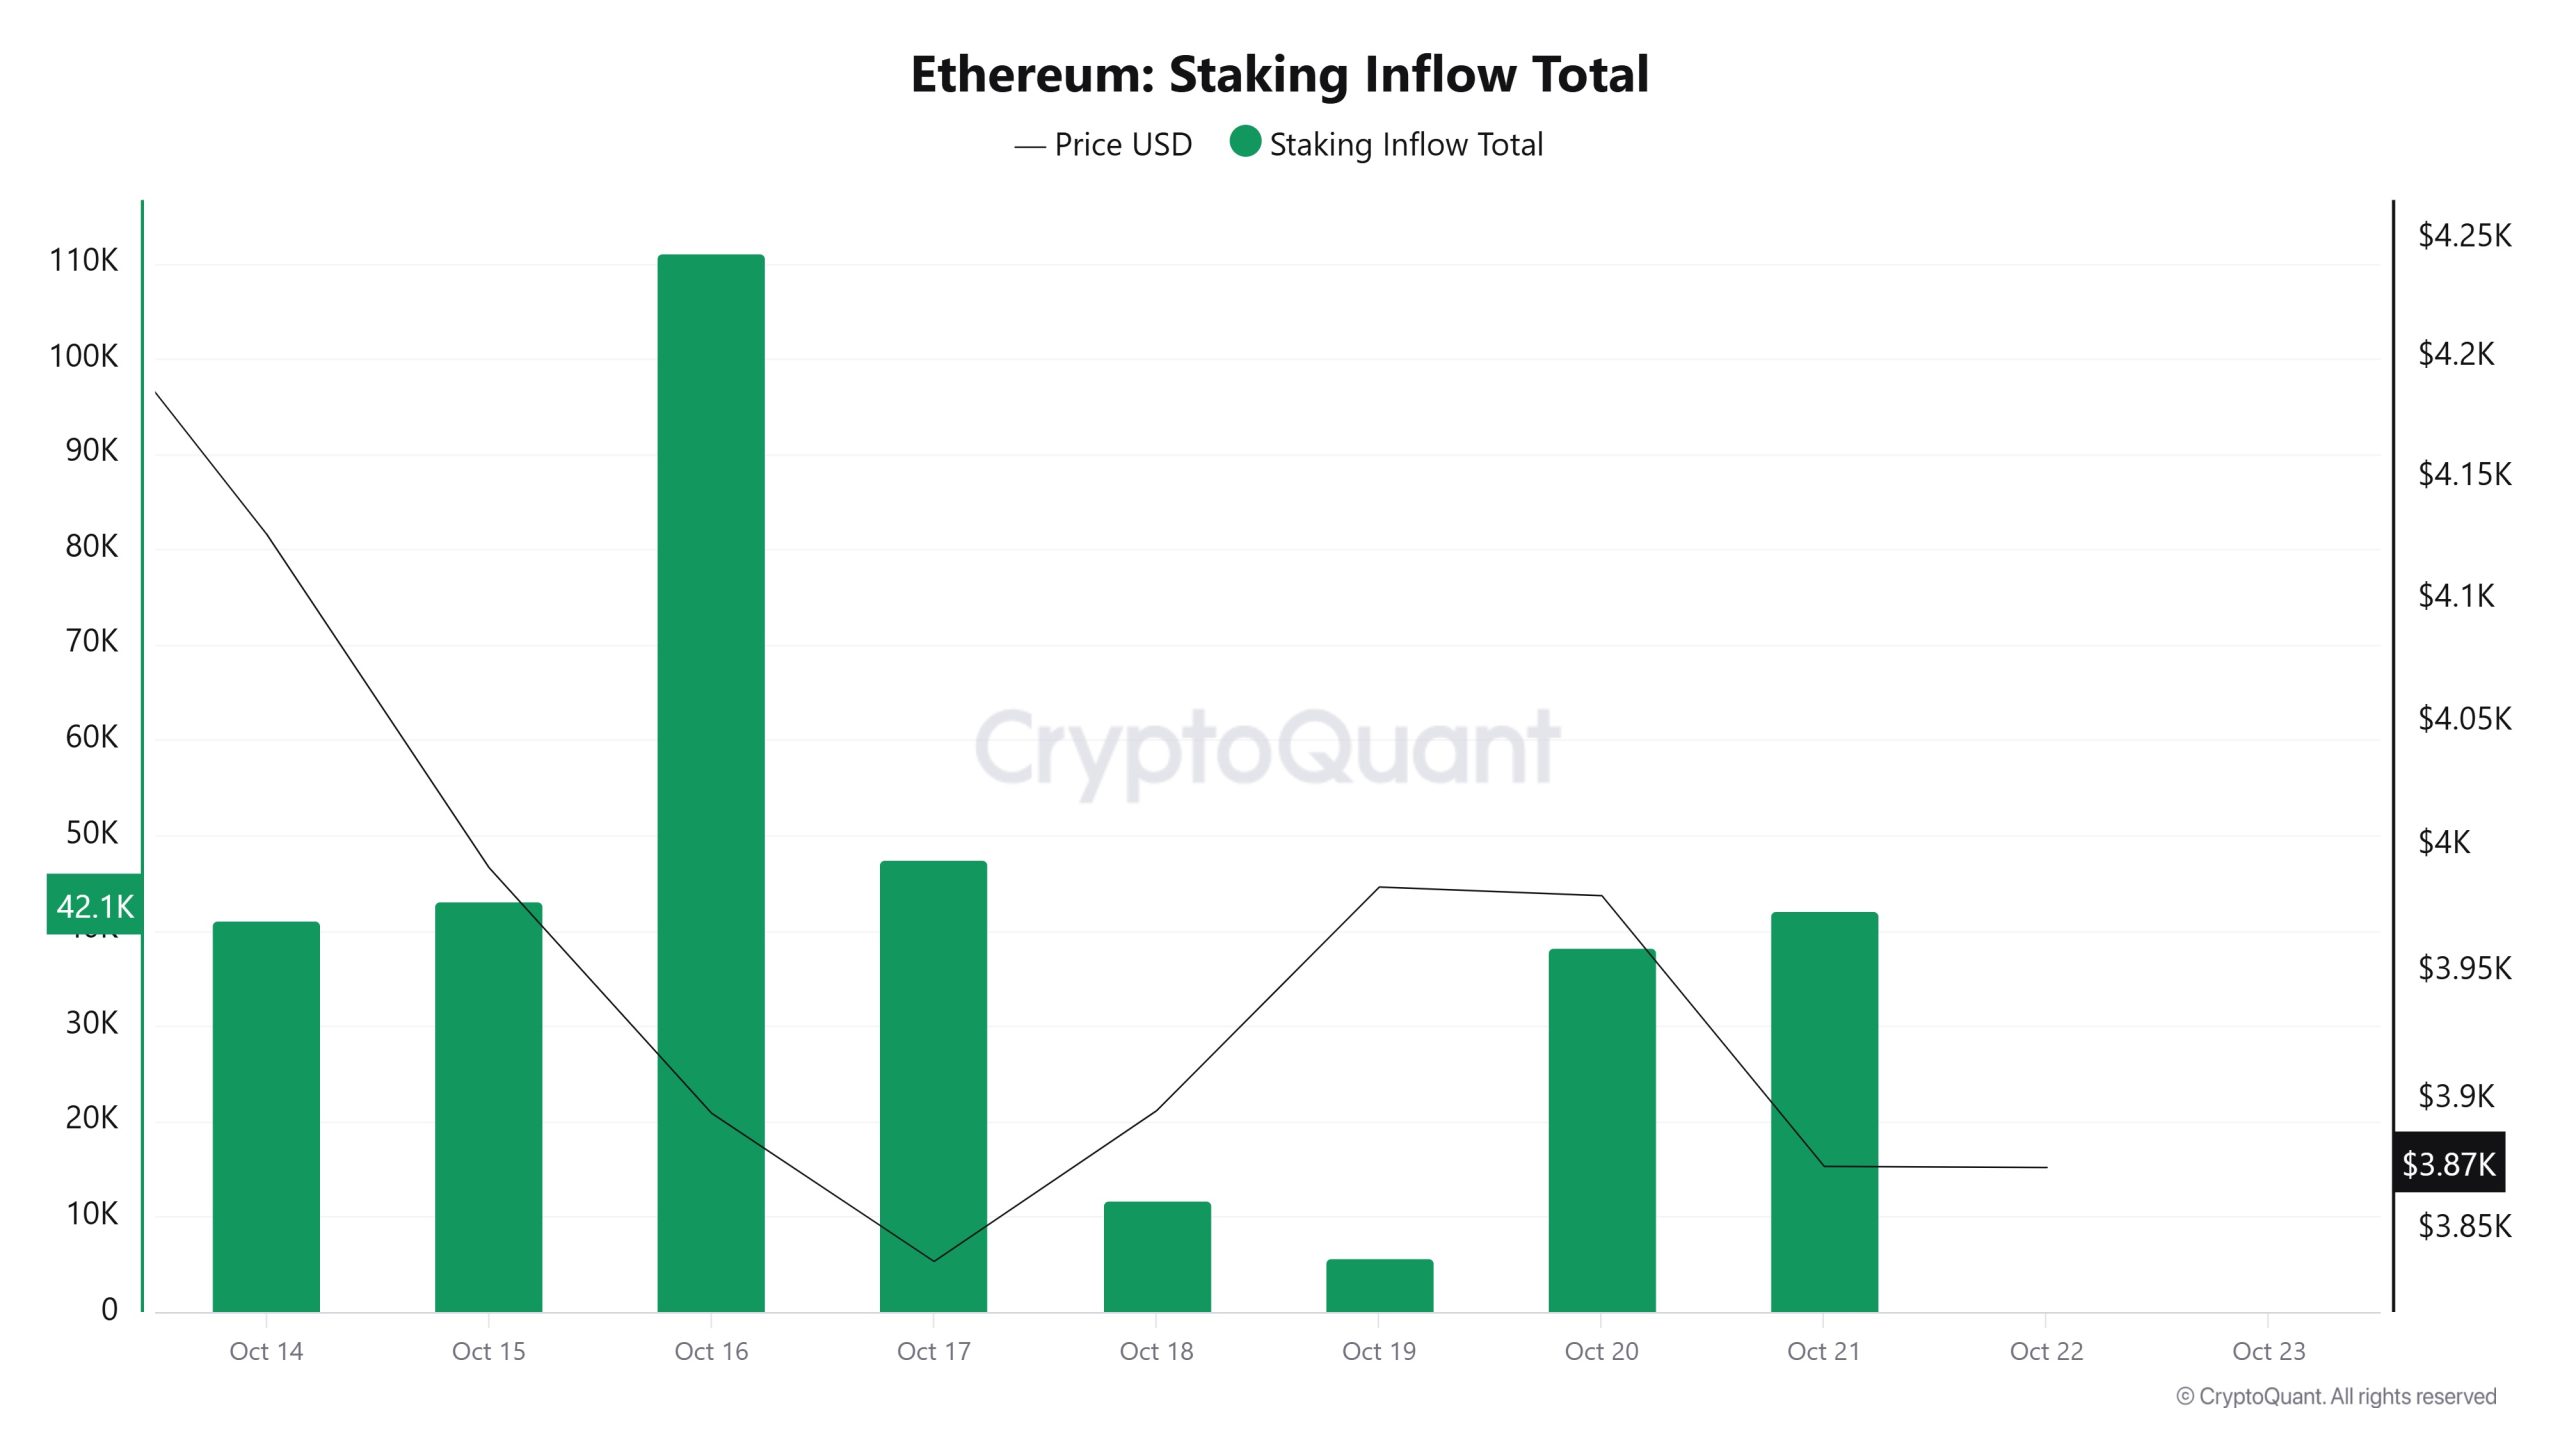
On October 15, while the ETH price was trading at $3,991, Staking Inflow stood at 43,085. As of October 21, the ETH price fell to $3,874, while Staking Inflow dropped to 42,197, recording a 2.06% decrease.
Derivatives
Open Interest
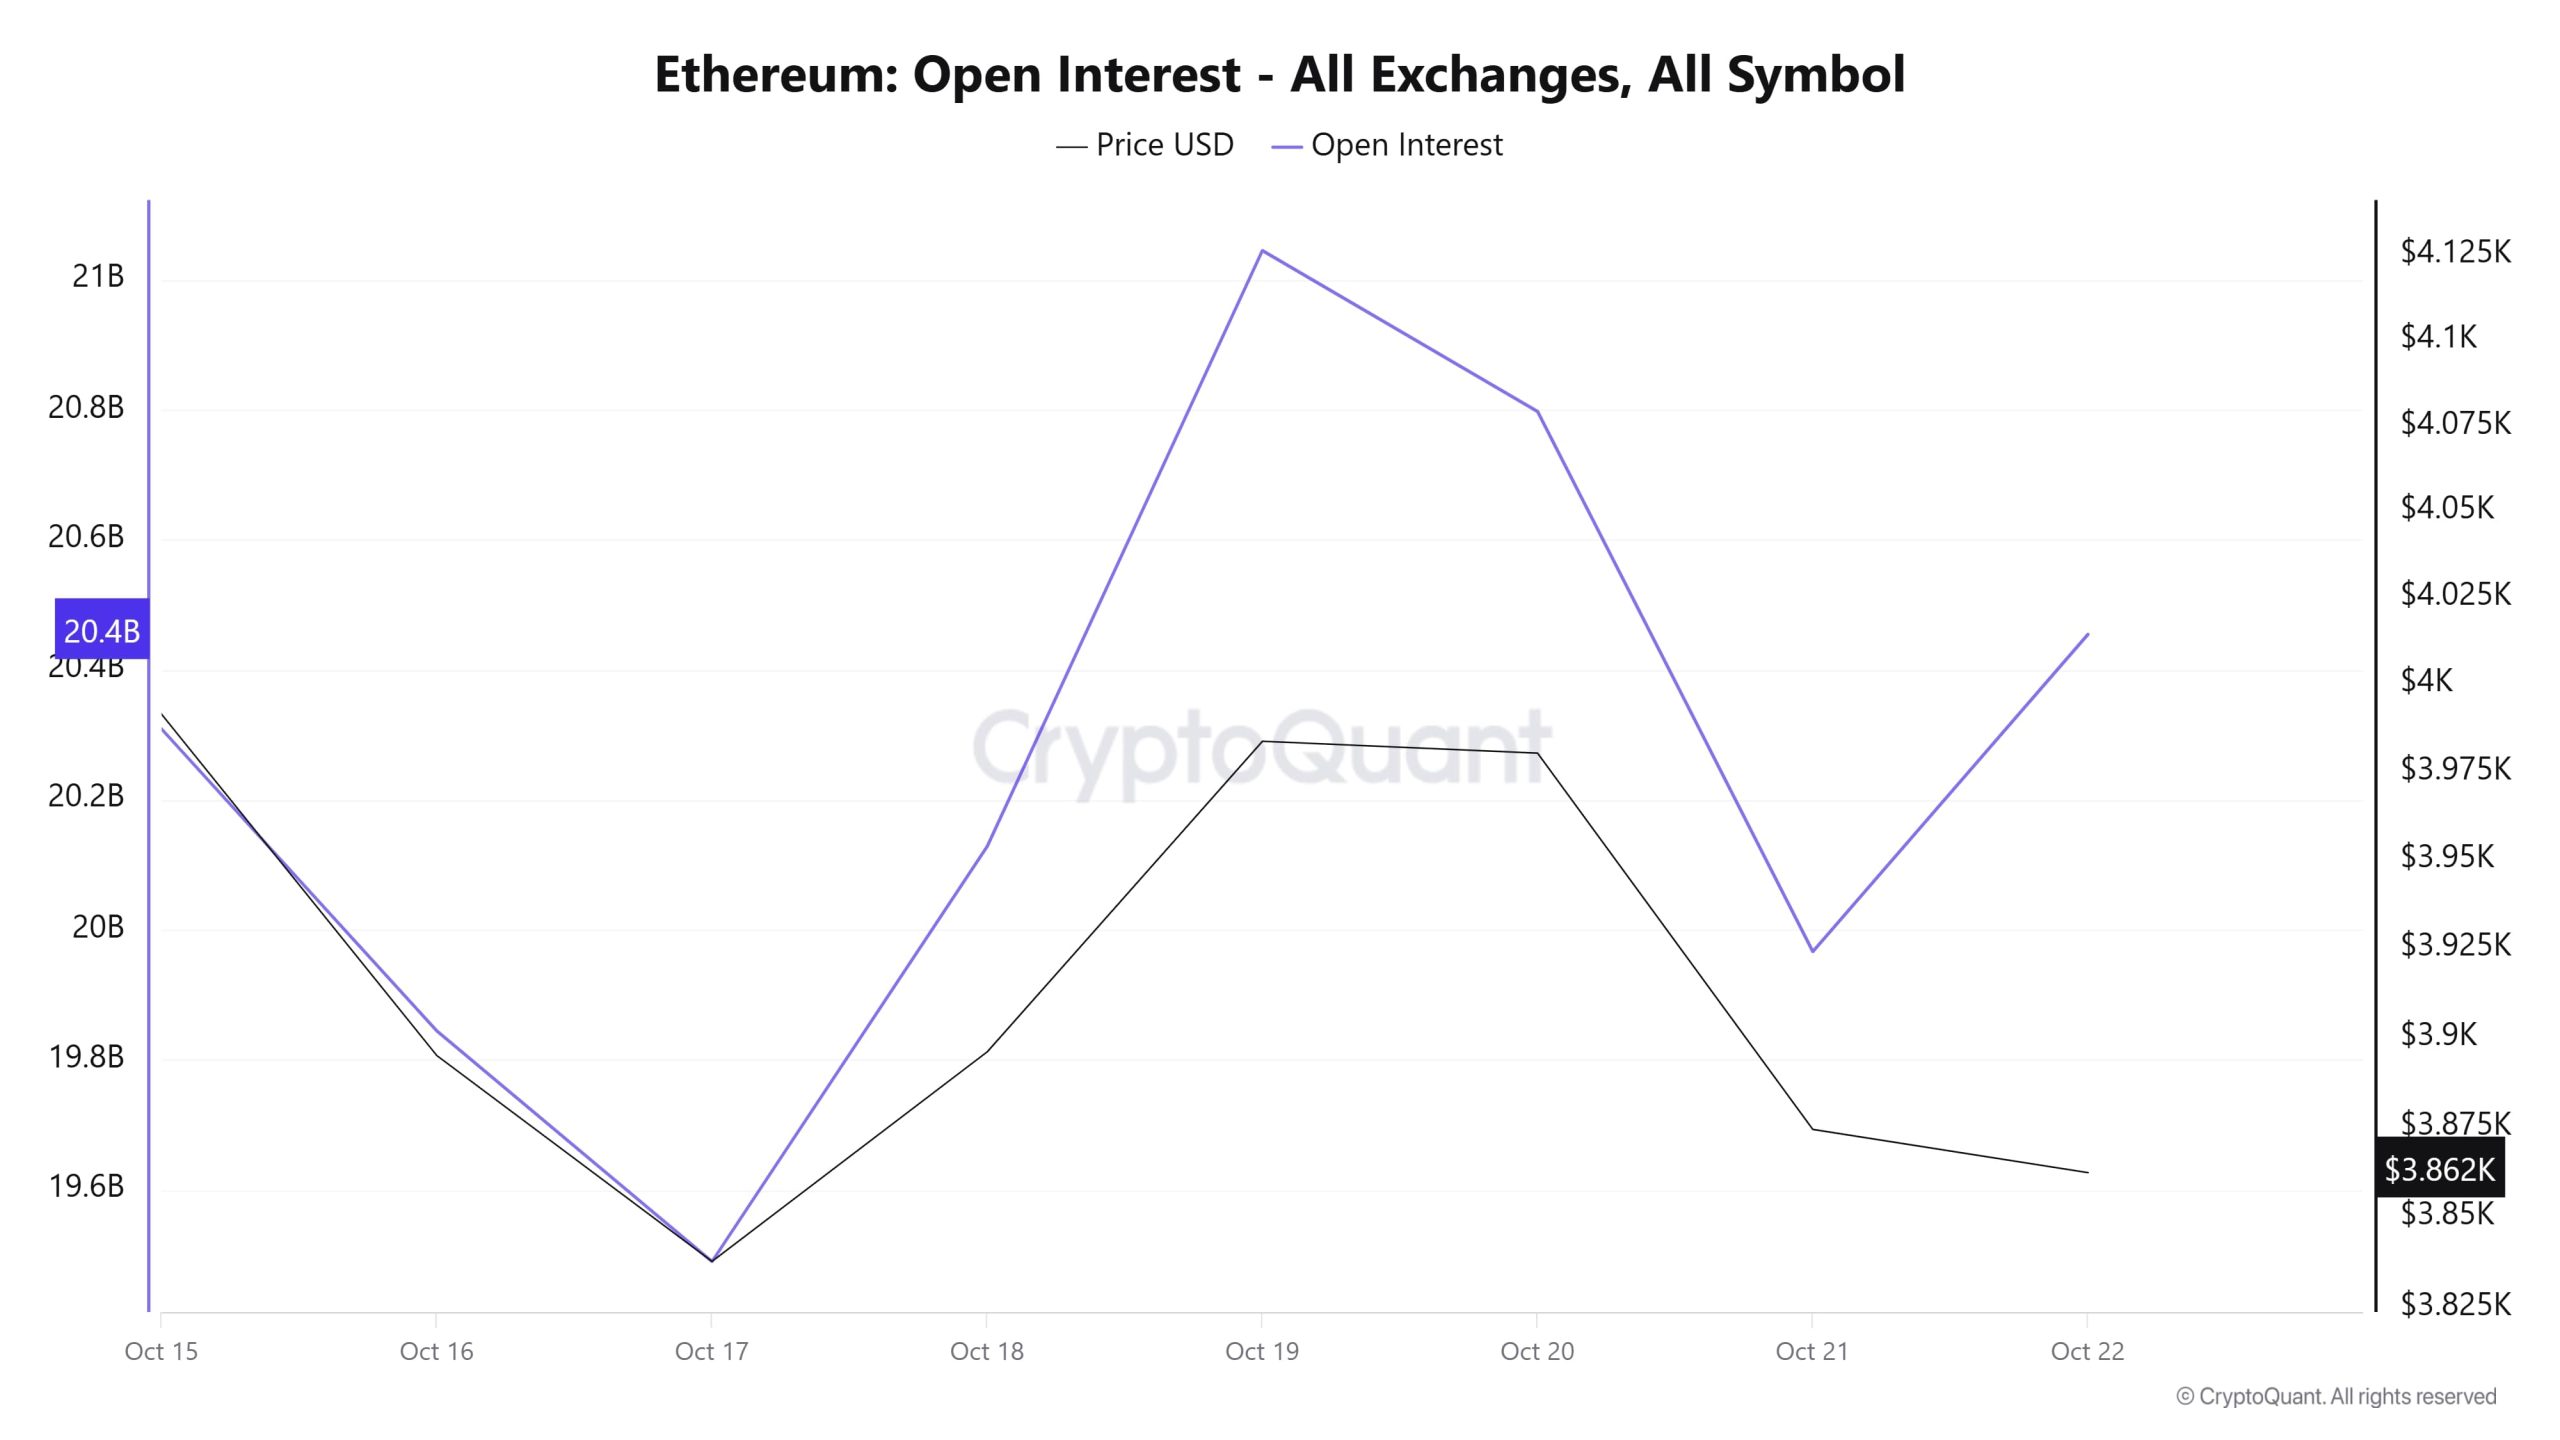
Looking at the graph, there has been a noticeable parallelism between Ethereum’s open interest and price in recent days. Between October 15–17, both indicators were on a downward trend. This indicates that the market experienced a short-term weakness. After October 17, the recovery process began, and by October 19–20, open interest rose to approximately $21 billion, while the price climbed to around $4,100.
The increase during this period indicates that investors are turning to long positions and that temporary optimism has emerged in the market. However, after October 21, both the price and open interest began to decline again, signaling profit-taking or position-closing movements. Although open interest recovered somewhat on October 22, the price remaining at the $3,862 level suggests that investors are maintaining a cautious stance.
Funding Rate
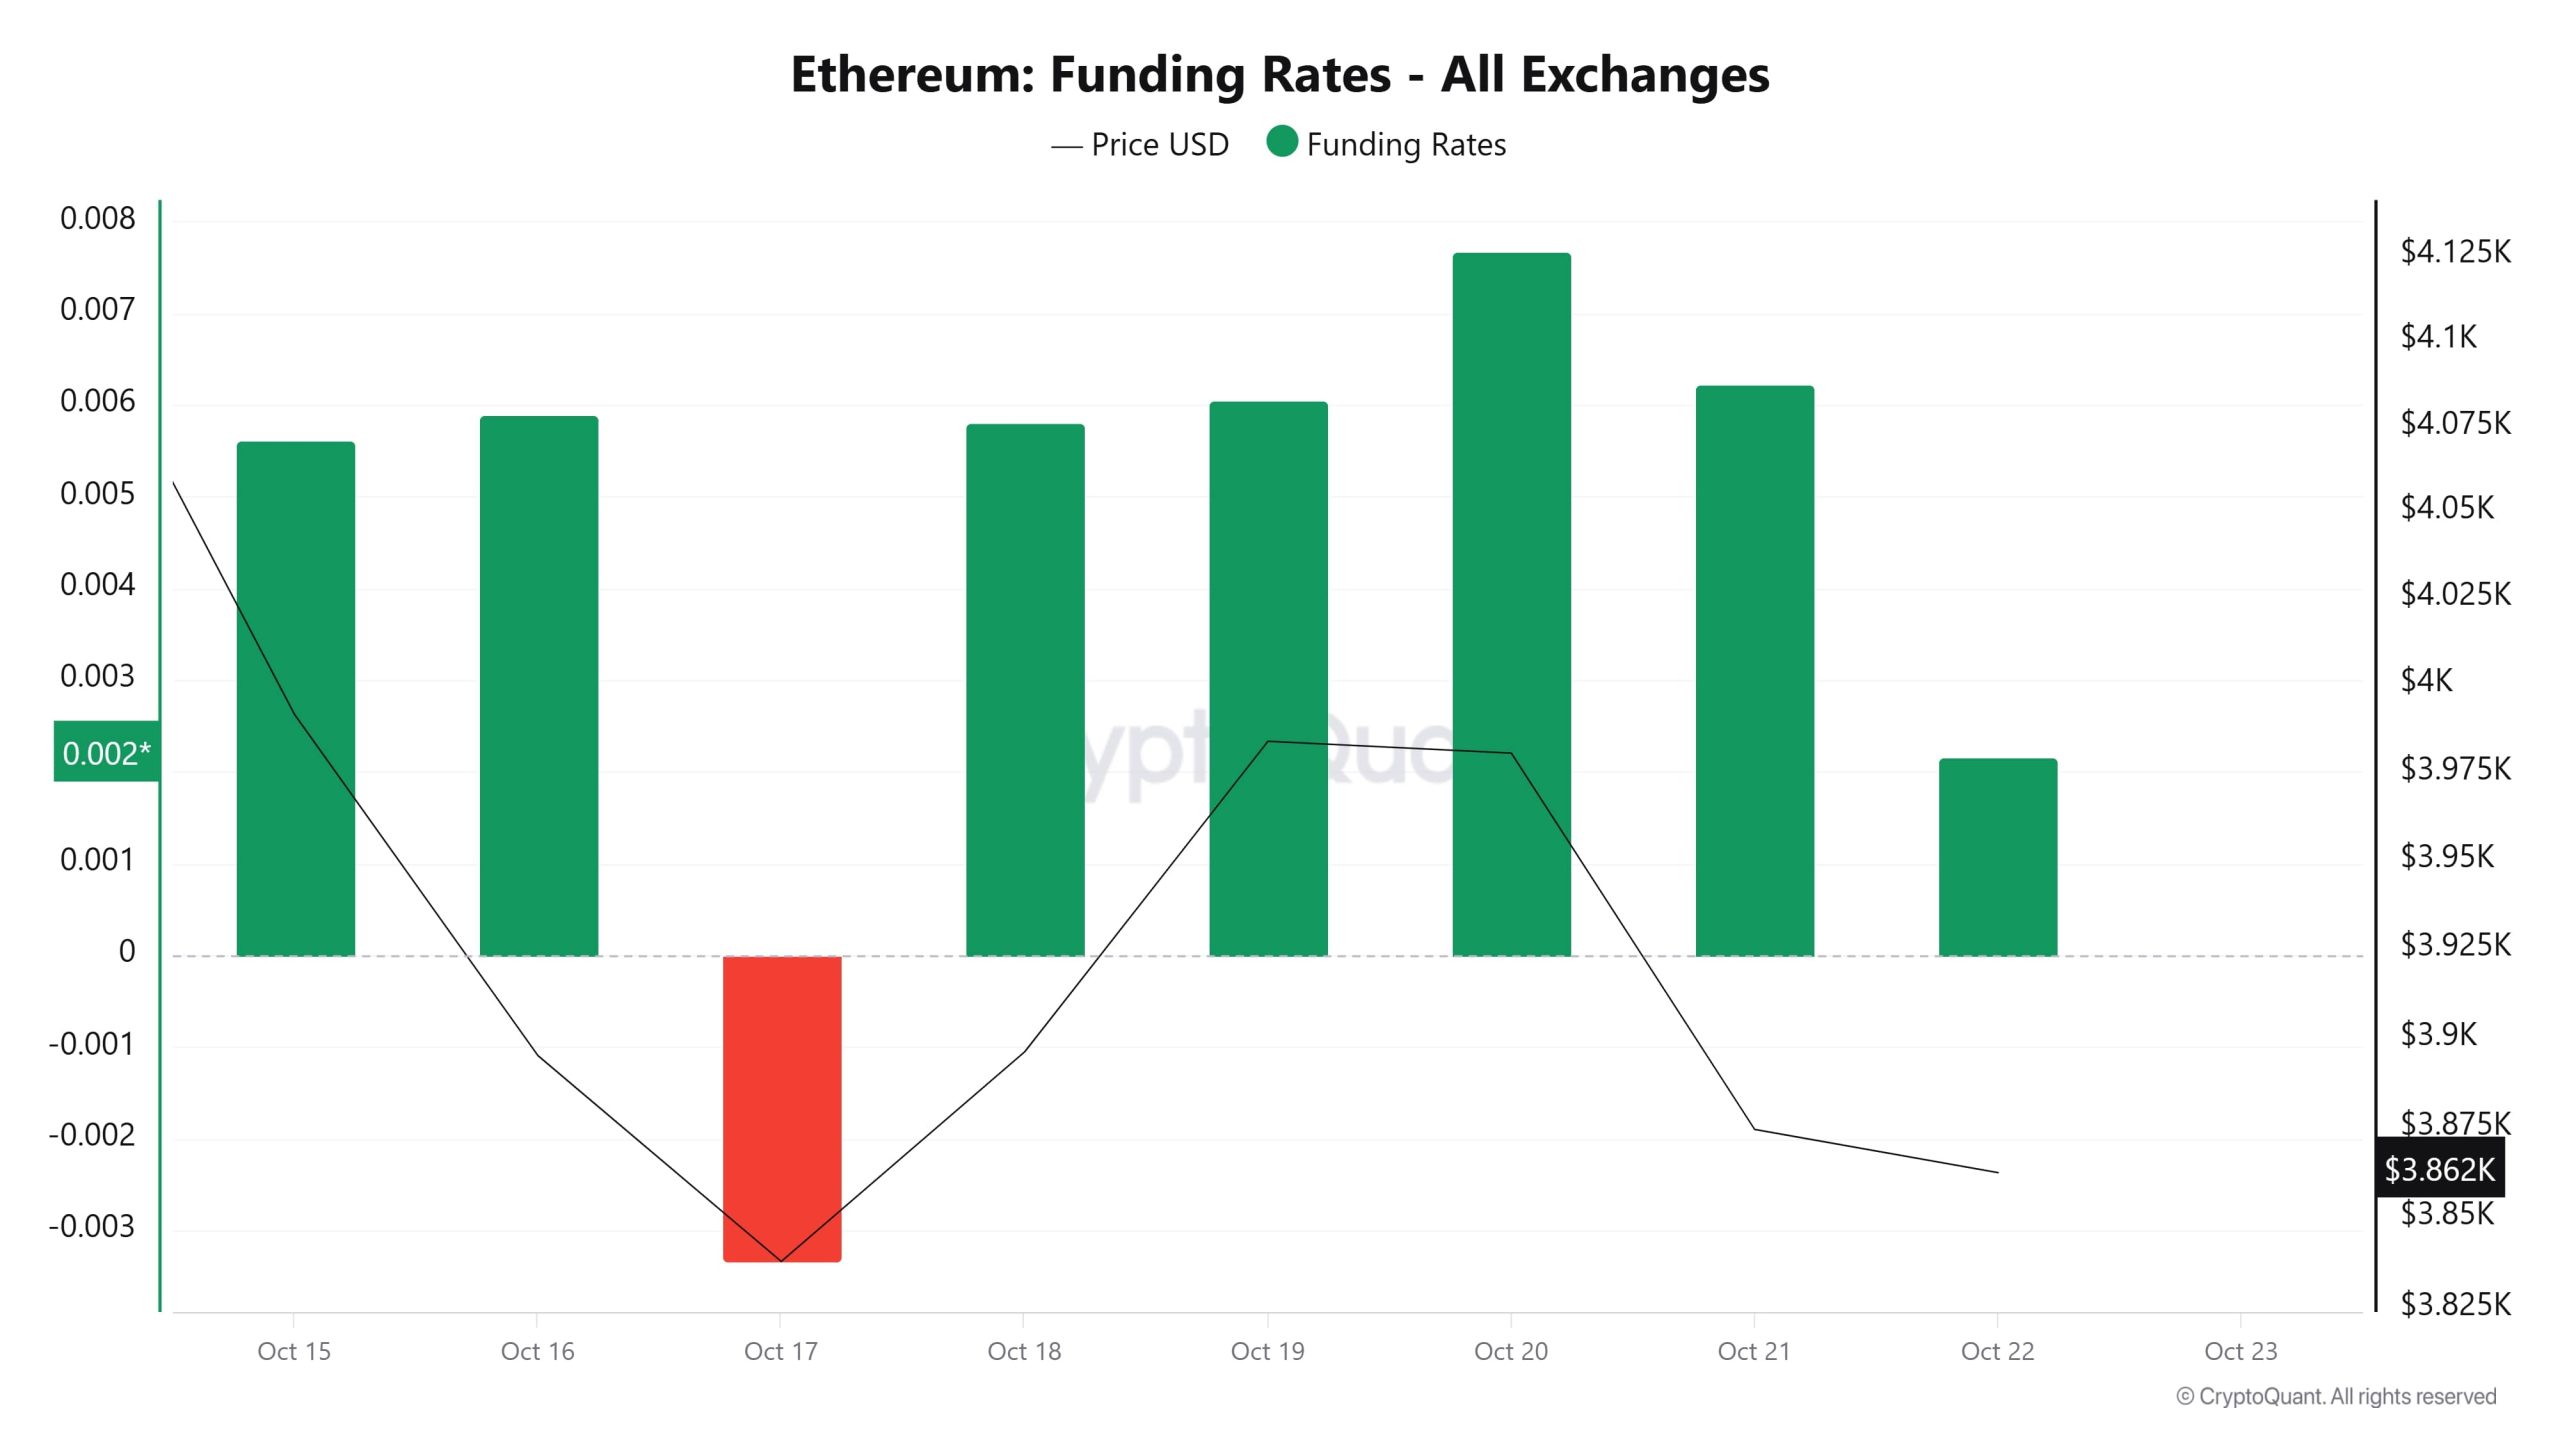
According to the chart, Ethereum’s funding rates have generally remained in positive territory since October 15, with only a brief dip into negative territory on October 17. During this dip, the price also appears to have fallen below $3,900. A negative funding rate indicates that short positions dominated the futures markets that day and that market participants had bearish expectations. However, this trend did not last long, as the rate returned to positive territory starting October 18 and remained positive throughout the week.
The funding rate remaining in positive territory indicates that long positions are gaining weight and that the market is generally trending toward buying. On the price front, although a recovery to around $4,000 was seen between October 19 and 21, ETH fell back to $3,862 as of October 22. This structure shows that long-term interest still persists in the futures market, but the price has lost momentum in the short term.
Long & Short Liquidations
Last week, amid a volatile market, $693 million worth of long positions were liquidated. During the same period, $575 million worth of short positions were also liquidated.
| Dates | Long Amount (Million $) | Short Amount (Million $) |
|---|---|---|
| October 15 | 99.69 | 47.75 |
| October 16 | 136.16 | 191.29 |
| October 17 | 196.70 | 121.92 |
| October 18 | 17.40 | 25.61 |
| October 19 | 28.87 | 62.69 |
| October 20 | 63.04 | 38.85 |
| October 21 | 151.79 | 87.02 |
| Total | 693.65 | 575.13 |
Supply Distribution
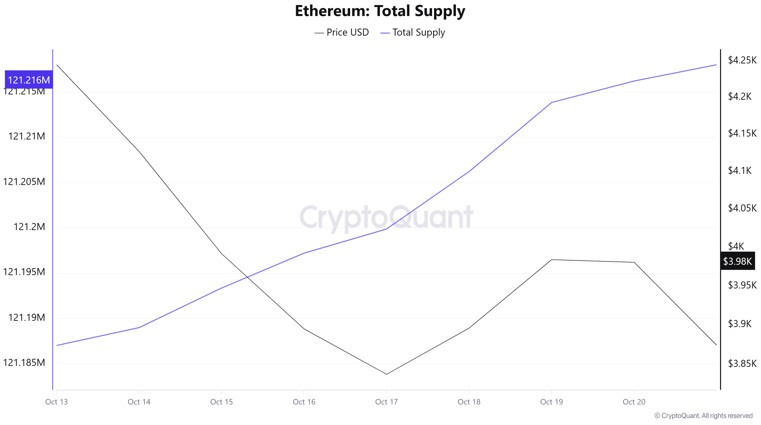
Total Supply: Reached 121,216,204 units, an increase of approximately 0.0241% compared to last week.
New Supply: The amount of ETH produced this week was 29,211.
Velocity: The velocity, which was 9.90 last week, reached 9.96 as of October 20.
| Wallet Category | 10/13/2025 | October 20, 2025 | Change (%) |
|---|---|---|---|
| 100 – 1k ETH | 8.5366M | 8.5405M | 0.0457% |
| 1k – 10k ETH | 12.0377M | 11.8394M | −1.65% |
| 10k – 100k ETH | 21.9659M | 22.2554M | 1.32% |
| 100k+ ETH | 4.1815M | 4.1962M | 0.35% |
According to the latest weekly data, the Ethereum wallet distribution in the 100–1k ETH range increased from 8.4835M to 8.5366M, recording an approximate 0.63% increase. The 1k–10k ETH segment declined from 13.1369M to 12.0377M, showing a drop of approximately 8.38%. The 10k–100k ETH group increased from 21.7766M to 21.9659M, showing a rise of approximately 0.87%. The most notable movement occurred in the 100k+ ETH category; this segment rose from 4.1781M to 4.1815M, recording an increase of approximately 0.08%.
Exchange Supply Ratio
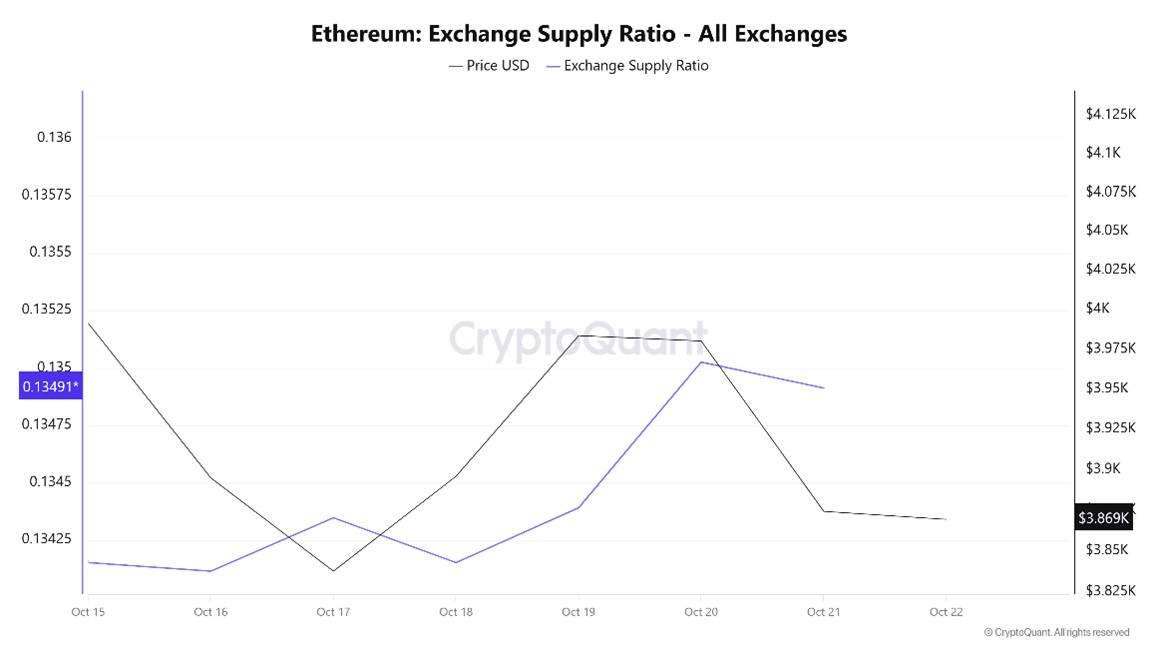
Between October 15 and 22, the Ethereum Exchange Supply Ratio fell from 0.13415242 to 0.13491291. During this period, the price of Ethereum fell from $3.3991 to $3.874. Particularly between October 15 and 22, at the point where the price and the Exchange Supply Ratio intersected, the Exchange Supply Ratio experienced a significant increase while the price continued to fall. This situation indicates that, despite the price decline, the amount of Ethereum supplied to exchanges has increased and that long-term investors have likely stopped holding their assets. Overall, a decline in the Ethereum price is evident.
Exchange Reserve
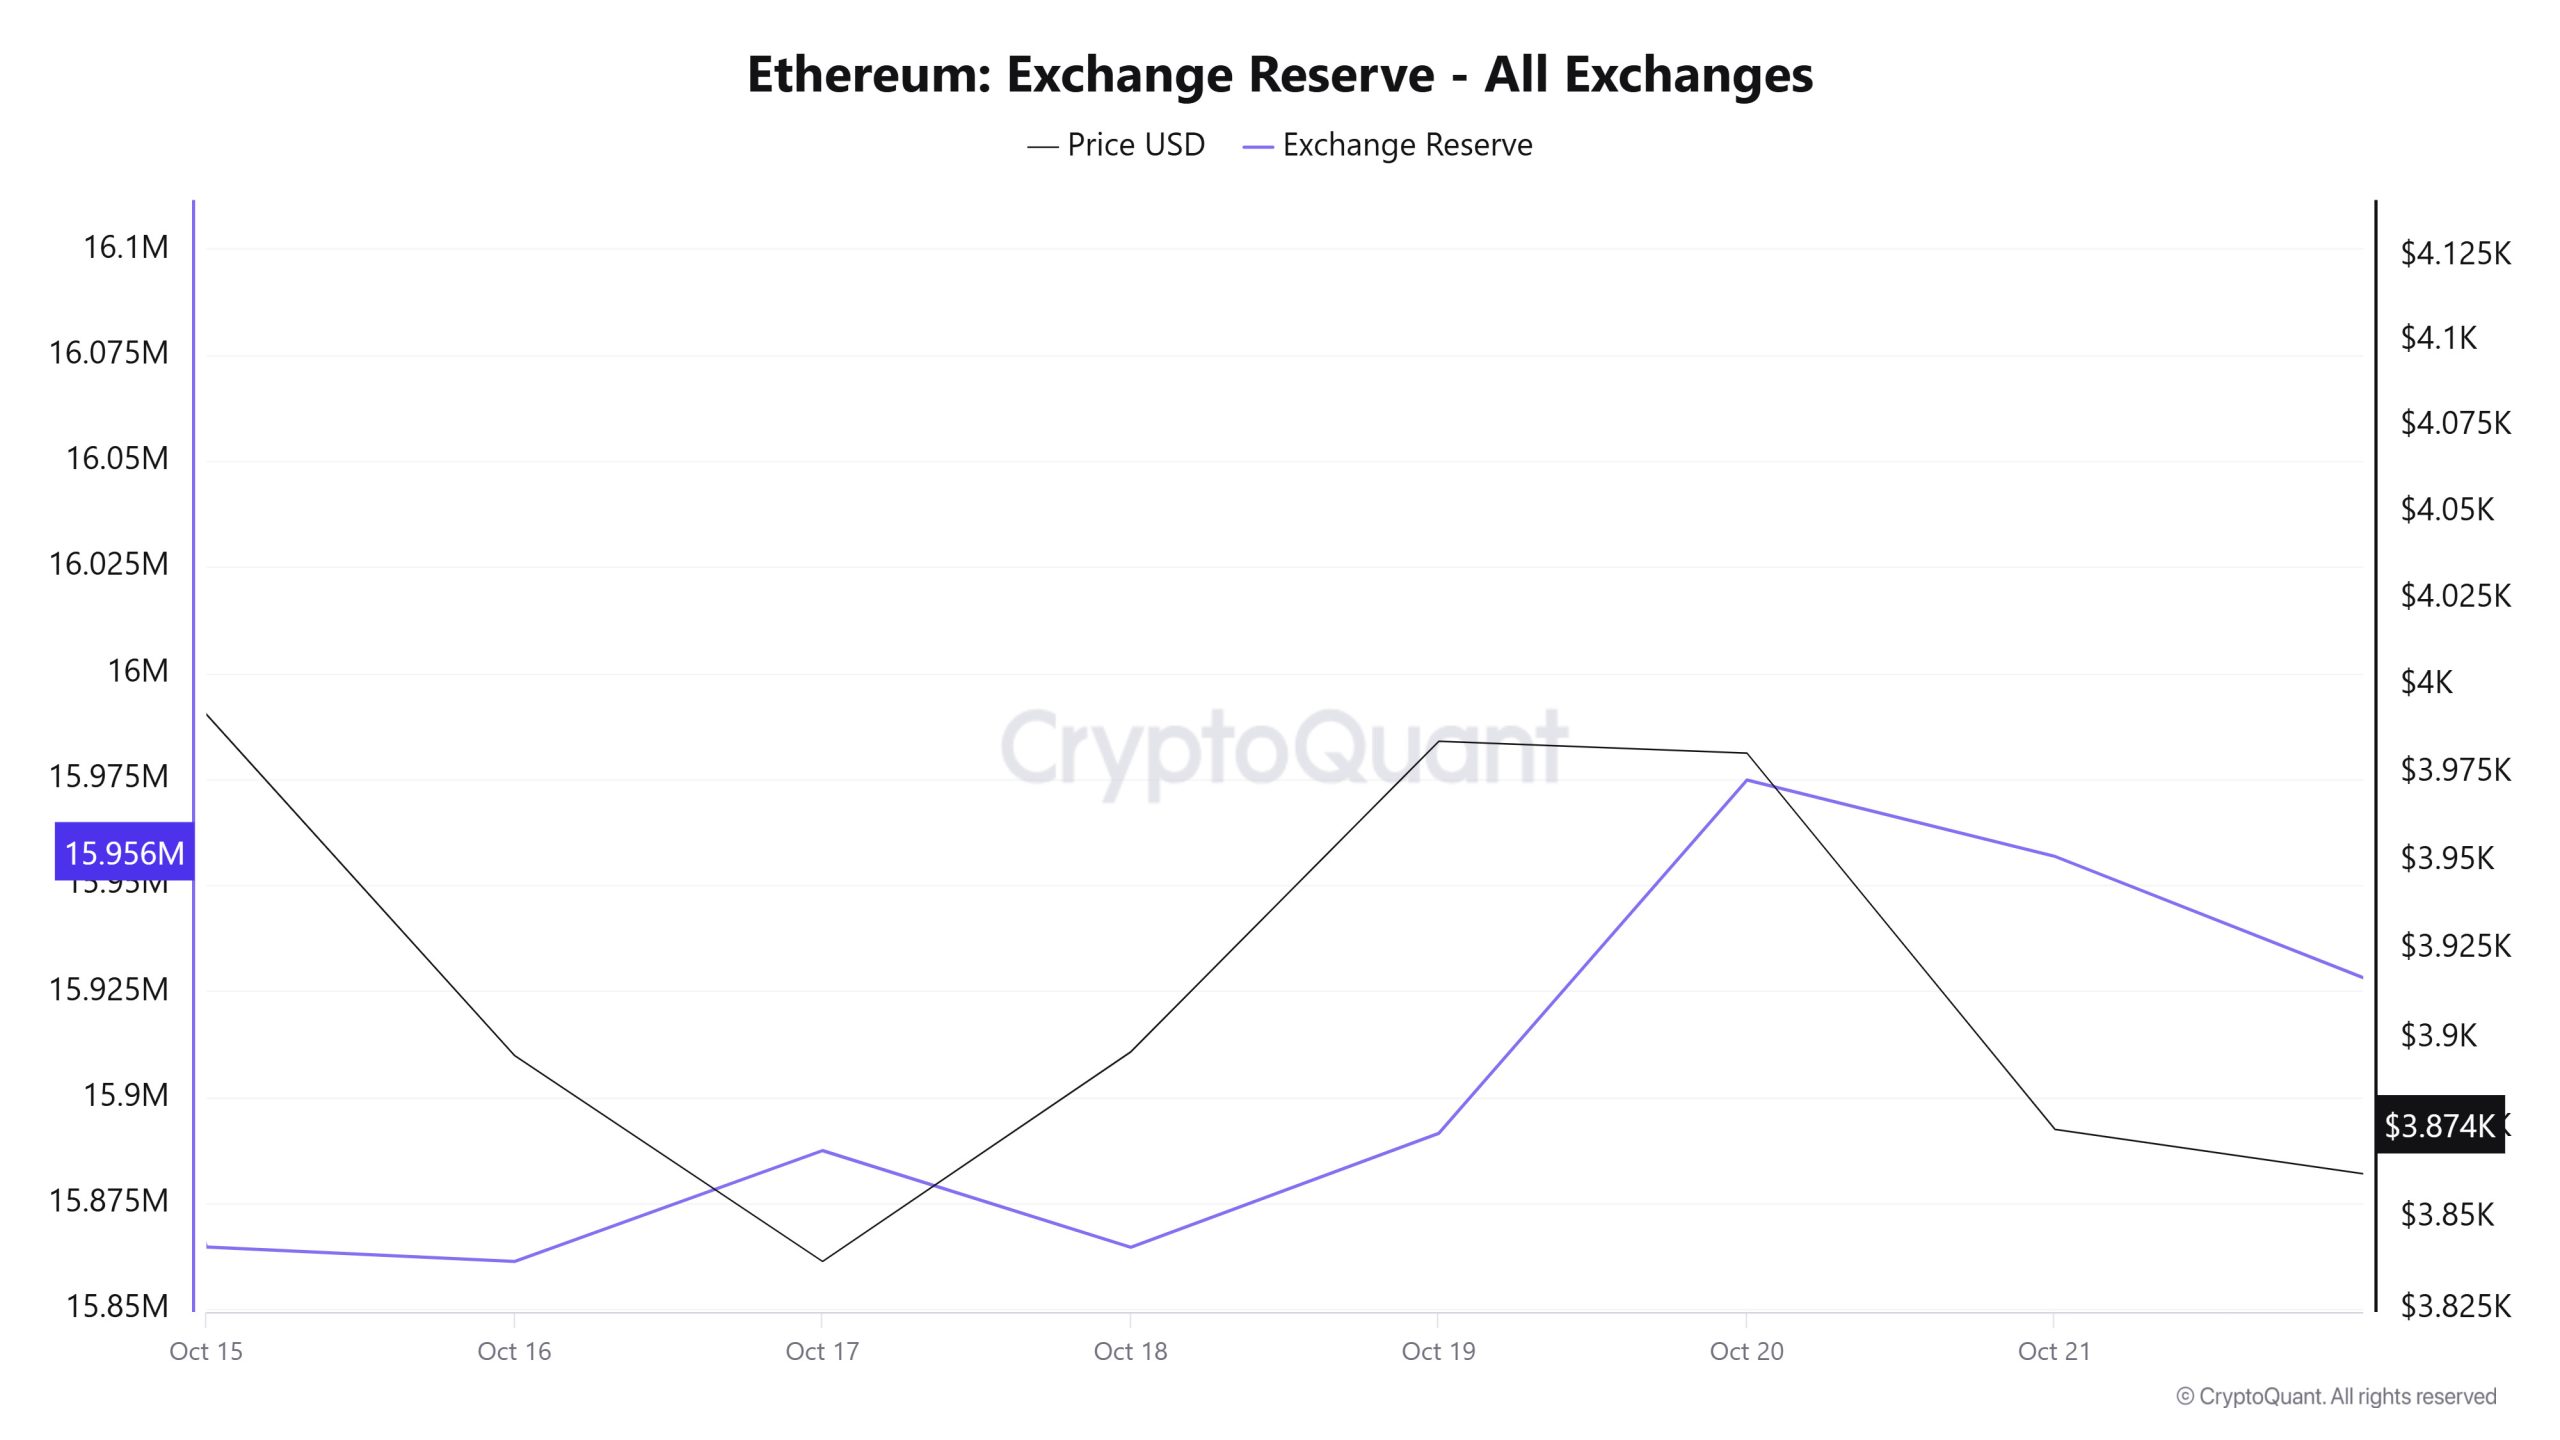
Between October 15-21, 2025, Ethereum reserves on exchanges declined from 16,099,567 ETH to 15,956,699 ETH, resulting in a net outflow of 142,869 ETH. Exchange reserves decreased by approximately 0.89%. During the same period, the price of ETH fell from $4,126 to $3,874, losing 6.11% of its value. The decrease in exchange reserves while the price was falling indicates that investors saw this pullback as a buying opportunity rather than a selling opportunity. This picture shows that long-term investors have not completely withdrawn from the market but are instead taking advantage of the declines. The general weakness in the market is preventing this trend from being quickly reflected in prices. In the short term, selling pressure may remain effective for a while. However, if the downward trend in reserves continues, this could create tightening on the supply side in the long term, supporting the price again.
Fees and Revenues
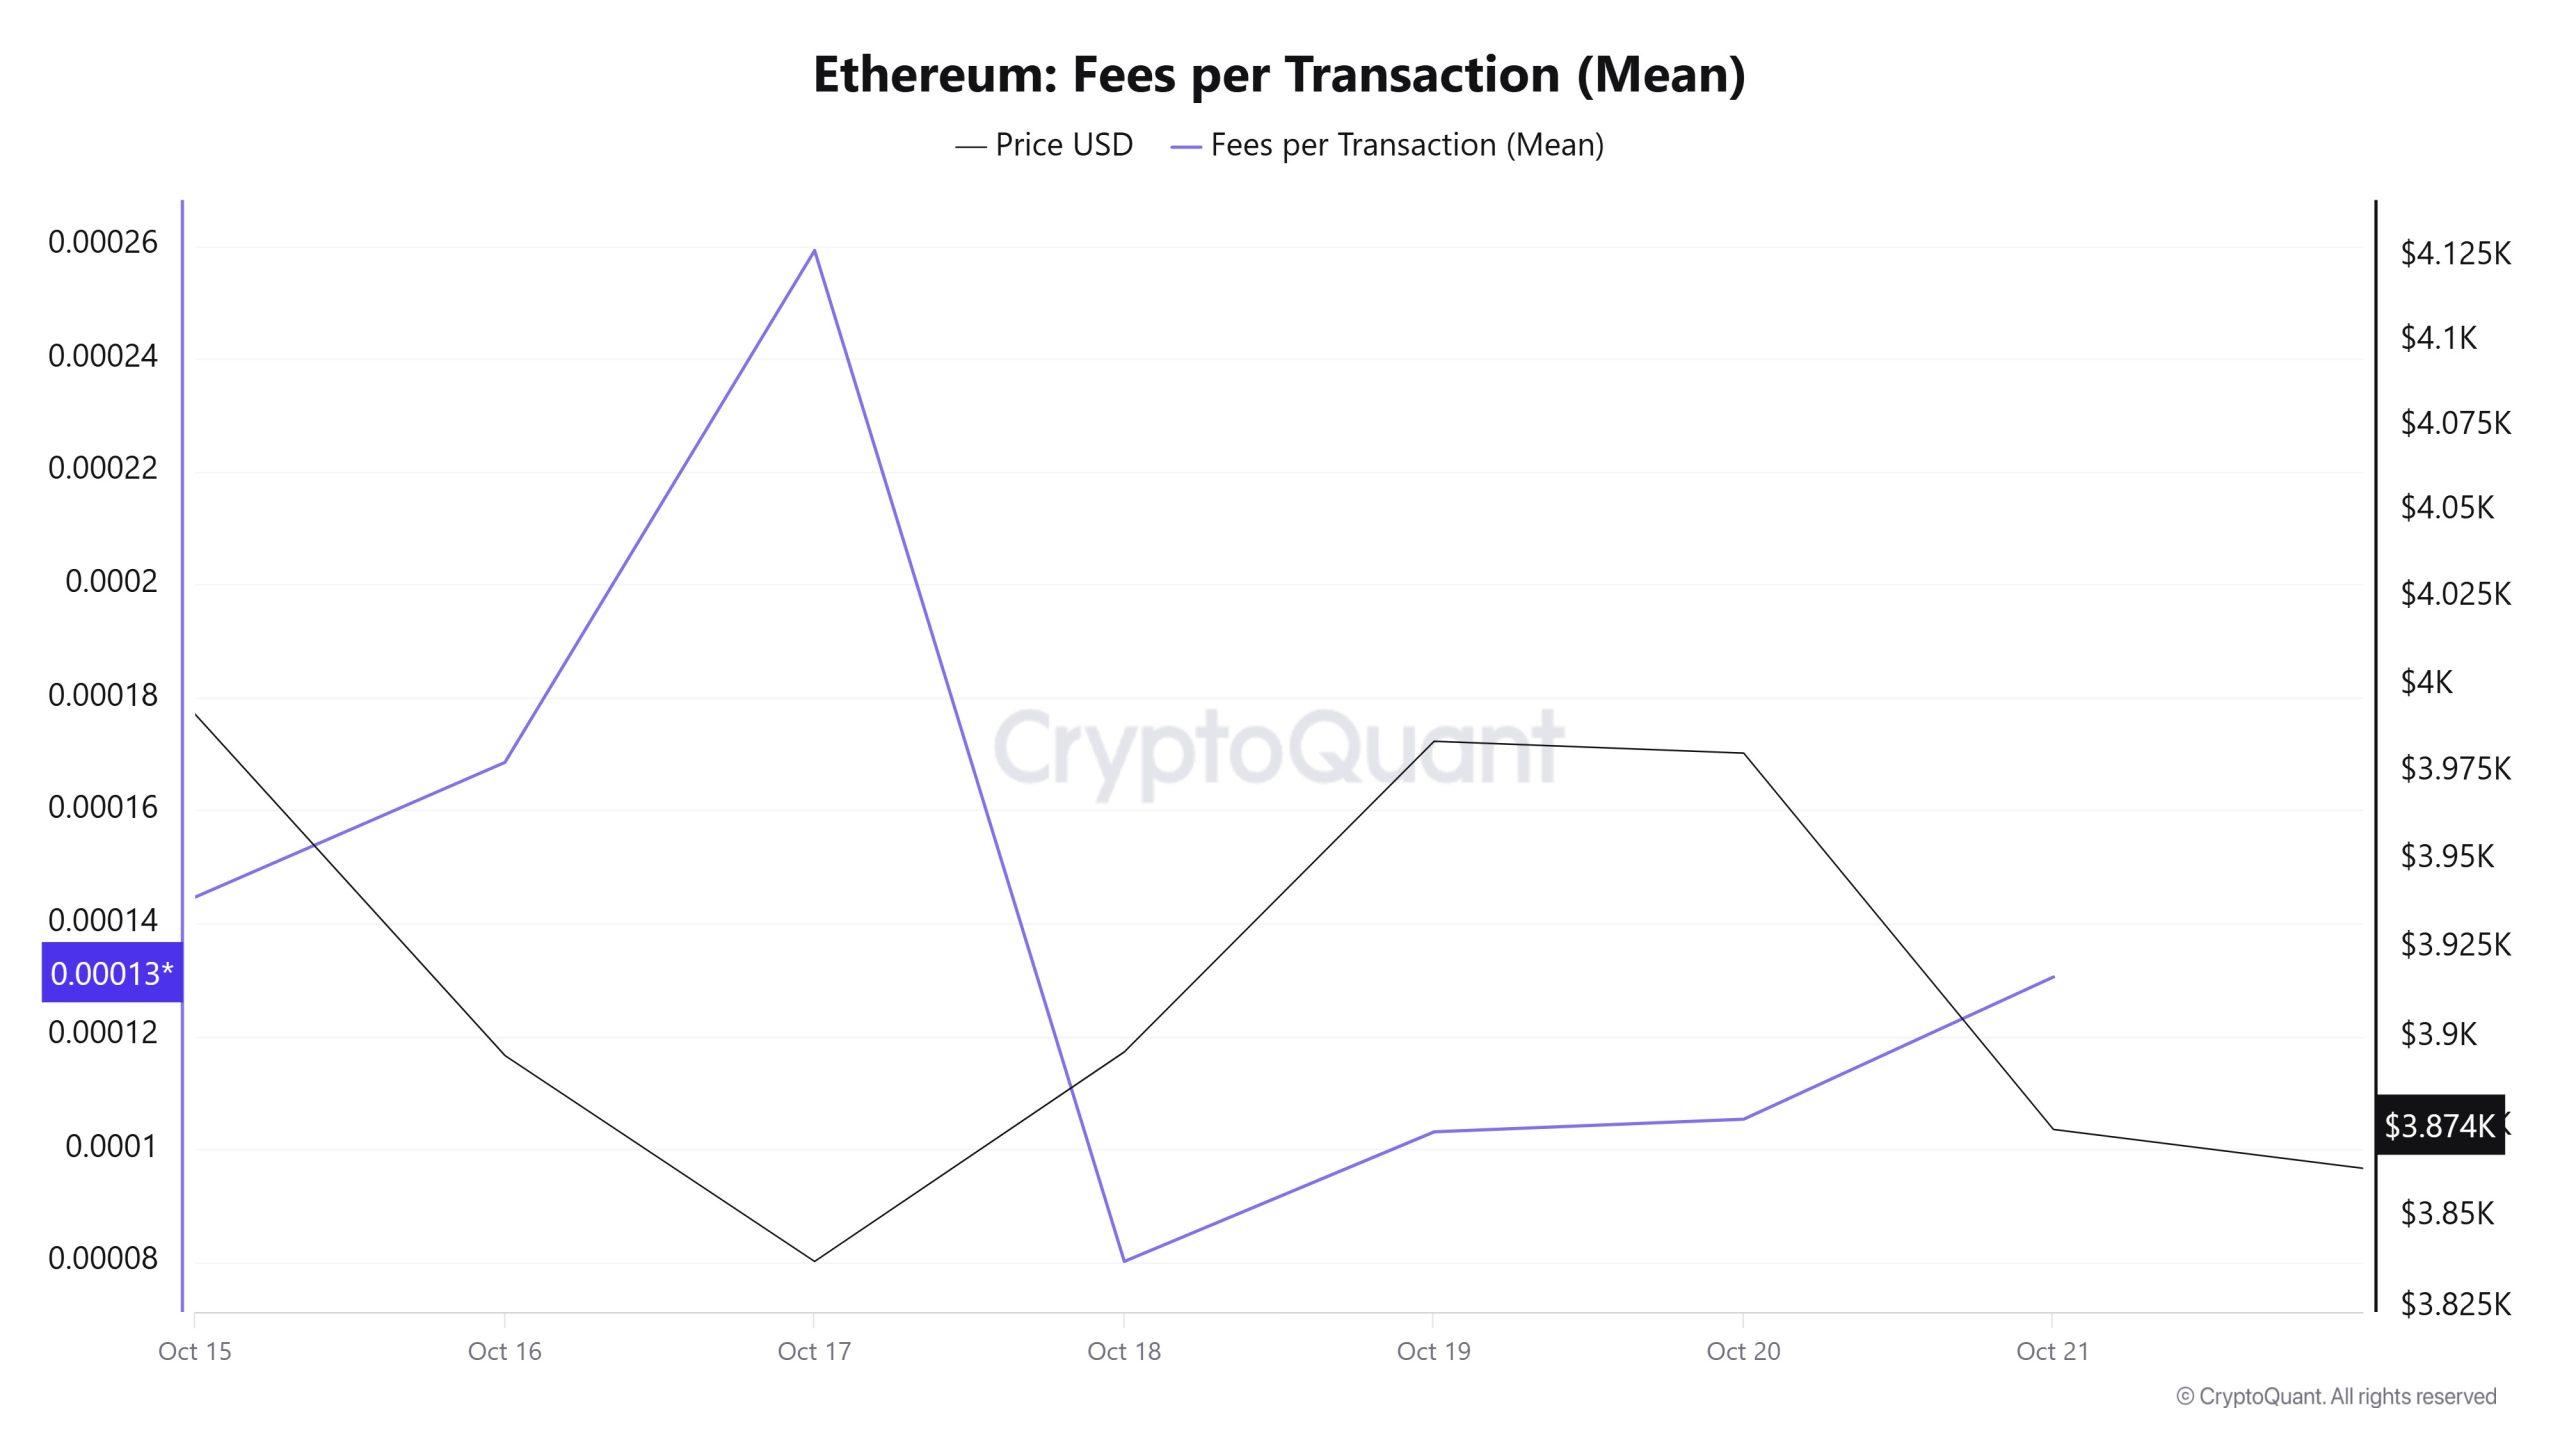
When examining the Ethereum Fees per Transaction (Mean) data for October 15-21, it can be seen that on October 15, the first day of the week, the indicator stood at 0.000144612662259363.
As of October 17, the value in question reached its peak level. After this date, it followed a fluctuating trend due to the volatility in the Bitcoin price and declined to 0.000080053742240972 on October 18.
In the following days, the Ethereum Fees per Transaction (Mean) indicator resumed its upward trend, closing at 0.000130454111383375 on October 21, the last day of the week.
Ethereum: Fees (Total)
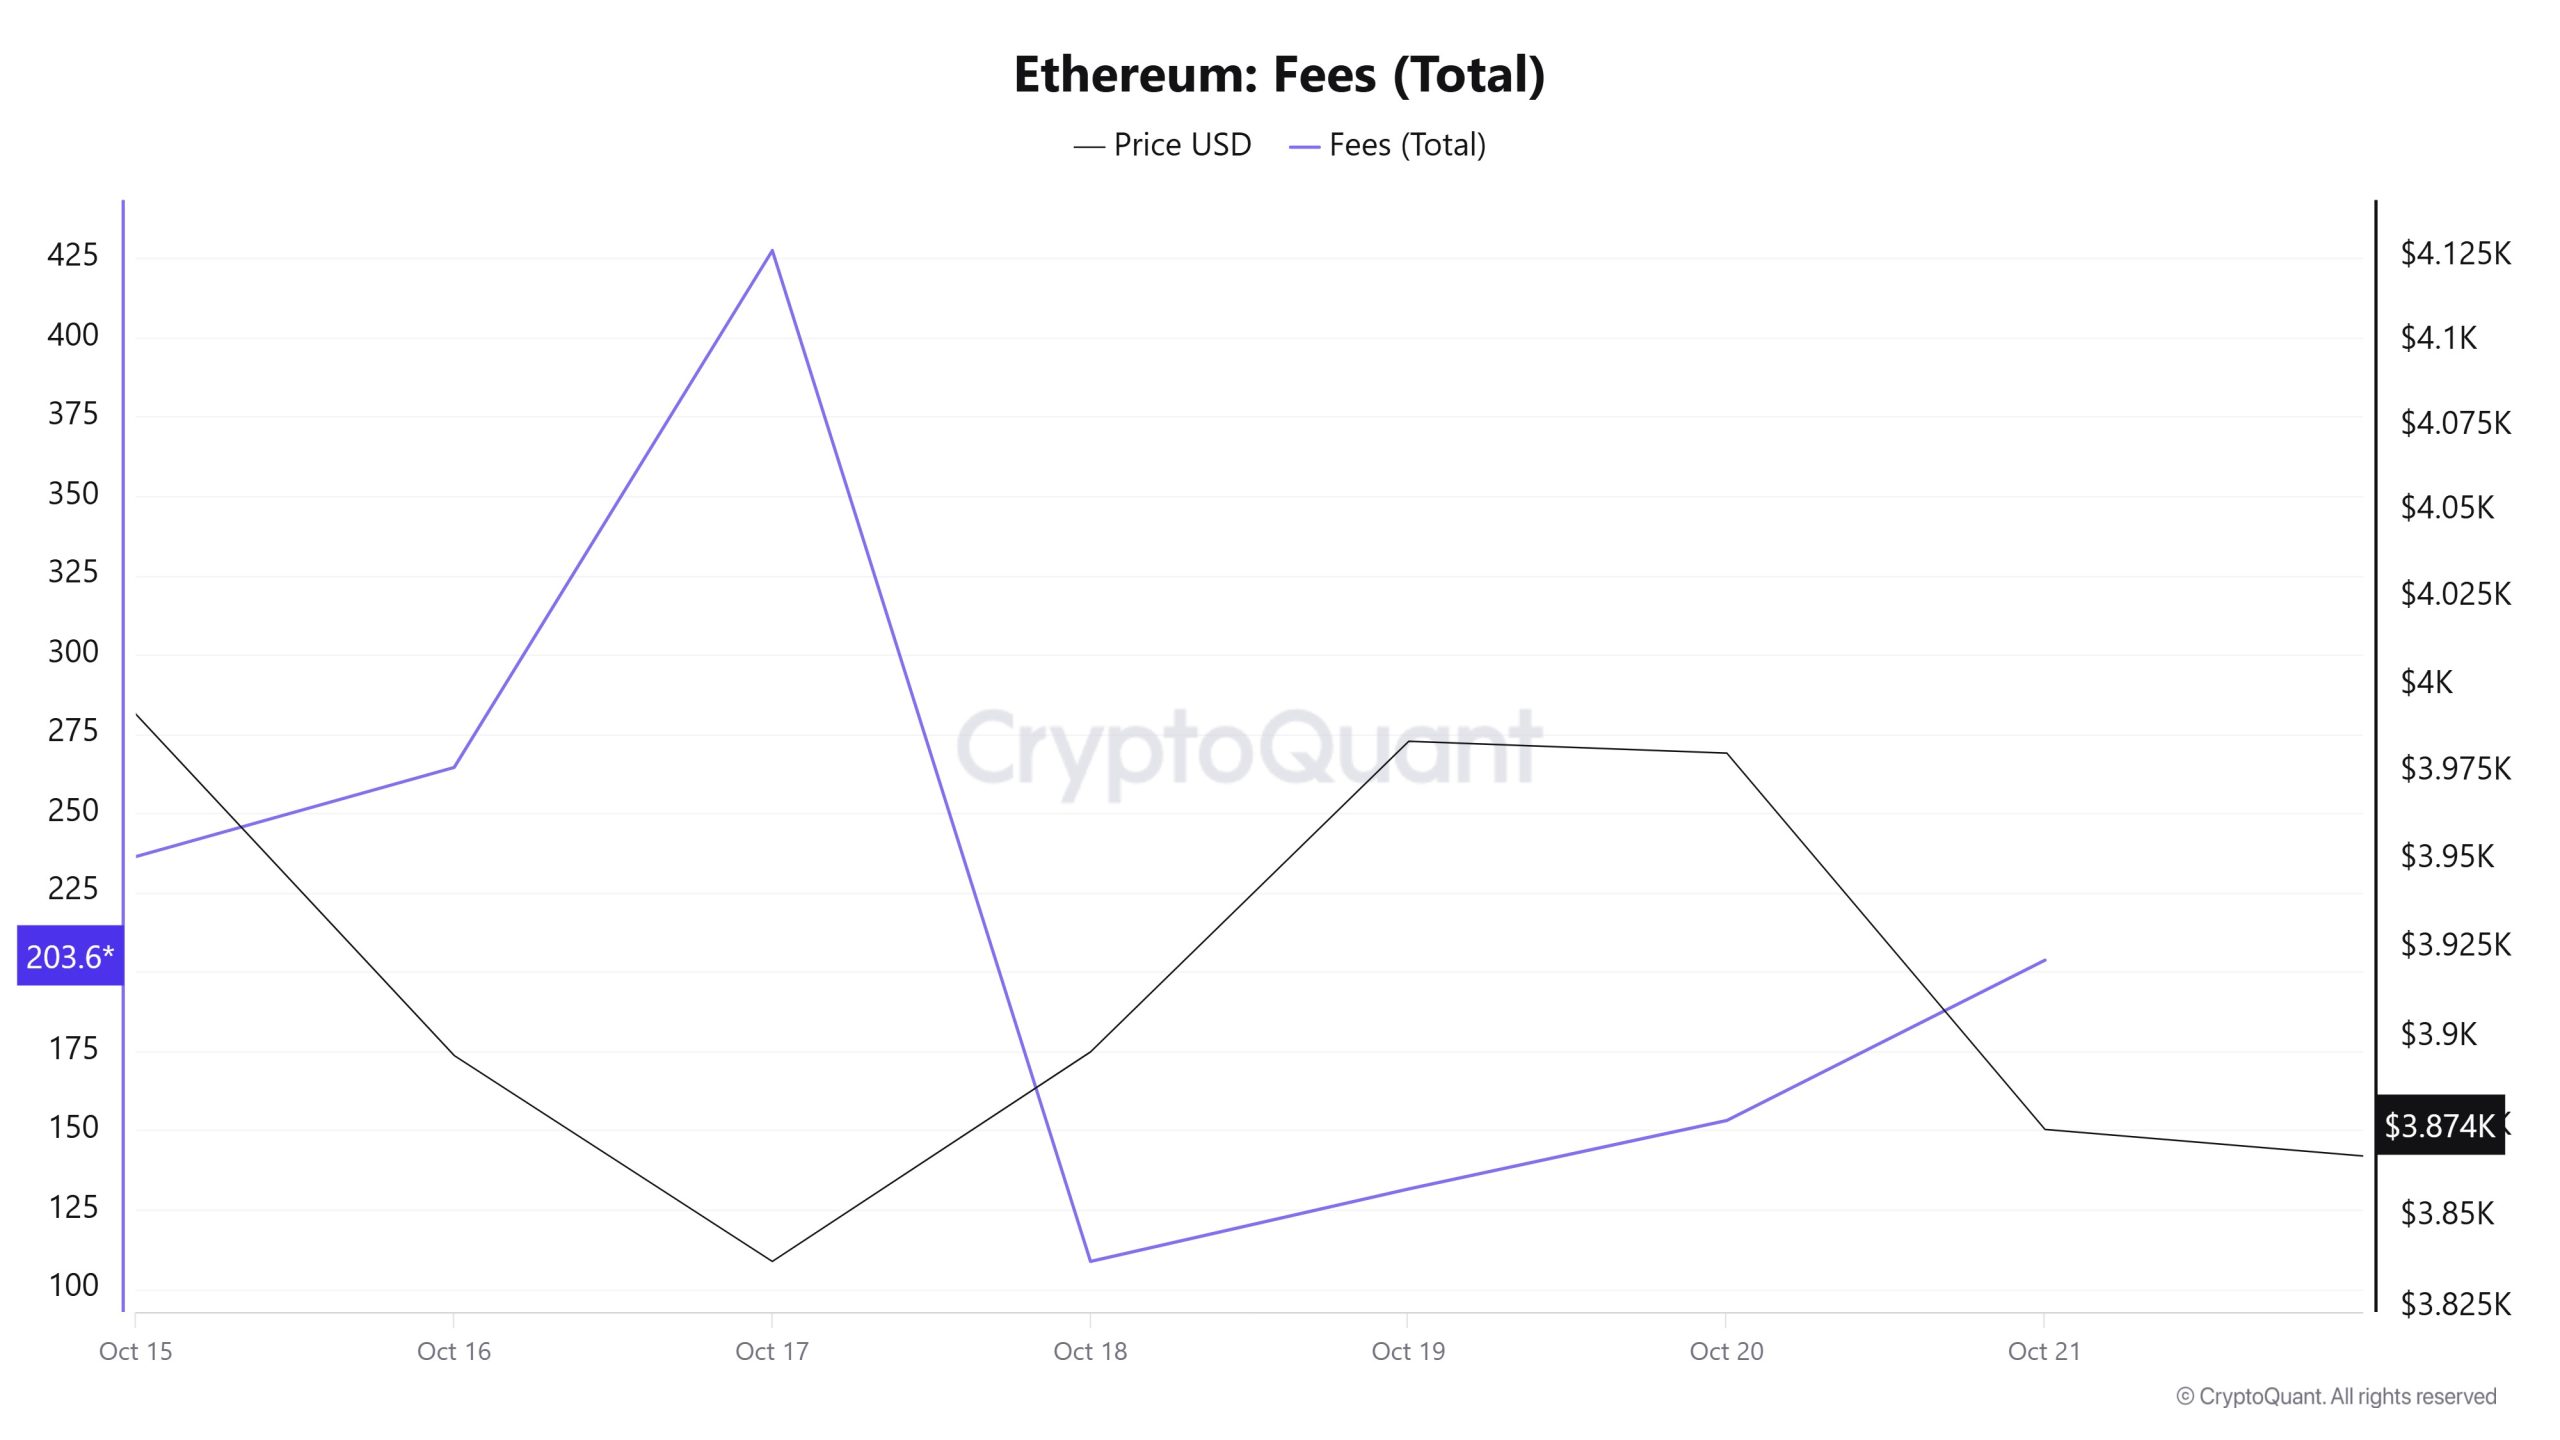
Similarly, when examining the Ethereum Fees (Total) data between October 15-21, it is seen that the indicator reached 236.33324329736334 on October 15, the first day of the week.
As of October 17, the value in question reached its peak level. After this date, it followed a fluctuating trend due to the volatility in the Bitcoin price and declined to 108.66999310365716 on October 18.
In the following days, the Ethereum Fees (Total) indicator resumed its upward trend, closing at 203.65974052726943 on October 21, the last day of the week.
Blocks Mined
“Ethereum Blocks Mined Visual to Be Added”
When examining Ethereum block production data between October 15 and 21, a decrease was observed throughout the week. While 7,148 blocks were produced on October 15, this number declined to 7,122 by October 21.
A time-dependent correlation structure has been observed between the Ethereum price and the number of blocks produced. However, the general trend indicates that a positive correlation between these two variables is dominant.
Block Size
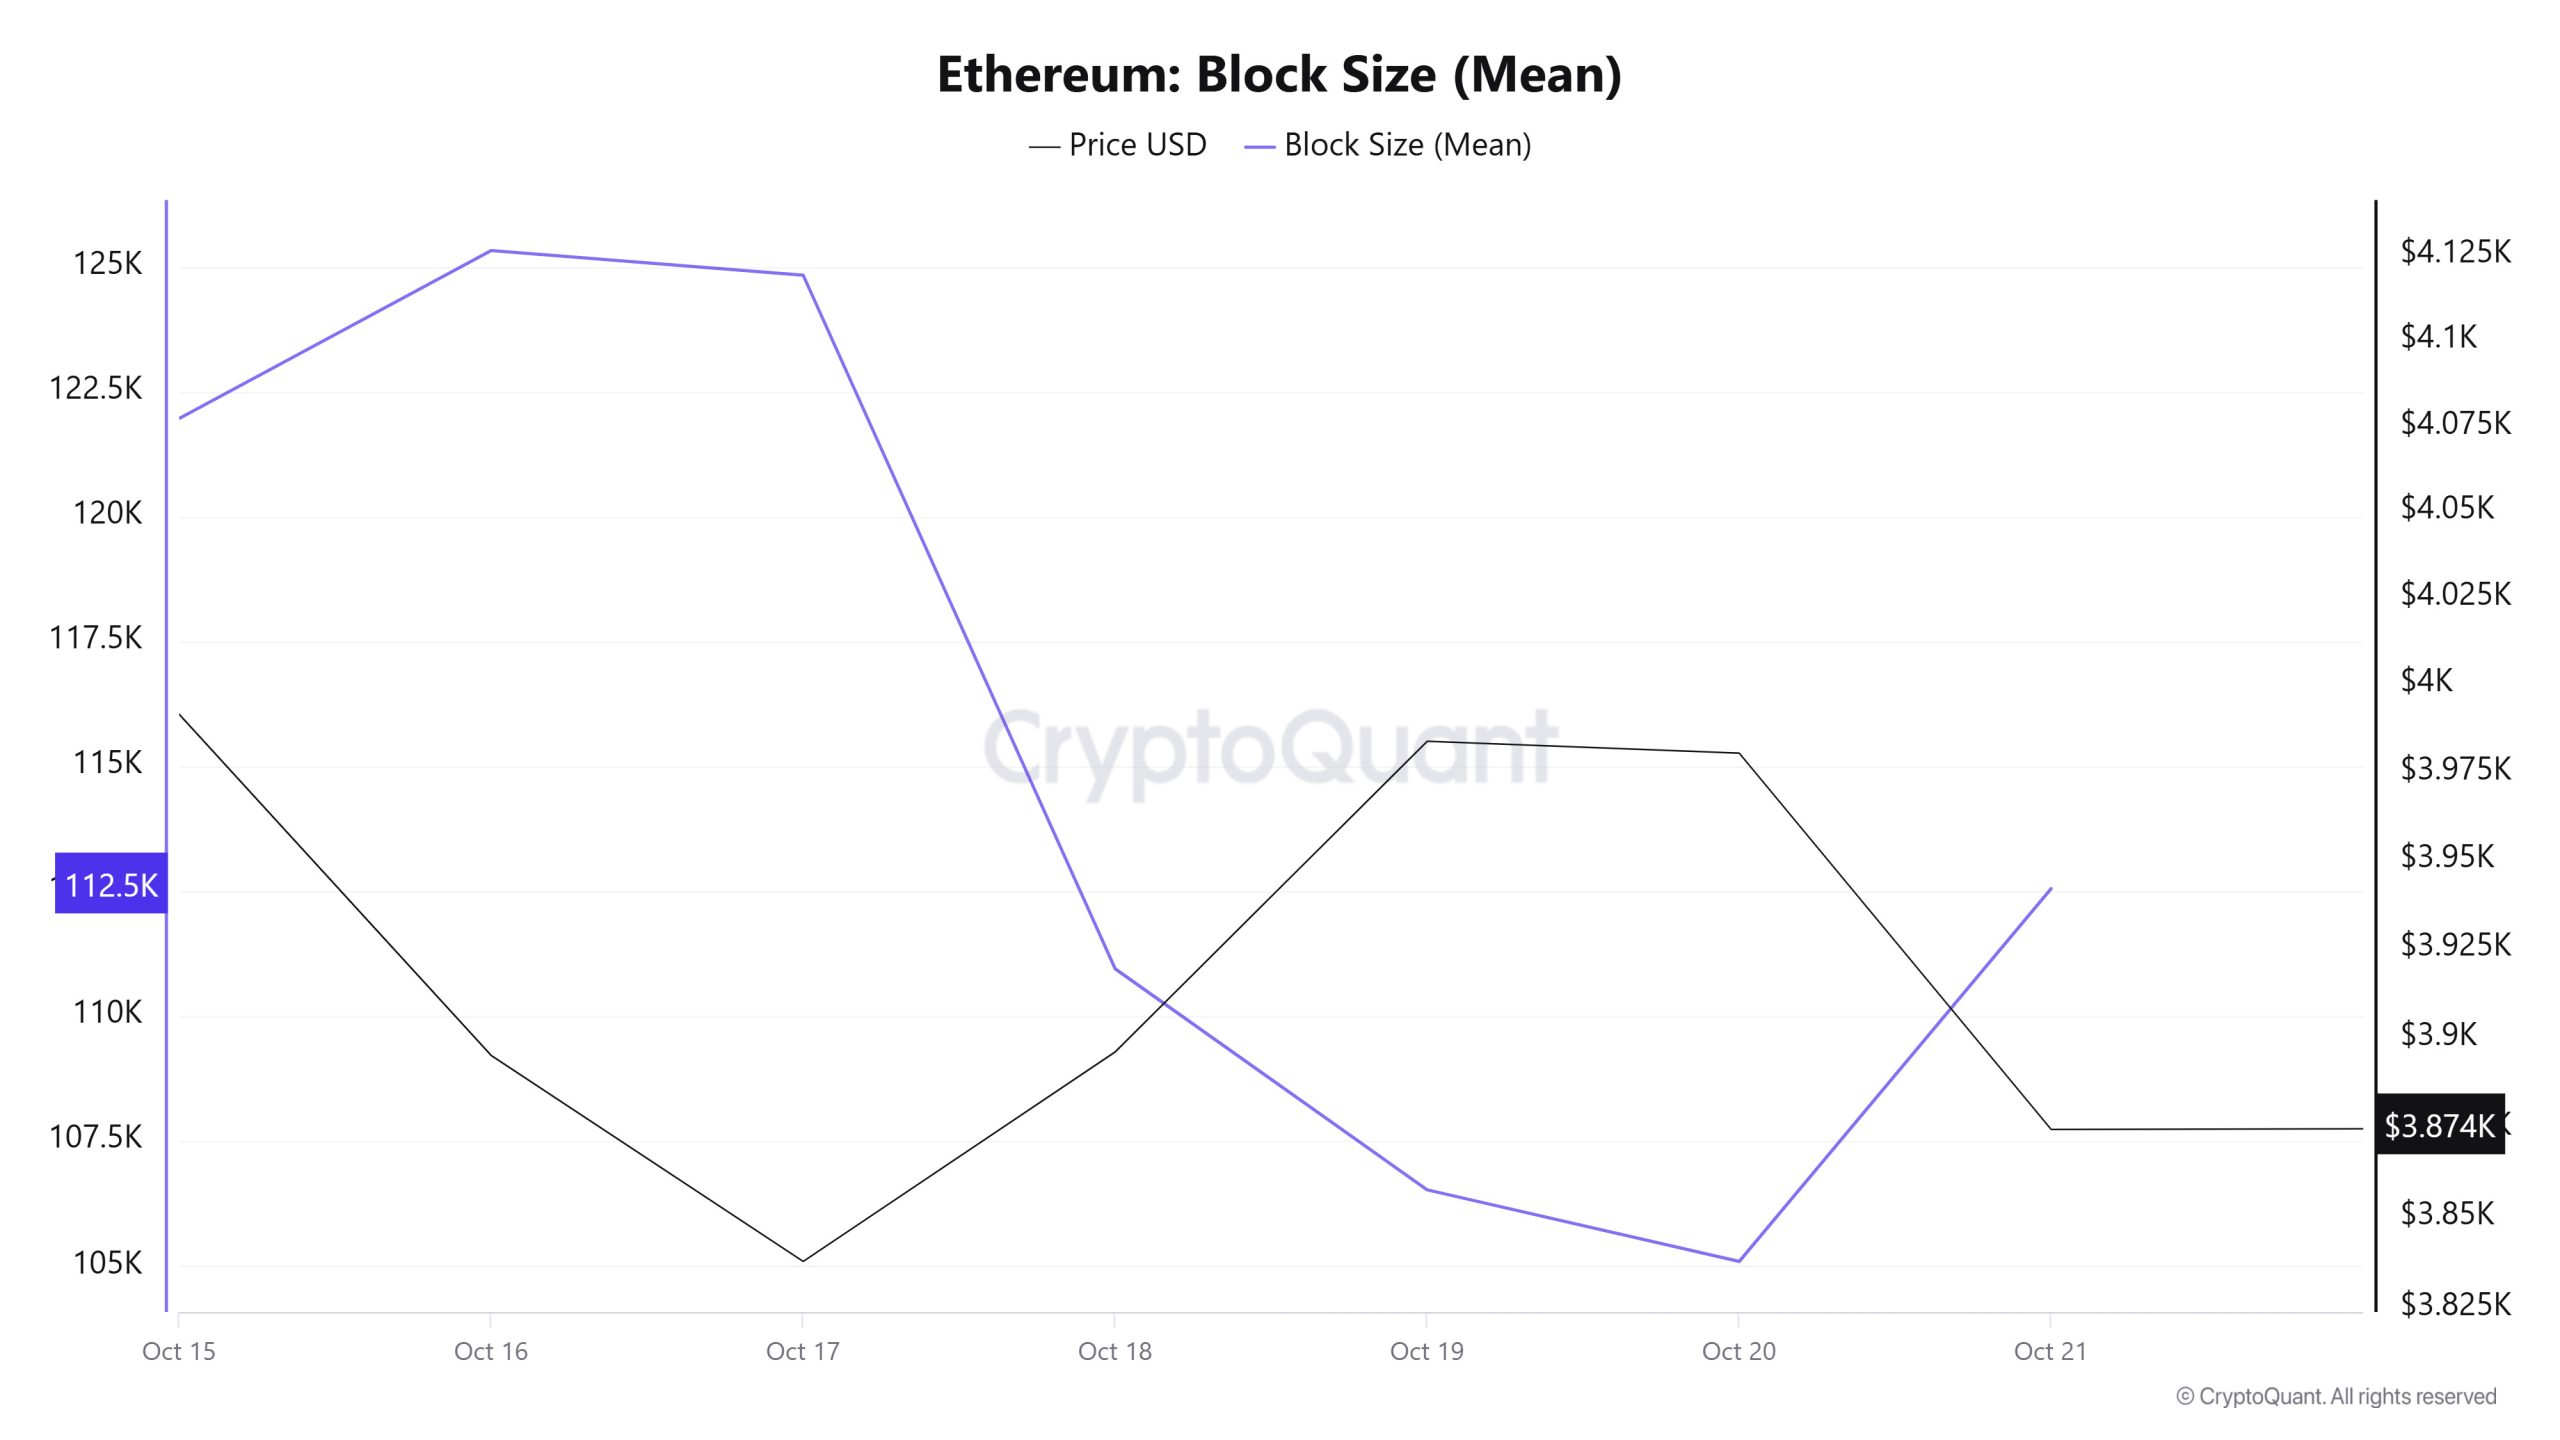
When examining Ethereum block size data between October 15 and 21, a decrease was observed throughout the week. While the average block size was measured at 121,957 bytes on October 15, this value declined to 112,547 bytes by October 21.
During the relevant period, a time-dependent correlation structure was observed between block size and Ethereum price. However, the general trend indicates that a negative correlation between these two variables is dominant.
Block Interval
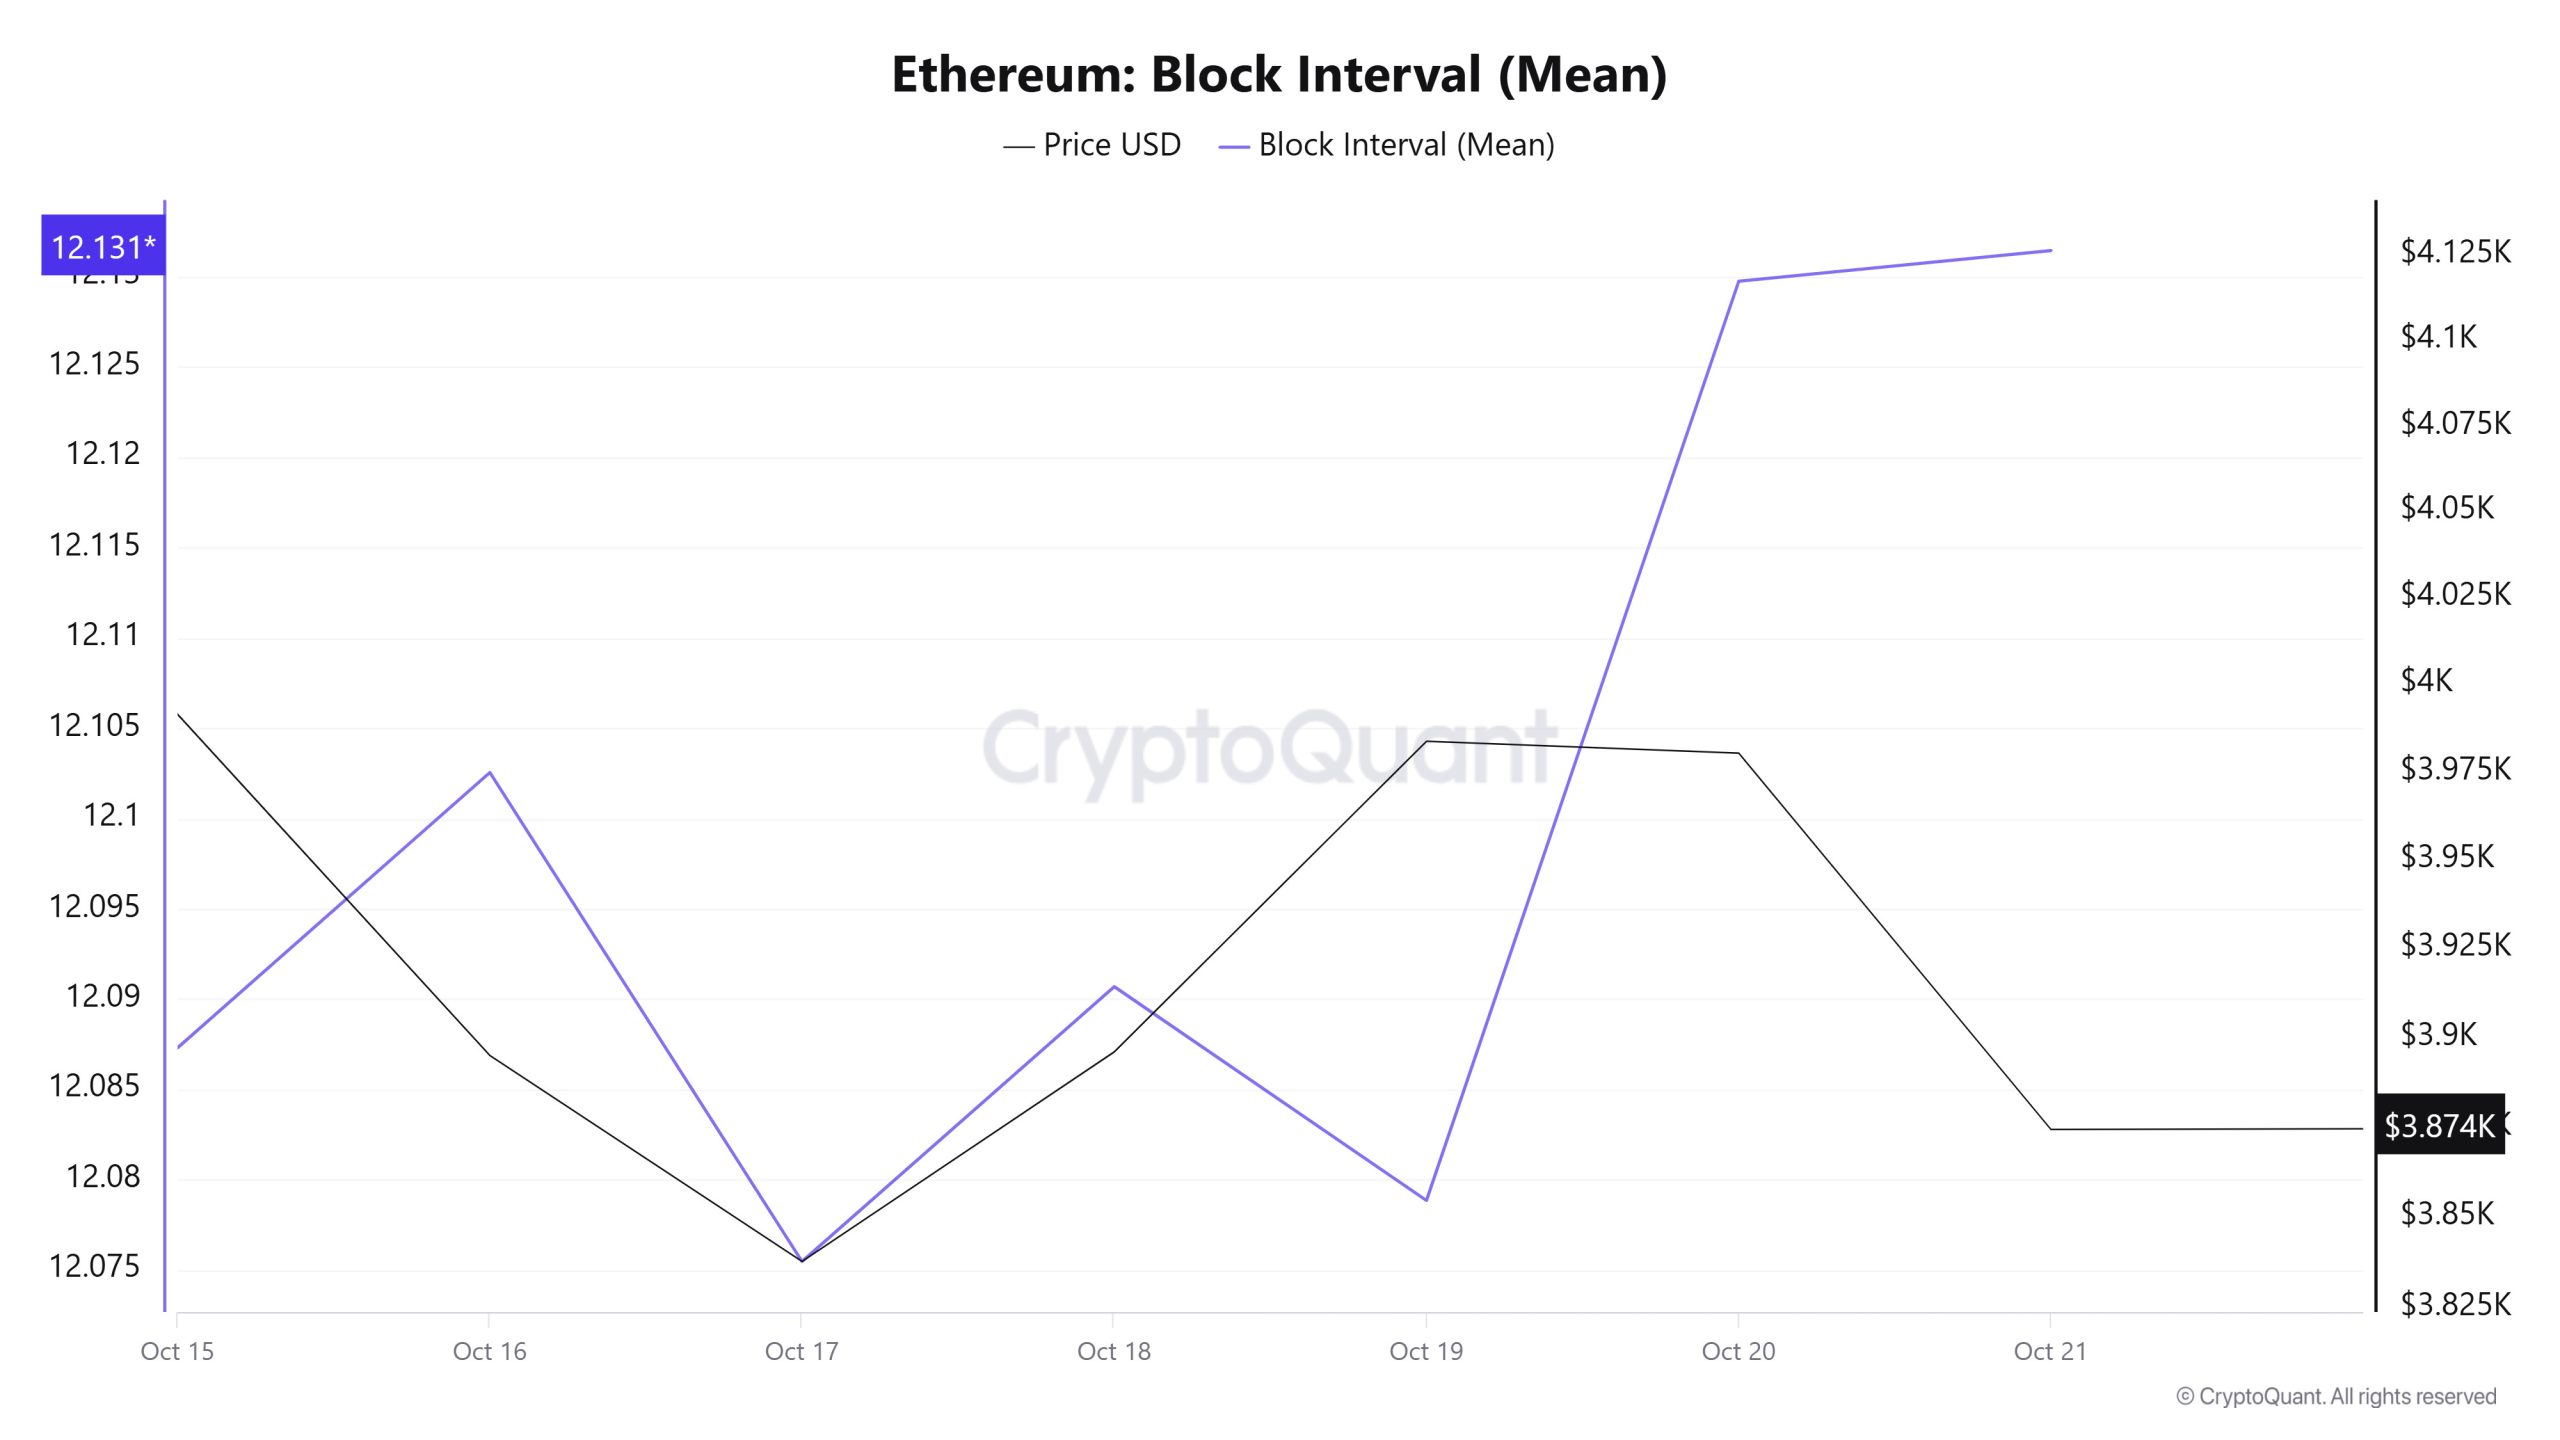
When examining the Ethereum block time between October 15 and 21, there was a slight increase over the week. While the average block time was recorded as 12.08 seconds on October 15, this time rose to 12.13 seconds as of October 21.
During this period, a time-dependent correlation structure was observed between the Ethereum block time and price movement. However, the general trend indicates that a negative correlation between these two variables is dominant.
Transaction
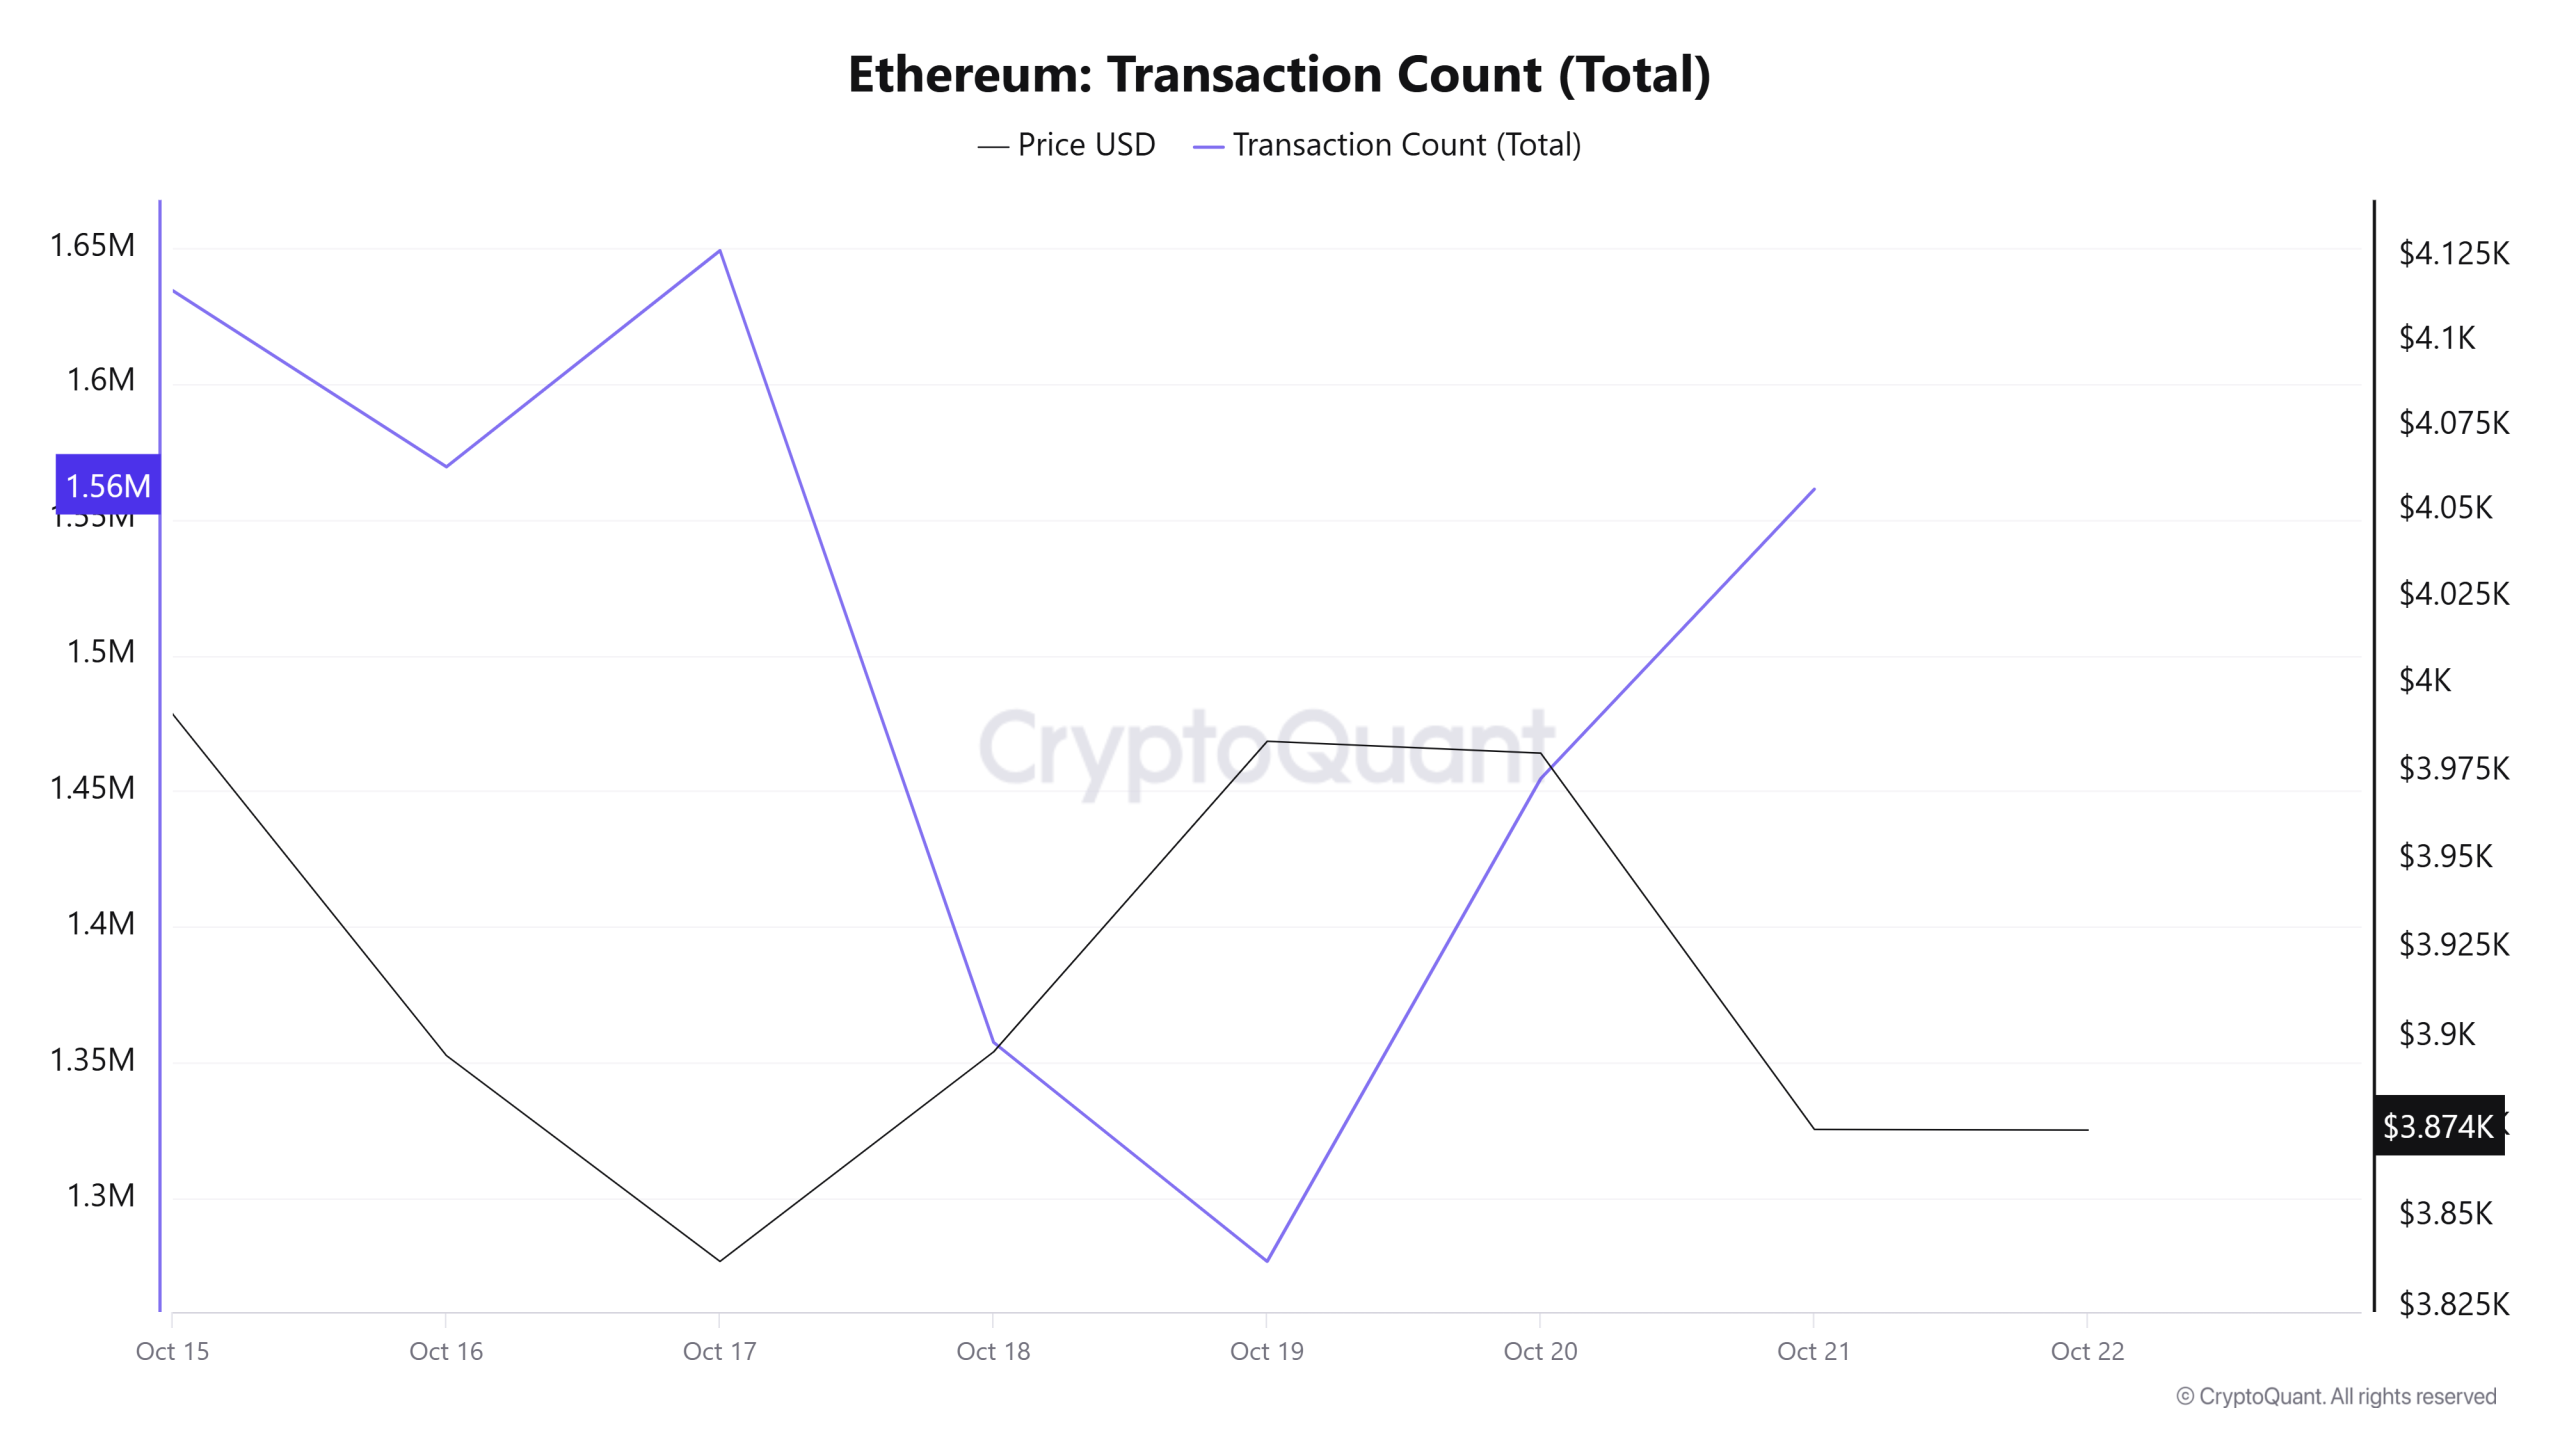
Last week, a total of 11,116,288 transactions were executed on the Ethereum network, while this week the number of transactions decreased by approximately 5.5% to 10,502,648. The highest weekly transaction count was recorded on October 17 at 1,649,015, while the lowest was on October 19 at 1,276,777. The correlation between transaction volume and price showed a negative trend. Therefore, based on current data, it appears more likely that transfers on the network are sales-heavy. On the other hand, the relatively low stability of network activity compared to the previous period points to a negative overall picture.
Tokens Transferred
The total amount of ETH transferred between last week and this week decreased by approximately 34%, falling from 17,971,911 to 11,859,662. The highest weekly transfer was recorded on October 15 at 2,339,747 ETH, while the lowest transfer was recorded on October 18 at 646,185 ETH. Daily fluctuations exceeding 300% in transferred amounts indicate that network activity, like price activity, continued to exhibit high volatility during this period. The balanced correlation between price and token transfer volume during this period does not provide clear data on which direction of transfers was dominant.
The partial decrease in transfer activity on the network and the significant drop in the amount of Ethereum transferred suggest that the network is experiencing a negative period, but this negative outlook is not sufficiently reflected in the price. In other words, this blow to Ethereum may manifest itself in downward price movements in the coming weeks.
Estimated Leverage Ratio
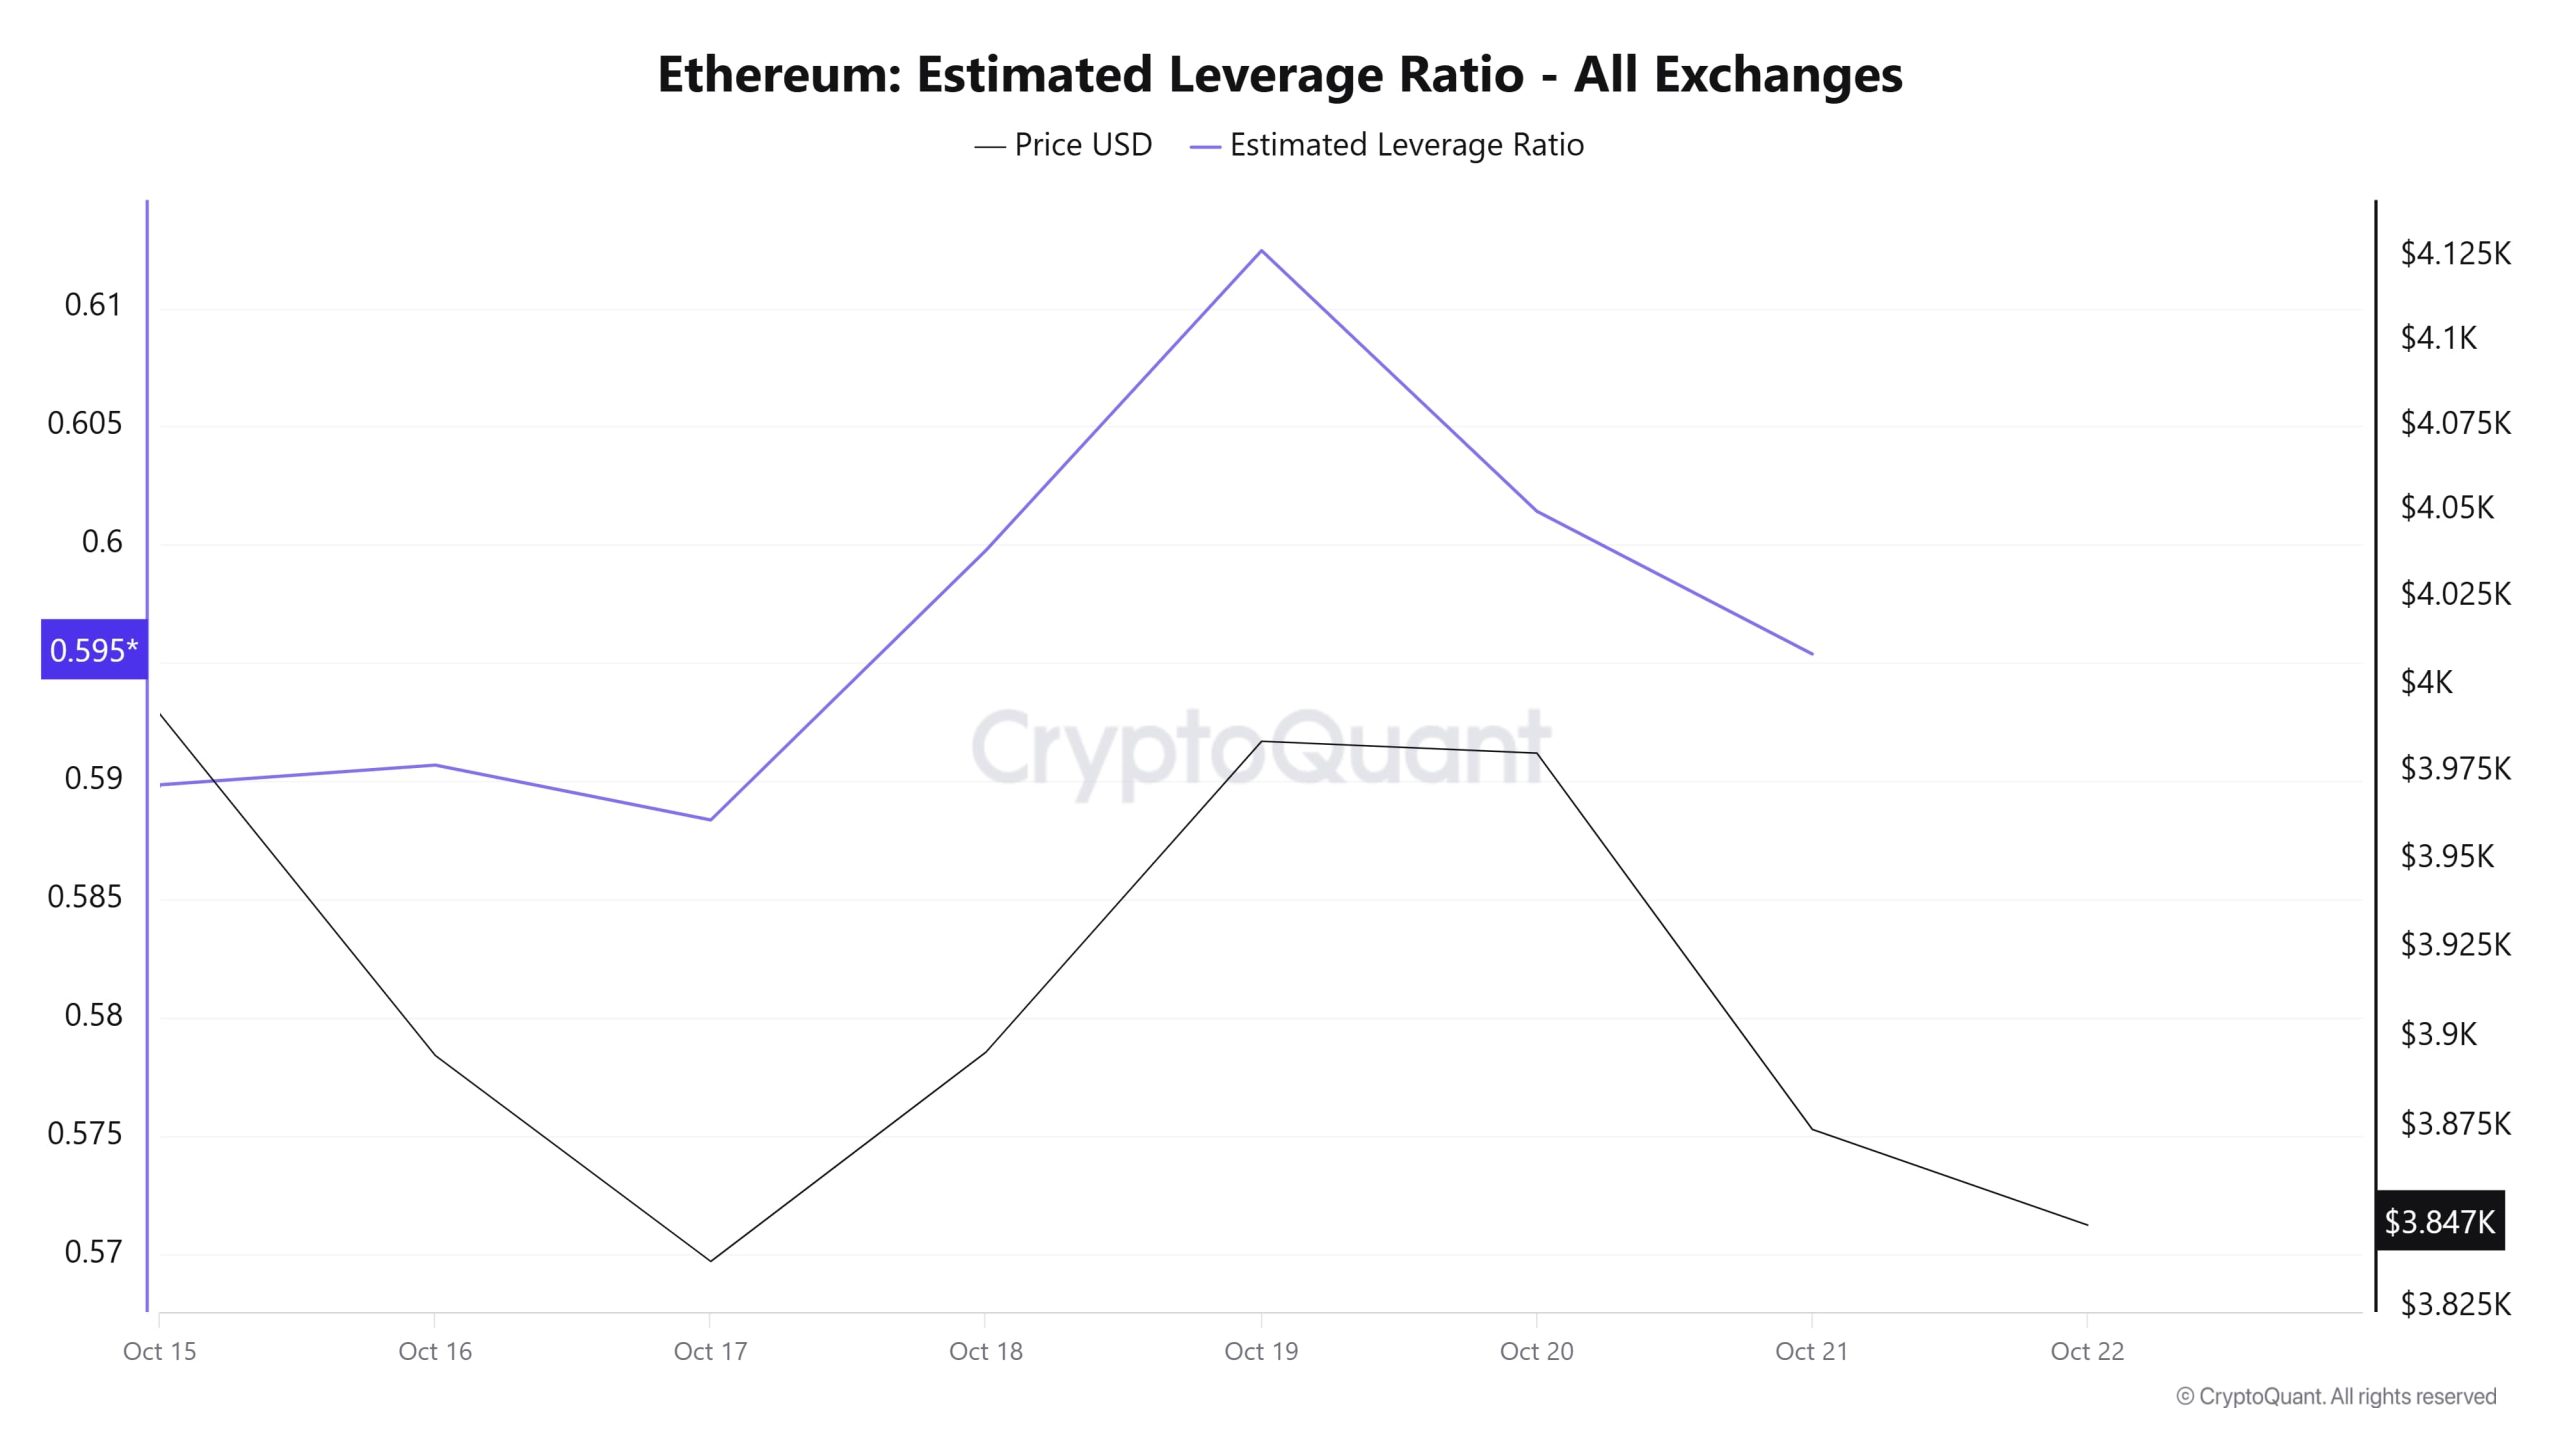
Over the 7-day period, the metric showed a slight increase from start to finish. Starting at 0.589, the ELR (Estimated Leverage Ratio) peaked at 0.612 on October 19. At the time of writing, the metric stands at 0.595, indicating a decline in investor appetite. A higher ELR means participants are more willing to take on risk and typically indicates bullish conditions or expectations. It should be noted that these increases may also stem from a decline in reserves. Looking at Ethereum reserves, there were 15.86 million reserves at the beginning of the process, and this figure rose slightly during the rest of the process and is currently at 15.92 million. At the same time, Ethereum’s Open Interest was $46.81 billion at the beginning of the process. As of now, volume has declined during the process, and the open interest value stands out at $42.63 billion. With all this data, the ELR metric rose until the middle of the process but lost value during the remainder of the period. The asset’s price fluctuated between $4,120 and $3,750 with all this data. As of now, investors’ and traders’ risk appetite appears balanced. The slight increase in the ELR ratio, explained by the decrease in open interest volume and the slight increase in reserves seen throughout the process, is evident. As a result, the increase in reserves and the decline in open interest caused a slight rise in the ELR metric. This shows us that the market has some appetite, but it cannot shake off its pessimism.
ETH Onchain Overall
| Metric | Positive 📈 | Negative 📉 | Neutral ➖ |
|---|---|---|---|
| Active Addresses | ✓ | ||
| Total Value Staked | ✓ | ||
| Derivatives | ✓ | ||
| Supply Distribution | ✓ | ||
| Exchange Supply Ratio | ✓ | ||
| Exchange Reserve | ✓ | ||
| Fees and Revenues | ✓ | ||
| Blocks Mined | ✓ | ||
| Transaction | ✓ | ||
| Estimated Leverage Ratio | ✓ |
*The metrics and guidance provided in the table do not alone explain or imply any expectation regarding future price changes in any asset. Digital asset prices can fluctuate based on numerous variables. The on-chain analysis and related guidance are intended to assist investors in their decision-making process, and basing financial investments solely on the results of this analysis may lead to unfavorable outcomes. Even if all metrics produce positive, negative, or neutral results simultaneously, the expected outcomes may not materialize depending on market conditions. It would be beneficial for investors reviewing the report to take these warnings into consideration.
Legal Notice
The investment information, comments, and recommendations contained in this document do not constitute investment advisory services. Investment advisory services are provided by authorized institutions on a personal basis, taking into account the risk and return preferences of individuals. The comments and recommendations contained in this document are of a general nature. These recommendations may not be suitable for your financial situation and risk and return preferences. Therefore, making an investment decision based solely on the information contained in this document may not result in outcomes that align with your expectations.
NOTE: All data used in Ethereum on-chain analysis is based on CryptoQuant.