
Technical Analysis
BTC/USDT
Trump canceled his planned meeting with Putin after announcing new sanctions against Russia with European support. U.S.-China trade talks will begin this weekend in Malaysia; Bessent confirmed that the Trump-Xi summit will proceed as planned. Russia held nuclear drills following the sanctions; India and the US are close to an agreement to reduce tariffs from 50% to 15%. The bankruptcy of PrimaLend Capital in the US financial sector has heightened credit concerns. The Trump administration is planning to invest in a quantum computing company. “Crypto Tsar” David Sacks said he expects crypto market legislation to pass this year.
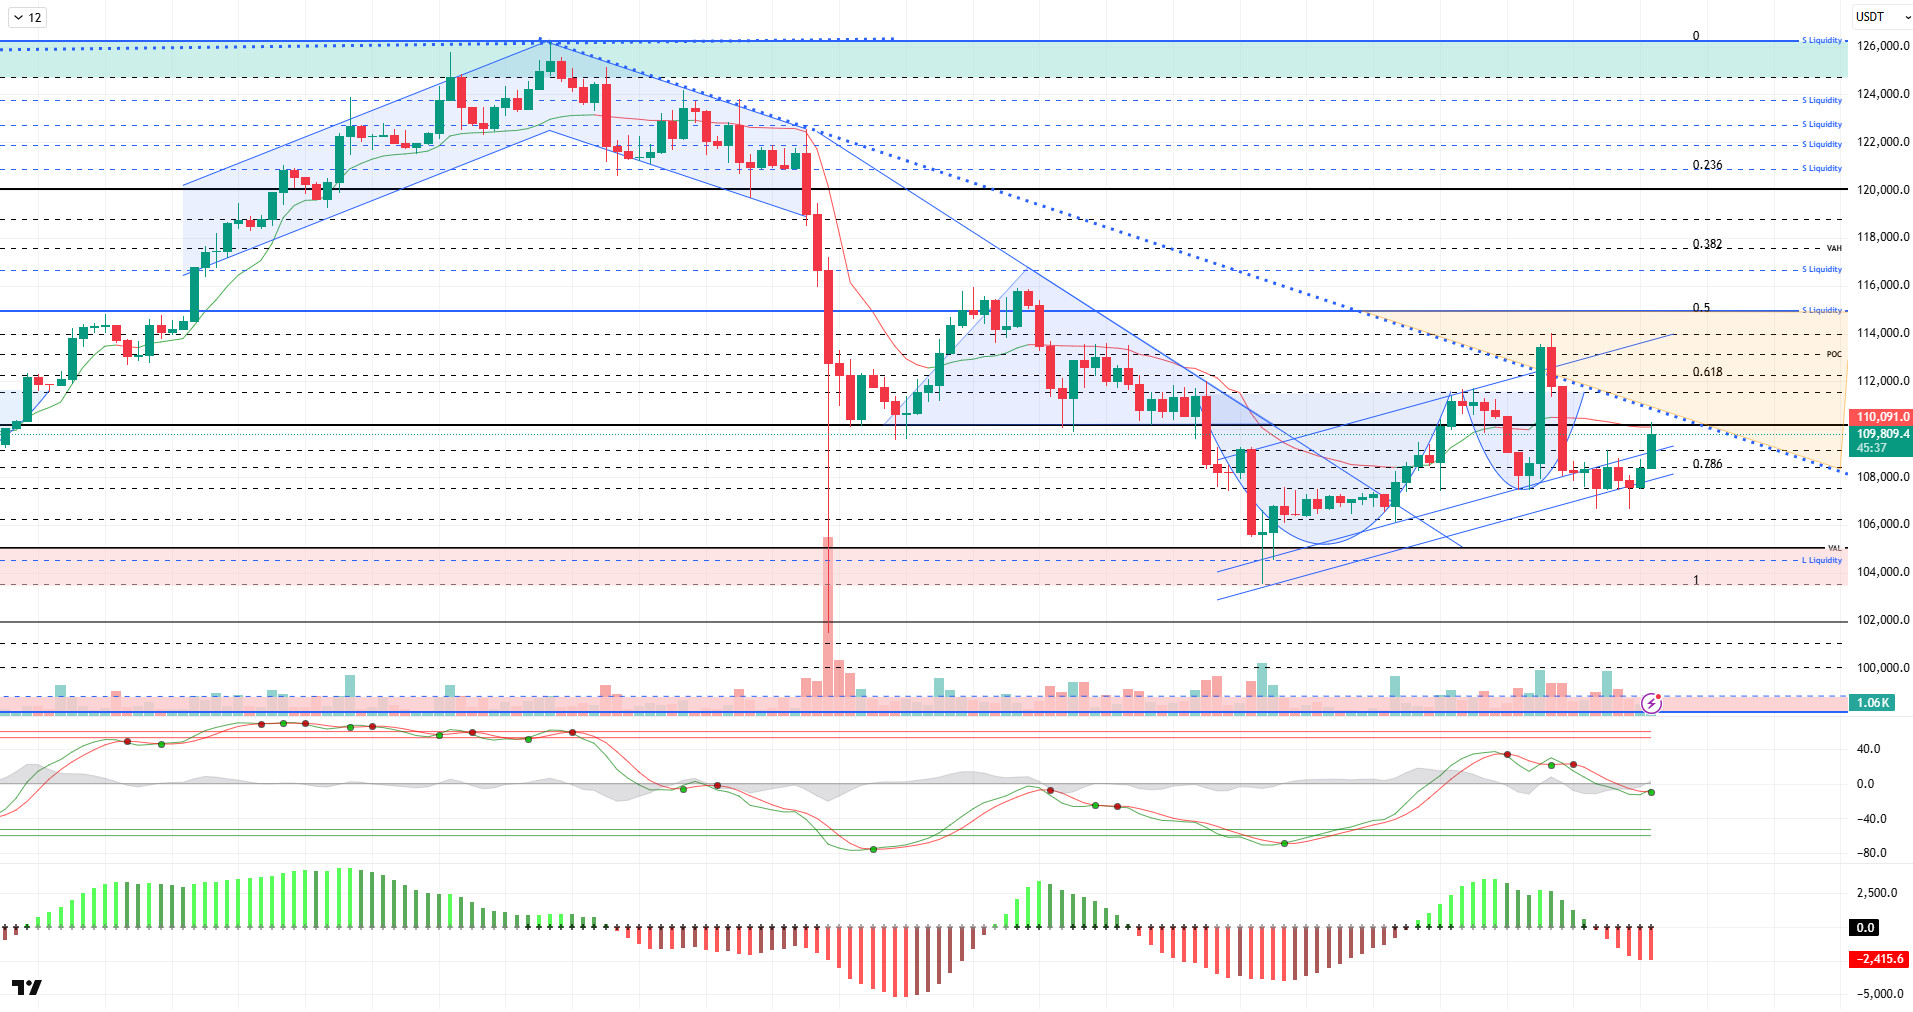
From a technical perspective, compared to the previous analysis, BTC fell below the lower trend channel and settled into a trend extension. After testing the 106,600 level for the second time, it rebounded and re-entered the trend channel. At the time of writing, BTC is testing the 110,000 level and attempting to break above it.
Technical indicators show the Wave Trend (WT) oscillator producing a buy signal in the channel’s middle band, signaling a parallel upward trend reversal. The Squeeze Momentum (SM) indicator’s histogram is attempting to regain momentum within the negative zone. The Kaufman Moving Average (KAMA) is currently at $110,093, positioned just above the price.
According to liquidation data, although the 106,600 level has been cleared in the short-term buying range, intensity continues at the 106,000 level. In a broader time frame, another buying range continues to maintain its intensity at the 104,300 level. In contrast, the selling level is recorded at 111,300 in the short term, followed by intensity in the 114,000-115,000 band.
In summary, on the fundamental side, setbacks in the reconciliation process between the US and China are causing continued strong selling pressure in the market. Statements from the Trump camp continue to be decisive for the direction of the markets during this period. The lack of concrete developments regarding the reopening of the US government is another factor that investors are watching closely. On the other hand, the search for a solution on the Russia-Ukraine front, carried out with the support of the EU, stands out as an optimistic development for the markets. Technically, BTC continues to test the 110,000 reference level, while liquidity data shows a decrease in the selling level. In the coming period, the price holding within the minor rising channel stands out as a critical threshold, while closes above the 110,000 level could make the 115,000 level a target. In the event of potential selling pressure, 107,400 has become an important support area.
Supports: 107,400 – 106,600 – 105,000
Resistances: 108,500 – 110,000 – 111,400
ETH/USDT
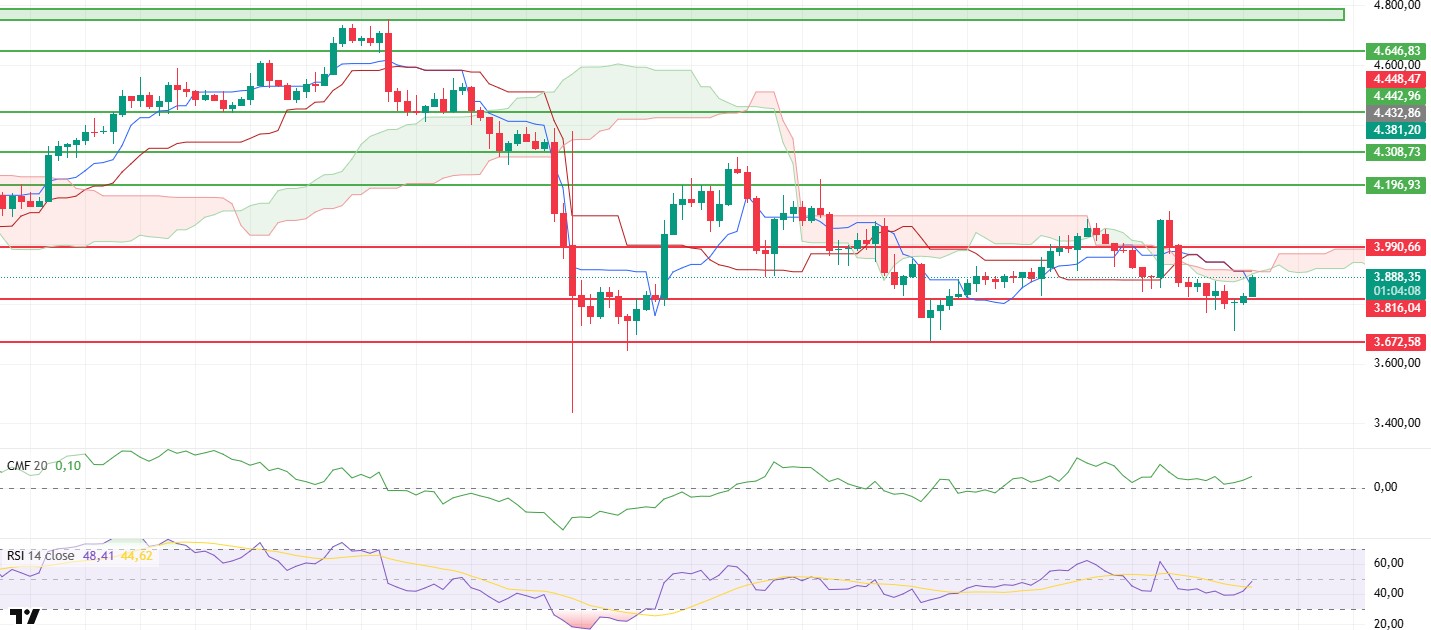
After losing its support at $3,816 yesterday evening, selling pressure on ETH accelerated and the price fell to $3,710. This area has emerged as a strong demand zone where buyers have stepped in over the past few days. Indeed, with rebound buying from this level, the price reversed its direction upward and rose to $3,890 after the opening of the Asian session. This recovery indicates that buyers are defending the bottom of the market in the short term and that momentum is starting to build upward again.
The Chaikin Money Flow (CMF) indicator has started to accelerate upward in positive territory. The CMF gaining strength indicates that liquidity continues to flow into the market and capital flows are shifting back toward buyers. This structure reveals that selling pressure is weakening and the price is being supported by buyers at current levels. If the CMF continues to remain positive in this manner, it appears possible for the price to find a more stable upward trajectory.
The Relative Strength Index (RSI) has risen to the 50 level, indicating that the momentum that had weakened in recent days is regaining strength. The RSI reaching the 50 threshold signals the beginning of a shift from neutral to positive territory in the market. This outlook supports increased buying interest in the short term and the possibility of prices regaining upward momentum. However, the RSI’s ability to remain above the 50 level is critical for the continuation of this upward trend.
According to the Ichimoku indicator, the price has reached the lower band of the kumo cloud again. This level represents an important threshold for determining the short-term direction. If the price rises above the kumo cloud, it could be interpreted as a sign that the downtrend is weakening and the market is signaling an upward reversal. On the other hand, the narrowing distance between the Tenkan and Kijun lines is an early signal that buyer momentum may strengthen in the short term. However, the price remaining below the cloud indicates that the downtrend has not yet fully ended from a technical perspective.
The overall outlook indicates that the market is at a decision point. The price is currently trading around $3,890, a critical resistance level. If it manages to stay above this level during the day, an increase towards $3,990 can be expected. Breaking above $3,990 could accelerate the rise and pave the way for the price to move towards the $4,190 region. On the downside, the $3,816 level stands out as an important support point. Closing below this level could lead to renewed selling pressure and cause the price to retreat towards the $3,740 – $3,672 range. Volatility is expected to remain high in the short term, and market participants should be cautious about determining direction in this region.
Top of Form
Below the Form
Support Levels: 3,816 – 3,672 – 3,500
Resistances: 3,990 – 4,196 – 4,308
XRP/USDT
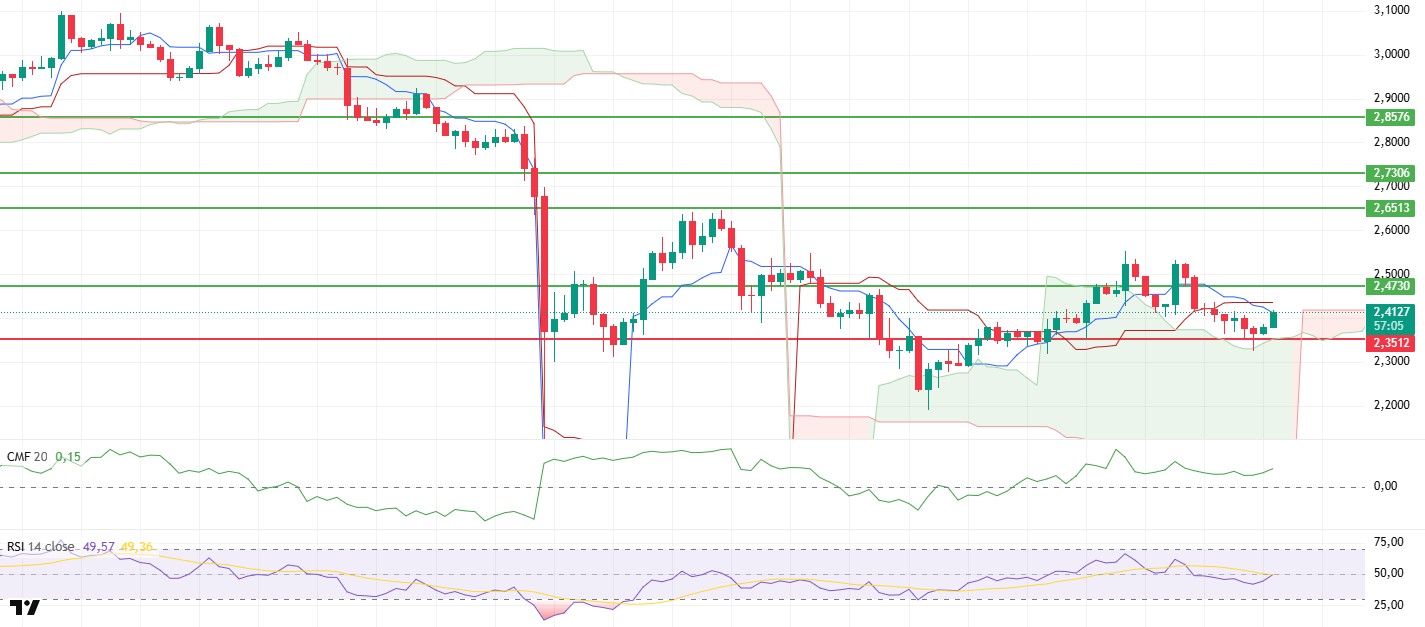
After falling to the upper band of the cloud yesterday evening, the XRP price rebounded from this area and stabilized at the $2.41 level. This intraday movement indicates that the market continues to search for direction in the short term, but buyers have regained strength with the support of the cloud.
The Chaikin Money Flow (CMF) indicator continues its upward movement in positive territory. This outlook indicates that liquidity continues to flow into the market and capital flows are strengthening in the direction of buyers. The CMF’s continued presence in positive territory technically supports the short-term upside expectation.
The Relative Strength Index (RSI) indicator also signals increasing momentum. The upward trend of the RSI indicates that buying interest is strengthening and that the price is finding support at current levels. This situation signals that buyers are beginning to regain control in the short term.
The overall structure of the Ichimoku indicator remains unchanged. The price staying above the kumo cloud confirms that the main uptrend is technically continuing. The Tenkan and Kijun lines moving close to each other indicate that the market is in a consolidation phase, but the potential for an upward breakout is increasing.
The overall outlook suggests that short-term upside expectations for the XRP price are coming to the fore. If the price manages to hold above $2.41, a move towards the $2.47 resistance level can be expected. Breaking above this level could pave the way for the uptrend to gain momentum and for the price to advance towards the $2.53 region. Below, the $2.35 level remains a critical support. A pullback below this level could weaken the short-term bullish scenario.
Supports: $2.3512 – $2.2100 – $2.0768
Resistances: 2.4730 – 2.6513 – 2.7306
SOL/USDT
Mercer Park Opportunities and Cube Group announced a $3 billion merger. $500 million has been allocated to purchase SOL tokens for the treasury.
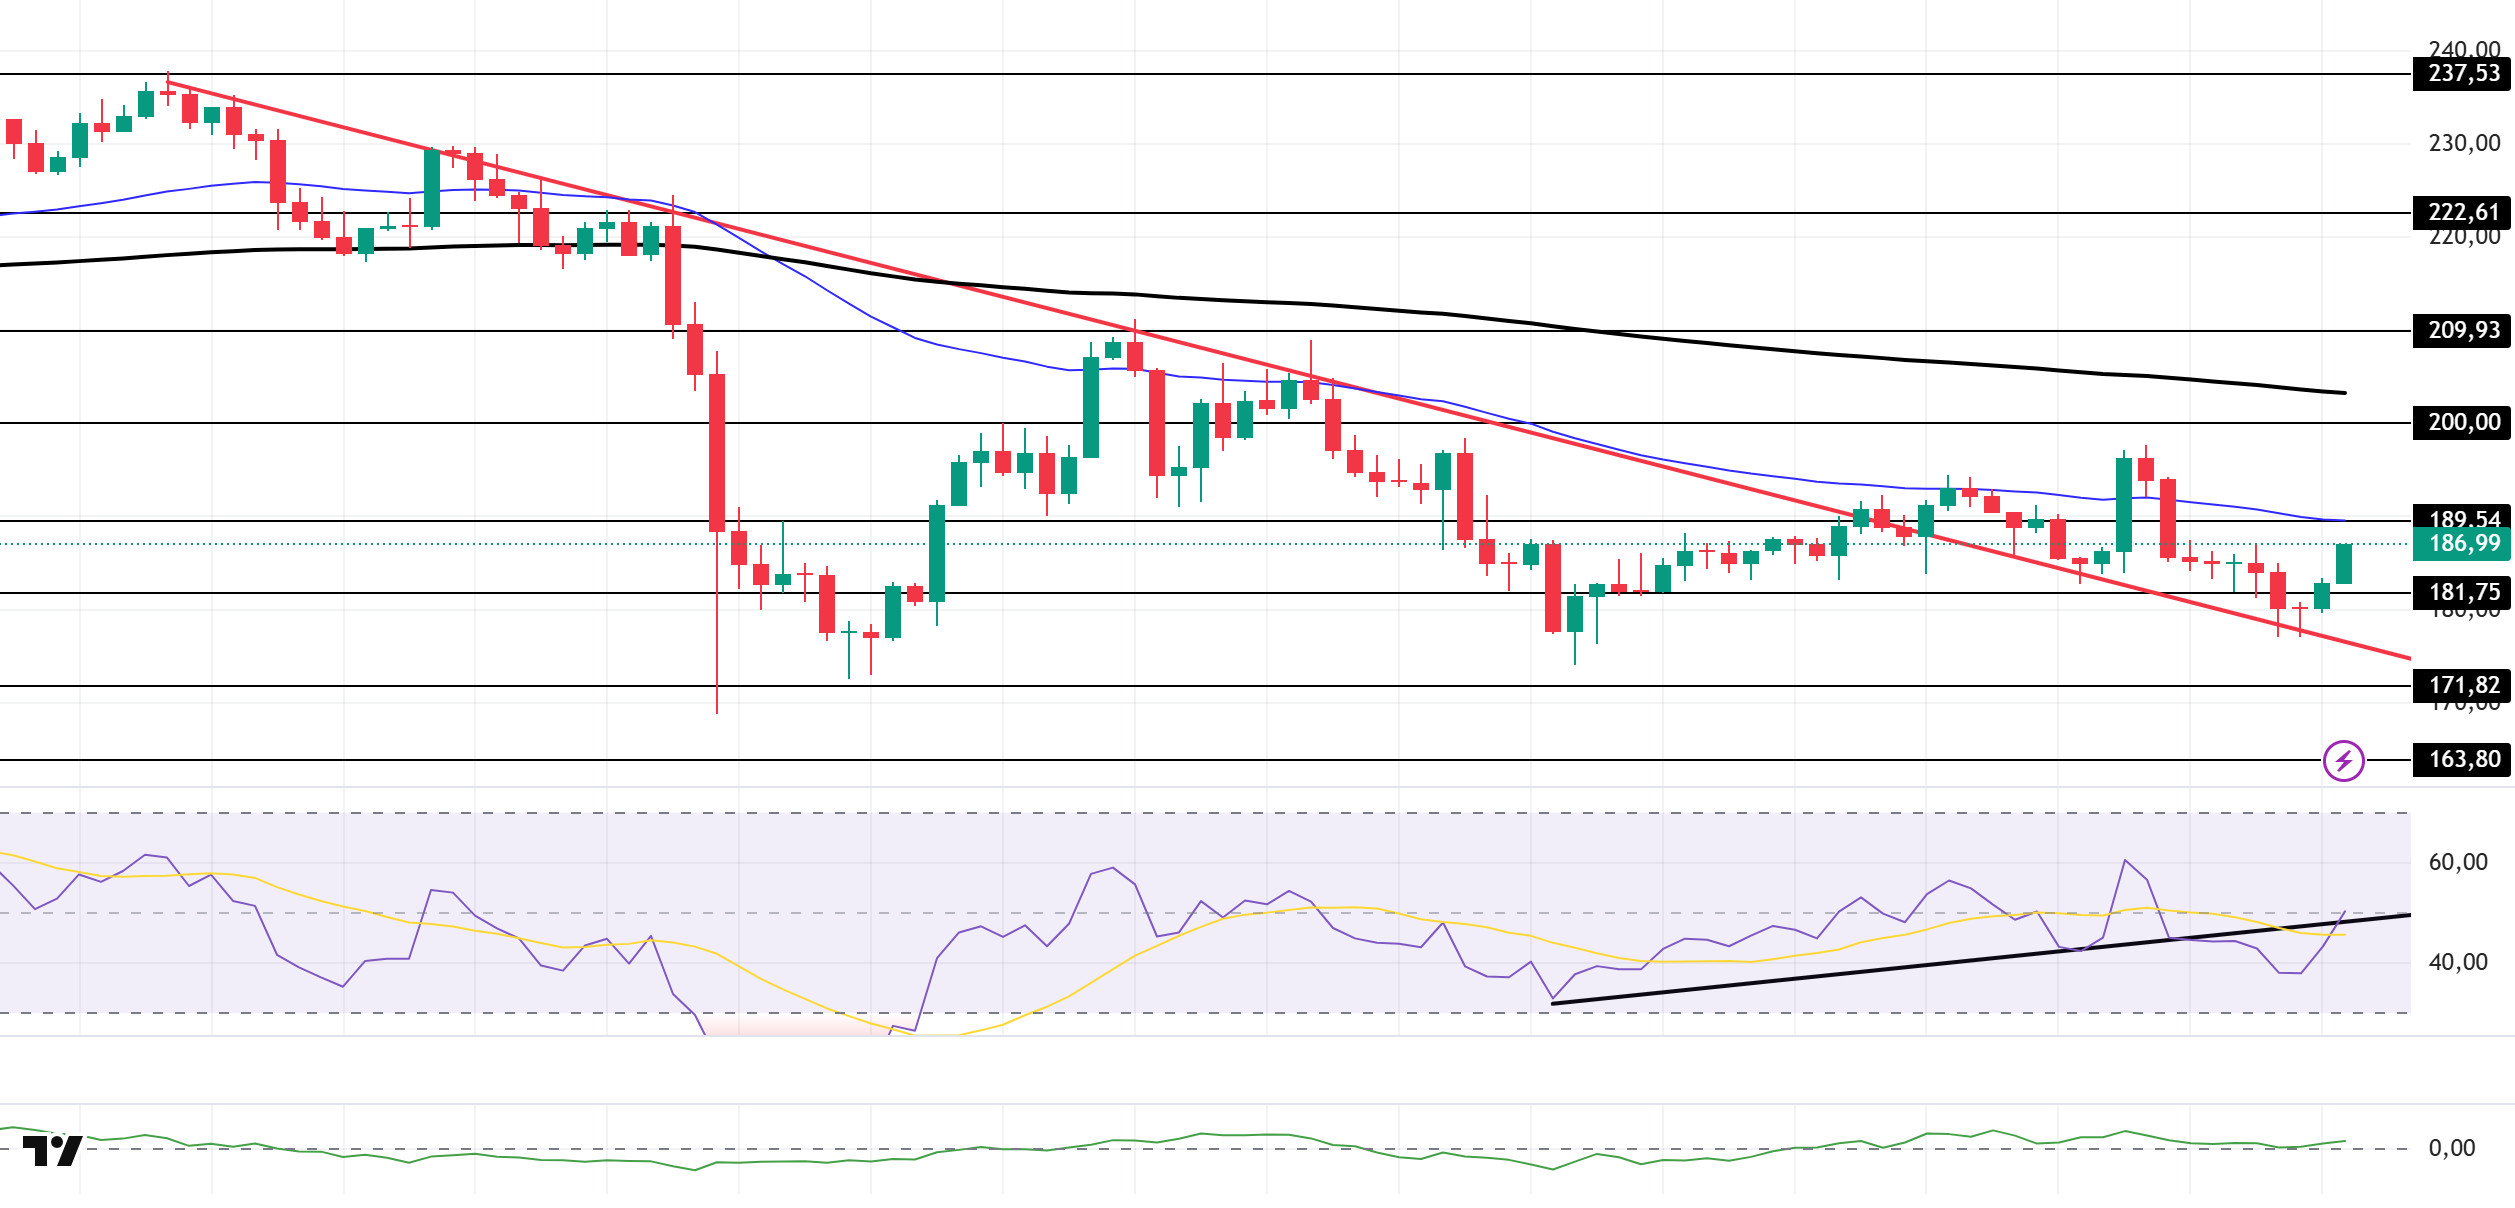
The SOL price has shown an upward trend. The asset tested the support level of the downward trend that began on October 6 and gained momentum from there, showing an upward trend. The price, which continues to rise at the moment, is preparing to test the 50 EMA (Blue Line) moving average. If the pullback begins, it may retest the downward trend.
On the 4-hour chart, it remained below the 50 EMA (Exponential Moving Average – Blue Line) and 200 EMA (Black Line). This indicates that it may be in a medium-term downtrend. At the same time, the price being below both moving averages shows us that the asset is in a short-term downtrend. The Chaikin Money Flow (CMF-20) remained in positive territory. However, an increase in money inflows could push the CMF to the upper levels of the positive zone. The Relative Strength Index (RSI-14) is in the middle of the negative zone. It is also currently testing the resistance level of the downward trend that began on October 17. If it breaks through, momentum could increase . In the event of an uptrend driven by macroeconomic data or positive news related to the Solana ecosystem, the $200.00 level stands out as a strong resistance point. If this level is broken upwards, the uptrend is expected to continue. In the event of pullbacks due to developments in the opposite direction or profit-taking, the $163.80 level could be tested. A decline to these support levels could increase buying momentum, presenting a potential opportunity for an upward move.
Supports: 181.75 – 171.82 – 163.80
Resistances: 189.54 – 200.00 – 209.93
DOGE/USDT
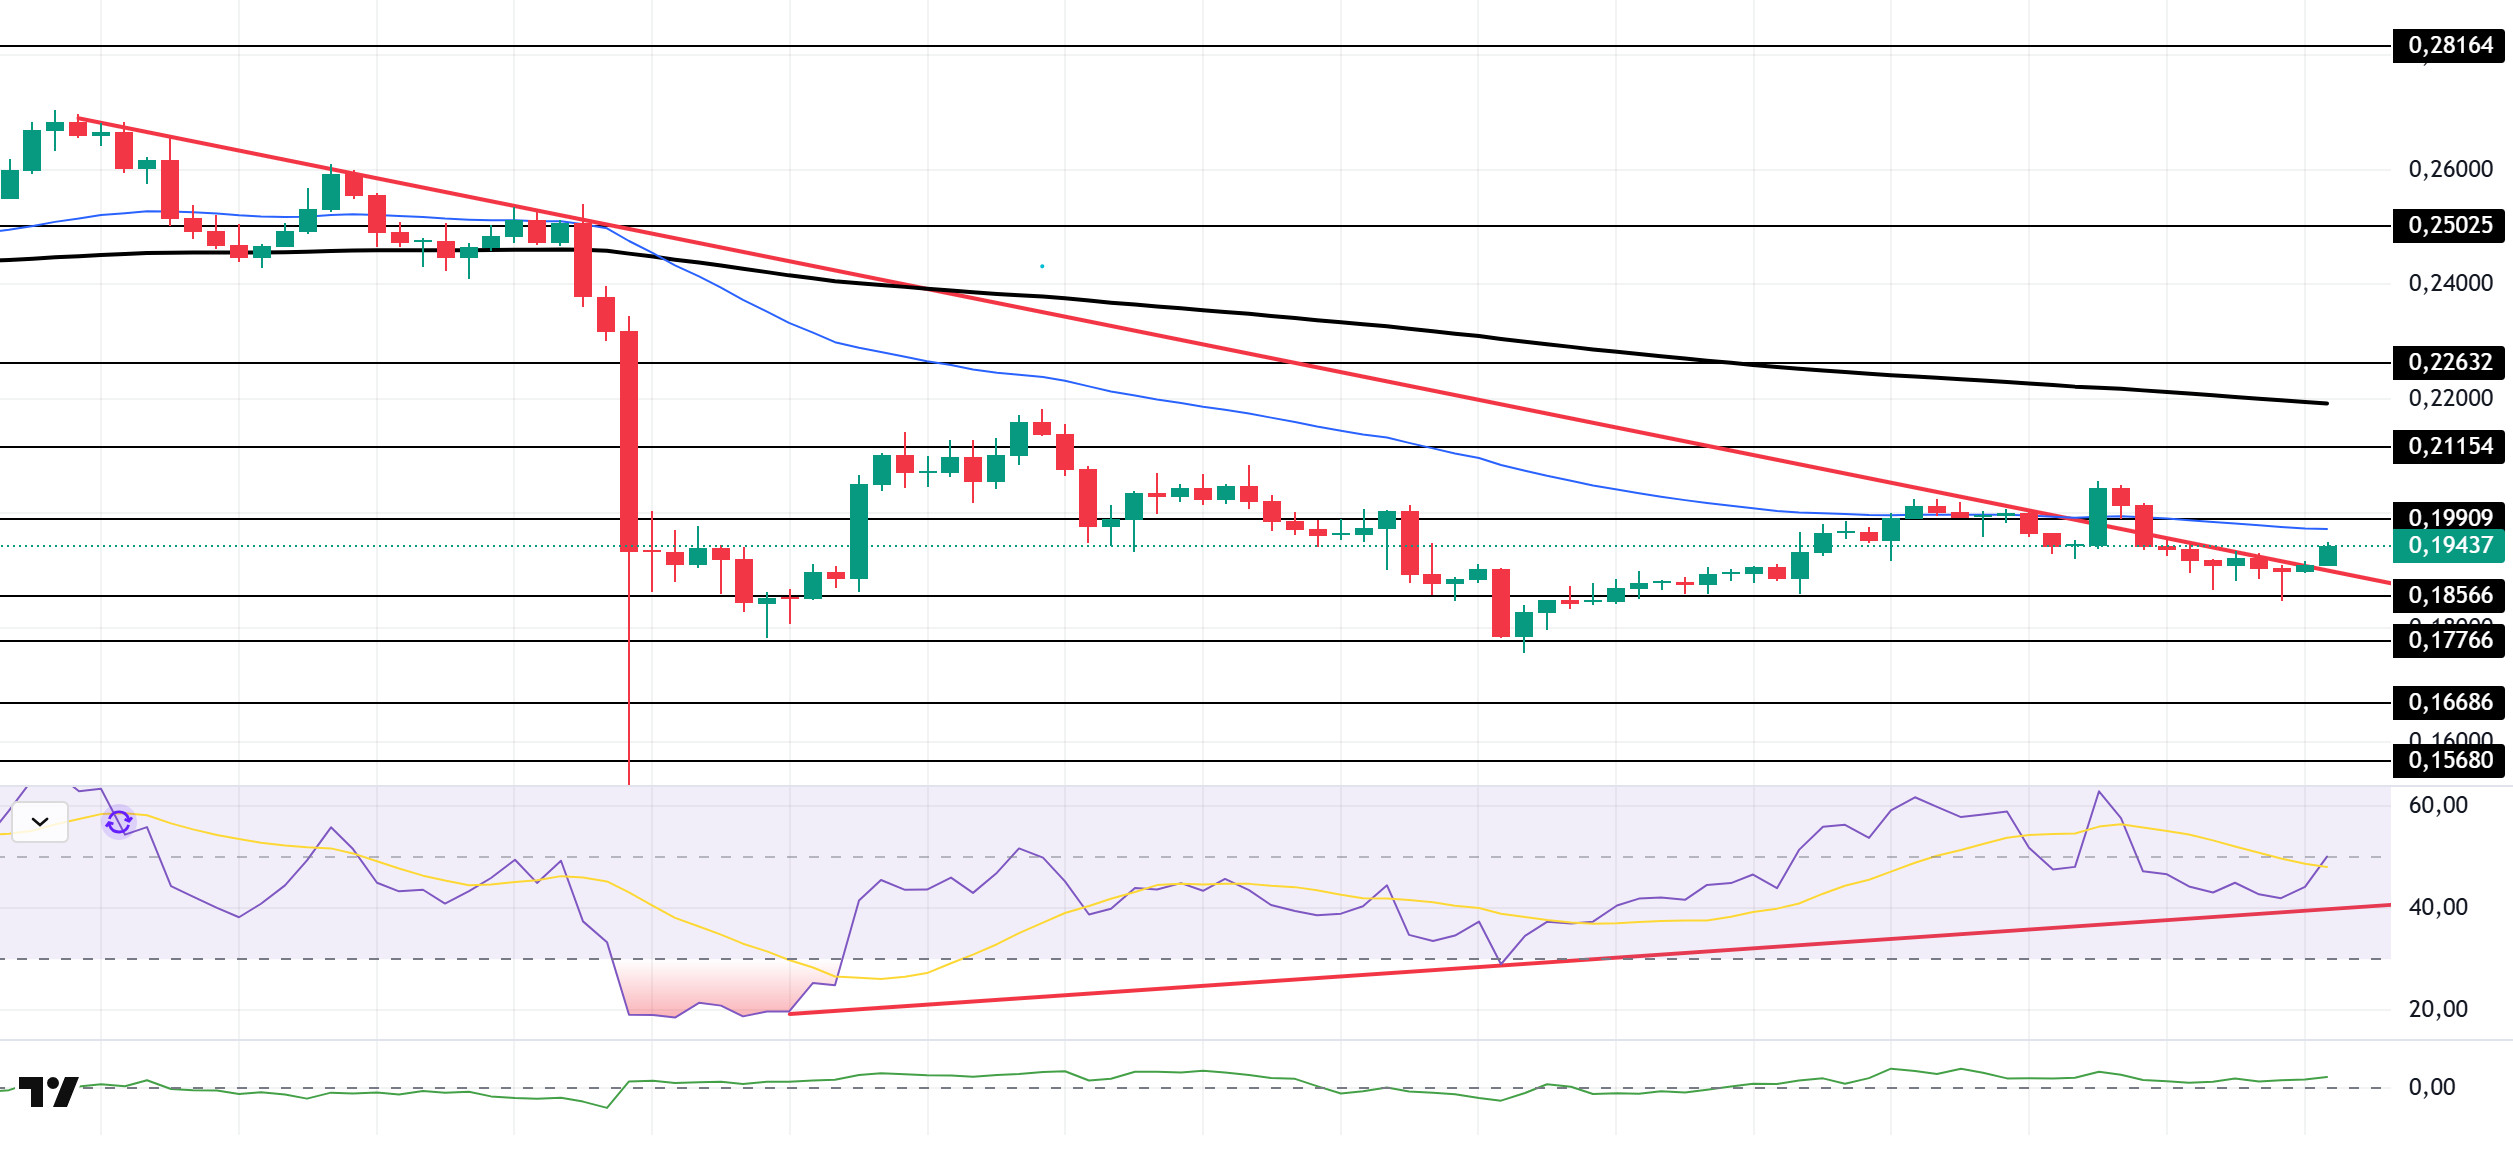
The DOGE price experienced an uptrend. The asset moved into the upper region of the downtrend that began on October 6. This could trigger an uptrend. Currently testing the 50 EMA (Blue Line) moving average as resistance, the price could test the 200 EMA (Black Line) moving average if it closes above this level. Should a pullback begin, the strong support level at $0.17766 should be monitored.
On the 4-hour chart, the 50 EMA (Exponential Moving Average – Blue Line) remained below the 200 EMA (Black Line). This indicates that a downtrend may begin in the medium term. The price being below both moving averages shows that the price is trending downward in the short term. The Chaikin Money Flow (CMF-20) continues to hold its positive position. Additionally, a decrease in money inflows could push the CMF into negative territory. The Relative Strength Index (RSI-14) remains above the upward trend that began on October 12. It has also risen to a neutral level. This indicates an increase in the upward trend. In the event of potential increases driven by political developments, macroeconomic data, or positive news flow within the DOGE ecosystem, the $0.21154 level stands out as a strong resistance zone. Conversely, in the event of negative news flow, the $0.16686 level could be triggered. A decline to these levels could increase momentum and initiate a new wave of upward movement.
Supports: $0.18566 – $0.17766 – $0.16686
Resistances: 0.19909 – 0.21154 – 0.22632
AVAX/USDT
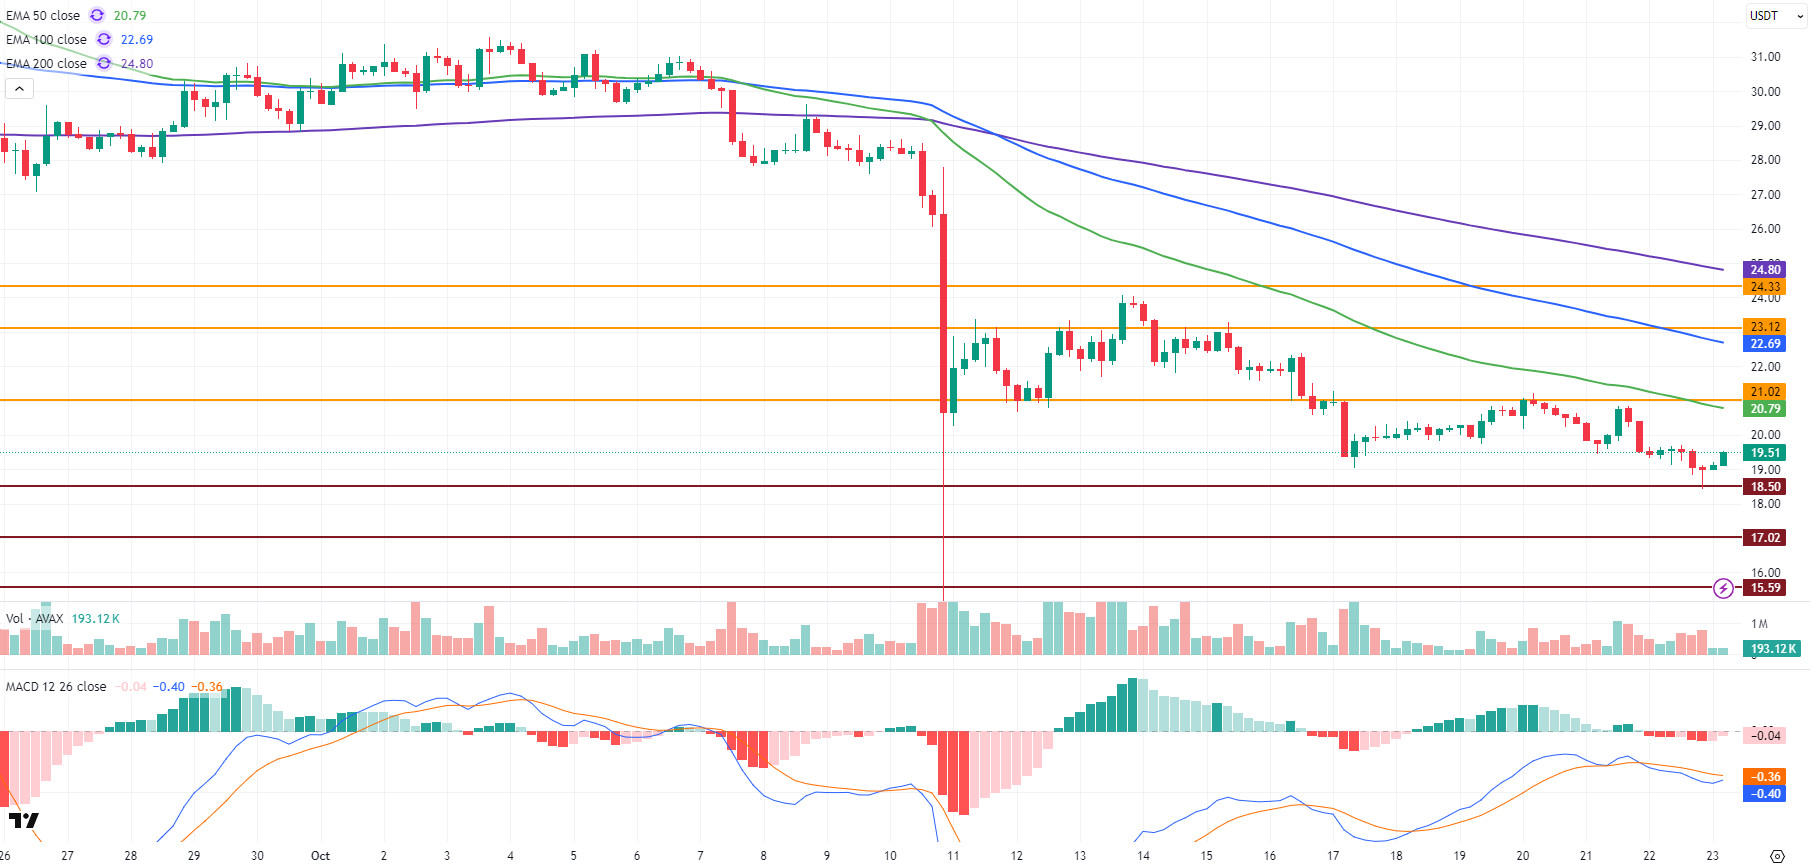
AVAX started the day at $19.54 yesterday and fell to $18.50 during the day due to selling pressure. With the buying at this level, the price recovered and closed the day at $19.02. AVAX, which lost approximately 2.65% of its value on a daily basis yesterday, started the new day with an increase and is currently trading at $19.50. While uncertainty continues in the cryptocurrency market, price movements remain weak in low-volume market conditions. On the Avalanche ecosystem side, positive developments continue. Over 500 projects are being built on the Avalanche network, and the ecosystem continues to grow day by day. This development is an important indicator supporting the activity and long-term potential of the Avalanche community and developers. However, the uncertainty in general market conditions and the low-volume environment prevent these positive developments from having a significant impact on the AVAX price in the short term.
On the 4-hour chart, the Moving Average Convergence/Divergence (MACD) line continues to trade below the signal line. However, with today’s rise, the MACD has turned upward. If the MACD line crosses above the signal line, this could lead to stronger momentum and an acceleration of the uptrend. AVAX is still trading below critical Exponential Moving Average (EMA) levels. This indicates that the technical outlook remains negative, but a potential rebound could strengthen positive momentum if EMA levels are broken upwards.
From a technical perspective, the $21.02 level remains the first strong resistance level for AVAX. If it manages to hold above this level, AVAX could rise to $23.12 and then $24.33. In a downward movement, the $18.50 support level could be retested. If this level is broken during AVAX’s decline and closes below it, selling pressure may increase and AVAX could retreat to the $17.02 and $15.59 levels. In the overall outlook, although the MACD has not yet produced a positive signal, the direction is upward, indicating that the possibility of a short-term recovery remains intact. However, the price structure continues to trade below the EMAs, keeping the trend in negative territory. A short-term recovery for AVAX could accelerate if volume increases and closes above $21 occur. Otherwise, it could decline amid low-volume market conditions and selling pressure.
(EMA50: Green Line, EMA100: Blue Line, EMA200: Purple Line)
Support Levels: 18.50 – 17.02 – 15.59
Resistances: 21.02 – 23.12 – 24.33
Legal Notice
The investment information, comments, and recommendations contained herein do not constitute investment advice. Investment advisory services are provided individually by authorized institutions taking into account the risk and return preferences of individuals. The comments and recommendations contained herein are of a general nature. These recommendations may not be suitable for your financial situation and risk and return preferences. Therefore, making an investment decision based solely on the information contained herein may not produce results in line with your expectations.

