
Technical Analysis
BTC/USDT
The White House has confirmed that Trump and Xi Jinping will meet on October 30. Ahead of the meeting, Treasury Secretary Bessent and Chinese Vice Premier He Lifeng are expected to hold preliminary talks in Malaysia. The main agenda of the meeting will be trade disputes and the fentanyl issue. The Washington administration plans to investigate China’s compliance with its commitments under the 2020 trade agreement under Section 301. This step could increase tensions ahead of the summit. While Trump announced that he had suspended all trade talks with Canada, the EU approved its 19th sanctions package against Russia. Putin stated that the meeting had been postponed, not canceled, and that they were open to dialogue. However, leading Chinese energy companies CNPC, Sinopec, and CNOOC have temporarily halted purchases of Russian oil due to the new sanctions. The EU approved a new two-year financial support package for Ukraine. Meanwhile, the Trump administration announced that, contrary to claims, it has no plans to invest directly in quantum computing companies, but is only evaluating credit or option-based support mechanisms.
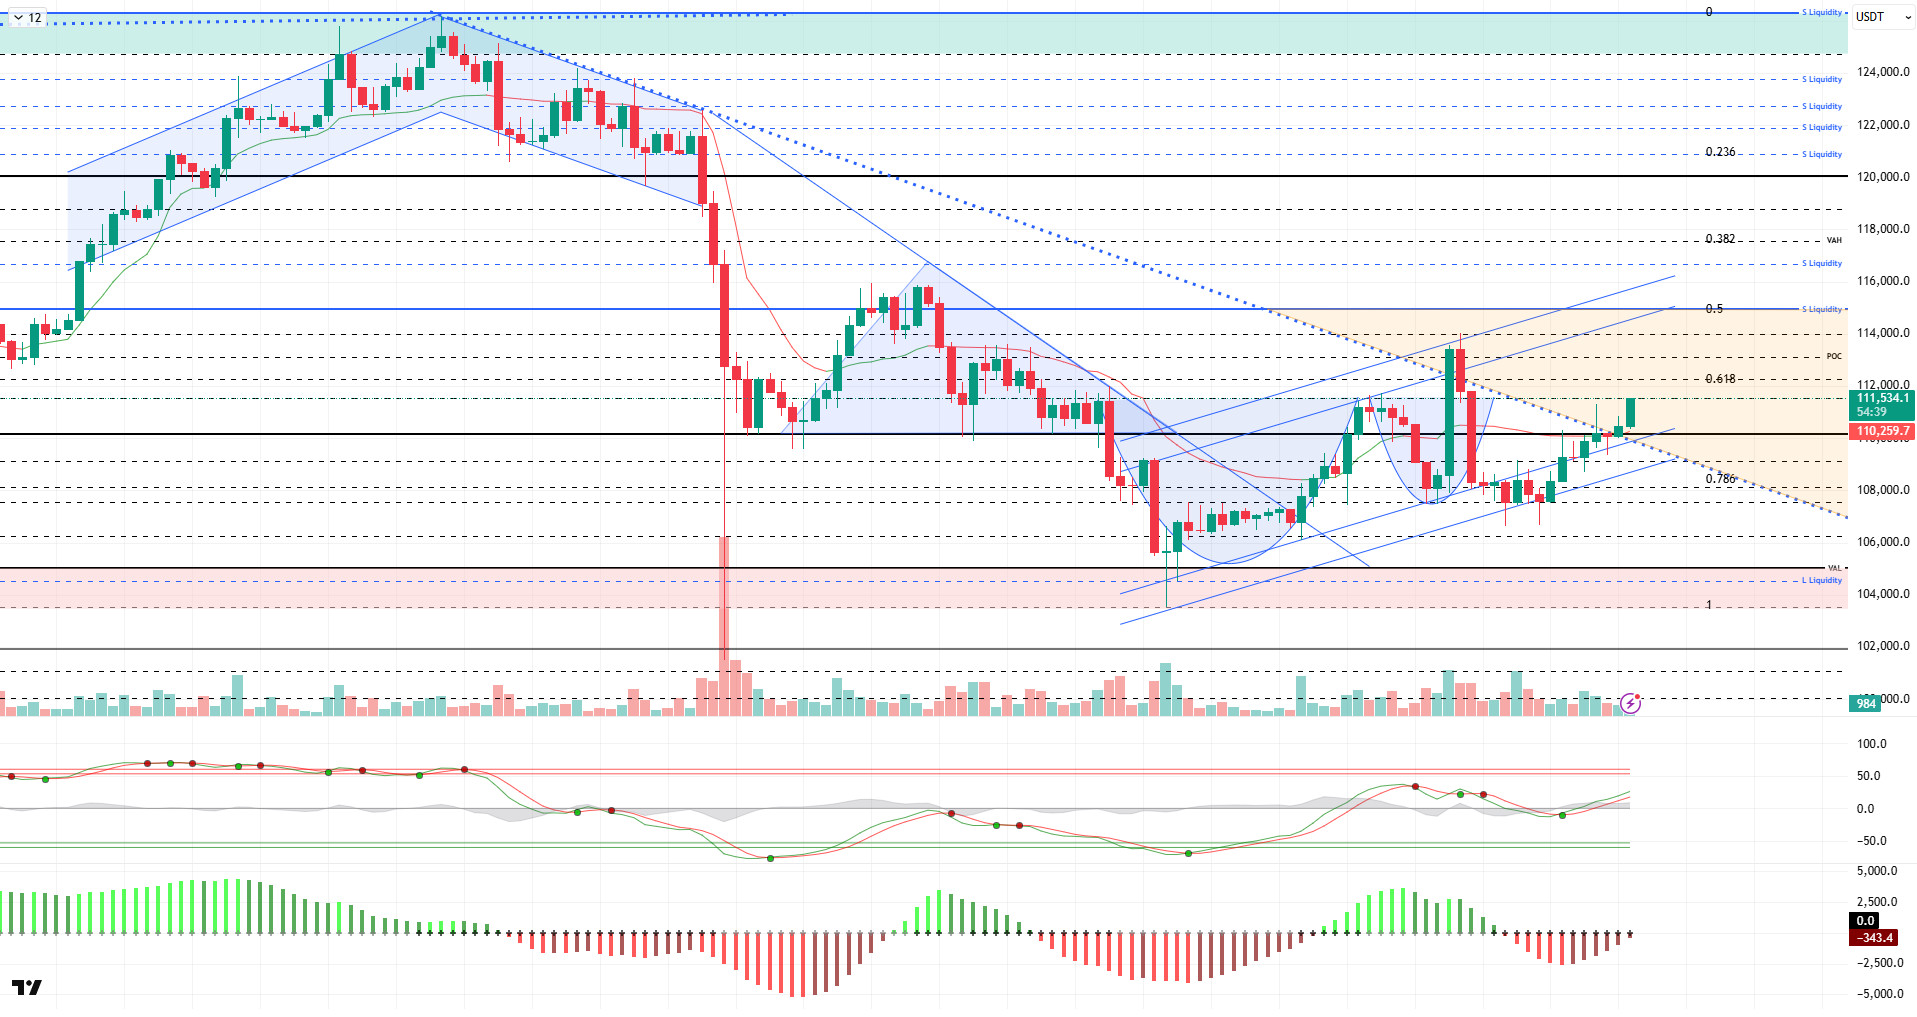
From a technical perspective, BTC, which showed low volatility movements at the lower line of the rising trend channel in the previous analysis, gained momentum during the day due to the developments mentioned above. BTC, which exceeded the critical reference level of 110,000 points in the fourth candle, reached the next resistance point at 111,400. At the time of writing this analysis, the price, moving within the orange band, headed towards the POC level.
Technical indicators showed that the Wave Trend (WT) oscillator produced a buy signal in the middle band of the channel, signaling a parallel trend reversal to the upside. The histogram in the Squeeze Momentum (SM) indicator is trying to regain momentum within the negative area. The Kaufman moving average (KAMA) is currently at $110,200, positioned below the price.
According to liquidation data, the short-term buy level has gained intensity in the 108,000–109,000 band. In a broader time frame, 106,000 and then 104,300 appear as areas of intense accumulation. In contrast, the short position was liquidated at the 111,300 level in the short term, while other short positions accumulated at 111,700, 112,300, and the increasingly concentrated 115,000 level.Over the last 24 hours, 14 million long and 28 million short trades were liquidated, with the total market volume recorded at $222 million.
In summary, while developments in the reconciliation process between the US and China were welcomed positively by the markets, Trump’s suspension of trade talks with Canada limited optimism. The lack of concrete developments regarding the reopening of the US government remains another factor creating uncertainty, while the EU continues its efforts to find a solution on the Russia-Ukraine front and its sanctions against Russia. On the technical side, BTC has once again surpassed the 110,000 reference level, and the buy-sell tier has balanced out in liquidity data. In the coming period, the price holding within the minor ascending channel stands out as a critical threshold, while closes above the 110,000 level could make the 115,000 level a target. In the event of potential selling pressure, the 110,000 level remains critical for holding in positive territory.
Supports: 110,000 – 108,500 – 107,400
Resistances: 111,400 – 112,300 – 114,000
ETH/USDT
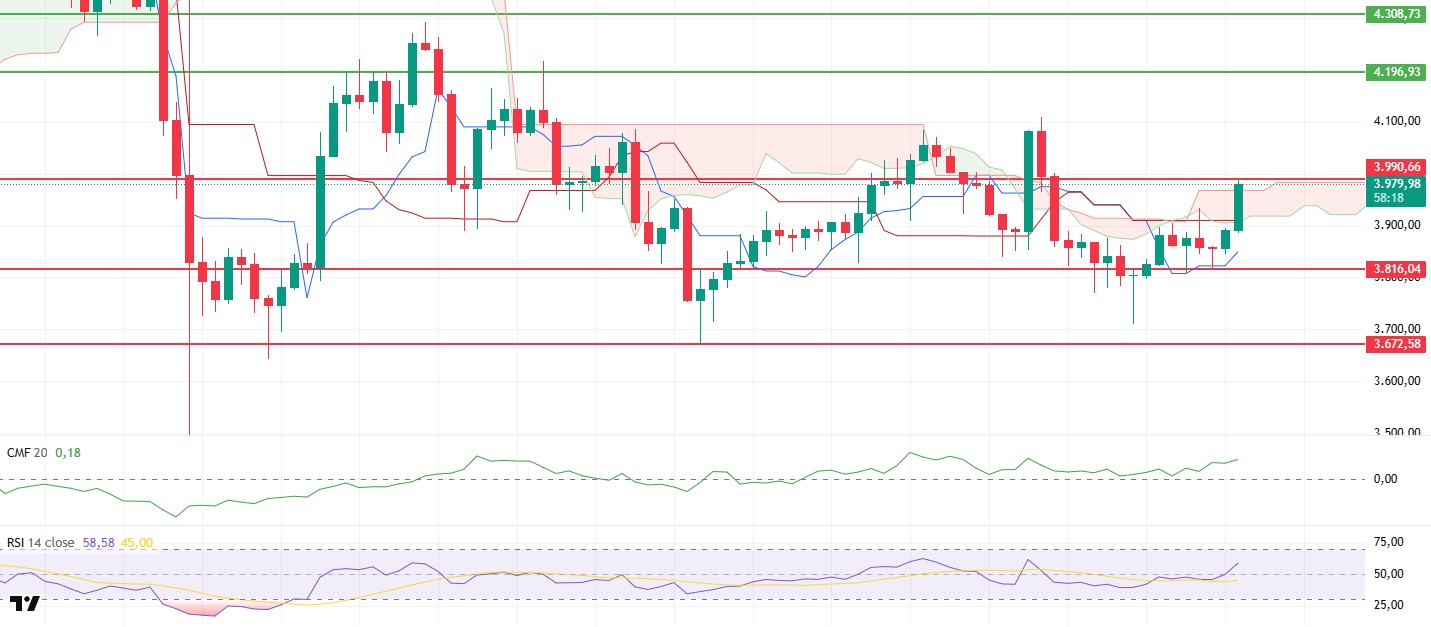
After falling to the $3,816 support zone yesterday evening, the ETH price started a strong rally this morning as buyers stepped back in. With this rally, the price reached the $3,990 resistance level during the day. This movement shows that the market has shifted back to a buyer-driven structure in the short term and that selling pressure has started to weaken. This recovery, which began at the $3,816 level, revealed increased buying interest at the bottom of the market.
The Chaikin Money Flow (CMF) indicator strengthened in positive territory, maintaining its upward momentum. This outlook confirms that there has been heavy liquidity inflows into the market and that capital flows continue to favor buyers. The CMF maintaining this positive structure indicates that the upward movement is not just a short-term reaction, but is backed by strong liquidity support. This increases the likelihood of the price holding at high levels.
In the Ichimoku indicator, the price rising above the kumo cloud is technically a significant breakout. This movement indicates that the medium-term downtrend is beginning to weaken and that a bullish reversal signal is forming. The upward trend of the Tenkan level also supports this reversal.
The Relative Strength Index (RSI) indicator also supports this positive picture. The RSI’s rapid rise above the 50 level indicates that momentum has regained strength and that buyers are increasing their influence on price movement. The RSI’s persistence in this region is critical for the sustainability of the uptrend.
The most important level to watch in the short term is the $3,990 resistance point. A break above this level could strengthen the upward momentum, and the price has the potential to extend to the $4,196 region. If the price manages to stay above this level , the trend is expected to turn positive in the medium term. Conversely, if the $3,990 level is not broken, short-term profit-taking is likely. In this scenario, the price is expected to retest the lower band of the cloud at $3,917 and attempt to hold there. This area is a critical support level for the continuation of the uptrend. The overall outlook indicates that the ETH price has gained positive momentum in the short term, but it is important to closely monitor the price reaction at the resistance zone.Top of FormBelow the Form
Supports: 3,816 – 3,672 – 3,500
Resistances: 3,990 – 4,196 – 4,308
XRP/USDT
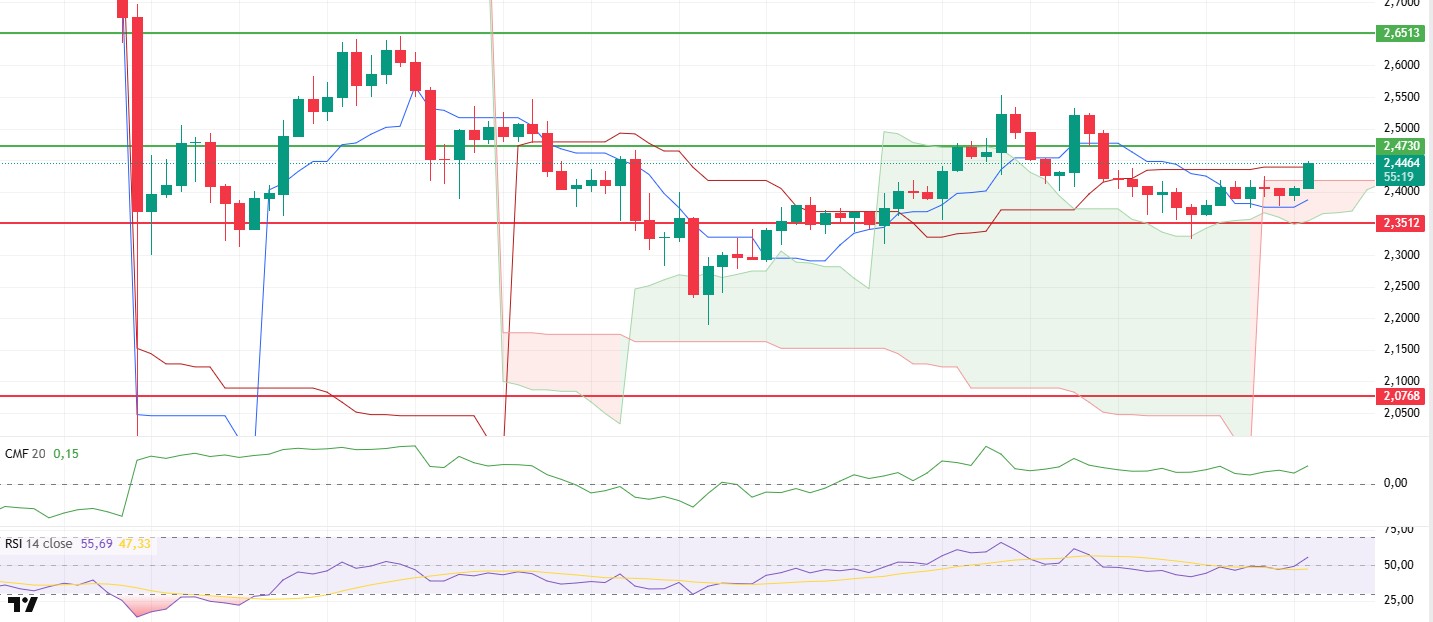
The XRP price rose to $2.44 in the morning hours with incoming purchases. This movement indicates that the price has entered a short-term recovery trend and that buyers are increasing their influence in the market. In particular, the price’s ability to hold at this level after receiving support from the upper band of the cloud yesterday signals that the upward momentum is regaining strength.
The Chaikin Money Flow (CMF) continues to show a slight upward trend in positive territory. This structure reveals that liquidity inflows into the market are continuing, albeit limited, and that capital flows are still moving in the direction of buyers. The CMF remaining in positive territory increases the likelihood of the price finding support at current levels in the short term.
The Relative Strength Index (RSI) indicator has risen above the 50 level, showing that momentum is regaining strength. The RSI’s persistence in this zone indicates that buyers may maintain their dominance in the short term. This recovery in momentum provides technical support for the price’s upward movement.
According to the Ichimoku indicator, the price continues to stay above the kumo cloud. This outlook confirms that the main trend is still positive and that the upward expectation has strengthened. The Tenkan and Kijun lines starting to converge, on the other hand, signals that the market is preparing to exit its consolidation phase and signals a potential upward breakout.
The $2.47 resistance level is critically important during the day. If this level is broken upward, buyers could gain control and the price could rise to the $2.65 region. However, if $2.47 cannot be broken, short-term profit-taking could be seen. Below, the $2.35 level remains a strong support. A drop below this level could weaken the short-term bullish scenario. The overall outlook indicates that the XRP price is maintaining its positive momentum, and its reaction at the resistance zone will be decisive in determining the direction.
Supports: 2.3512 – 2.2100 – 2.0768
Resistances: 2.4730 – 2.6513 – 2.7306
SOL/USDT
Bitwise Solana Staking ETF (BSOL) filed Form 8-A to trade on the NYSE. Fidelity integrated Solana (SOL) trading into its platforms.
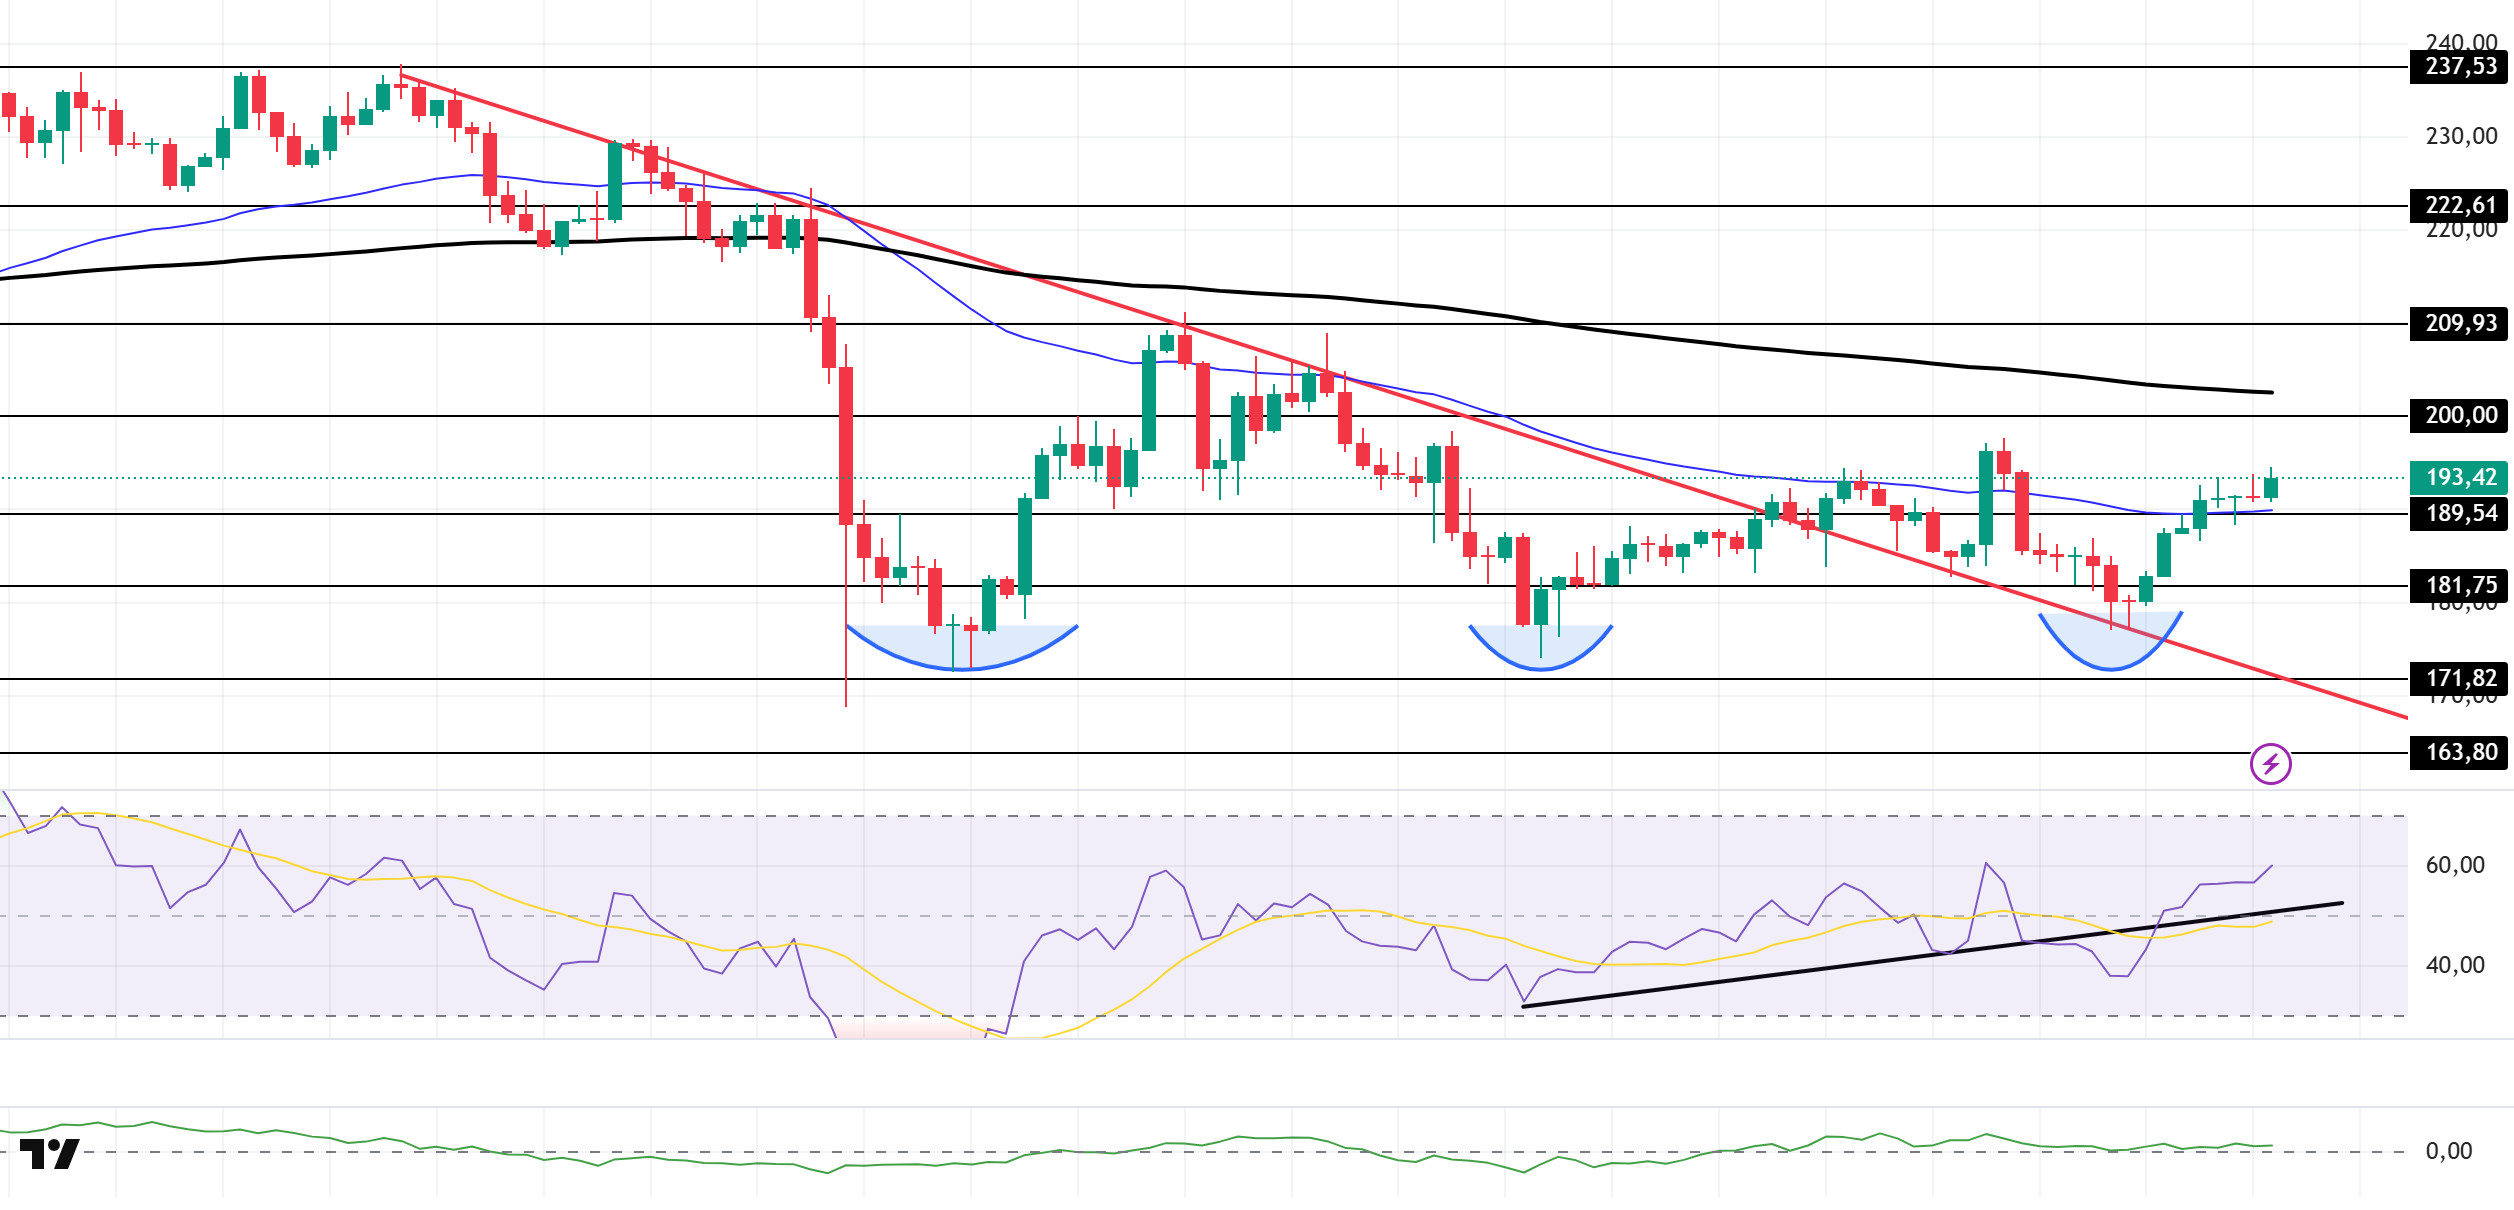
The SOL price experienced a slight increase. The asset tested the support level of the downward trend that began on October 6 and gained momentum from there, showing an upward trend. Currently continuing its upward trend, the price tested the 50 EMA (Blue Line) moving average and broke through it, maintaining its momentum. At the same time, the triple bottom formation that has formed may strengthen the upward trend. Currently continuing its upward movement, the asset may continue to the 200 EMA (Black Line) moving average if the uptrend continues. If a pullback begins, it may retest the downward trend.
On the 4-hour chart, it remained below the 50 EMA (Exponential Moving Average – Blue Line) and 200 EMA (Black Line). This indicates that it may be in a downtrend in the medium term. At the same time, the price being between the two moving averages shows us that the asset is in a decision phase in the short term. The Chaikin Money Flow (CMF-20) remained in positive territory. However, an increase in money inflows could push the CMF to the upper levels of the positive zone. The Relative Strength Index (RSI-14) also remained in positive territory. At the same time, it remained above the downward trend that began on October 17. In the event of an uptrend driven by macroeconomic data or positive news related to the Solana ecosystem, the $200.00 level stands out as a strong resistance point. If this level is broken upwards, a continuation of the uptrend to can be expected. In the event of pullbacks due to developments in the opposite direction or profit-taking, the $181.75 level could be tested. A decline to these support levels could increase buying momentum, presenting a potential opportunity for an upward move.
Supports: 189.54 – 181.75 – 171.82
Resistances: 200.00 – 209.93 – 222.61
DOGE/USDT
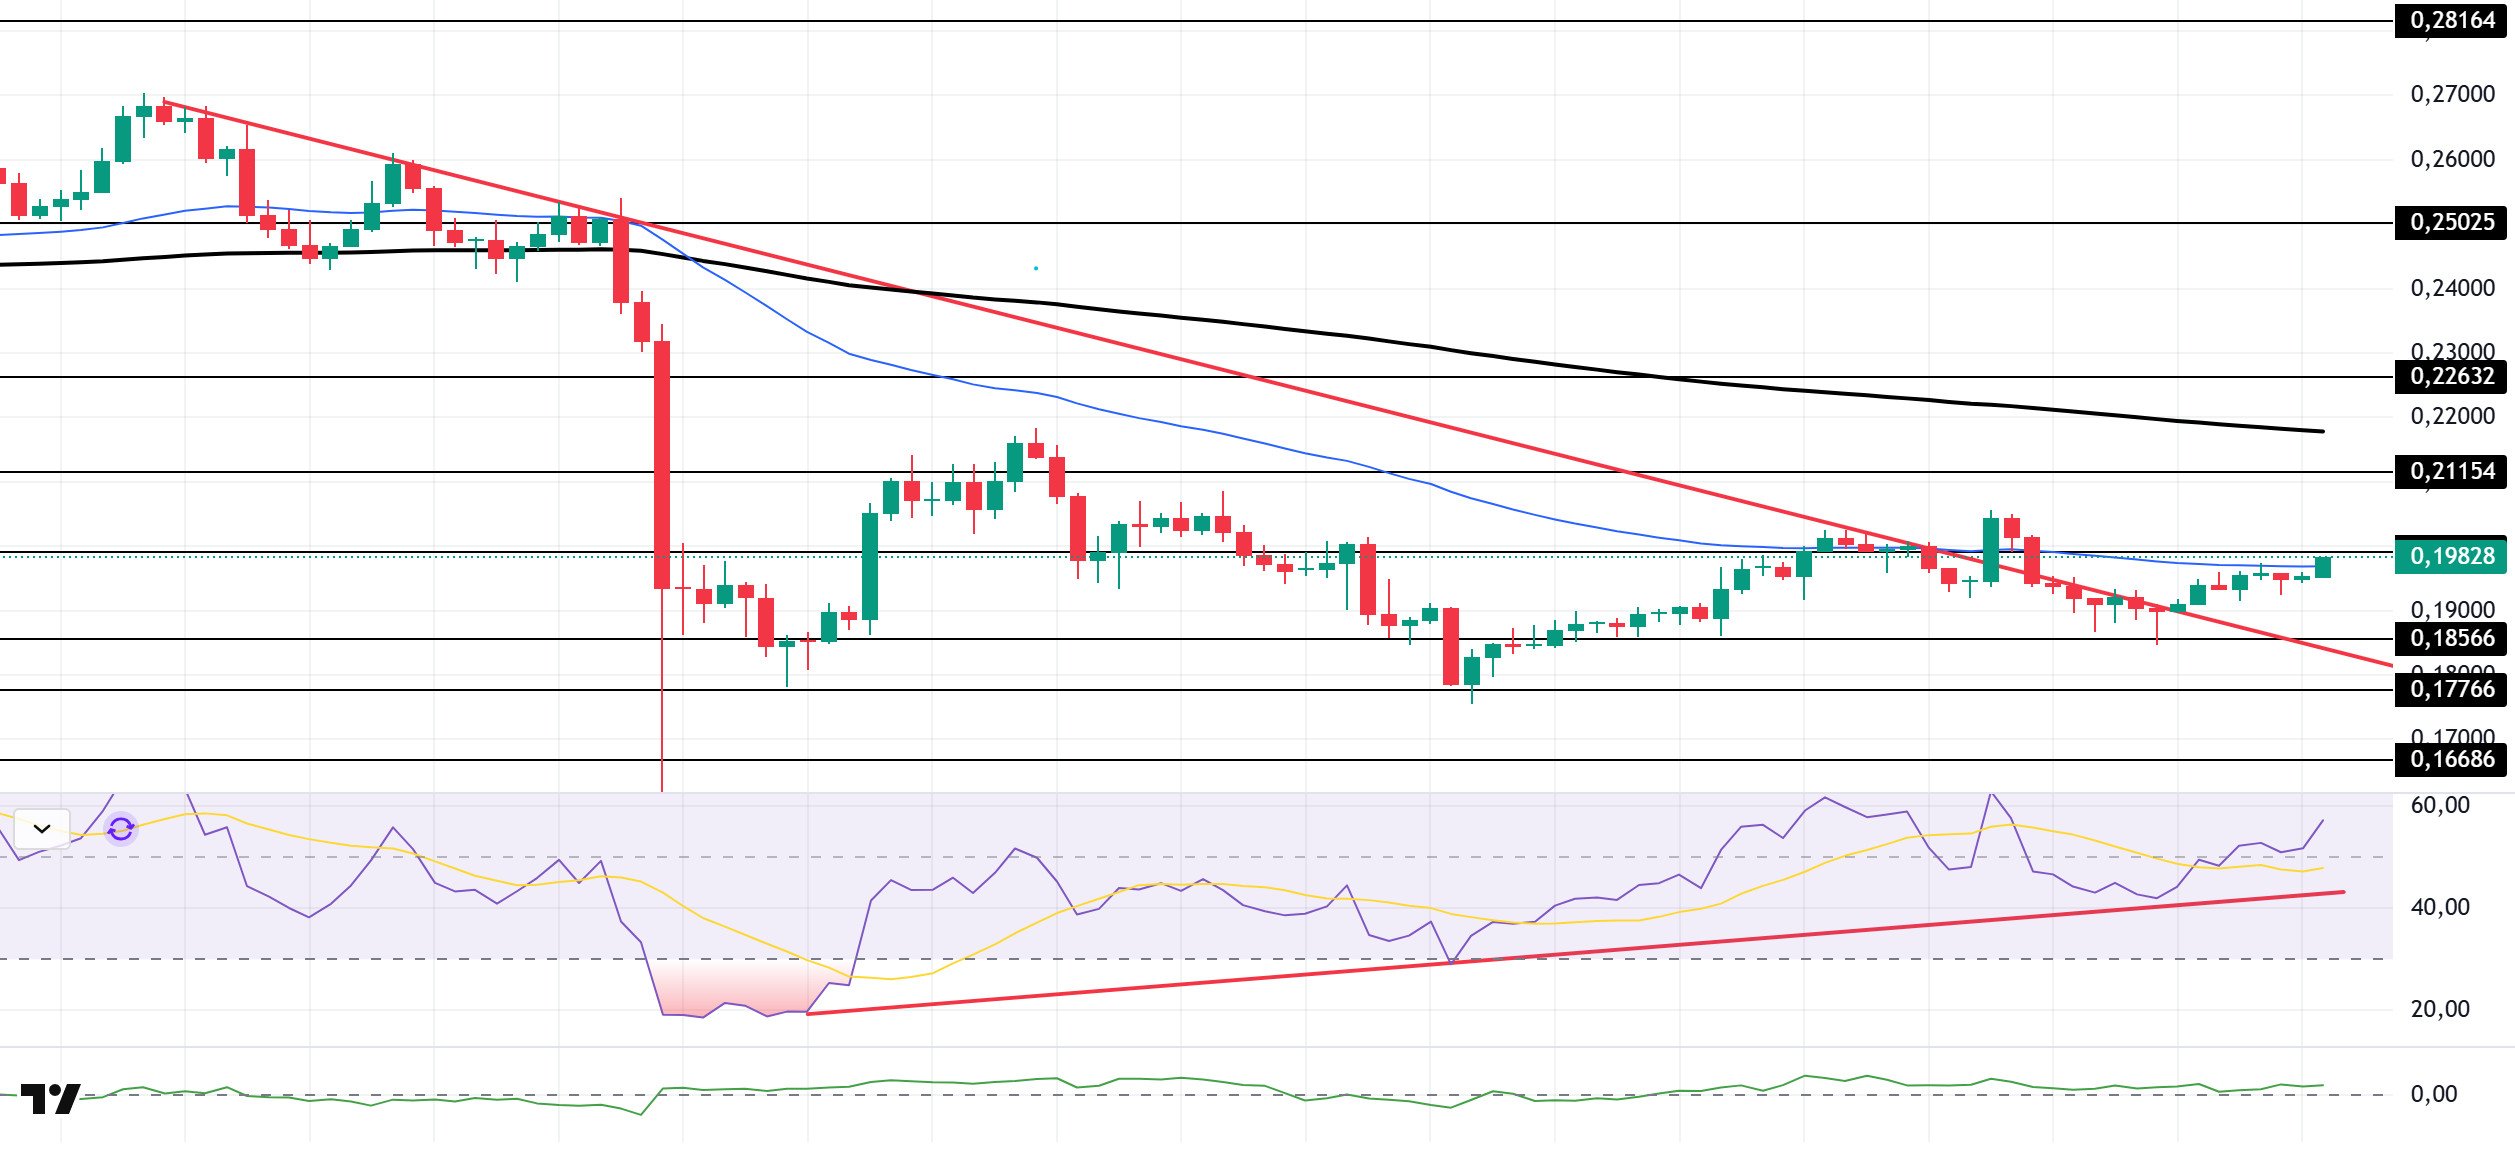
The DOGE price showed a slight increase. The asset managed to hold on to the upper region of the downward trend that began on October 6. This indicated an increase in upward pressure. Currently testing the 50 EMA (Blue Line) moving average as resistance, the price could test the 200 EMA (Black Line) moving average if it closes above the 50 EMA. Should a pullback begin, the strong support level at $0.17766 should be monitored.
On the 4-hour chart, the 50 EMA (Exponential Moving Average – Blue Line) remained below the 200 EMA (Black Line). This indicates that a downtrend may begin in the medium term. The price being below both moving averages shows that the price is trending downward in the short term. The Chaikin Money Flow (CMF-20) continues to hold its position at a positive level. Additionally, a decrease in money inflows could push the CMF into negative territory. The Relative Strength Index (RSI-14) continues to remain above the upward trend that began on October 12. It is also in the middle of the positive zone. This indicates that the upward trend may increase. In the event of an increase due to political developments, macroeconomic data, or positive news flow in the DOGE ecosystem, the $0.21154 level stands out as a strong resistance zone. Conversely, in the event of negative news flow, the $0.16686 level could be triggered. A decline to these levels could increase momentum and potentially initiate a new upward wave.
Supports: 0.18566 – 0.17766 – 0.16686
Resistances: 0.19909 – 0.21154 – 0.22632
AVAX/USDT
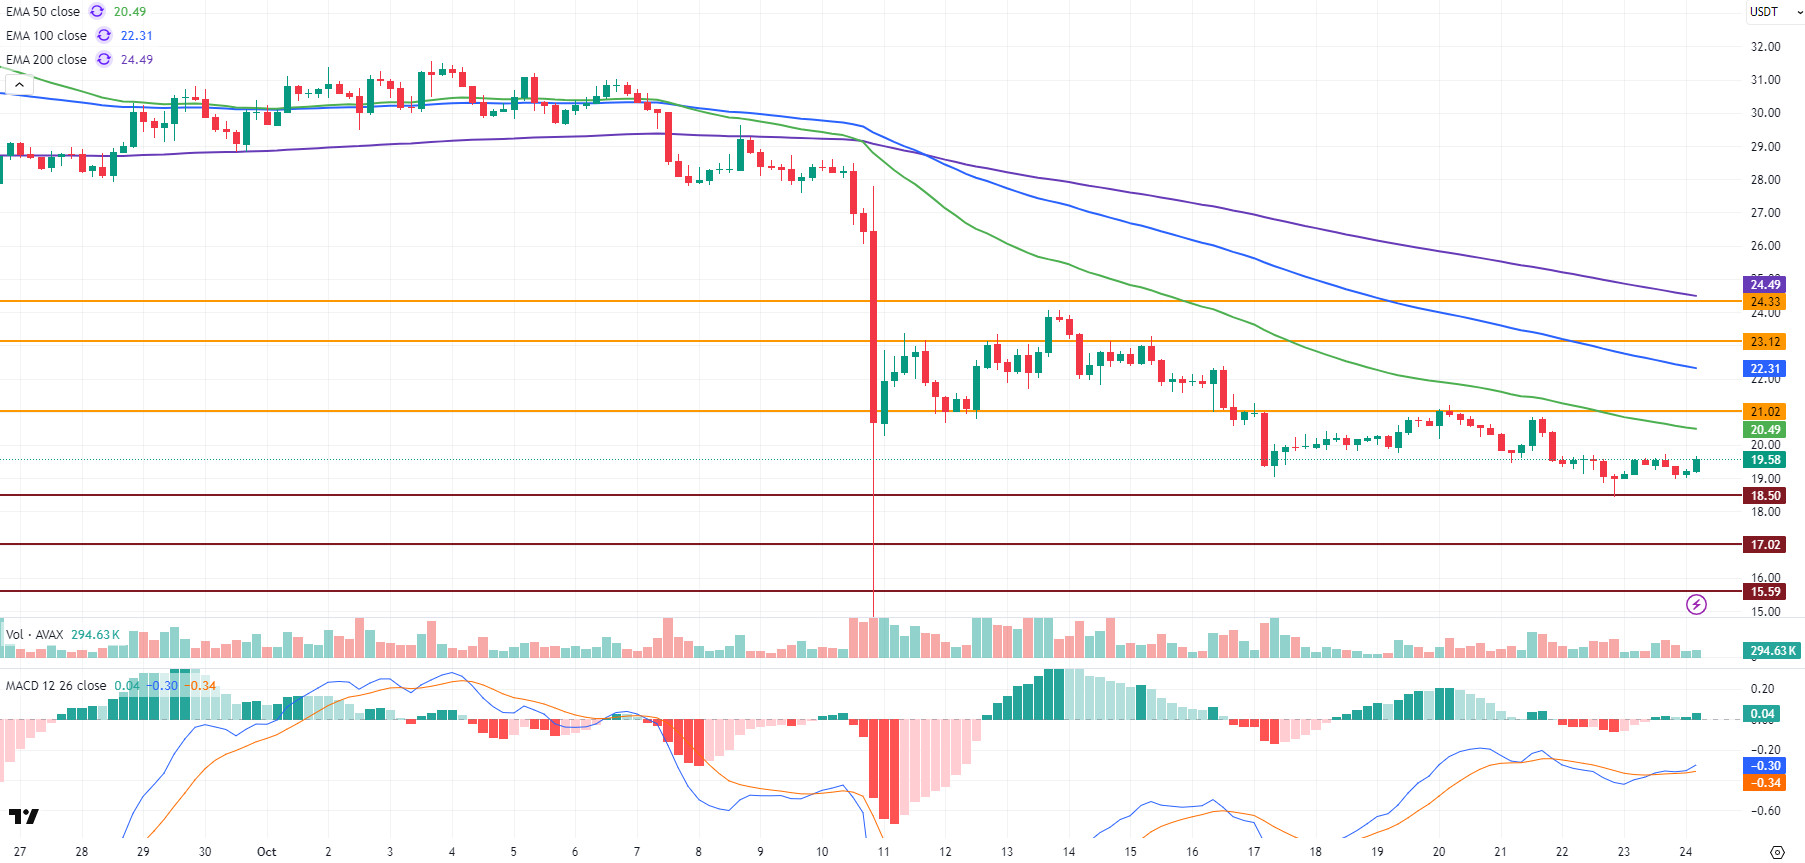
AVAX started the day at $19.02 yesterday and moved within a horizontal band during the day, closing at $19.14. AVAX, which experienced an approximate 0.65% increase in value on a daily basis yesterday, continues to trade in a weak volume and directionless market structure, as it has in recent days. The price remaining stuck in the $19.00-$19.50 range throughout the day yesterday showed that investor interest is limited and that the market is still moving cautiously. Starting the new day with an upward movement in the first two candles, as it did yesterday, AVAX is currently trading at $19.60 and has recorded an increase of approximately 2.35% compared to its opening price. While the crypto market continues to experience low volume and uncertain conditions, volatility remains limited for AVAX specifically, and it has not found a clear direction. Although there have been positive developments in the Avalanche ecosystem, low liquidity and weak investor interest in the market as a whole are preventing these positive developments from being reflected in the AVAX price in the short term.
On the 4-hour chart, the Moving Average Convergence/Divergence (MACD) line has crossed above the signal line, indicating that momentum is starting to strengthen. However, due to the still low trading volumes, this positive signal is currently limited in its ability to translate into strong momentum in the price. AVAX is still trading below critical Exponential Moving Average (EMA) levels. This indicates that the negative trend structure continues, but the narrowing gap between the price and EMA levels signals that momentum could rapidly strengthen in a potential upside scenario.
From a technical perspective, the $21.02 level remains important for AVAX rallies. If this level is breached and sustained, AVAX could test the $23.12 and $24.33 levels. Conversely, in a downward move, the $18.50 level is being monitored as a critical support zone. If there are closes below this level, selling pressure may increase and the price could retreat to the $17.02 and $15.59 levels. In the overall picture, although a positive crossover has occurred on the MACD, pricing below the EMAs indicates that the trend is still in negative territory. For momentum to strengthen, an increase in trading volume and closes above $21 are needed ( ). Otherwise, AVAX may continue its sideways movement in the $18.50-$19.75 range in the short term.
(EMA50: Green Line, EMA100: Blue Line, EMA200: Purple Line)
Support Levels: 18.50 – 17.02 – 15.59
Resistances: 21.02 – 23.12 – 24.33
Legal Notice
The investment information, comments, and recommendations contained herein do not constitute investment advice. Investment advisory services are provided individually by authorized institutions taking into account the risk and return preferences of individuals. The comments and recommendations contained herein are of a general nature. These recommendations may not be suitable for your financial situation and risk and return preferences. Therefore, making an investment decision based solely on the information contained herein may not produce results in line with your expectations.


