
Technical Analysis
BTC/USDT
The White House nominated Mike Selig, a key figure in crypto regulation, for the CFTC chairmanship. This move coincided with the period when a bill to expand the CFTC’s powers was being discussed. For the Fed chairmanship, Bessent announced that the list of candidates had been narrowed down to five names: Waller, Warsh, Hassett, Bowman, and Rieder. Institutional Bitcoin investments continued unabated: Strategy acquired 390 BTC worth $43.4 million, while American Bitcoin Corp. increased its holdings to 1,414 BTC. As a bill was drafted in Switzerland to include Bitcoin in national reserves, strong signals emerged indicating increased institutional confidence.
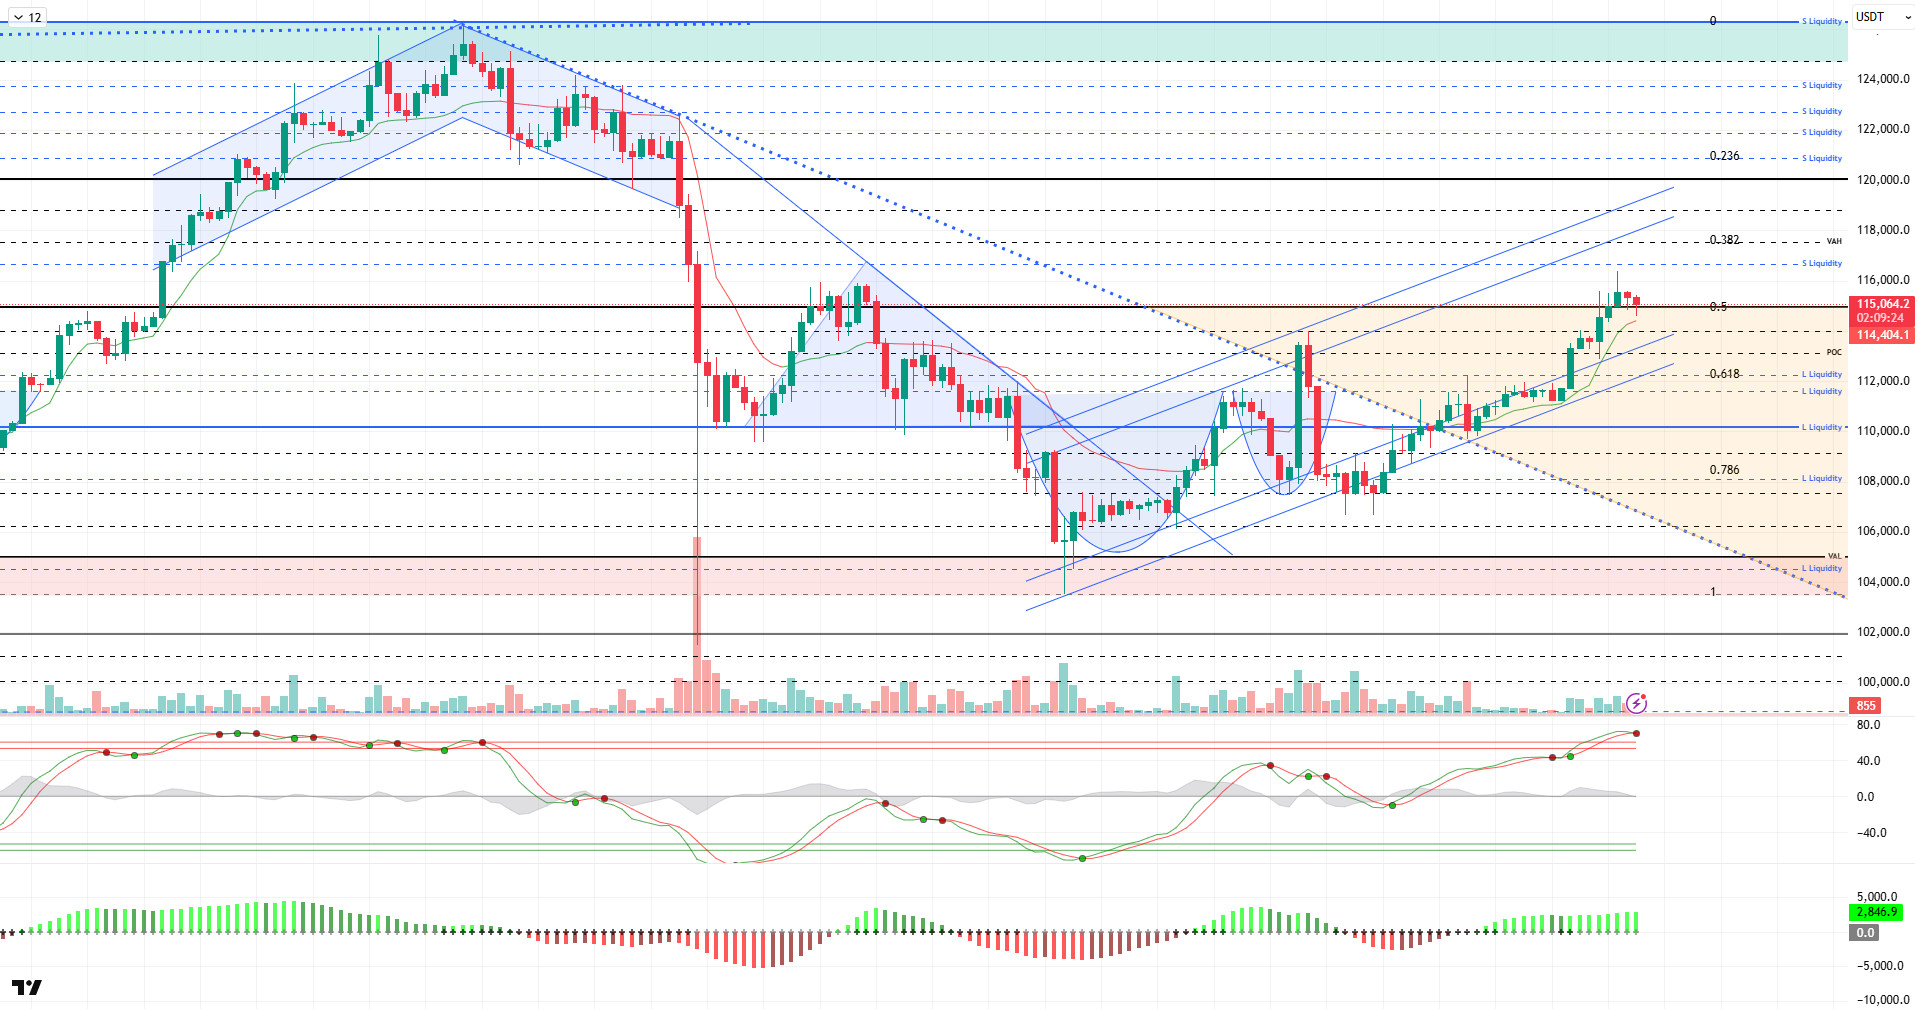
From a technical perspective, BTC surpassed the 116,000 level during the day but failed to hold there, retreating below the 115,000 level. The 115,000 level is being monitored as a critical reference point for the price, which is maintaining its rising minor trend structure. Closings above this level could help it regain momentum. Otherwise, we will follow the trend’s lower channel with pullbacks.
Technical indicators show that the Wave Trend (WT) oscillator has given a sell signal above the oversold zone. The momentum in the Squeeze Momentum (SM) indicator’s histogram has weakened within the positive zone. The Kaufman Moving Average (KAMA) is currently at $113,350, positioned below the price.
According to liquidation data, the short-term buy level has gained fragmented intensity in the 108,000–111,000 band, while the point of accumulation is 112,450. In contrast, the short-term selling level was liquidated at $111,300, while other selling levels were liquidated at $111,700, $112,300, and the increasingly dense level of $115,000.
In summary, developments in the reconciliation process between the US and China are viewed positively by the markets, while the agreement will be submitted to the leaders for final approval. The lack of concrete developments regarding the reopening of the US government remains another factor creating uncertainty, while efforts to find a solution on the Russia-Ukraine front, supported by the EU, and the EU’s sanctions against Russia continue. On the technical side, BTC surpassed the 110,000 reference level again, and the buy-sell level balanced out in liquidity data. With the price settling above the 110,000 level, we tracked the 115,000 resistance area. In the coming period, the price holding within the rising channel stands out as a critical threshold, while closes above the 115,000 level could make the 120,000 level a target. In the event of potential selling pressure, the 115,000 level remains a critical level for holding in positive territory.
Supports: 115,000 – 114,000 – 112,600
Resistances: 116,600 – 117,400 – 118,800
ETH/USDT
The ETH price lost its $4,196 support at the beginning of the week and fell to the $4,130 level. This expected pullback can be considered a healthy correction within the short-term uptrend. The price rebounding from the $4,127 region shows that buyers are still active in the market.
The Relative Strength Index (RSI) has exited the overbought zone and continues its downward trend. This structure, where momentum is weakening, suggests that the market has entered a short-term consolidation phase. However, the current downtrend is seen as a natural correction from the overbought zone.
The Chaikin Money Flow (CMF) indicator has fallen sharply below the zero line. This outlook reveals that liquidity outflows from the market have accelerated and that the influence of buyers has diminished in the short term. However, the fact that the price is still trading above the main trend support indicates that the overall outlook remains intact.
The Ichimoku indicator shows that the price is seeking equilibrium around the Tenkan and Kijun levels. As the price approaches the Tenkan level band, the likelihood of it generating a reaction from this area increases. Avoiding a drop below the cloud in the short term will preserve the possibility of a recovery.
Overall, while the weakening indicators point to a short-term correction, the likelihood of the upward trend continuing in the medium term remains strong. If the $4,090 level is maintained, the price is expected to retest the $4,196 level. If an upward breakout occurs, the $4,308 region could become a target again.
Supports: 3,990 – 3,816 – 3,672
Resistances: 4,196 – 4,308 – 4,442

XRP/USDT
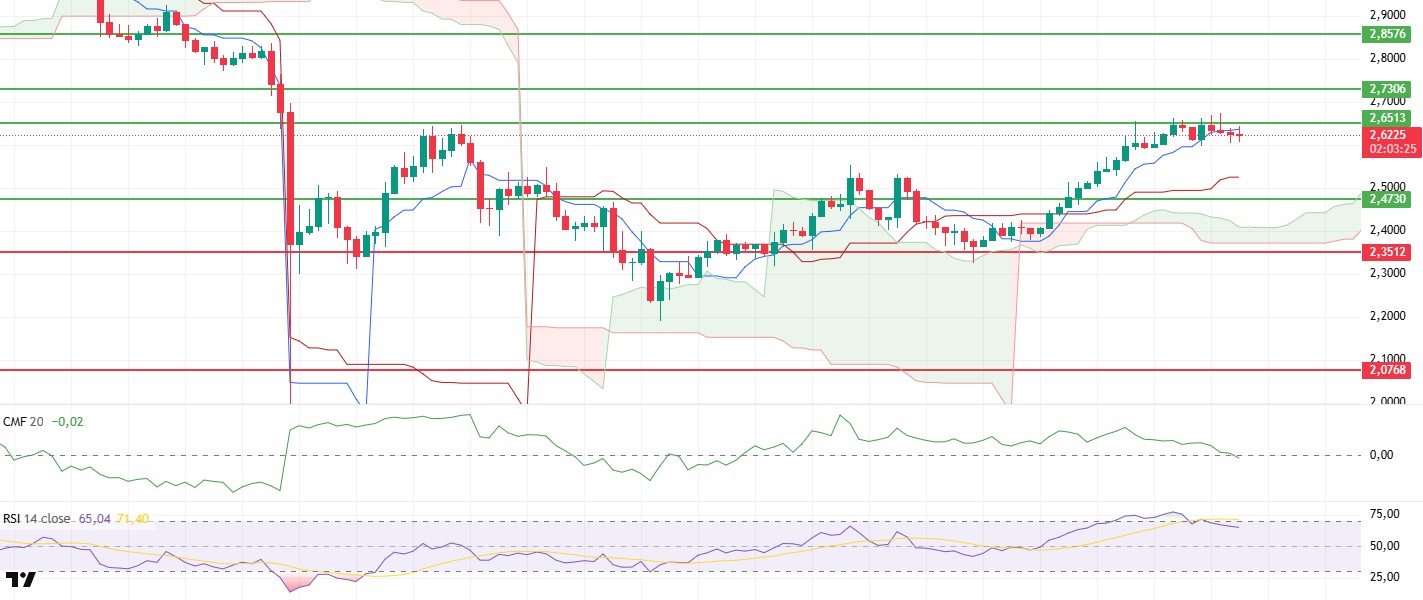
The XRP price moved sideways within a range of $2.60 to $2.64 during the day. The price remaining within this narrow band indicates that the search for direction continues in the short term, but the overall trend is still upward. Despite buyers losing strength, the price remaining above the support zone shows that the upward structure has not yet been broken.
The Chaikin Money Flow (CMF) indicator has fallen to the zero line, signaling an outflow of liquidity from the market. This weak CMF trend suggests that capital inflows have decreased despite the price remaining stable, and that the market has entered a fragile state.
The Relative Strength Index (RSI) indicator continues its downward movement after exiting the overbought zone. This decline in momentum indicates that selling pressure is gradually increasing in the short term and that the price has entered a consolidation phase.
In the Ichimoku indicator, the price is still trading above the Tenkan and Kijun levels. This structure indicates that the market maintains a generally positive technical outlook, but short-term momentum loss has become apparent. A possible reversal towards the lower band of the Kumo cloud can be monitored as an area where new buying reactions may come to the fore.
Overall, although the weakening technical indicators suggest a correction is likely, the positive trend remains valid in the medium term. If the price stays above the $2.55 support level, the possibility of a recovery will remain alive. Breaking above the $2.65 resistance level could reinvigorate the upward momentum.
Supports: 2.3512 – 2.2100 – 2.0768
Resistances: 2.4730 – 2.6513 – 2.7306
SOL/USDT
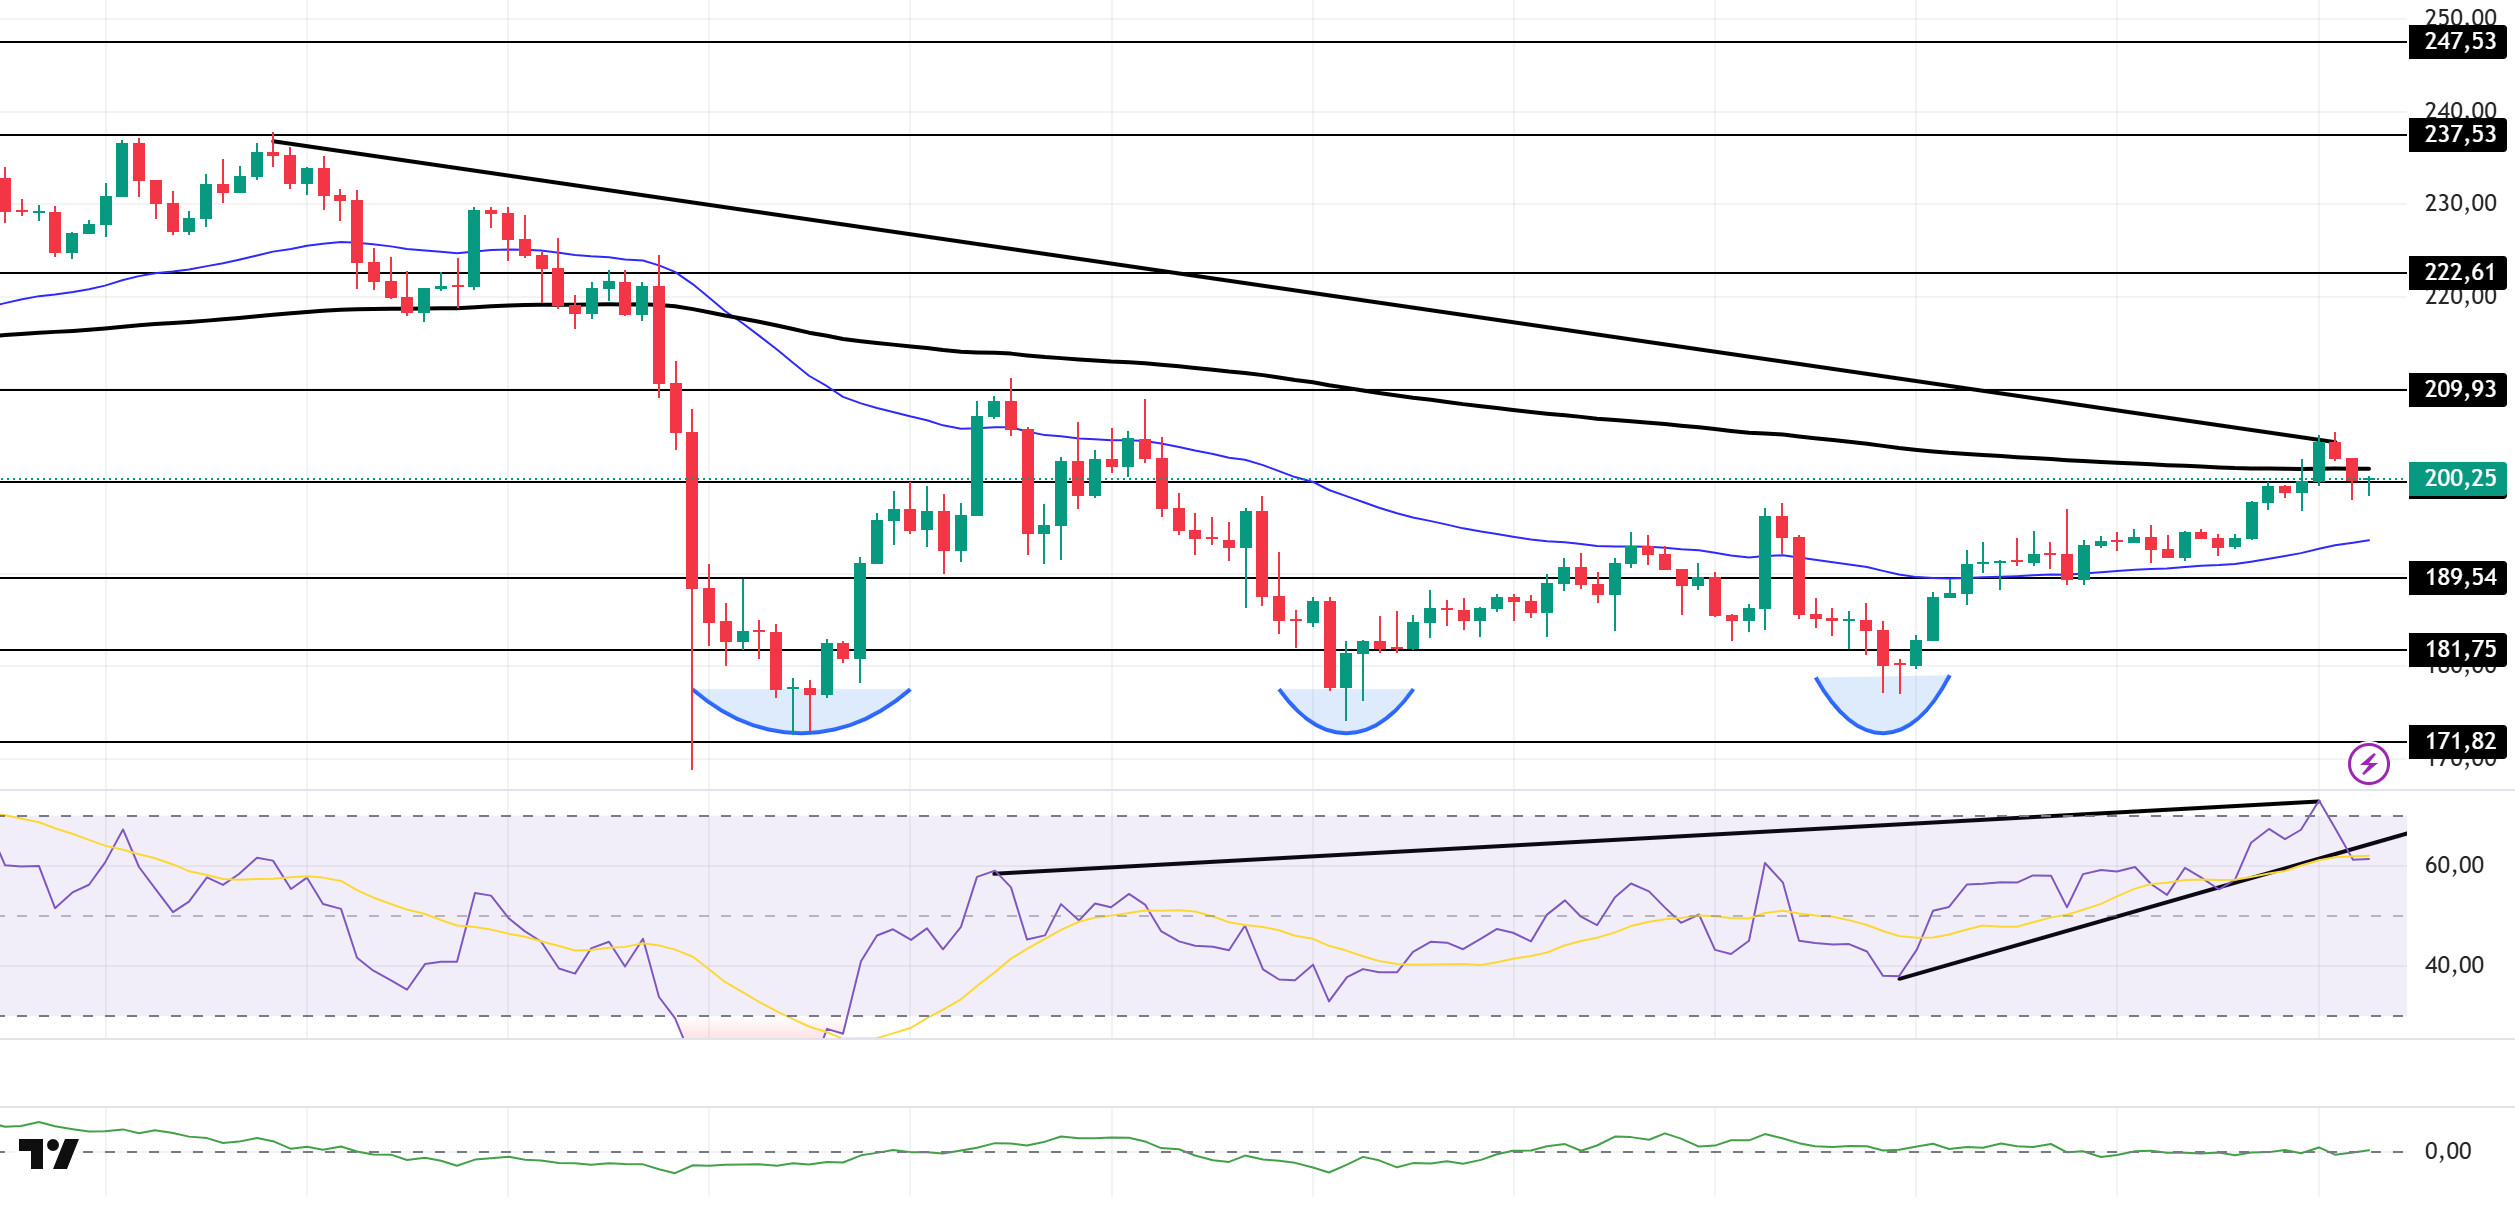
The SOL price recorded a slight decline during the day. The asset broke above the 200 EMA (Black Line) moving average but failed to hold above it, retreating and starting to trade below the moving average again. Currently testing the strong support level of $200.00, the price may test the 50 EMA (Blue Line) moving average if the pullback continues. If the uptrend continues, the $222.61 level should be monitored.
The price remained below the 50 EMA (Exponential Moving Average – Blue Line) and 200 EMA (Black Line) on the 4-hour chart. This indicates a possible downtrend in the medium term. At the same time, the price being between both moving averages shows us that the asset is in a decision phase in the short term. The Chaikin Money Flow (CMF-20) remained at a neutral level. However, the decrease in money inflows could push the CMF into negative territory. The Relative Strength Index (RSI-14) retreated from the overbought zone and began to settle in the middle of the positive zone. At the same time, it crossed below the rising line that began on October 22. This could increase selling pressure. Additionally, bearish divergence should be monitored. In the event of an uptrend due to macroeconomic data or positive news related to the Solana ecosystem, the $237.53 level stands out as a strong resistance point. If this level is broken upwards, the uptrend is expected to continue. If pullbacks occur due to developments in the opposite direction or profit-taking, the $181.75 level could be tested. A decline to these support levels could increase buying momentum, presenting a potential upside opportunity.
Supports: 200.00 – 189.54 – 181.75
Resistances: 209.93 – 222.61 – 237.53
DOGE/USDT
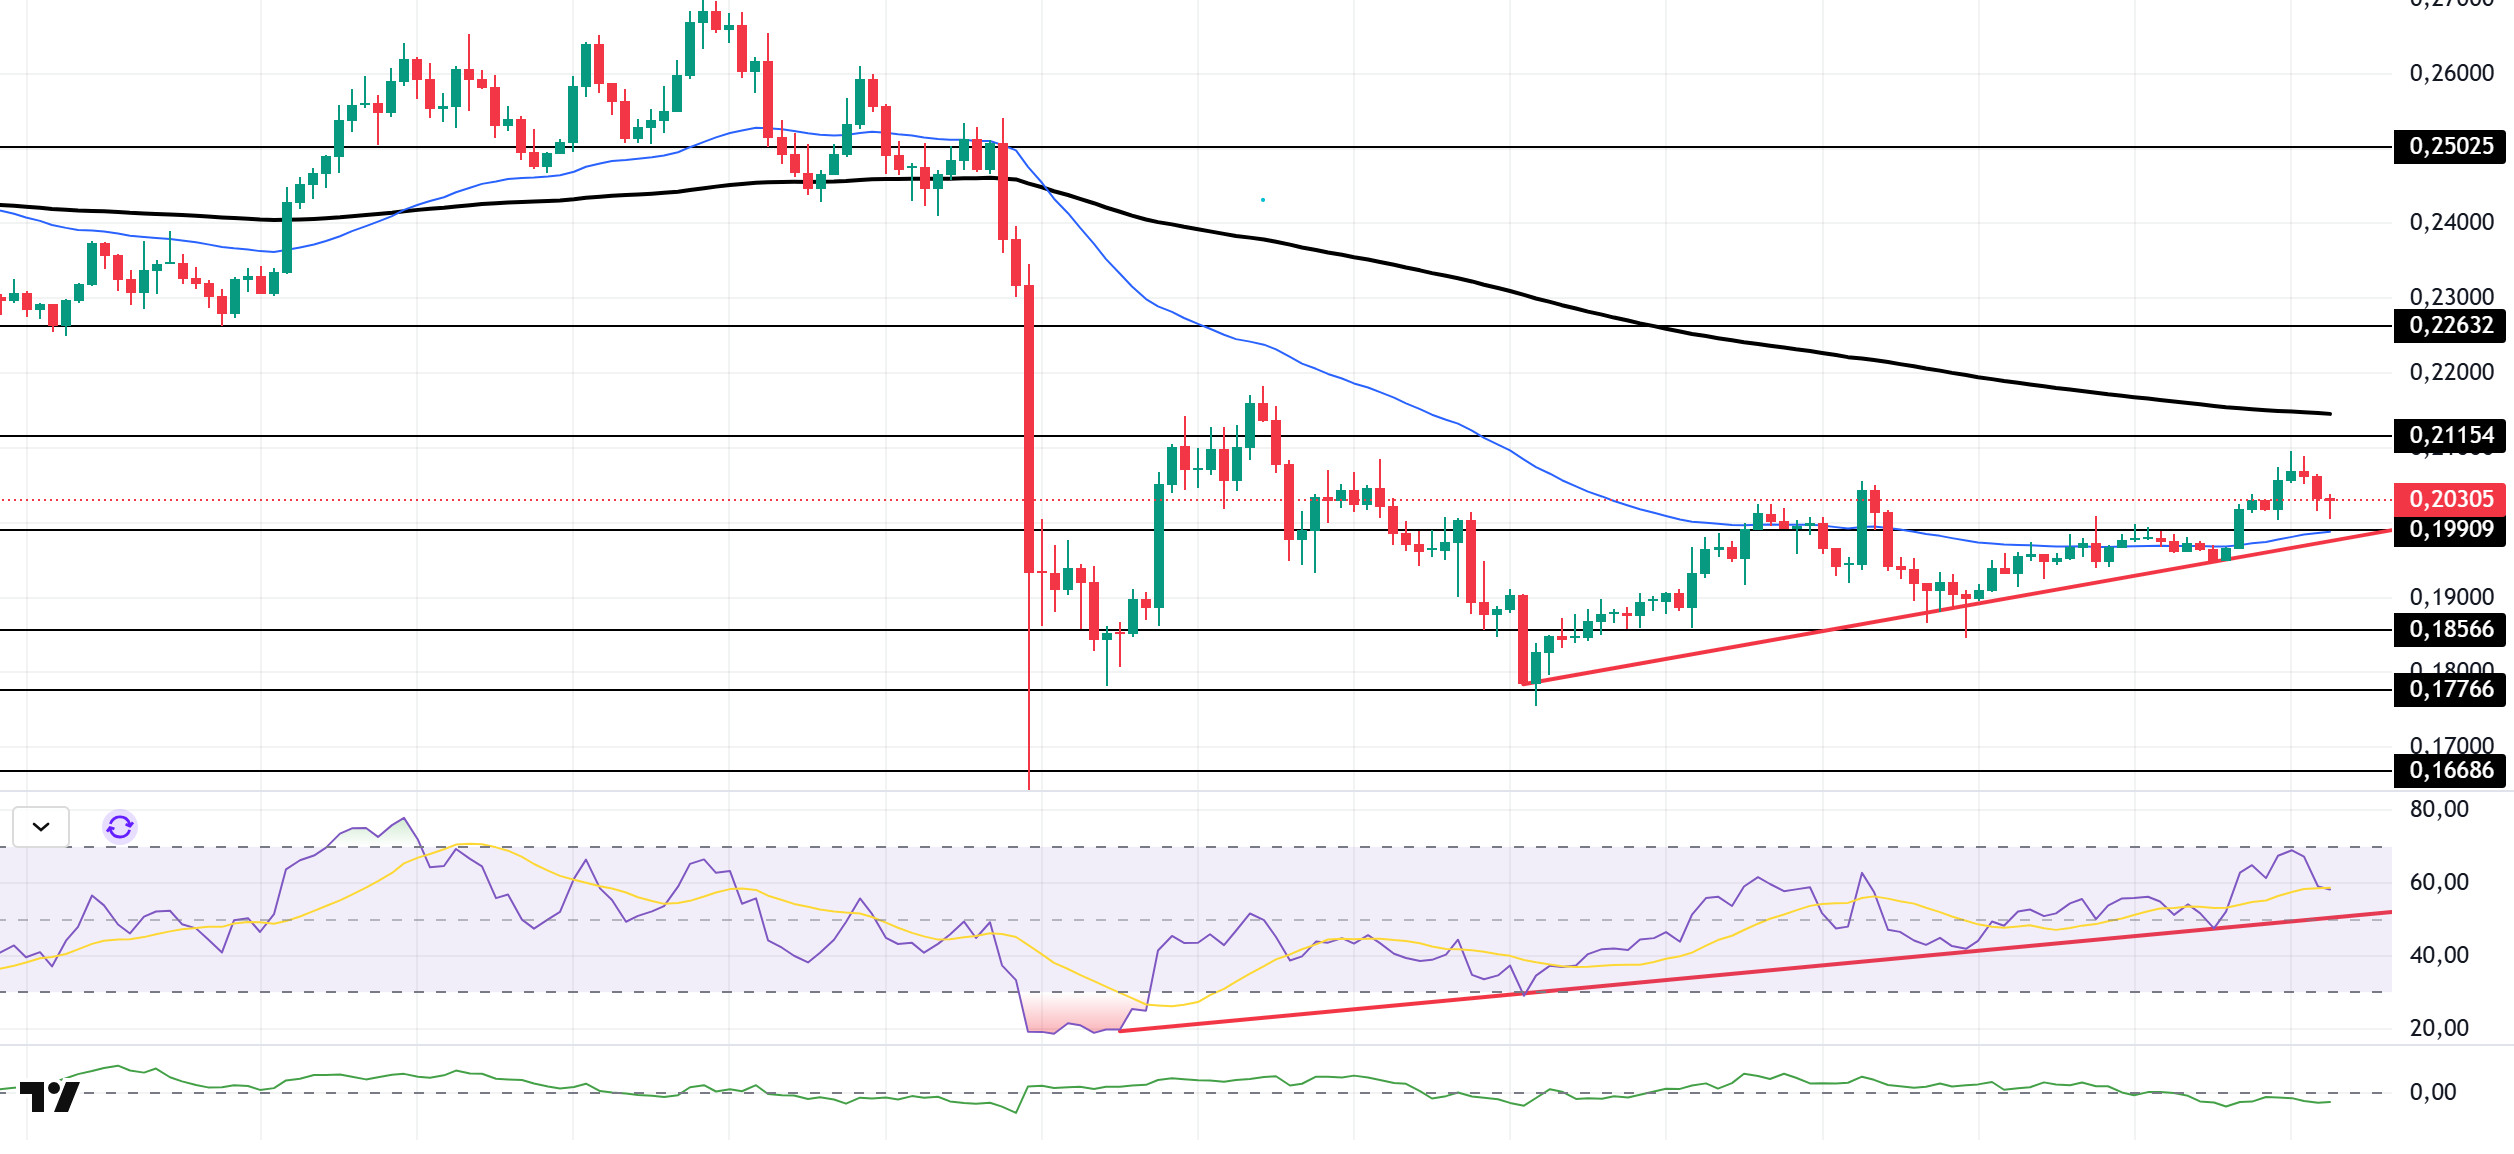
The DOGE price experienced a slight decline during the day. The asset continues to hold onto the upper region of the rising line that began on October 17. This signaled an increase in upward pressure. Gaining momentum with support from the rising line, the price also broke above the 50 EMA (Blue Line) moving average. Currently preparing to test the 50 EMA (Blue Line) moving average as support, the price could test the $0.25025 level on 200 EMA above candle closes. If a pullback begins, the upward trend should be monitored.
On the 4-hour chart, the 50 EMA (Exponential Moving Average – Blue Line) remained below the 200 EMA (Black Line). This indicates that a downtrend may begin in the medium term. The price being between the two moving averages shows that the price is in a decision phase in the short term. The Chaikin Money Flow (CMF-20) also remained at negative levels. Additionally, a decline in money inflows could push the CMF deeper into negative territory. The Relative Strength Index (RSI-14) continues to remain above the upward trend that began on October 12. At the same time, it retreated from the overbought level and fell back to the middle of the positive zone. This signaled that the downward trend could increase. In the event of an upturn due to political developments, macroeconomic data, or positive news flow in the DOGE ecosystem, the $0.22632 level stands out as a strong resistance zone. Conversely, in the event of negative news flow, the $0.17766 level could be triggered. A decline to these levels could increase momentum and initiate a new wave of growth.
Supports: 0.19909 – 0.18566 – 0.17766
Resistances: 0.21154 – 0.22632 – 0.25025
AVAX/USDT
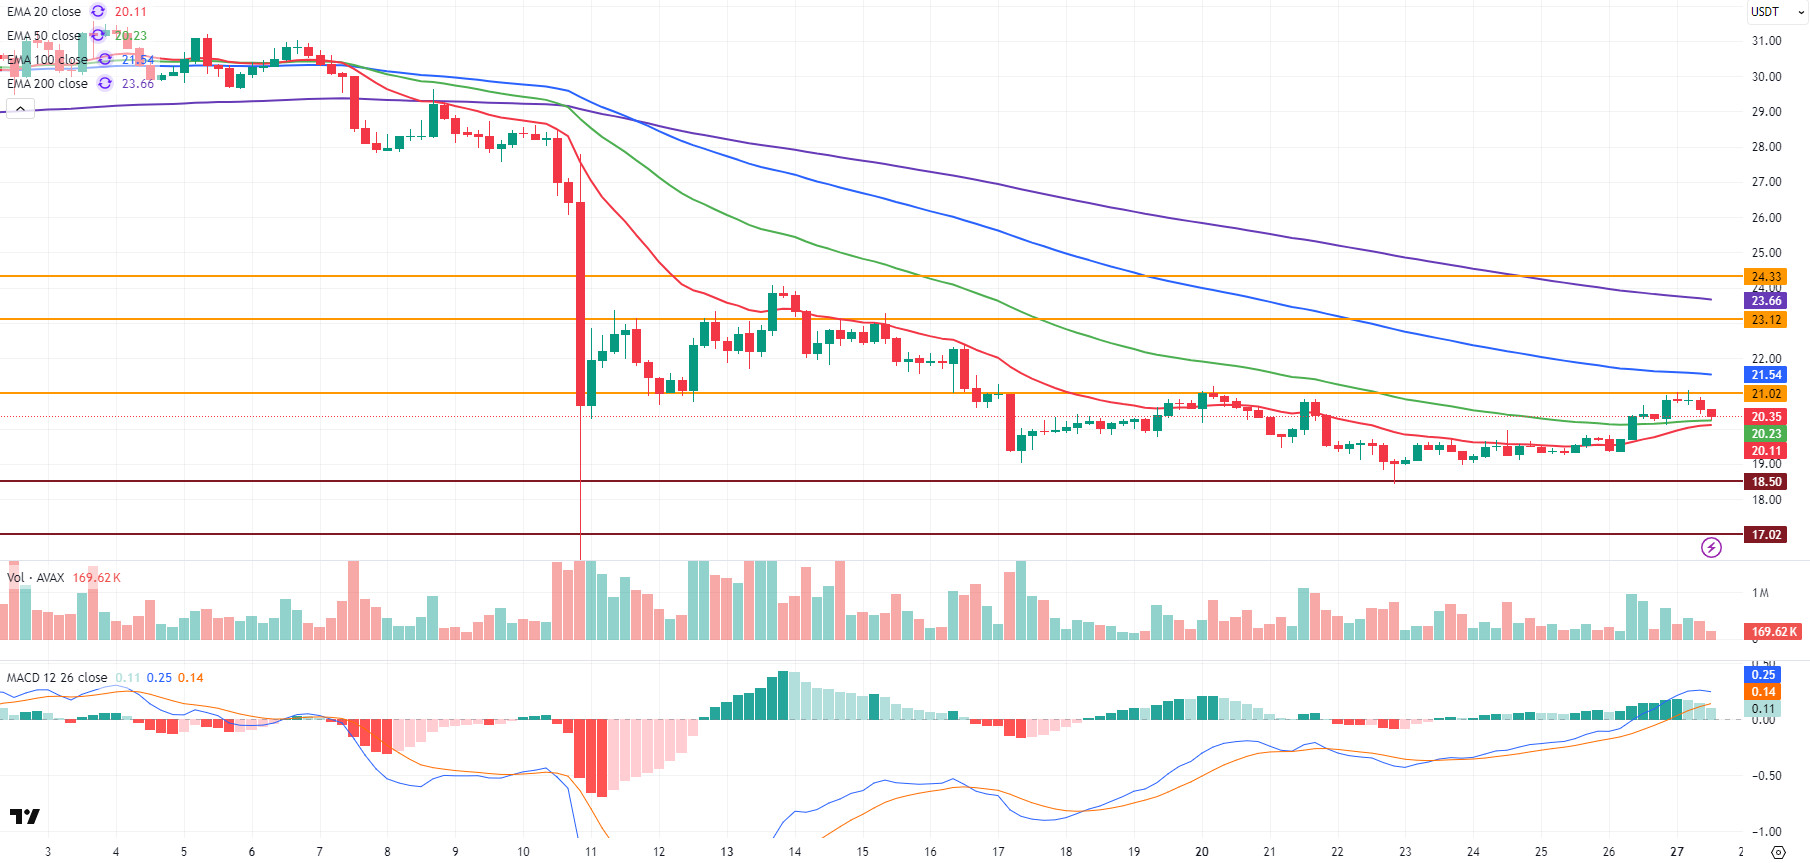
Starting at $20.82 today, AVAX tested the $21.02 resistance level with its rise during the day. Experiencing a decline due to increased selling pressure in the resistance zone, AVAX fell back to the $20.34 level. This decline resulted in a daily loss of approximately 2.3%. AVAX’s price has been stuck in a narrow range in recent days. Low trading volumes are making it difficult for both buyers and sellers to find direction. This situation is limiting upward movements in the short term.
On the 4-hour chart, the MACD indicator is still above the signal line but has turned sideways. Although a brief positive trend was seen in the morning hours, the failure to break the $21 resistance level indicates that momentum is weakening. If the MACD crosses below the signal line, selling pressure is expected to increase. AVAX is still trading above the 20 and 50-period Exponential Moving Average (EMA20 – EMA50). These levels stand out as important support zones in terms of the short-term technical outlook. As long as the price remains above these averages, the chance of recovery is maintained. However, if the price falls below these zones, the risk of deeper sell-offs will increase.
On the technical side, the $21.02 level remains a key resistance point. A significant break above this region could pave the way for AVAX to rise gradually towards $23.12 and then $24.33. In a downside scenario, the $18.50 level is a strong support position in the event of a break below the EMA20 and EMA50. Closings below this level could bring the $17.02 and $15.59 regions back into focus. Overall, AVAX is still trying to remain in positive territory. On the MACD front, the upward trend is maintained, albeit weakly. However, insufficient trading volume is delaying a sustained break above $21. Therefore, a sideways trend in the $19.80–21.00 range is likely in the short term. Sustained trading above $21 could be seen as the first strong signal of a short-term recovery. If selling pressure increases again, closing below the EMA20 and EMA50 levels could cause the decline to gain momentum.
(EMA20: Red Line, EMA50: Green Line, EMA100: Blue Line, EMA200: Purple Line)
Support levels: 18.50 – 17.02 – 15.59
Resistances: 21.02 – 23.12 – 24.33
LINK/USDT
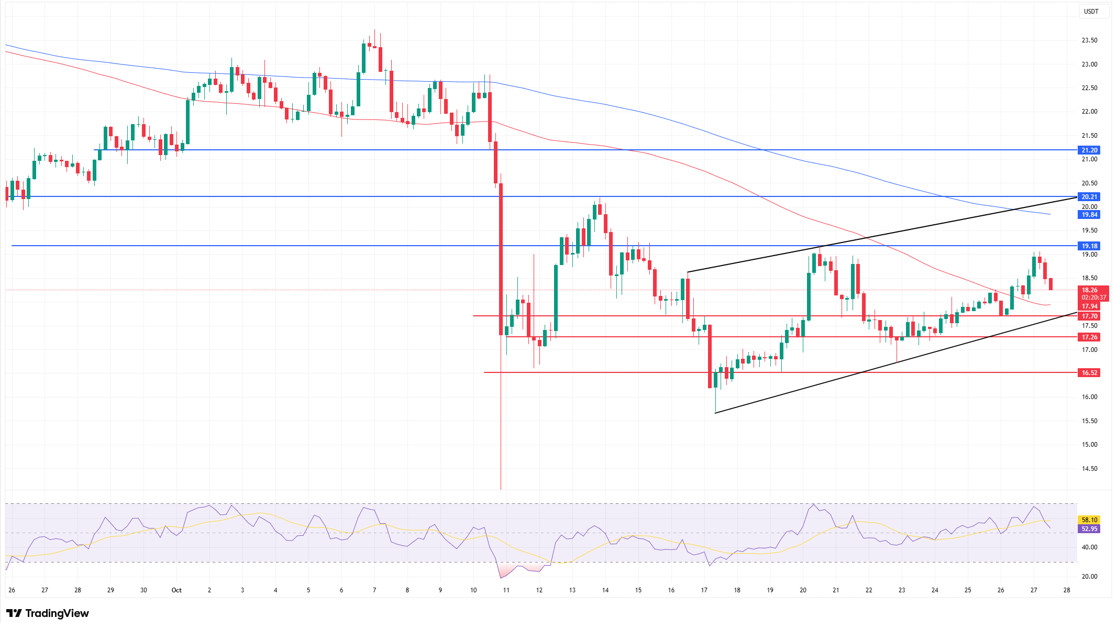
As we mentioned in our morning analysis, the $19 level remains the most critical resistance point for the price. As clearly seen in the image, the price has encountered selling pressure in this region once again and is showing a tendency to pull back. This pullback is occurring without breaking the overall trend structure. Therefore, as long as the support levels on the chart are not lost, it may be healthier to interpret the current movement as a “correction.”
The area where the price is located is a very sensitive area as it intersects with both the rising trend support and short-term moving averages. If this level is maintained, LINK could test the $19 band again. However, a 4-hour close below $18 could weaken momentum and push the price first to the $17.70 support level, then to the $16.70 region. Primarily, the $17.70 – $18 range can be considered both a technically strong defense line and an important equilibrium point in terms of investor psychology. A rebound from this area could put the price back into a positive trend.
In an upward scenario, closes above the $19 resistance could confirm the rising bottom-top structure and provide new momentum that could push the price first to $20 and then to $21 levels.
The Relative Strength Index (RSI) indicator is currently hovering around 52 and moving in positive territory. This indicates that buyers are still active in the short term. However, we are seeing a sharp decline from the 67 level compared to the morning hours. If the RSI value falls below 50, the price could target the 17.70 region. In such a scenario, we can expect increased selling pressure as the price would fall below our 100-day moving average.
Supports: 17.70 – 17.26 – 16.52
Resistances: 19.18 – 20.21 – 21.20
Legal Notice
The investment information, comments, and recommendations contained herein do not constitute investment advice. Investment advisory services are provided individually by authorized institutions taking into account the risk and return preferences of individuals. The comments and recommendations contained herein are of a general nature. These recommendations may not be suitable for your financial situation and risk and return preferences. Therefore, making an investment decision based solely on the information contained herein may not produce results in line with your expectations.


