
Technical Analysis
BTC/USDT
US President Donald Trump announced that he could lift tariffs on fentanyl-related products if China effectively limits its fentanyl exports. Trump is expected to formalize this during his visit to China in April 2026. The White House announced the details of the latest negotiations, stating that China will reopen its Nexperia facilities and end investigations into US semiconductor companies. On the monetary policy front, the Fed carried out its largest liquidity injection since 2020 with a $29.4 billion overnight repo operation on October 31. The move was explained as aiming to ease short-term funding pressures and limit the rise in repo rates.
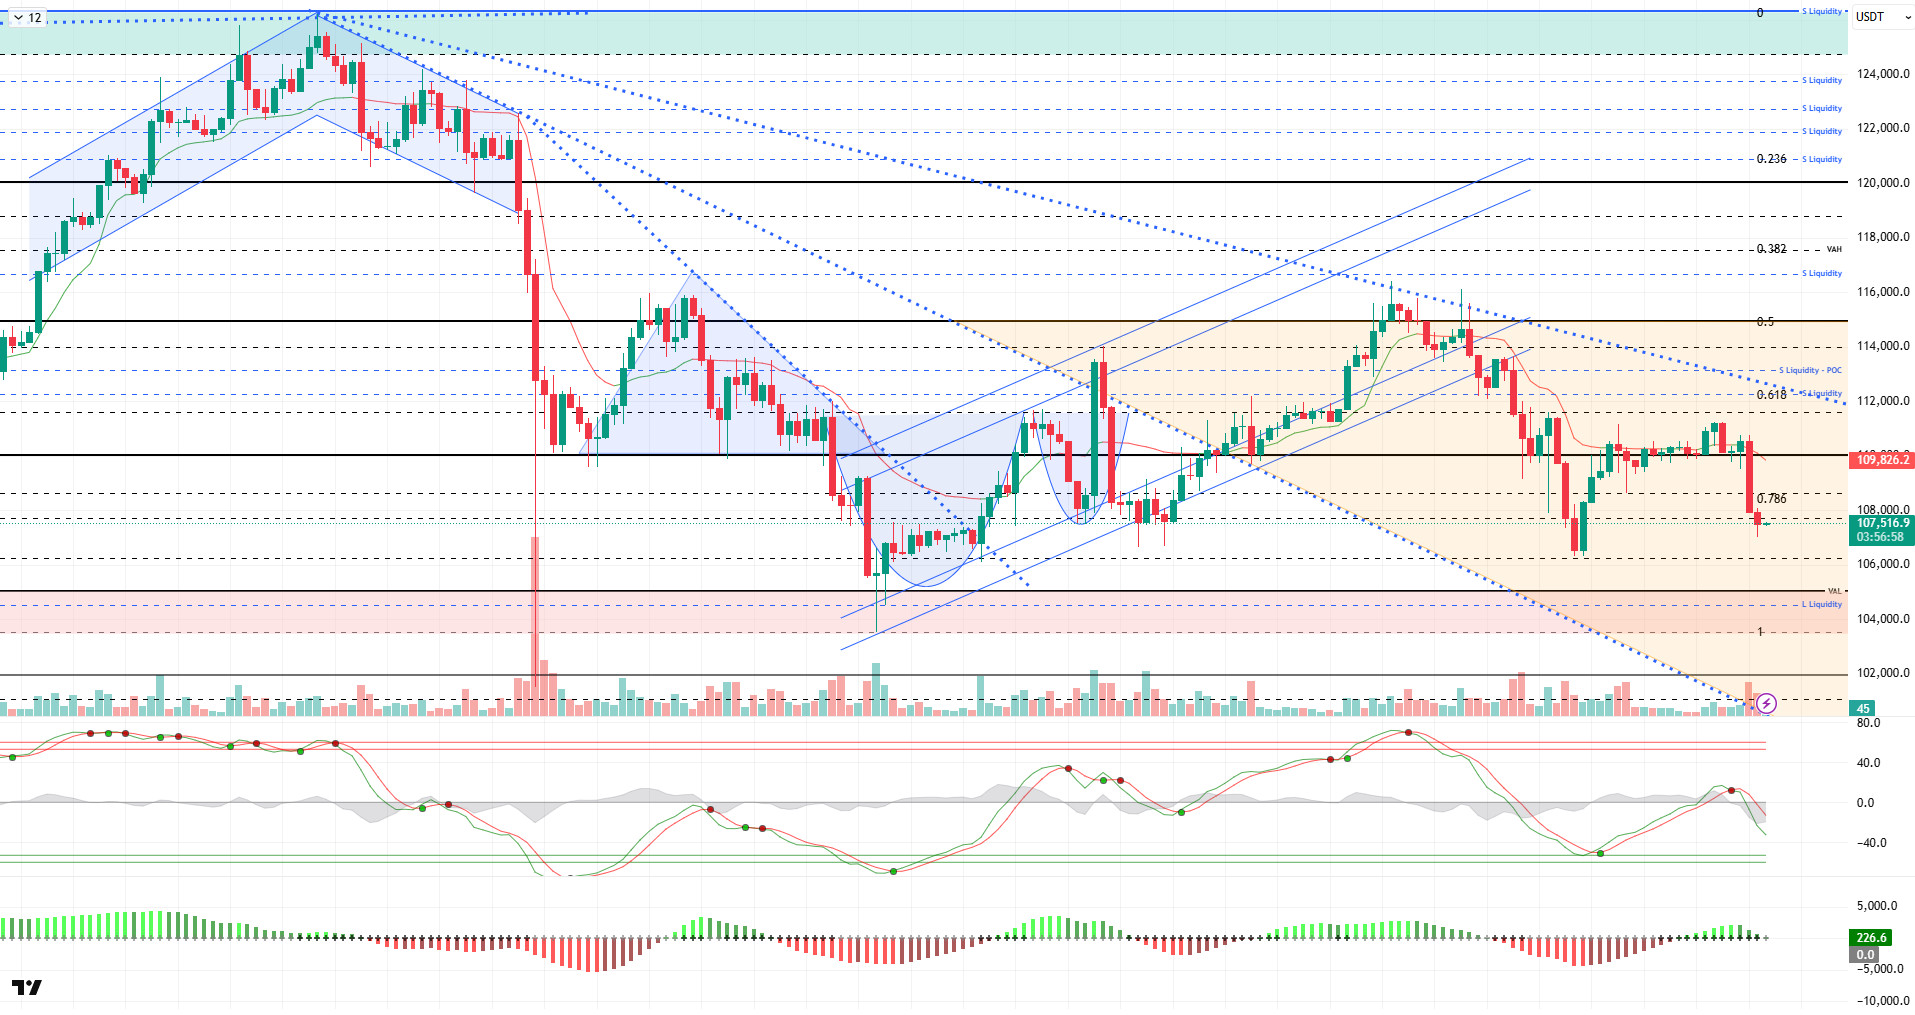
From a technical perspective, BTC, which tested the 110,000-resistance level throughout the weekend and occasionally broke above it, did not remain there. Facing heavy selling pressure, it started November with a 1.88% decline. Maintaining its downtrend by forming lower peaks within the orange band, the price was trading at the 107,500 level at the time of writing.
Technical indicators continue to maintain the sell signal given by the Wave Trend (WT) channel middle band, while the histogram on the Squeeze Momentum (SM) indicator has weakened again after gaining momentum for a short time. The Kaufman moving average (KAMA) is currently at $110,100, positioned above the price.
According to liquidation data, the buy level recorded intensity at the 108,500 level over the weekend, resulting in the liquidation of these positions with the recent decline. In contrast, the sell level has reached significant intensity at 112,000 – 113,000. Looking at the last 24 hours, a total of $470 million was liquidated in the market.
In summary, while the effects of the US-China tariff crisis being suspended for a year and resulting in a compromise continue, optimistic developments continue to emerge from both sides. However, the Fed’s hawkish tone on interest rate cuts continues to put pressure on the market. On the technical side, although BTC occasionally records short-term increases, it is seen that the increases parallel to the descending trend channel it has formed are not permanent. Liquidity data shows that the selling pressure continues to prevail. In the coming period, 105,000 will be monitored as a critical support level, and a loss of this level could deepen the selling pressure, resulting in a loss of six-digit levels. In the event of a potential rebound, we will monitor liquidity areas if the 110,000 reference level is breached.
Supports: 107,400 – 106,600 – 105,000
Resistances: 108,600 – 110,000 – 111,400
ETH/USDT
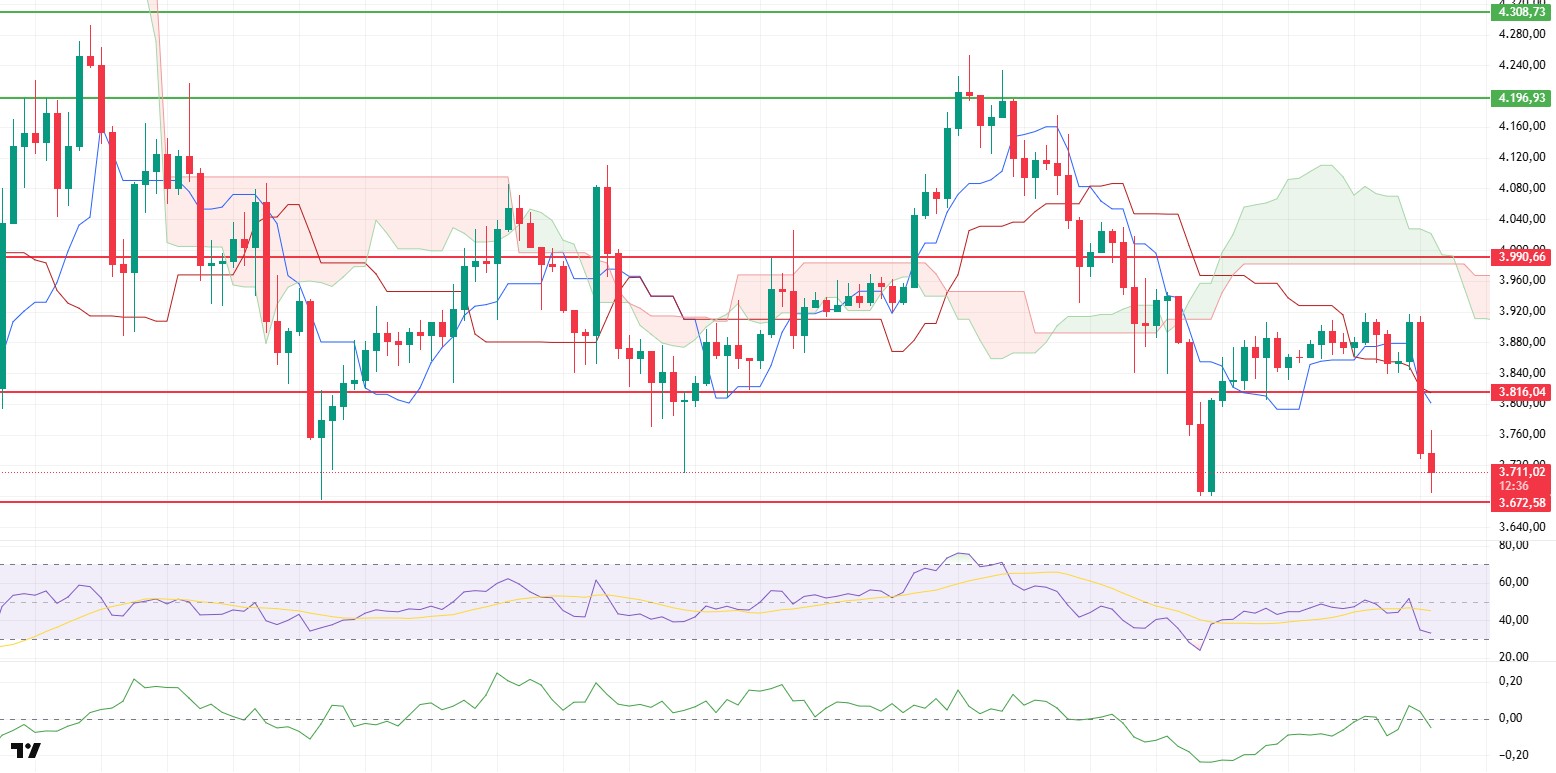
The Ethereum price faced another strong wave of selling after the weekly close and the opening of Asian markets, falling back to the $3,672 support level. The price, which rose above $3,900 on Friday and over the weekend, failed to hold at this level and gave back all its gains under selling pressure. This movement shows that short-term buyers in the market remain weak and that selling pressure is still effective.
The Chaikin Money Flow (CMF) indicator also fell back into negative territory with this decline. This outlook reveals that there is insufficient capital inflows into the market and that institutional demand remains weak. The CMF’s continued stay in negative territory signals that the price’s recovery efforts may struggle to find volume support. In this environment of weak liquidity inflows, short-term upward attempts can generally be considered selling opportunities.
The Relative Strength Index (RSI) indicator has fallen to the oversold zone boundary after a sharp decline, showing that momentum loss is accelerating. The RSI’s retreat to these levels indicates that oversold conditions have formed in the short term, but buyers have not yet responded strongly. If the RSI stabilizes at these levels, a short-term rebound could be seen, but overall momentum remains weak.
In the Ichimoku indicator, the price is trading below both the Tenkan and Kijun levels and is stuck below the kumo cloud. This technical structure confirms that the overall trend is still downward and that attempts to rise may be limited. Unless there is a sustained break above the kumo cloud, the price is likely to remain under pressure in the medium term.
If the $3,672 support level is not maintained during the day, selling pressure may accelerate, and the price could retreat to around $3,580. In the opposite scenario, if the price breaks above the $3,816 level again, a short-term recovery attempt may begin. However, unless it manages to stay above this level, upward movements are likely to be temporary . Overall, the technical outlook remains weak. Although oversold signals on the RSI support short-term rebound attempts, the trend direction still points downward.Top of Form
Below the Form
Supports: 3,672 – 3,436 – 3,200
Resistances: 3,816 – 3,928 – 3,990
XRP/USDT
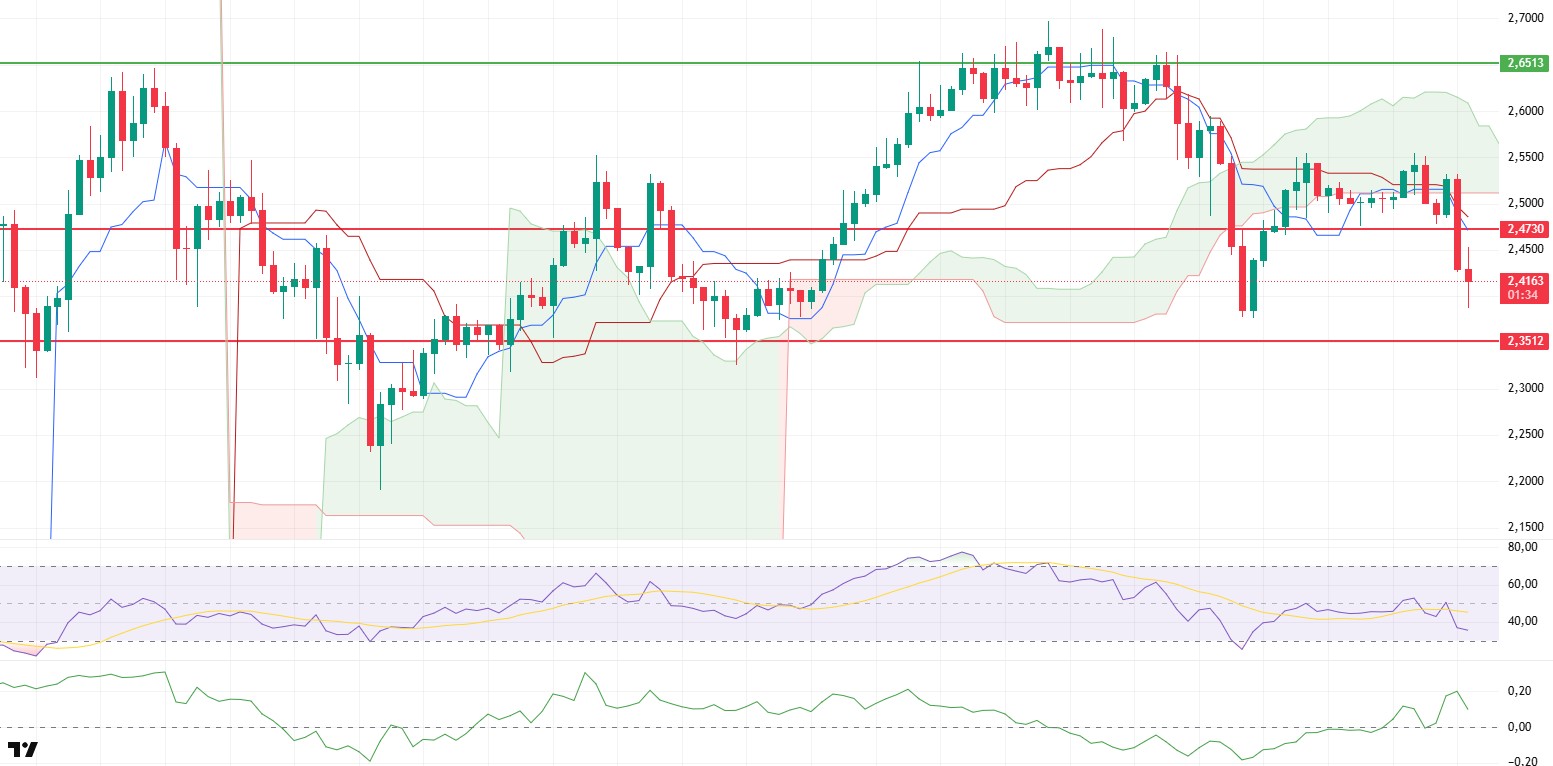
The XRP price fell to $2.39, losing both the lower band of the cloud and the $2.47 support level as selling pressure increased again after the weekly close. Although it rose to $2.55 on Thursday by breaking through the lower band of the cloud, this rise was not sustainable, and the price returned to a weak appearance. While the market continues to search for direction, the $2.47 level is a critical threshold in the short term.
The Chaikin Money Flow (CMF) indicator managed to remain in positive territory despite the recent price decline. This structure indicates that there is no strong liquidity outflow from the market and that capital movements remain balanced despite selling pressure. If the CMF maintains this level, the market may show a short-term recovery trend, and the price may rebound towards the $2.47 level.
The Relative Strength Index (RSI) indicator has fallen sharply below the 50 level, revealing an acceleration in momentum loss. This outlook shows that selling pressure remains strong and buyers are unable to enter the market with sufficient strength. The RSI’s trajectory in this region increases the likelihood of the price remaining weak in the short term.
In the Ichimoku indicator, the price has fallen below the Tenkan and Kijun levels, along with the kumo cloud. This technical structure confirms the negative trend and indicates a high probability of continued downward pressure in the short term. Unless the price settles back above the lower band of the cloud, it is difficult to speak of a strong trend reversal.
In the overall picture, all technical structures except the CMF indicator are negative. If the price fails to regain the $2.47 level, selling pressure may deepen, and the decline could extend to the $2.35 level. However, staying above the $2.47 level could trigger a strong rebound, strengthening short-term buying and pushing the price towards the $2.65 level.
Supports: 2.3512 – 2.2100 – 2.1300
Resistances: 2.4730 – 2.6513 – 2.7306
SOL/USDT
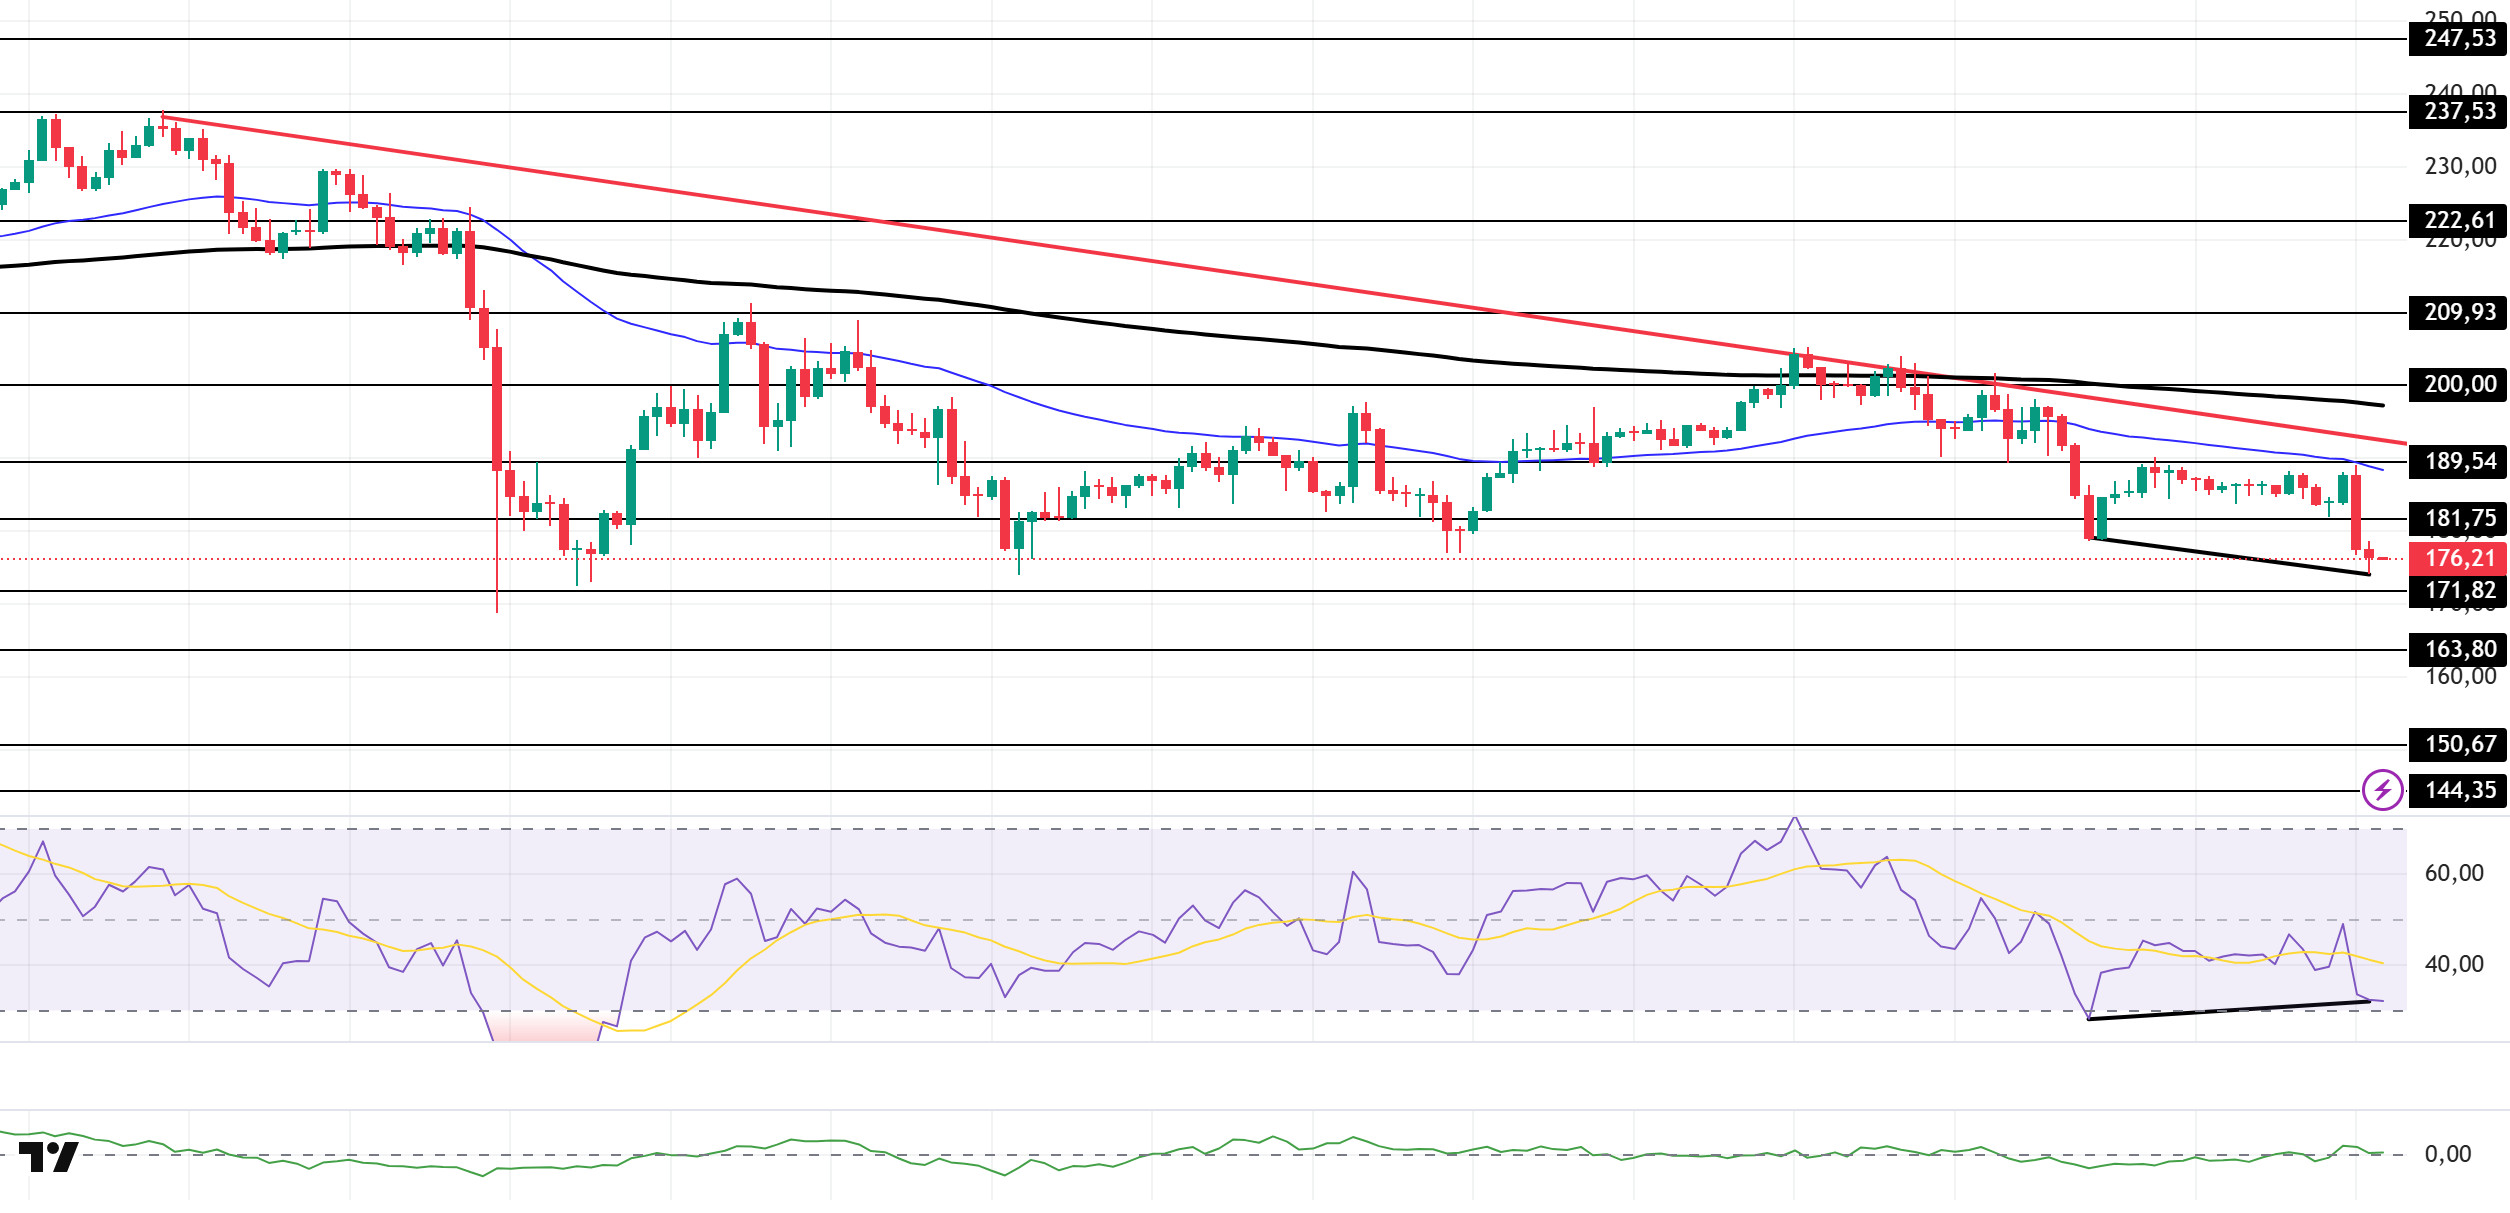
The SOL price has lost value. The asset tested the 50 EMA (Blue Line) moving average and the $189.54 level as resistance but failed to break through, continuing its pullback and remaining in the lower region of the downward trend that began on October 6. Currently deepening its decline, the price could test the $163.80 level if the pullback continues. If rallies begin, it could retest the 50 EMA moving average.
On the 4-hour chart, it remained below the 50 EMA (Exponential Moving Average – Blue Line) and 200 EMA (Black Line). This indicates that it may be in a medium-term downtrend. At the same time, the price being below both moving averages shows us that the asset is in a downward trend in the short term. The Chaikin Money Flow (CMF-20) is near the neutral level. However, a decrease in money inflows could push the CMF into negative territory. The Relative Strength Index (RSI-14) is in the oversold zone. At the same time, there is a positive divergence. These indicate that buying pressure may increase. If there is an uptrend due to macroeconomic data or positive news related to the Solana ecosystem, the $189.54 level stands out as a strong resistance point. If this level is broken upwards, the uptrend is expected to continue. In case of pullbacks due to developments in the opposite direction or profit-taking, the $163.80 level could be tested. A decline to these support levels could increase buying momentum, presenting a potential upside opportunity.
Supports: 171.82 – 163.80 – 150.67
Resistances: 181.75 – 189.54 – 200.00
DOGE/USDT
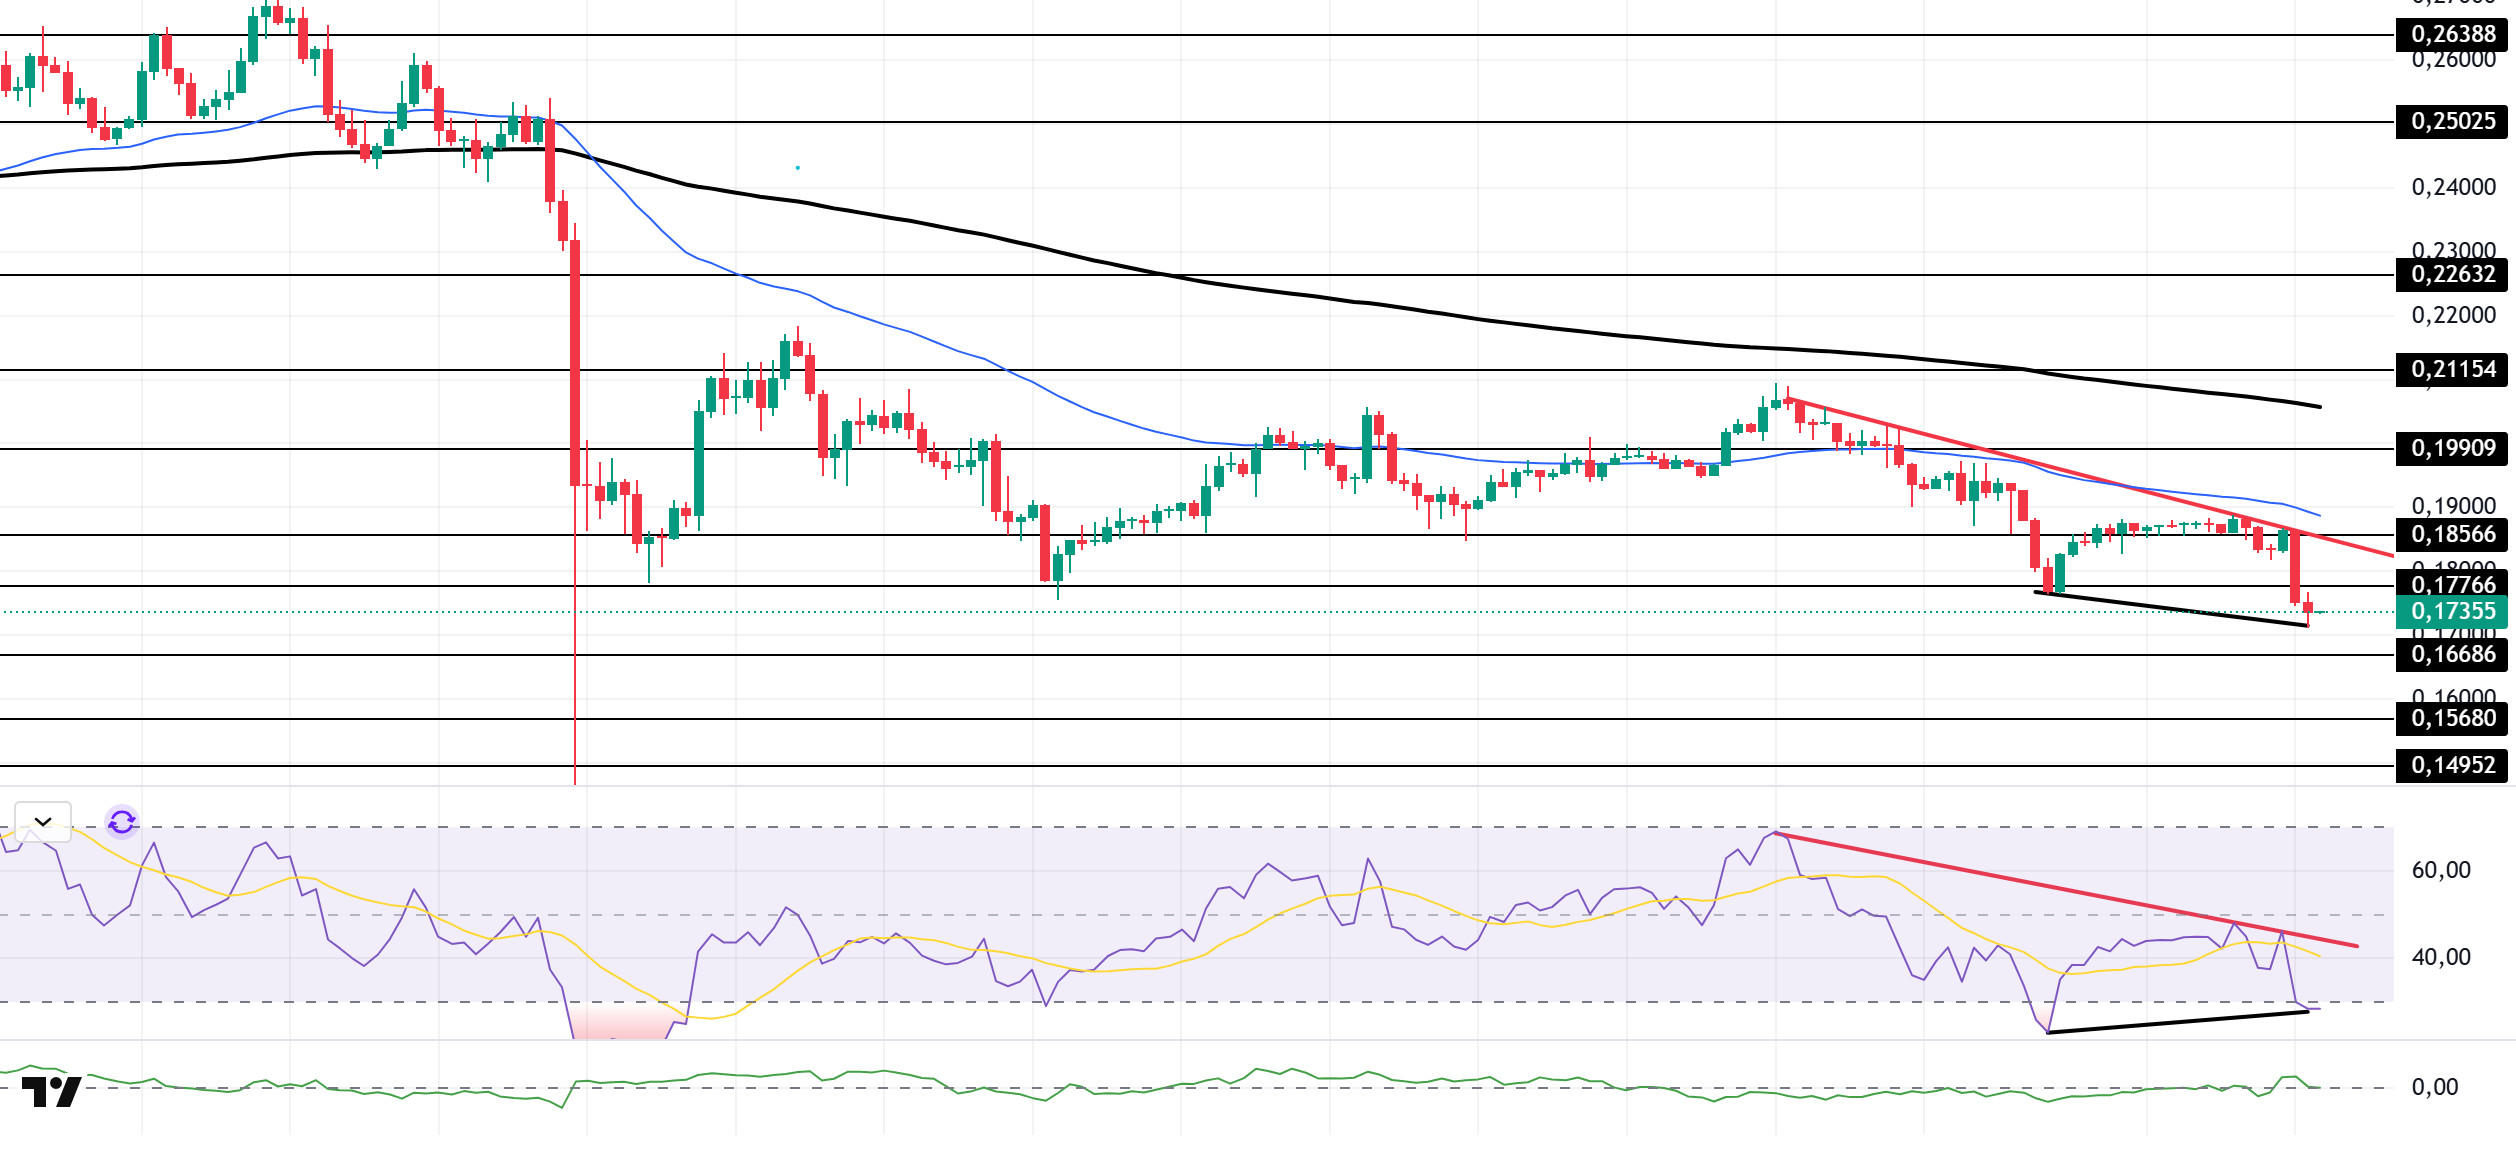
The DOGE price lost value. The asset tested the descending trend line that began on October 27 and the $0.18566 level as resistance and deepened its pullback. The price, which continues to be in the lower region of the descending trend line, may test the $0.16686 level if it continues to pull back. If an uptrend begins, it may test the downward trendline as resistance.
On the 4-hour chart, the 50 EMA (Exponential Moving Average – Blue Line) remained below the 200 EMA (Black Line). This indicates that a downtrend may begin in the medium term. The price being below both moving averages indicates a downward trend in the short term. The Chaikin Money Flow (CMF-20) remained in neutral territory. Additionally, a decrease in cash inflows could push the CMF into negative territory. The Relative Strength Index (RSI-14) is in the oversold zone. It also remained below the downward trend line that began on October 27. On the other hand, there is a positive divergence. These factors could increase buying pressure. In the event of an uptrend driven by political developments, macroeconomic data, or positive news flow in the DOGE ecosystem, the $0.18566 level stands out as a strong resistance zone. Conversely, in the event of negative news flow, the $0.15680 level could be triggered. A decline to these levels could increase momentum and initiate a new wave of growth.
Supports: $0.16686 – $0.15680 – $0.14952
Resistances: 0.17766 – 0.18566 – 0.19909
BNB/USDT
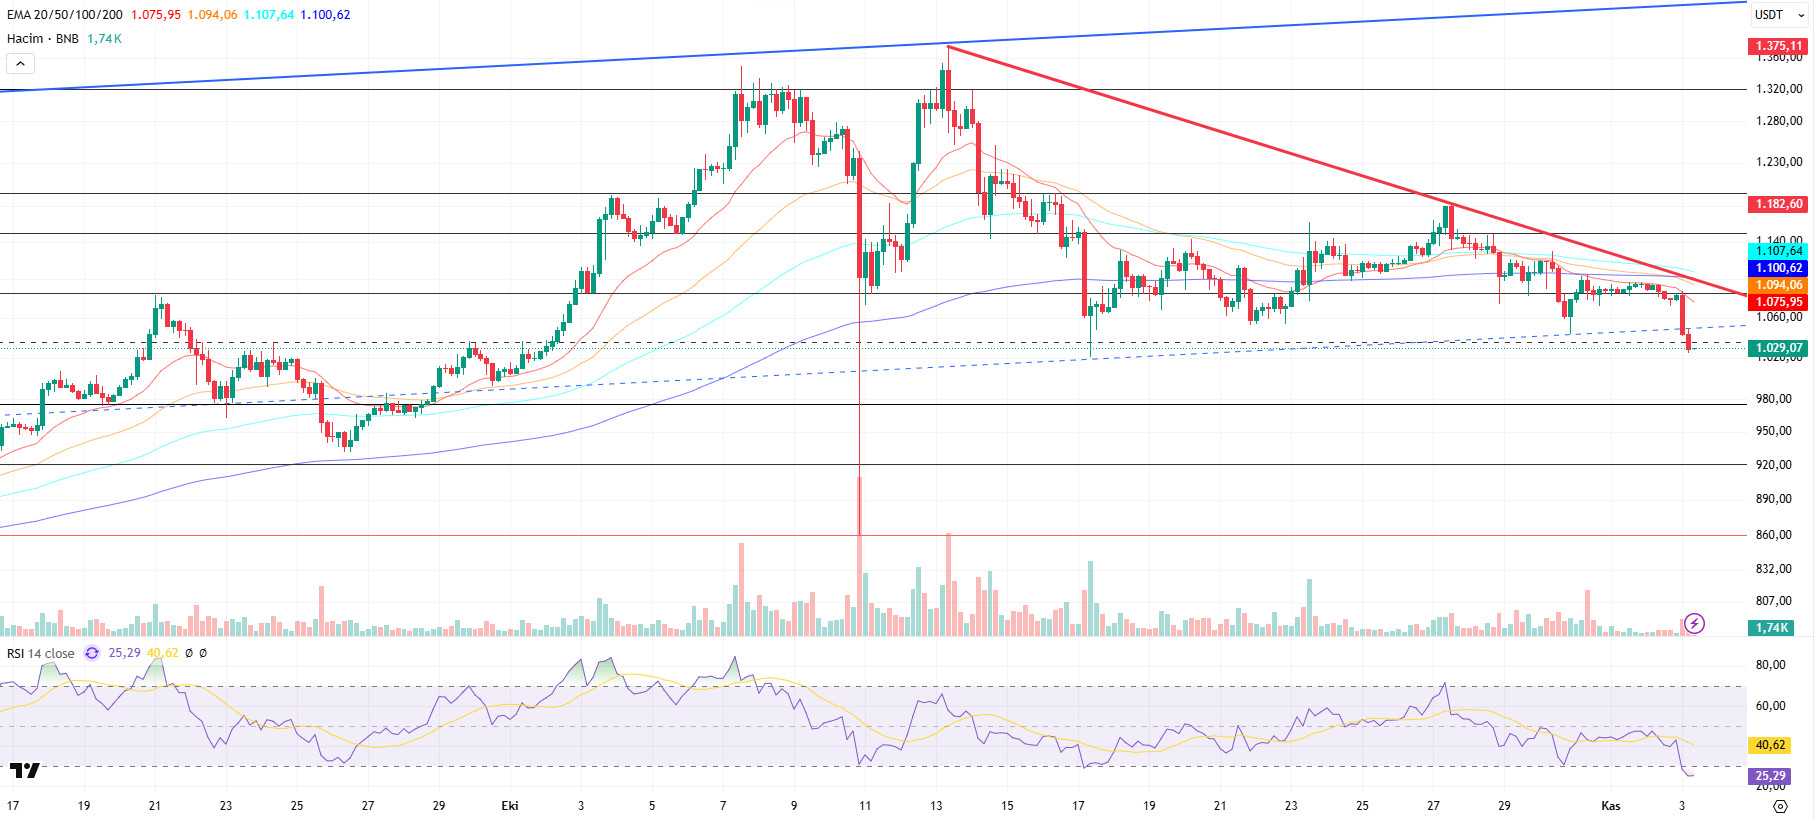
From a technical perspective, positive news flow supporting the BNB price last week led to positive momentum in the BNB/USDT pair, with the price movement continuing up to the $1,180 level. However, at these levels, the correction movement that began after the all-time high (ATH) regained strength and retreated towards the psychological threshold of $1,000.
Technical indicators for BNB/USDT, currently trading in the $980–$1,080 range, show that the recent decline in trading volume has supported the pullback momentum. Additionally, the Relative Strength Index (RSI) has fallen below the 30 level amid recent selling pressure, indicating that the asset has entered oversold territory and that the current technical outlook confirms this trend.
According to the technical chart, if selling pressure continues, the $980 support level is likely to be retested. If this level is broken downwards, the price is expected to retreat to the $930 and $880 support zones. On the other hand, if buying appetite is maintained and market momentum recovers, BNB is likely to retest the $1,080 resistance level in the first stage. If this level is broken, it is technically possible for the price to move towards the $1,150 and $1,200 levels.
Supports: 980 – 930 – 880
Resistances: 1,080 – 1,150 – 1,200
ADA/USDT
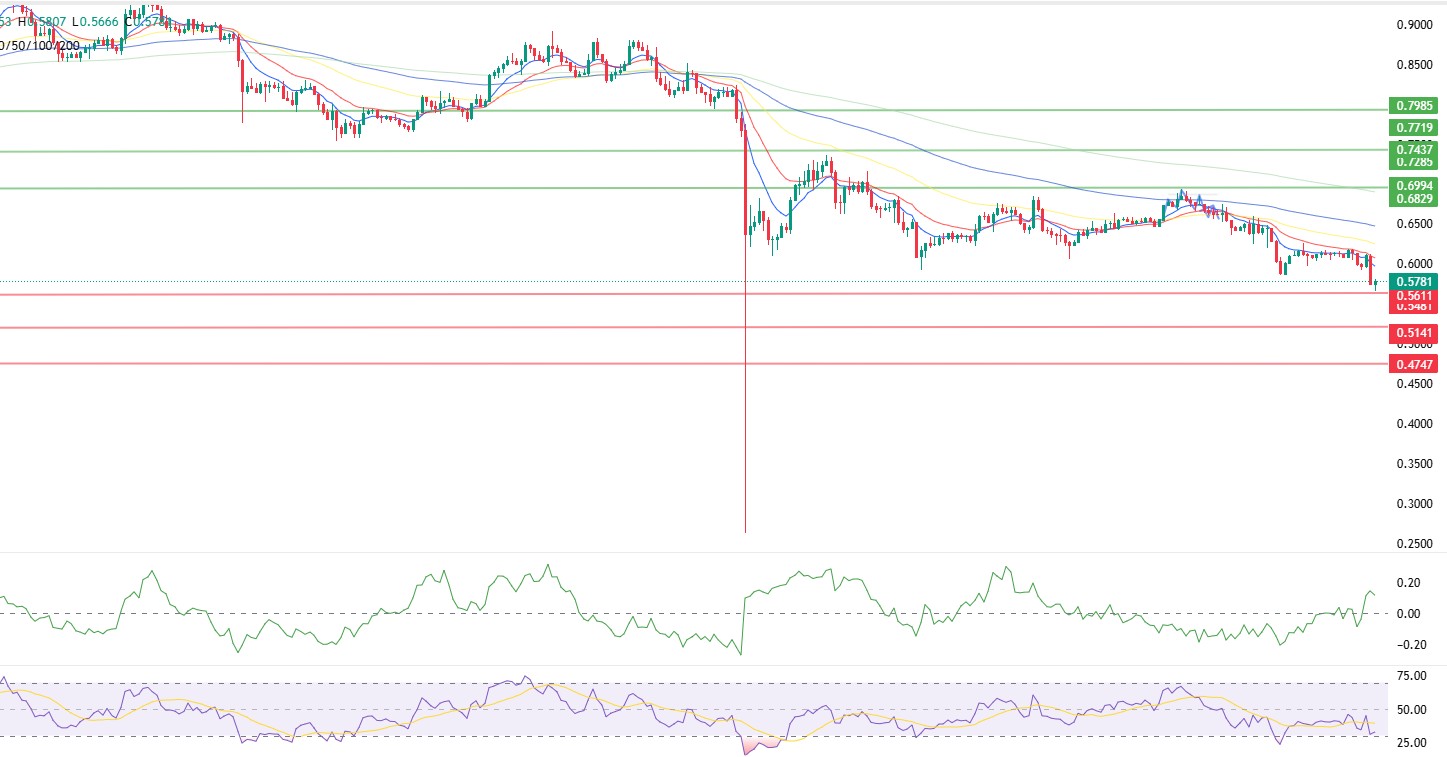
ADA started the week with a decline, falling 6% within 24 hours. Reports emerged over the weekend that whale wallets sold $100 million worth of tokens, causing the price to fall below the $0.6000 level and test its first support at $0.5777, the weekly close. These sales, which occurred as the price approached the bottom of a triangle formation on the daily chart over several months, suggest that this may have been profit-taking rather than panic selling. While ADA’s market cap hovered around $22 billion, the price fell below the 50 and 100-day Exponential Moving Average (EMA-Blue Line) and (EMA-Black Line) on the 4-hour chart, moving towards the support level of $0.5611 tested on October 10. The observed decline in volatility confirms that the market is in a short-term selling trend. If the price continues to remain below all moving averages during the day, it indicates that the downtrend may continue. The Relative Strength Index (RSI-14) has fallen to 31 levels, signaling a decline along with the Chaikin Money Flow (CMF-20). The decrease in cash inflows may keep the CMF in negative territory and indicate that selling pressure will continue. If the price rises during the day and re-enters the Fibonacci level of 0.5848, the resistance level of 0.6994 could emerge as an important level to watch. In this case, it could signal that the upward trend may continue in the medium term.
If there is an increase due to macroeconomic data or positive news related to the Cardano ecosystem, the $0.7437 level stands out as a strong resistance point. If this level is broken upwards, the increase is expected to continue.
Supports: 0.4747 – 0.5141 – 0.5611
Resistances: 0.6994 – 0.7437 – 0.7985
Legal Notice
The investment information, comments, and recommendations contained herein do not constitute investment advice. Investment advisory services are provided individually by authorized institutions taking into account the risk and return preferences of individuals. The comments and recommendations contained herein are of a general nature. These recommendations may not be suitable for your financial situation and risk and return preferences. Therefore, making an investment decision based solely on the information contained herein may not produce results in line with your expectations.


