
Weekly Technical Analysis Report
BTC/USDT
Last week, global markets were shaped by signs of easing in US-China trade diplomacy, the Fed’s controlled easing process, and increased institutional demand for digital assets. While the summit between Trump and Xi resulted in a one-year suspension of mutual tariffs and a decision to reduce fentanyl tariffs, the Fed’s 25 basis point interest rate cut and decision to end balance sheet reduction in December took center stage. While US Treasury Secretary Bessent’s announcement that the Fed chair would be appointed before Christmas drew attention, the Fed provided liquidity to the system with a $29.4 billion repo transaction.
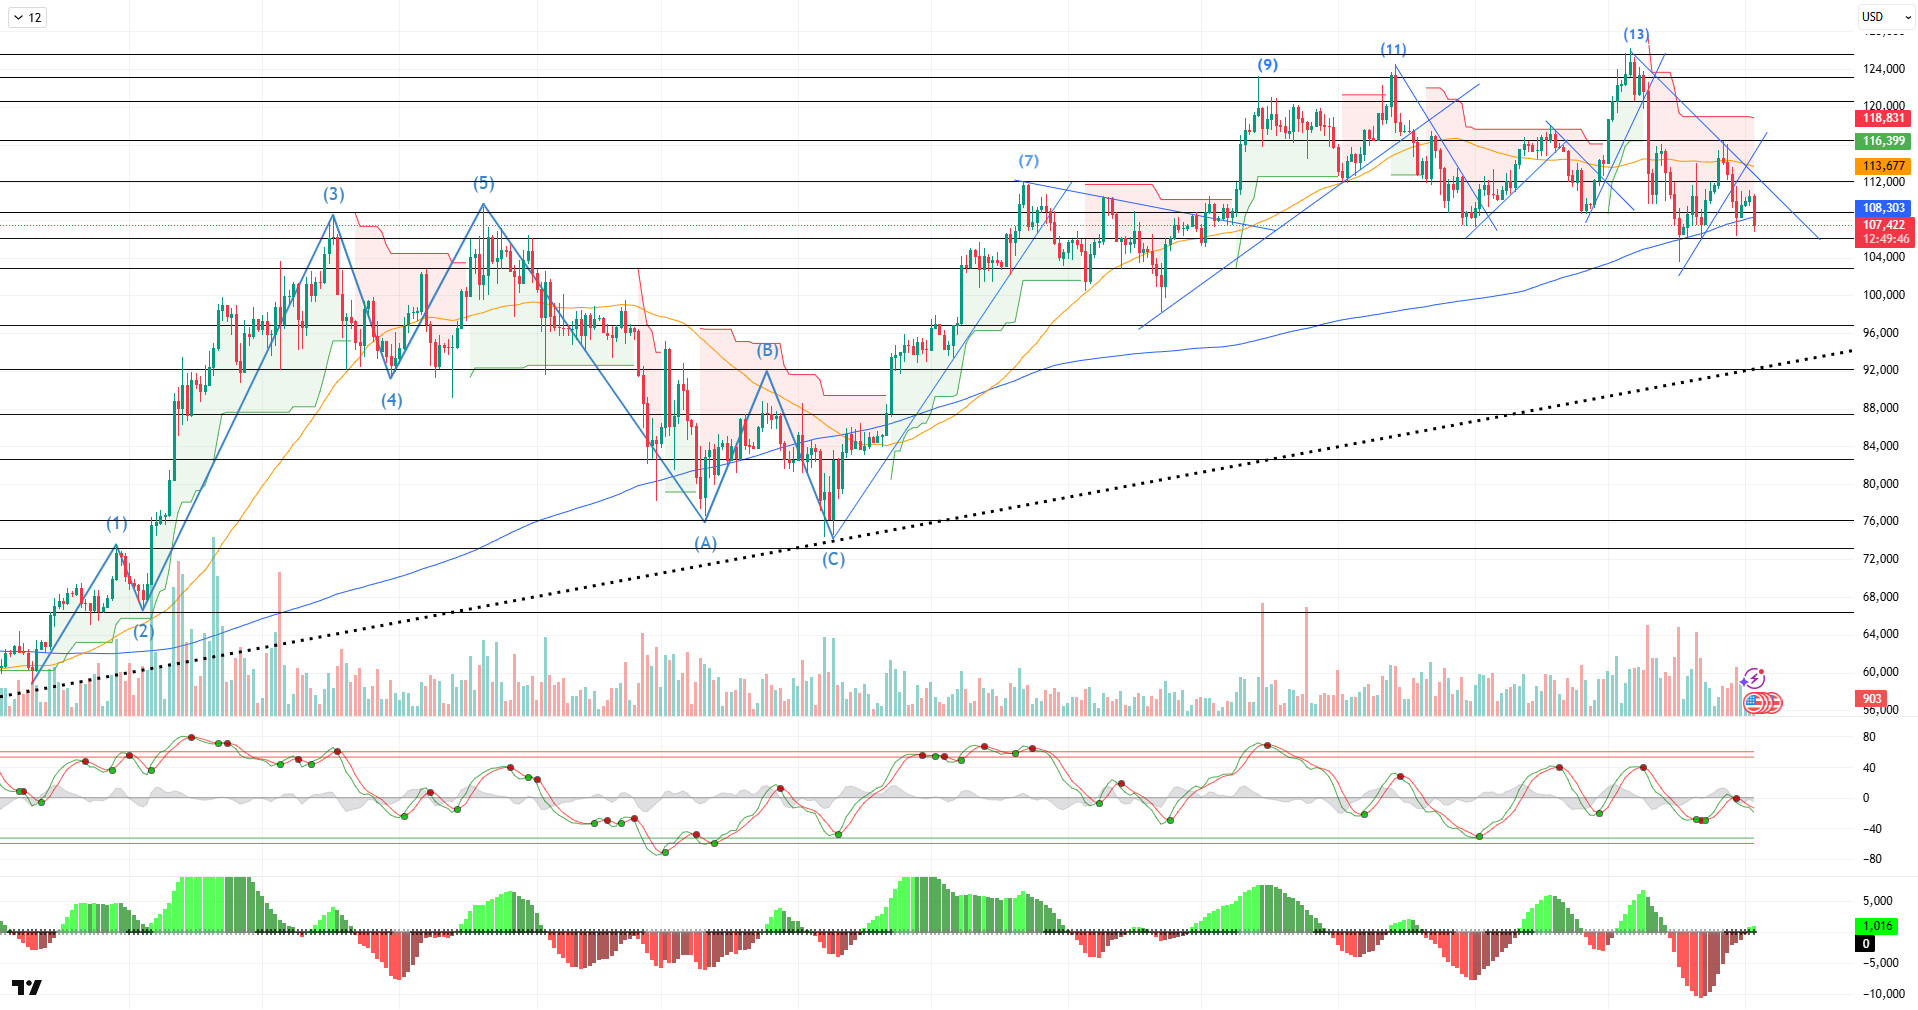
Looking at the daily technical outlook following all these developments, BTC continues its downward trend from the ATH level of 126,200 points, which it reached with its golden cross pattern at the 13th point. The price, which recorded occasional interim rises, fell below the SMA 200 level. After previous attempts to reach new highs, the price, which touched the major uptrend, regained momentum, and currently, there is a 13% gap between it and the trend line. If the price consolidates further, this gap is expected to narrow, potentially triggering a touch.
Looking at technical indicators, the Wave Trend (WT) oscillator is giving a sell signal in the middle band of the channel on a daily basis, while the Squeeze Momentum (SM) indicator continues to attempt to move into positive territory after reaching maximum weakness in the negative zone. In moving averages, the golden cross pattern continues as the 50-day SMA crosses above the 200-day SMA.
When examining weekly liquidity data, the buying level has become quite sparse, while the selling level has intensified at the 112,000 level. Looking at the last 7 days of liquidity data, there is a $200 million accumulation of transactions at the buying level, while there is approximately $500 million accumulation of transactions at the selling level.
In summary, while developments in the reconciliation process between the US and China were viewed positively by the markets, the Fed’s indecisive stance for its upcoming meeting emerged as a factor weighing on the market. The lack of concrete developments regarding the reopening of the US government continues to be another factor creating uncertainty. Technically, the price continues its downward trend, while the liquidity data shows bears dominating. In the coming period, holding above the 105,000 reference level is crucial for the continuation of the uptrend. Closing above this level would bring a renewed focus on the 110,000 level, and if breached, the liquidity zone will be monitored. In the event of potential selling pressure, 105,000 will be monitored as a critical reference zone.
Supports: 105,000 – 103,000 – 100,000
Resistances: 110,000 – 112,400 – 115,000
ETH/USDT
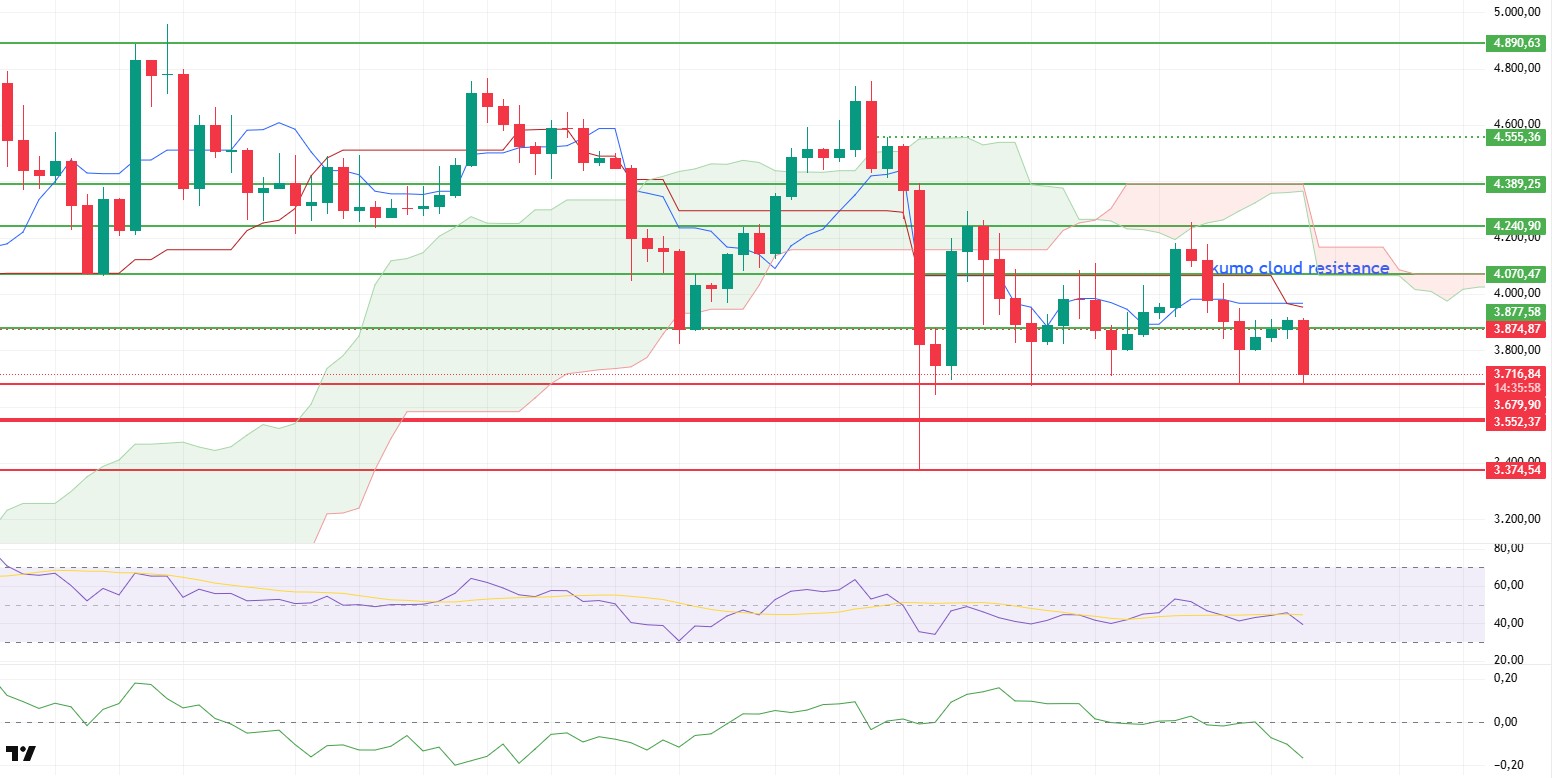
The Ethereum price generally followed a weak trend last week. Starting the week by rising to the lower band of the cloud at the $4,240 level, the price received strong rejection from this area and fell to the $3,679 support level throughout the week under the influence of selling pressure. The price is currently trying to hold on to this support zone. However, the current technical structure indicates that the downtrend has not yet ended.
Developments in DeFi throughout the week negatively impacted the perception of trust in the Ethereum ecosystem. A report shared by CYvers based on Nansen data highlighted the suspicious transfer of approximately $70 million worth of staked ETH assets (wstETH, wETH, OSETH) in the Balancer protocol to a new wallet. Although there has been no official confirmation of a hack yet, the on-chain activity suggests that the incident could be serious. Such security concerns could weaken confidence in the DeFi ecosystem in the short term and lead to a cautious stance among institutional investors.
On-chain data supports this picture. The total amount of staked ETH falling to 36.08 million indicates a decline in confidence among long-term investors and a slowdown in staking activity. This structure can be interpreted as a signal of medium-term weakness in the market.
The Chaikin Money Flow (CMF) indicator fell into negative territory following last week’s sharp decline, signaling strong liquidity outflows. This outlook indicates that selling pressure is still effective and that the market has lost its buyer momentum. If the CMF continues its course in this region, the price is likely to struggle to recover.
The Relative Strength Index (RSI) indicator fell below the 50 level, unable to hold above the moving average line. With momentum accelerating, the indicator presents a weak outlook. The RSI remaining at these levels limits the price’s potential for an upward reaction.
In the Ichimoku indicator, the price being rejected from the kumo cloud and remaining below the Tenkan and Kijun levels confirms that the downtrend is technically continuing. However, in the short term, the Tenkan level rising above the Kijun level could trigger limited rebound buying. Nevertheless, as long as the price remains below the cloud, the overall trend will remain negative.
Looking at the overall technical picture, if the $3,679 support level is not maintained, selling pressure is expected to increase and the decline could deepen to the $3,374 level. On the other hand, if the price breaks above the $3,877 level and, in particular, manages to stay above the $4,070 kumo cloud resistance, the current negative outlook could shift to a positive one. Such a scenario could pave the way for sharp and high-volume increases in the ETH price. In summary, the weekly outlook remains weak for now. Increased liquidity outflows and momentum loss in technical indicators support the downward trend in the short term. However, a strong break above the $4,070 level stands out as the most critical signal that could initiate a recovery process in the medium term.
Supports: 3,679 – 3,552 – 3,374
Resistances: 3,877 – 4,070 – 4,240
XRP/USDT
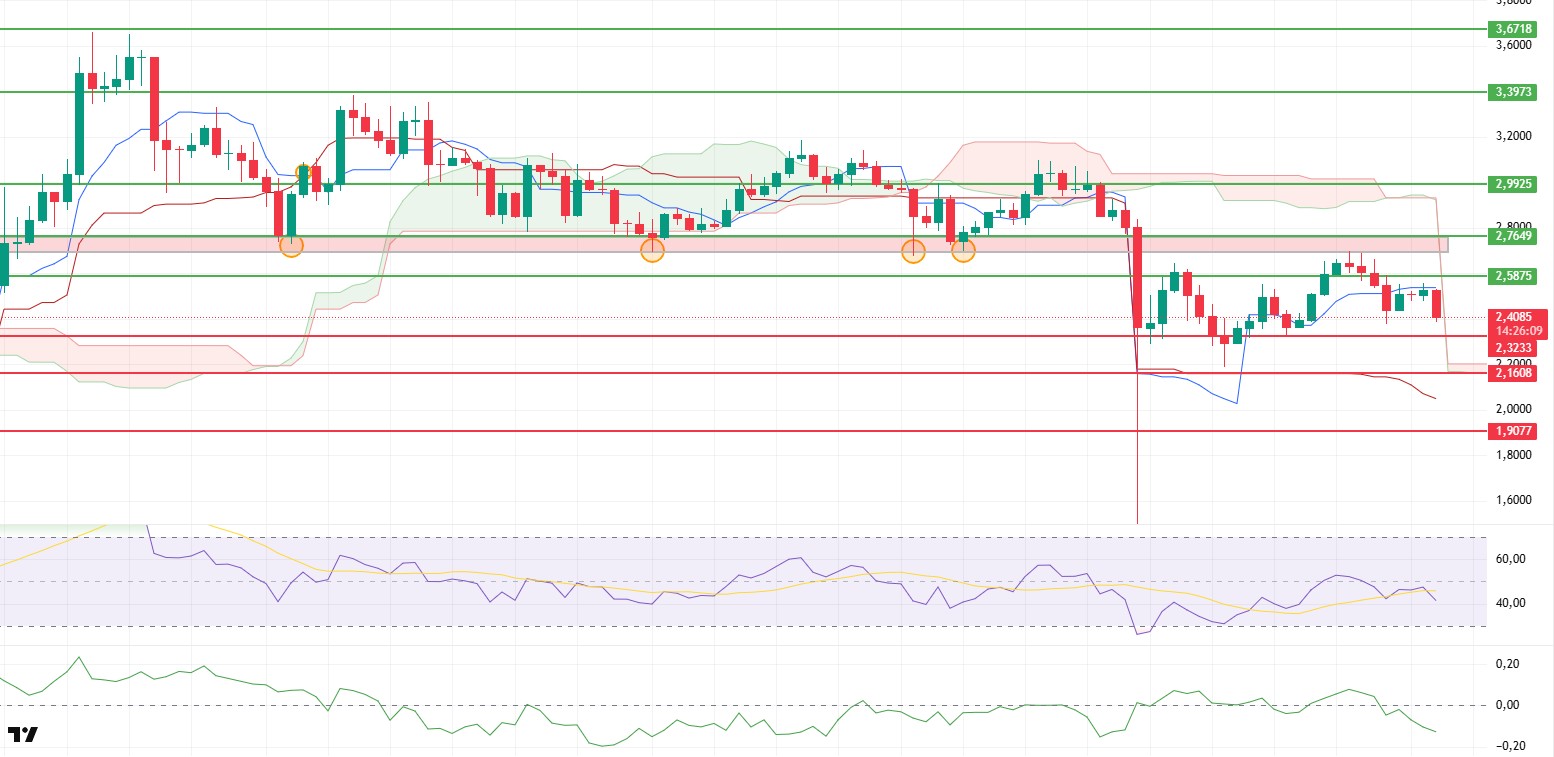
The XRP price faced strong selling pressure last week. Starting the week by rising to the critical resistance zone at $2.69, the price gradually retreated amid selling from this zone and fell to $2.39 by the end of the week. This movement indicates that the market has turned downward in the short term and buyers have lost strength.
The Chaikin Money Flow (CMF) indicator experienced a sharp decline along with the price and fell into negative territory, signaling intense liquidity outflows. This structure indicates that capital flows are moving away from buyers and that selling pressure is dominant in the market. If the CMF remains in negative territory, recovery attempts are likely to be limited.
The Relative Strength Index (RSI) indicator fell to 41, revealing a clear loss of momentum. The RSI remaining below 50 indicates weak buyer strength and suggests that the market may continue its short-term downward trend.
The picture is also negative in the Ichimoku indicator. The price is moving below both the kumo cloud and the Tenkan and Kijun levels. This structure confirms that the trend is downward and that the market is still in negative territory. The price’s inability to rise above these levels weakens the possibility of a short-term recovery.
The overall technical outlook remains negative. If the price loses support at the $2.39 level, selling pressure could deepen, and the decline could be expected to continue to the $2.32 level. On the other hand, regaining the $2.58 level could break this negative structure in the short term and trigger an upward reaction. However, unless sustainability is achieved above this level, gains are likely to remain limited.
Supports: 2.3233 – 2.1608 – 1.9077
Resistances: 2.5875 – 2.7649 – 2.9925
SOL/USDT
Last week in the Solana ecosystem;
- The Huaxia Solana ETF officially began trading on the Hong Kong Stock Exchange on October 27, 2025.
- VanEck submitted the sixth amendment filing for its proposed Solana ETF.
- Grayscale announced the Solana Trust as the largest spot Solana fund in the US.
- Bitwise and Canary Capital officially launched their own Solana ETFs on October 28.
- Western Union will launch its Solana-based stablecoin.
- Grayscale’s Solana Trust ETF (GSOL) begins trading today on the New York Stock Exchange Arca.
- Fidelity recently updated its S-1 filing for the SOL ETF by removing the ‘delay change’ that previously blocked automatic registration.
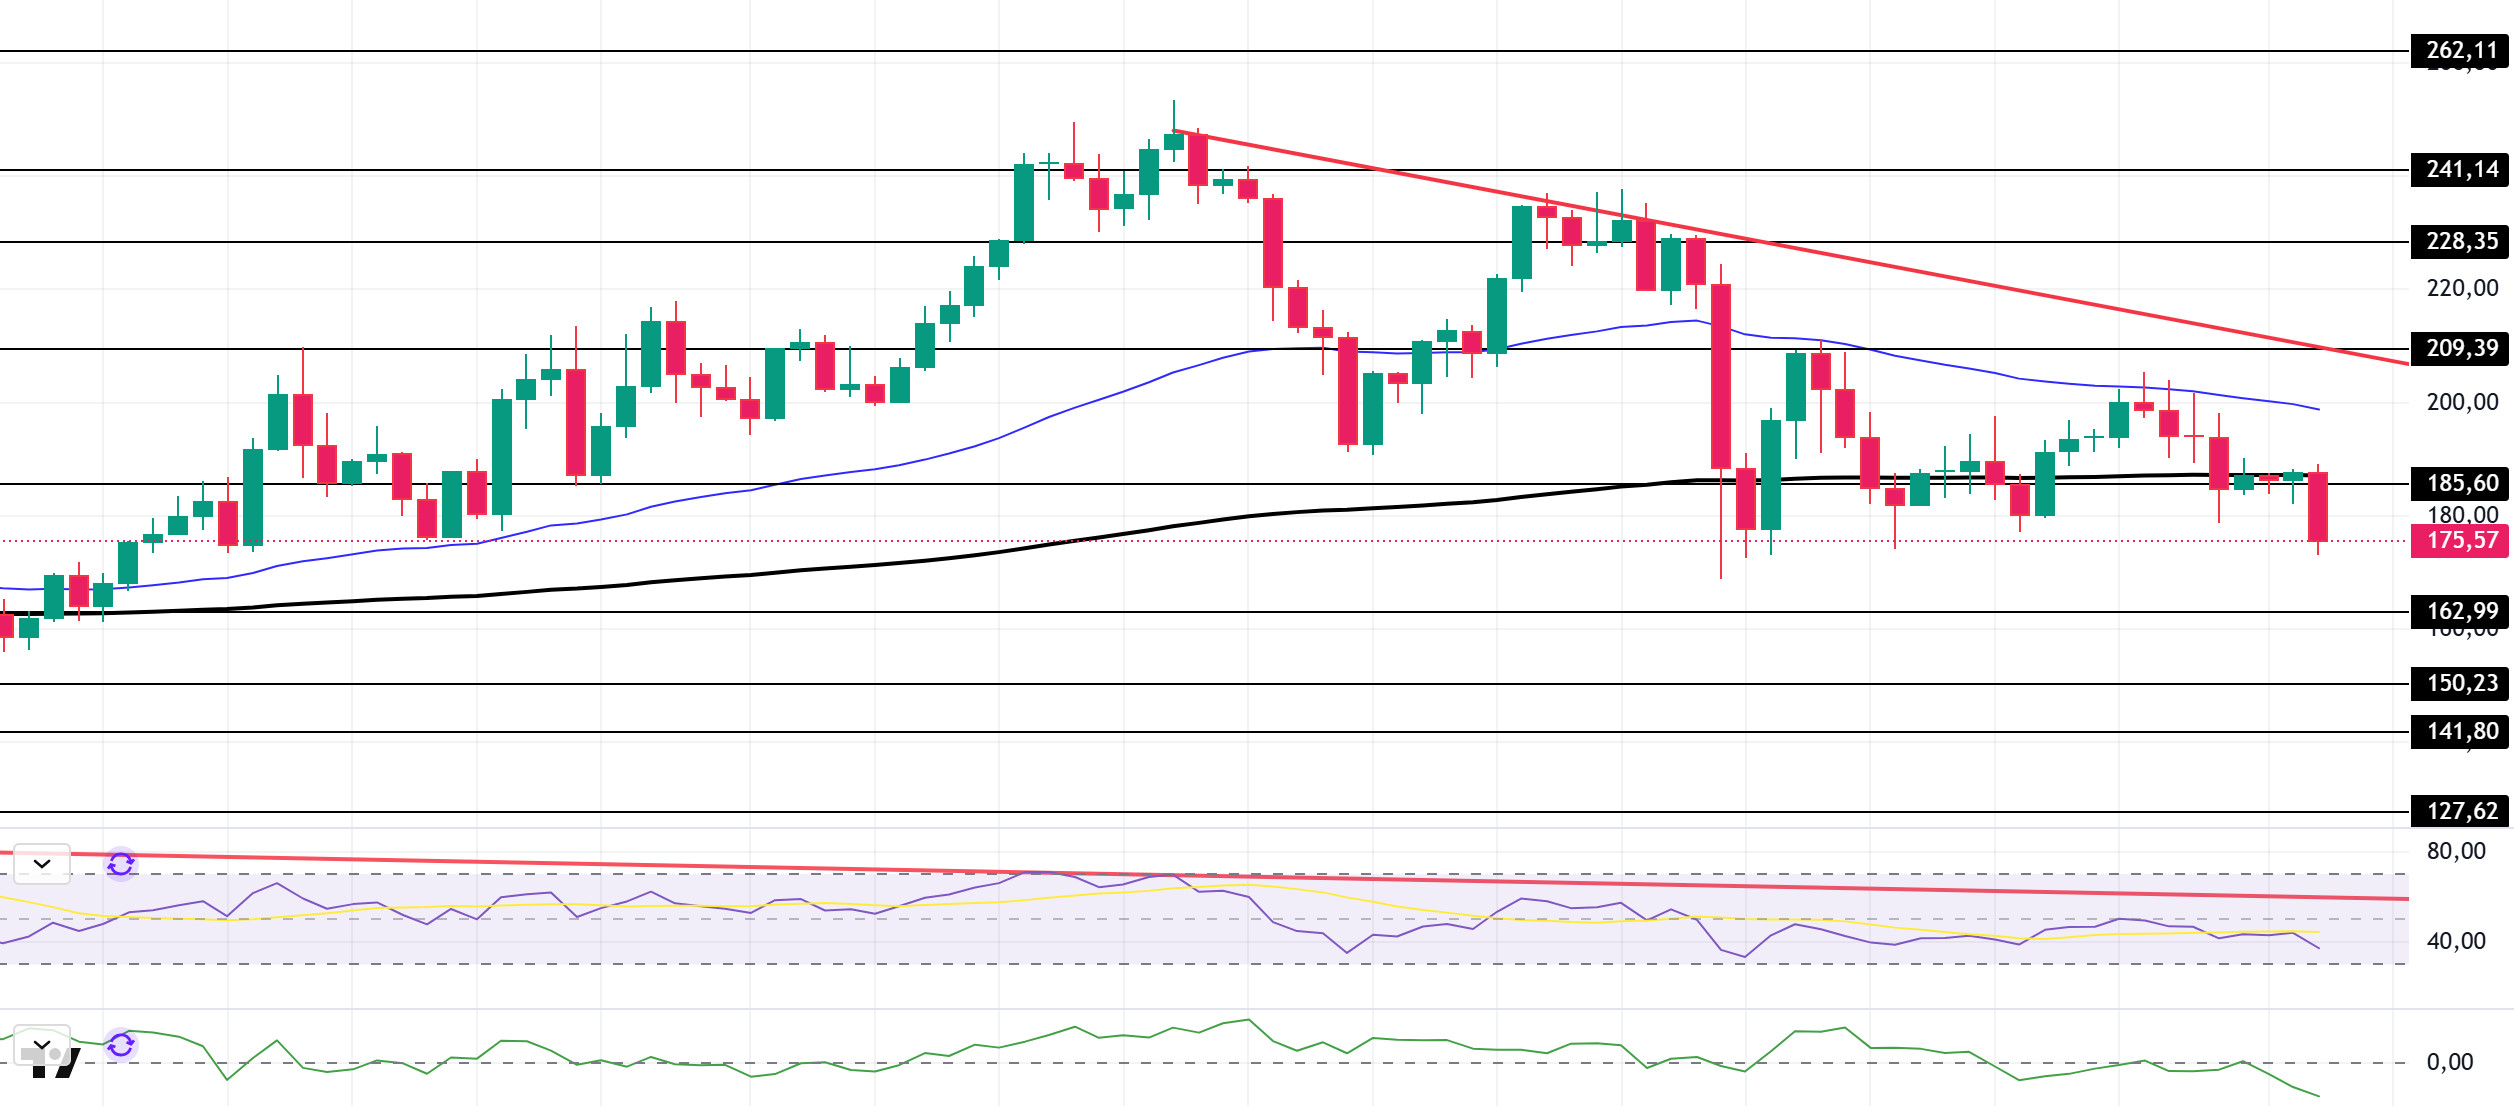
The SOL price showed a decline on the daily chart this week. The asset remained in the lower region of the downtrend that began on September 18. The price tested the 200 EMA (Black Line) moving average and the strong support level of $185.60 as support but failed to hold there, deepening its decline and falling by approximately 11.63%. If the pullback continues, it could test the $162.99 level. If it rallies, it could test the downtrend line as resistance.
The asset is trading below its 50 EMA (Exponential Moving Average – Blue Line) and 200 EMA (Black Line) moving averages, indicating that the asset is trending downward. Furthermore, the 50 EMA continuing to sit above the 200 EMA signals the continuation of a technical “golden cross” formation. This indicates that the potential for an uptrend in the medium term remains intact. The RSI (14) has retreated to the middle of the negative zone. At the same time, the indicator has remained below the downward trend line that began on July 22. This indicates that selling pressure is not strong. The Chaikin Money Flow (CMF-20) has moved into negative territory; at the same time, the decrease in money inflows could push the CMF-20 indicator deeper into negative territory. If macroeconomic data remains positive and developments in the ecosystem continue to be favorable, the first major resistance level of $209.39 could be retested. Conversely, in the event of potential negative news flow or deterioration in macro data, the $150.23 level could be monitored as a potential buying opportunity.
Supports: 162.99 – 150.23 – 141.80
Resistances: 185.60 – 209.39 – 228.35
DOGE/USDT
Charles Hoskinson renewed his offer to help Elon Musk boost Dogecoin and make it X’s official currency.
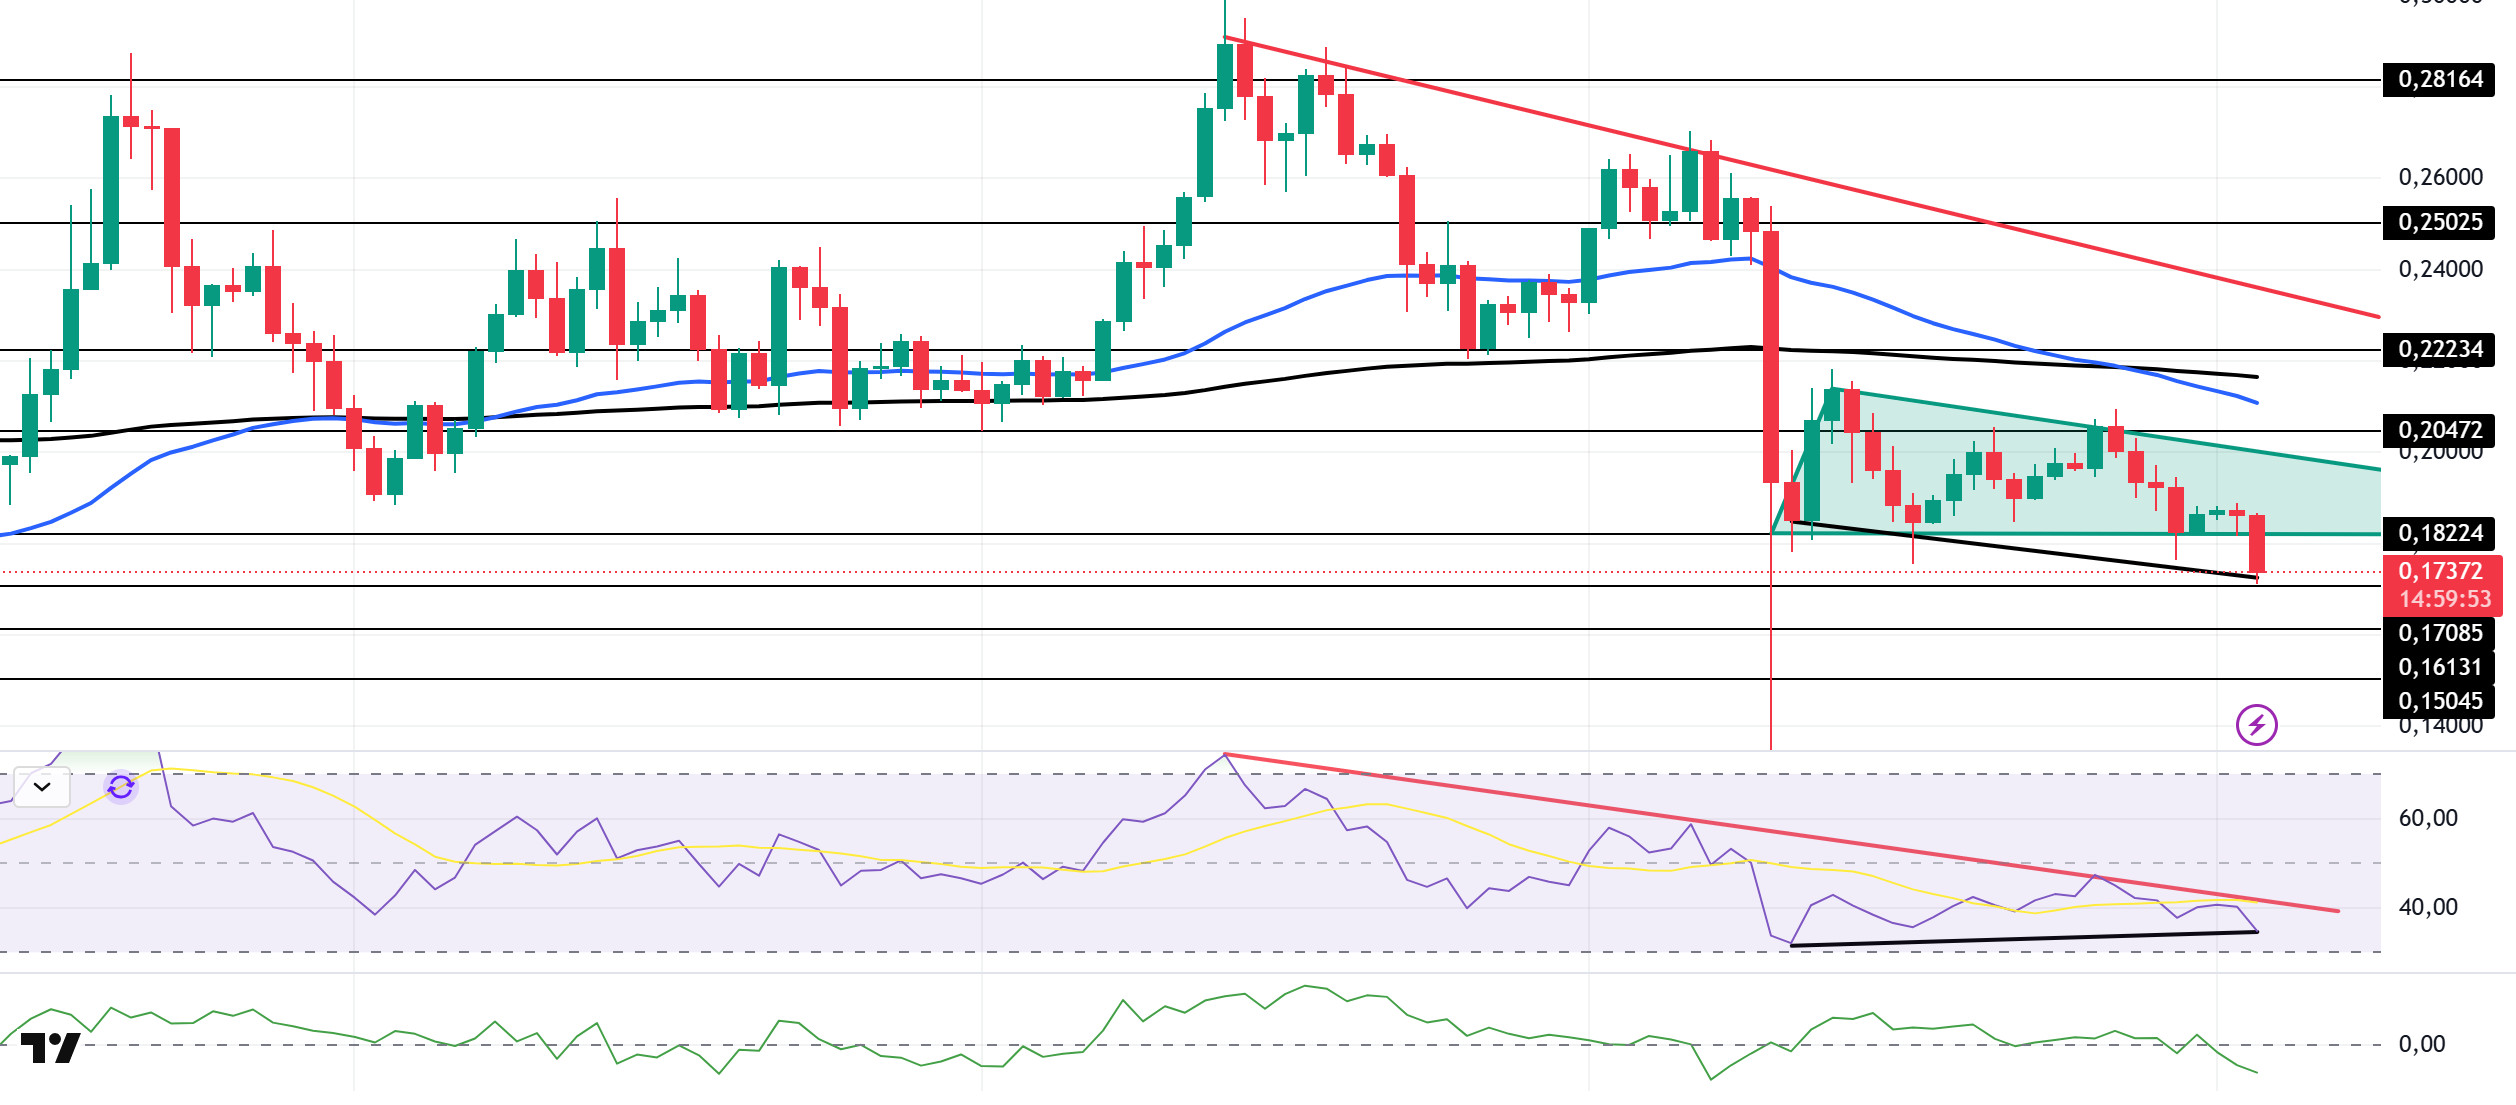
On the daily chart, DOGE has been declining since last week. The price tested the strong support level of $0.18224 for the third time, found support there, and experienced a slight upward acceleration. However, the asset is currently deepening its pullback, breaking below the descending triangle formation. This could mean that the decline is gaining strength. If the decline continues, it may test the $0.16131 level as support. In the event of an uptrend, the 50 EMA (Blue Line) moving average can be monitored.
The asset continued to trade below the 50 EMA (Blue Line) and 200 EMA (Exponential Moving Average – Black Line) moving averages. This indicates that the asset is trending downward. On the other hand, the 50 EMA being below the 200 EMA indicates that a “dead cross” formation has begun. This also indicates that the asset has an increased potential to lose value at this point. The Chaikin Money Flow (CMF–20) indicator has moved into negative territory. Money inflows continue to decline. This could push the CMF-20 deeper into negative territory. Looking at the Relative Strength Index (RSI-14) indicator, it remained in the middle of the negative zone. It also continued to trade in the lower region of the downtrend that has been ongoing since September 13. This indicates that selling pressure continues. On the other hand, there is positive divergence. In the event of macroeconomic risks or negative news from the ecosystem, the $0.16131 level can be monitored as strong support. On the other hand, if the upward movement gains strength, the $0.20472 level comes to the fore as the first strong resistance level.
Supports: 0.17085 – 0.16131 – 0.15045
Resistances: 0.18224 – 0.20472 – 0.22234
TRX/USDT
Last week saw an important development for the cryptocurrency ecosystem. The T3 Financial Crimes Unit (a partnership between Tether and TRM Labs), which includes Tron, announced that it had identified and frozen over $300 million in illegal cryptocurrency assets globally. Tron founder Justin Sun commented on the news, stating, “This milestone is proof that progress is made when technology, institutions, and people work together.”
Last week, the TRON network generated a total of $44.5 million in revenue, continuing to be the highest-earning ecosystem among all blockchain networks. The positive trend observed in TRON network revenues supports its strong position in the DeFi and stablecoin sectors.
During the week of October 27 to November 2, 2025, a total of 28 million TRX were burned on the TRON network. This reduced the circulating supply by 0.6 million. The decrease in circulating supply creates a deflationary effect on TRX. Additionally, the total number of addresses increased by 1.7 million to 343 million during the same week.
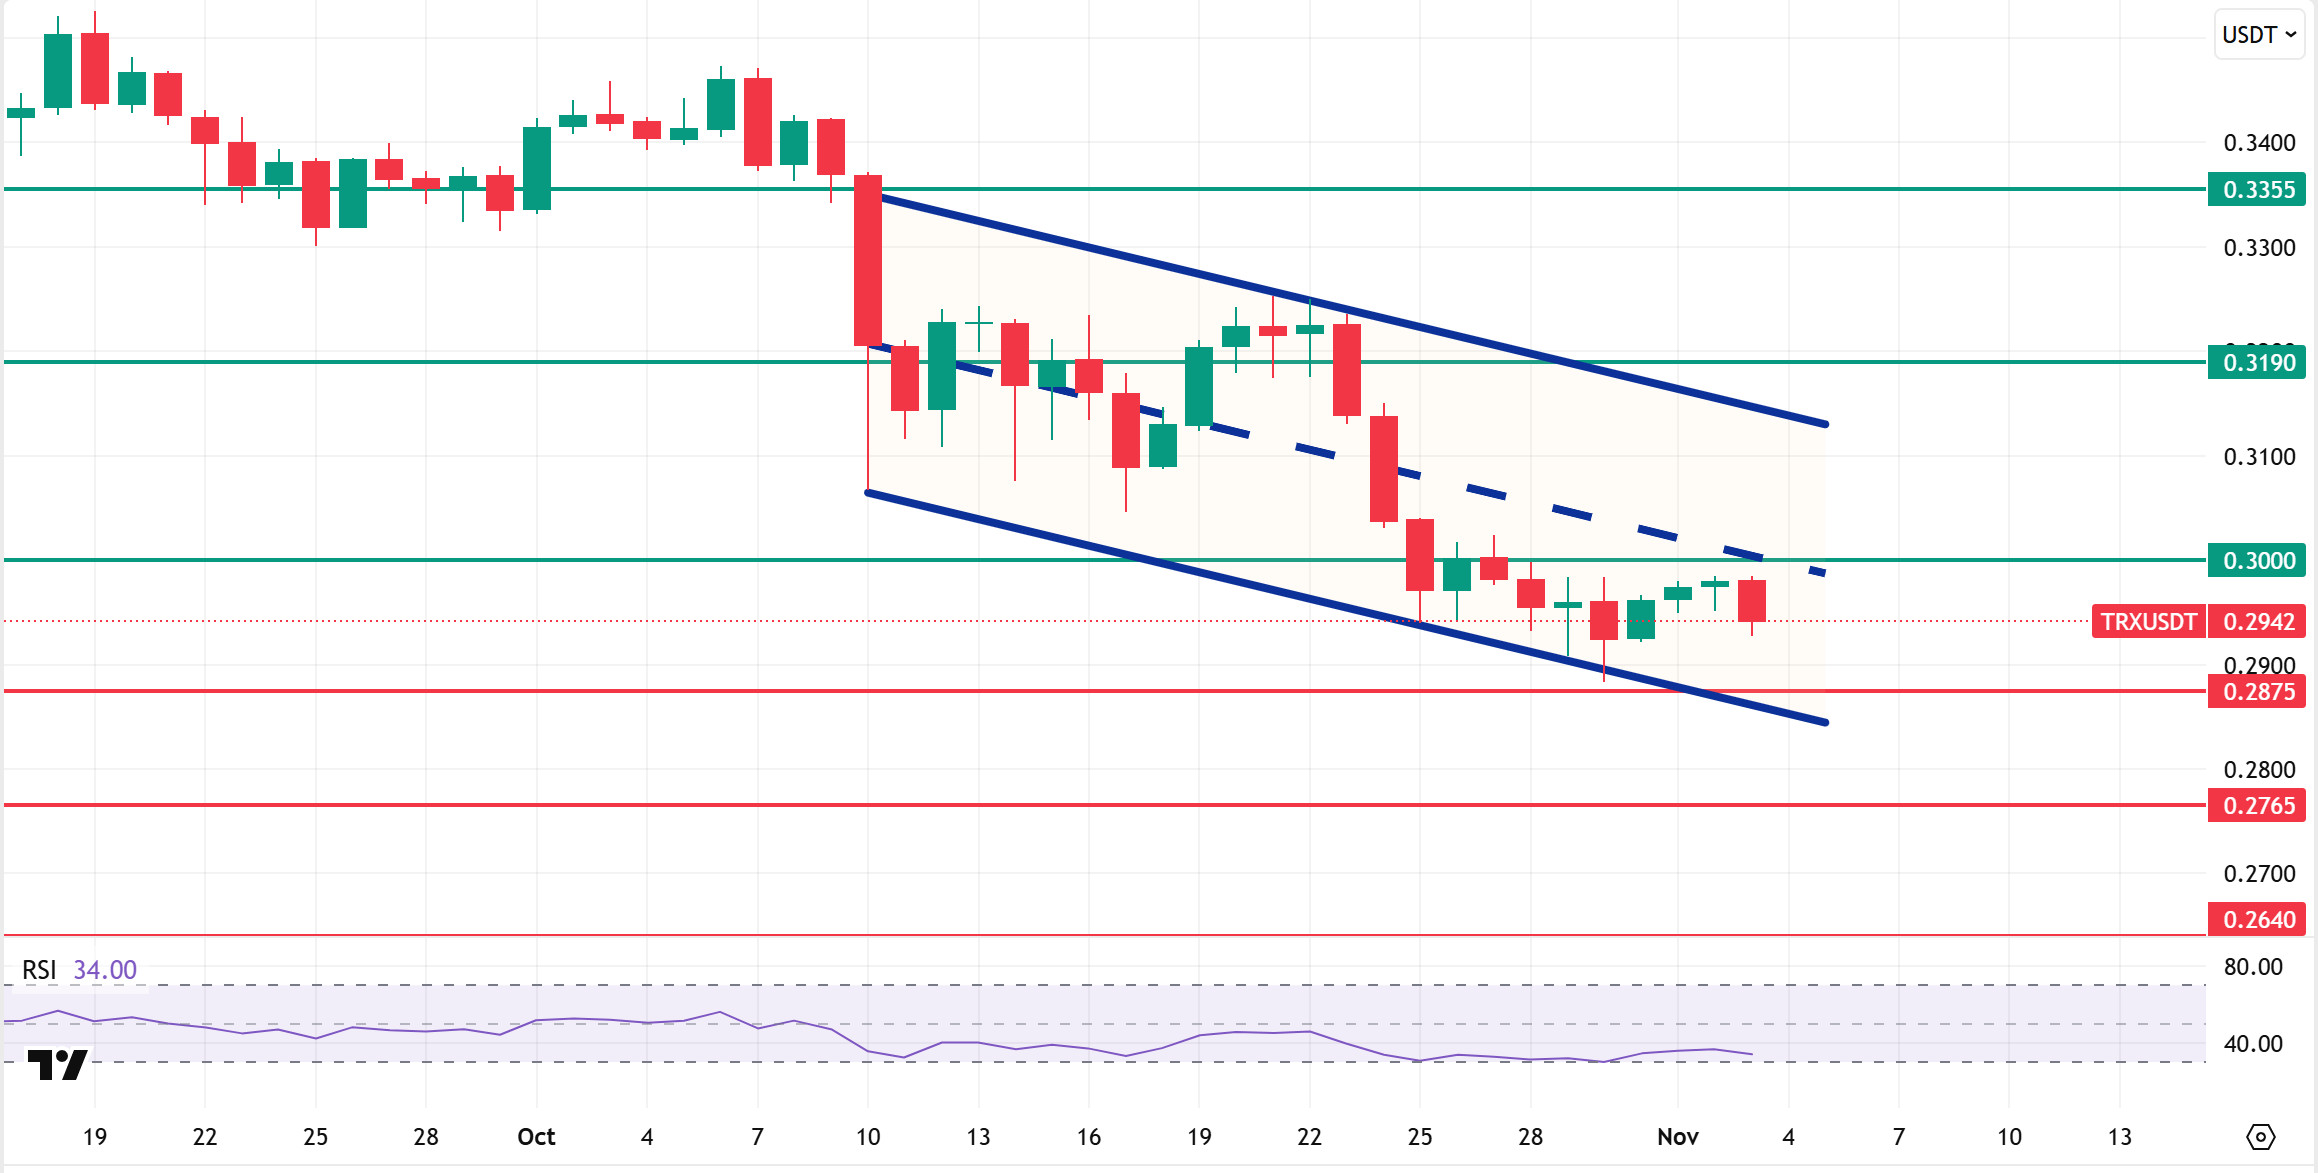
Technically speaking, TRX started last week at 0.3003 and closed the week at 0.2980, falling approximately 1% over the course of the week. Thus, TRON, which has completed its fourth consecutive week of decline, has a market value of $28.2 billion. Currently trading at 0.2942, TRX is just below the middle band of the bearish channel on the daily chart and is hovering near the 0.3000 resistance level. The Relative Strength Index (RSI) value is observed to be very close to the oversold zone at 34. Considering its position within the bearish channel and the RSI indicator, the TRX price may be expected to rise. This indicates that it may want to move towards the upper band of the channel. In such a case, it may test the 0.3000 resistance. If it closes above the 0.3000 resistance level on a daily basis, it may test the 0.3190 resistance level. If it fails to close above the 0.3000 resistance level on a daily basis and selling pressure increases in the market, it may decline due to potential selling from this area. In such a case, it may test the 0.2875 support level. The 0.2640 level is being monitored as a critical support point on the daily chart. Staying above this level could maintain the upward trend, while closes below it could lead to increased selling pressure and deeper downward price movements.
Supports: 0.2875 – 0.2765 – 0.2640
Resistances: 0.3000 – 0.3190 – 0.3355
AVAX/USDT
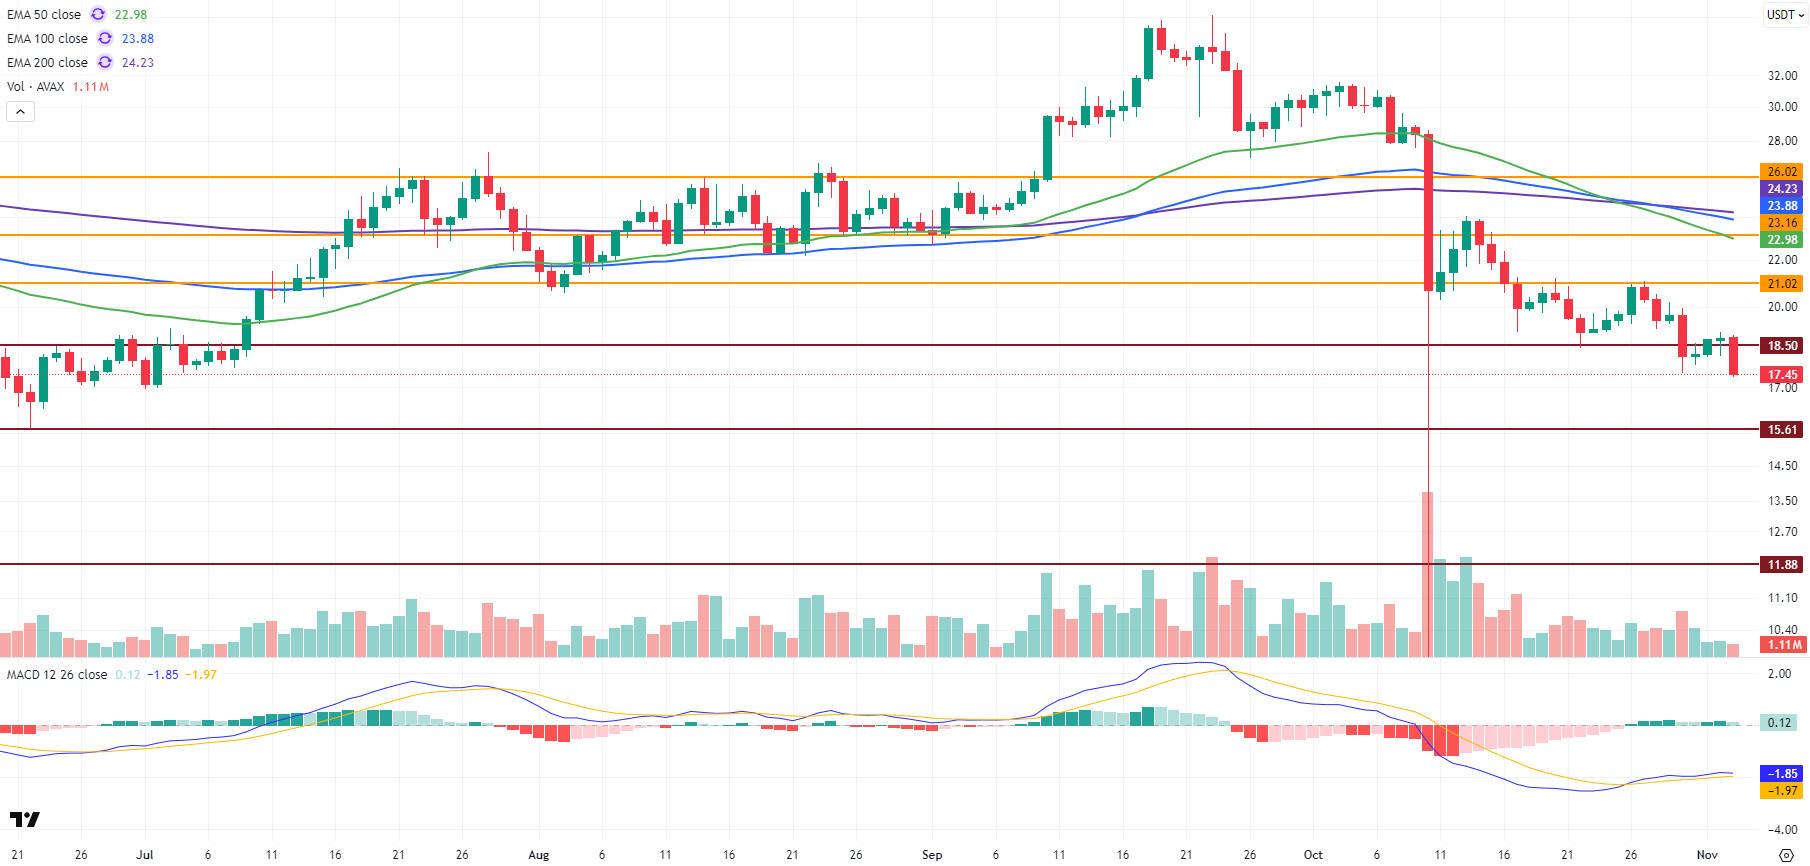
Starting last week at $20.83, AVAX closed the week at $18.80, losing approximately 9.7% of its value. Testing the $21 resistance level twice in the first days of the week, AVAX was unable to break through this region and was exposed to selling pressure. During the decline, selling intensified after the $18.50 support level was broken, pushing the price down to $17.50. Although a limited recovery was seen with buying in this region, weak volume and continued stagnation in the overall market caused AVAX to close the week in negative territory. Starting the new week with a downward trend, AVAX lost approximately 7.6% of its value today, falling to the $17.40 level. With this decline, AVAX has fallen below the $18.50 support level, which is seen as an important threshold in the short term. However, there has not yet been a clear close below this level on the daily chart. The $18.50 level is a critical threshold for this week, and staying below this region could lead to increased selling pressure. Although there were fundamentally positive developments in the Avalanche ecosystem last week, the ongoing low volume and lack of investor interest in the market as a whole prevented these developments from being reflected in the AVAX price in the short term. Although the ecosystem’s growth potential remains intact, upward attempts have been pressured due to market conditions.
On the daily chart, although the Moving Average Convergence/Divergence (MACD) line crossed the signal line upward in AVAX’s movement last week, momentum remained weak, and therefore the rise was limited. Currently, the MACD line continues its horizontal movement in the negative zone. The low momentum indicates weak potential for recovery in the short term. If the MACD regains a downward trend, it could lead to increased selling pressure and a strengthening of the downtrend. Furthermore, AVAX continues to trade below all critical Exponential Moving Average (EMA) levels. These areas form a strong resistance band at the $23 level, and AVAX’s failure to move away from these levels confirms that the trend is still in negative territory. If AVAX approaches this resistance band, selling pressure is likely to increase. A move above these levels could only gain upward momentum if supported by an increase in volume.
From a technical perspective, the $21 level continues to hold strong resistance for AVAX in the short term. If this level is broken and closes above it, the price could test resistance levels at $23.16 and $26.02. However, if the price fails to break through the EMA density in these areas, a sustained uptrend seems unlikely. In downward movements, the $18.50 level stands out as the first support. If there are closes below this level, selling pressure may increase and the price may retreat to the $15.61 and $11.88 support levels. In the overall outlook, the weak momentum on the MACD side and the fact that it remains below critical EMA levels indicate that the trend is still in negative territory. This situation may cause increased selling pressure on AVAX and accelerate the decline. AVAX closing below the $18.50 support level could reinforce this scenario. While upward attempts remain limited in the short term, for AVAX’s technical outlook to shift back to the positive side, it needs to remain above $21 and show a significant increase in trading volume.
(EMA50: Green Line, EMA100: Blue Line, EMA200: Purple Line)
Supports: 18.50 – 15.61 – 11.88
Resistances: 21.02 – 23.16 – 26.02
SHIB/USDT
This week, the Shiba Inu ecosystem painted a picture of strengthening in terms of infrastructure security and supply discipline, while L2 activity remained weak. The development team phased out the old public RPC access within two weeks and unified the official endpoint; the goal was to eliminate a single point of failure and transition to a more distributed architecture. This transition may create friction in transaction traffic in the short term as it requires configuration updates on the wallet and dApp side, but it increases resilience in the medium term.
On the security front, the team again warned the community about phishing attempts mimicking fake interfaces and reiterated the call to avoid suspicious links and revoke old approvals. The burn channel accelerated throughout the week in supply management: approximately 1.07 million SHIB were burned in the last 24 hours, and approximately 61.17 million SHIB were burned in 7 days, with the weekly burn rate increasing by 139%; while this increase alleviates short-term pressure, it needs to be fueled by transaction volume for a lasting effect. Adoption signals on the L2 side remained weak: Shibarium’s daily transactions hit a low of 2,980, active addresses fell to 243, and daily fees collected at around 115 BONE signaled a contraction in economic activity; this limits the efficiency of the mechanism extending from BONE fees to SHIB burning. In a step to close the process following the bridge exploit, K9 Finance DAO activated a smart contract that allowed the exploiter to return the frozen KNINE and receive a 20 ETH reward, paving the way for a return via an on-chain approve atomic swap flow; this was a tactical move that softened the risk narrative stemming from the bridge incident.
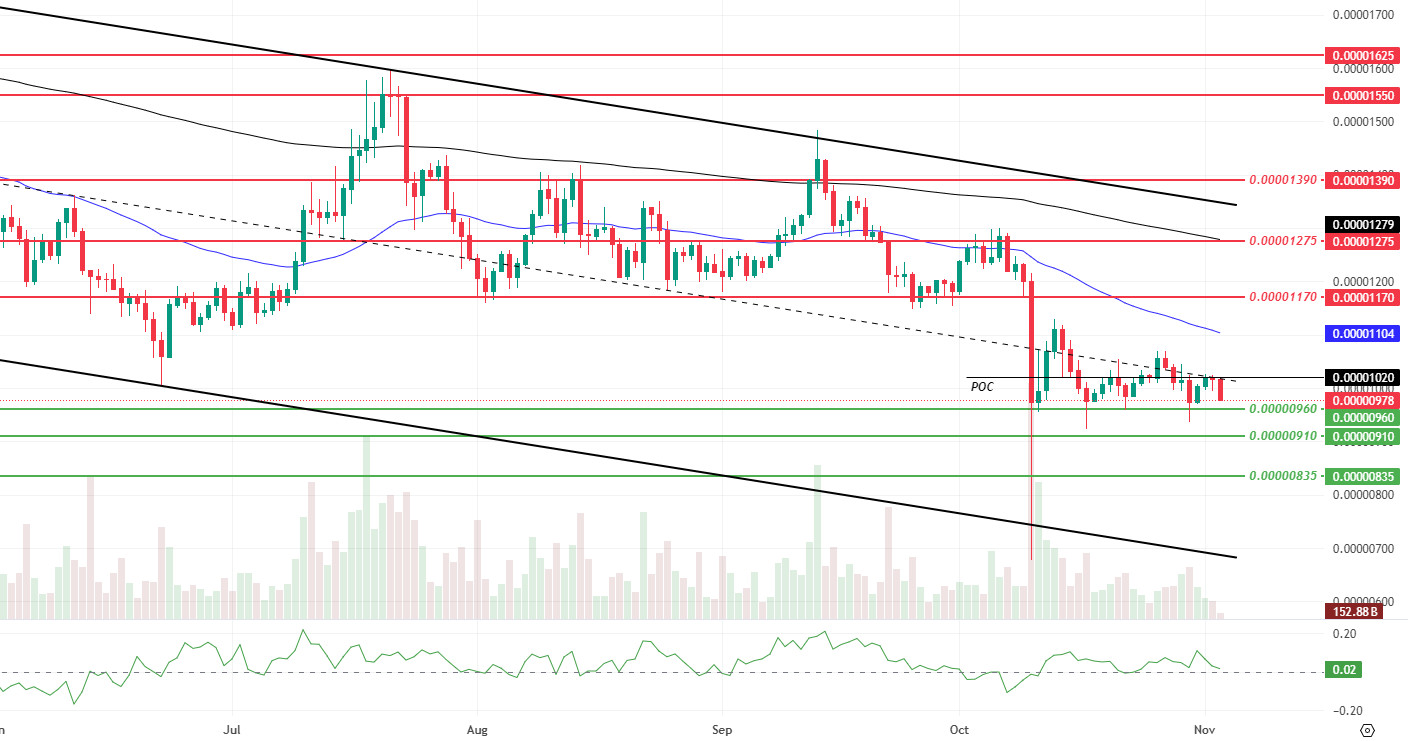
This week’s technical outlook confirms that the post-sell-off rebound is continuing on weak ground. There are minor pullbacks in volume, momentum, and volatility. The price failed to break above the previous week’s Point of Control (POC) level of $0.00001020 and is currently hovering around $0.00000980, moving towards our first support area at $0.00000960. Although the Chaikin Money Flow (CMF) remains in positive territory, signaling continued inflows, the price continues to trade below the 50 EMA and 200 EMA. The downward trend within the descending channel is intact, and there is no clear volume confirmation to increase momentum in the short term.
From an upward perspective, closes above $0.00001020 will be the first supportive signal. Subsequently, settling above the EMA 50 around $0.00001104 and volume-backed retracement of intermediate resistance levels could strengthen the movement. If these conditions materialize, $0.00001170 and $0.00001275 could be monitored as intermediate targets. Below, if the price cannot hold the $0.00000960 level, it could pave the way for accelerated weakness. In this case, $0.00000910 could be retested. Below that, $0.00000835 is tracked as a wide-band support. In summary, the price maintains its tight range around the POC thresholds. As long as the price remains below the EMA 50 and EMA 200, upward attempts may retain their corrective nature. For sustainability, a breakout from the channel requires a significant recovery in volume and volatility. (EMA200: Black line, EMA50: Blue line)
Supports: 0.00000960 – 0.00000910 – 0.00000835
Resistances: 0.00001170 – 0.00001275 – 0.00001390
BNB/USDT
In recent weeks, a noticeable positive price movement has been observed on BNB Coin following US President Donald Trump’s announcement that he had pardoned Changpeng Zhao. Following this development, many exchanges announced that they would add support for BNB on the BNB Smart Chain network, increasing ecosystem interaction.
Additionally, this week, the MMT and KITE projects were listed on the Binance Launchpool within the BNB ecosystem. These listings are expected to increase demand for BNB used in transaction fees and reduce the circulating supply through users staking BNB. These dynamics are anticipated to have a positive impact on the BNB price in the medium term.
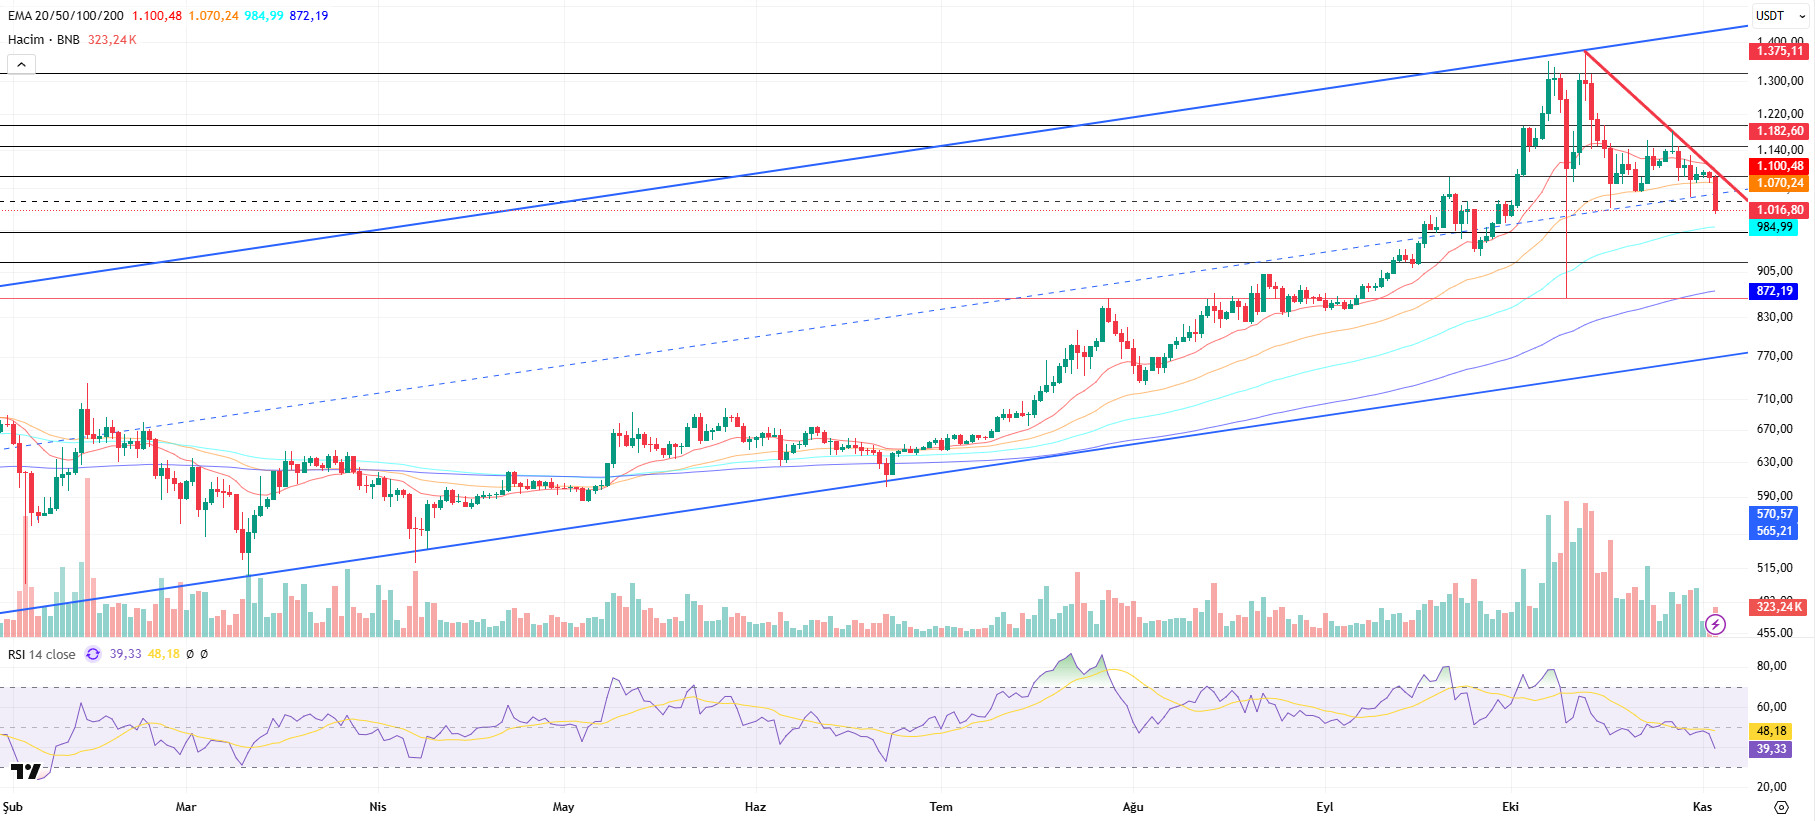
From a technical perspective, BNB/USDT has continued its correction movement from the all-time high (ATH) of $1,375 to the psychological support level of $1,000 ( ). While the pullback momentum appears to be slowing in this region, the asset continues to seek support.
Technical indicators for BNB/USDT, currently trading in the $980–1,080 range, show that declining trading volume is increasing pressure on the price. This picture reveals that the correction movement in the asset is still effective. Additionally, the Relative Strength Index (RSI) has fallen below the 50 level following recent pullbacks, indicating that BNB is approaching the oversold zone.
Within the current technical outlook, if selling pressure continues, the price is likely to fall back to the $980 support level. If this level is broken downwards, the $920 and $860 regions stand out as critical support levels. On the other hand, if buying pressure regains strength, BNB is expected to test the $1,080 resistance level first. If it manages to stay above this level, the price could technically move towards the $1,150 and $1,200 levels.
Supports: 980 – 920 – 860
Resistances: 1,080 – 1,150 – 1,200
LINK/USDT
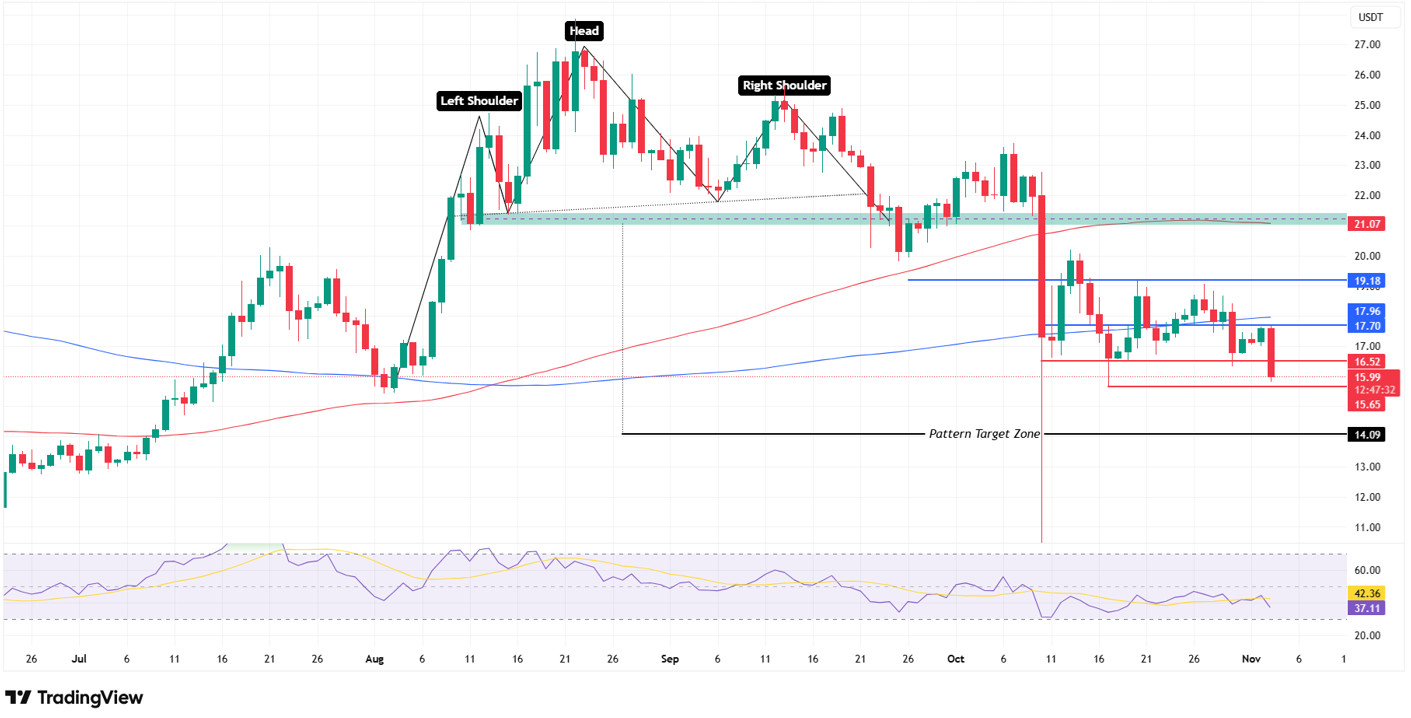
Link formed a Head and Shoulders pattern with the decline on October 10 and showed approximately 3 weeks of sideways movement after the pattern support break. Then, with the price falling below the 200-day moving average, we see that selling pressure has increased and a downtrend towards the pattern target has begun. Although we expect the price to rebound from our first support level of $16.52 in the short term, the current outlook shows that a breakout has occurred.
However, seeing the daily closing candle would be much healthier in terms of risk management. If we see a close below this level, our first support levels to meet the price will be $15.65 . With the overall structure losing strength and the trend continuing downward, considering the formation target, we can say that the price may complete its desire to reach the target zone.
However, if the price holds above $15.65, our sequential resistance levels and target zone will be at the $21 level. For this scenario to gain strength, it is critical that we see sustained pricing above $17.70 and do not lose the $16.52 level.
The Relative Strength Index (RSI) indicator is currently at 37 and remains in negative territory. Although there is positive divergence between price and RSI, no structure that could trigger this positive divergence is currently present when evaluating the current technical outlook. In summary, in the short term, staying above the $15.65 level has the potential to take us back to the $17 region, while dips below this level make a pullback to the formation target of $14 highly likely.
Supports: 16.52 – 15.65 – 14.09
Resistances: 17.70 – 19.18 – 21.07
SUI/USDT
This week, the Sui (SUI) ecosystem stood out with significant developments alongside the declines in the crypto market. In particular, the local decentralized exchange (DEX) project called HyperSui is launching an ICO on the SUI blockchain. This step aims to increase liquidity and trading volume in the SUI ecosystem. HyperSui aims to provide more liquidity to SUI, enabling users to enjoy lower transaction fees and faster transactions.
Furthermore, SUI is facilitating the development of blockchain applications by offering new tools for developers. Codeless and AI-powered software tools will enable developers to bring their projects to life more quickly and efficiently. This innovation aims to make the SUI ecosystem more accessible while promoting the widespread use of blockchain technology.
In conclusion, the SUI ecosystem has taken a significant step forward with increased liquidity and new tools for developers. However, the success of all these developments will depend on general market trends and the rate at which SUI’s solutions are adopted.
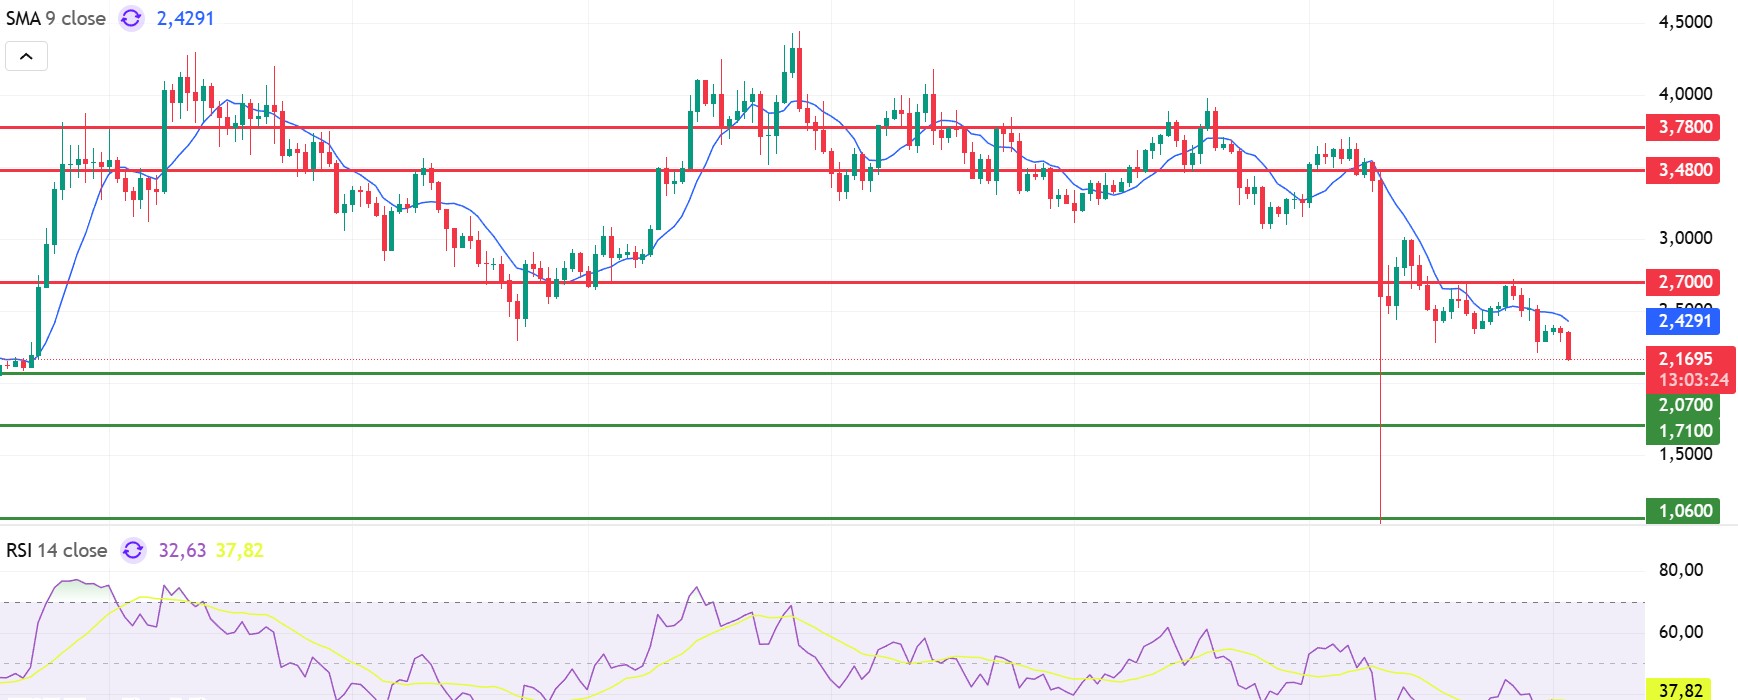
Following recent developments, when we look at Sui’s technical outlook, we see that the price has been moving sideways at around $2.66 on a weekly basis, influenced by fundamental developments. The Relative Strength Index (RSI) is currently in the range of 32.63 – 37.82. This range indicates that the market is trading close to the buy zone; a drop in the RSI to the 35.00 – 40.00 range could signal a potential buying point. If the price moves upward, the $2.70, $3.48, and $3.78 levels can be monitored as resistance points. However, if the price falls to new lows, it could indicate that selling pressure is intensifying. In this case, the $2.07, $1.71, and $1.06 levels stand out as support zones. Based on the trend line, a pullback to $1.71 appears technically possible. According to Simple Moving Averages (SMA) data, Sui’s average price is currently at $2.42. If the price remains below this level, it signals that the current uptrend may not continue technically.
Supports: 1.06 – 1.71 – 2.07
Resistances: 2.70 – 3.48 – 3.78
ADA/USDT
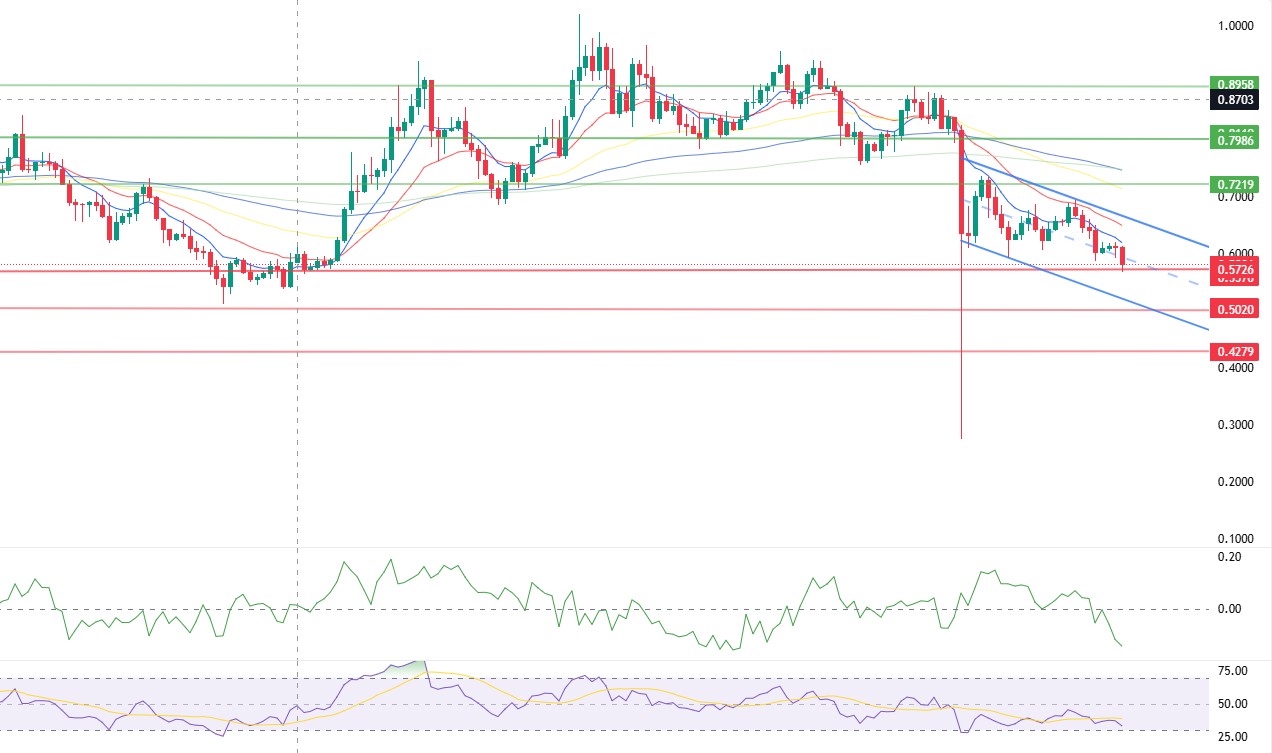
ADA has lost 15% of its value since last week, falling below the $0.5770 level. The decline of over 5% in TVL (Total Value Locked), coupled with monthly outflows of $4 million in fund flows, supports the decrease in Cardano’s cash inflows, reinforcing its downward trend. On-chain data shows that approximately 1.3 million users who own shares or participate in governance on the Cardano network and a total of over 15 billion dollars worth of ADA holders have stopped holding ADA, causing the number of active addresses to decline to 24,299. The stablecoin market value remains at $36 million, showing no increase in DeFi liquidity.
Technically speaking, if the ADA price begins to rise to the 20-day Exponential Moving Average (EMA 20 – Red Line) level, it is expected to close above the 50-day Exponential Moving Average (EMA 50 – Blue Line). If there is a confirmed close above $0.7163, the first target for the could be $0.7219, and if momentum continues, the $0.7986 level could be our first resistance level in the wide band range. The Relative Strength Index (RSI) continues to move in the oversold zone, falling below the 40 level, while the Chaikin Money Flow (CMF-20) has fallen to -0.13 levels, indicating that the sell-side correlation is working in harmony. The decrease in cash inflows keeps the CMF in negative territory, supporting the downward trend in the chart. This week, the US ADP Nonfarm Employment Change data is expected to be released, along with the signing of the US-China tariff agreement. If the outcome of the agreement is positive, macroeconomic data or news related to the Cardano ecosystem could change the direction of ADA pricing.
Supports: 0.5726 – 0.5020 – 0.4279
Resistances: 0.8958 – 0.7986 – 0.7219
Legal Notice
The investment information, comments, and recommendations contained in this document do not constitute investment advisory services. Investment advisory services are provided by authorized institutions on a personal basis, taking into account the risk and return preferences of individuals. The comments and recommendations contained in this document are of a general nature. These recommendations may not be suitable for your financial situation and risk and return preferences. Therefore, making an investment decision based solely on the information contained in this document may not result in outcomes that align with your expectations.