
Weekly Ethereum Onchain Report
Active Addresses
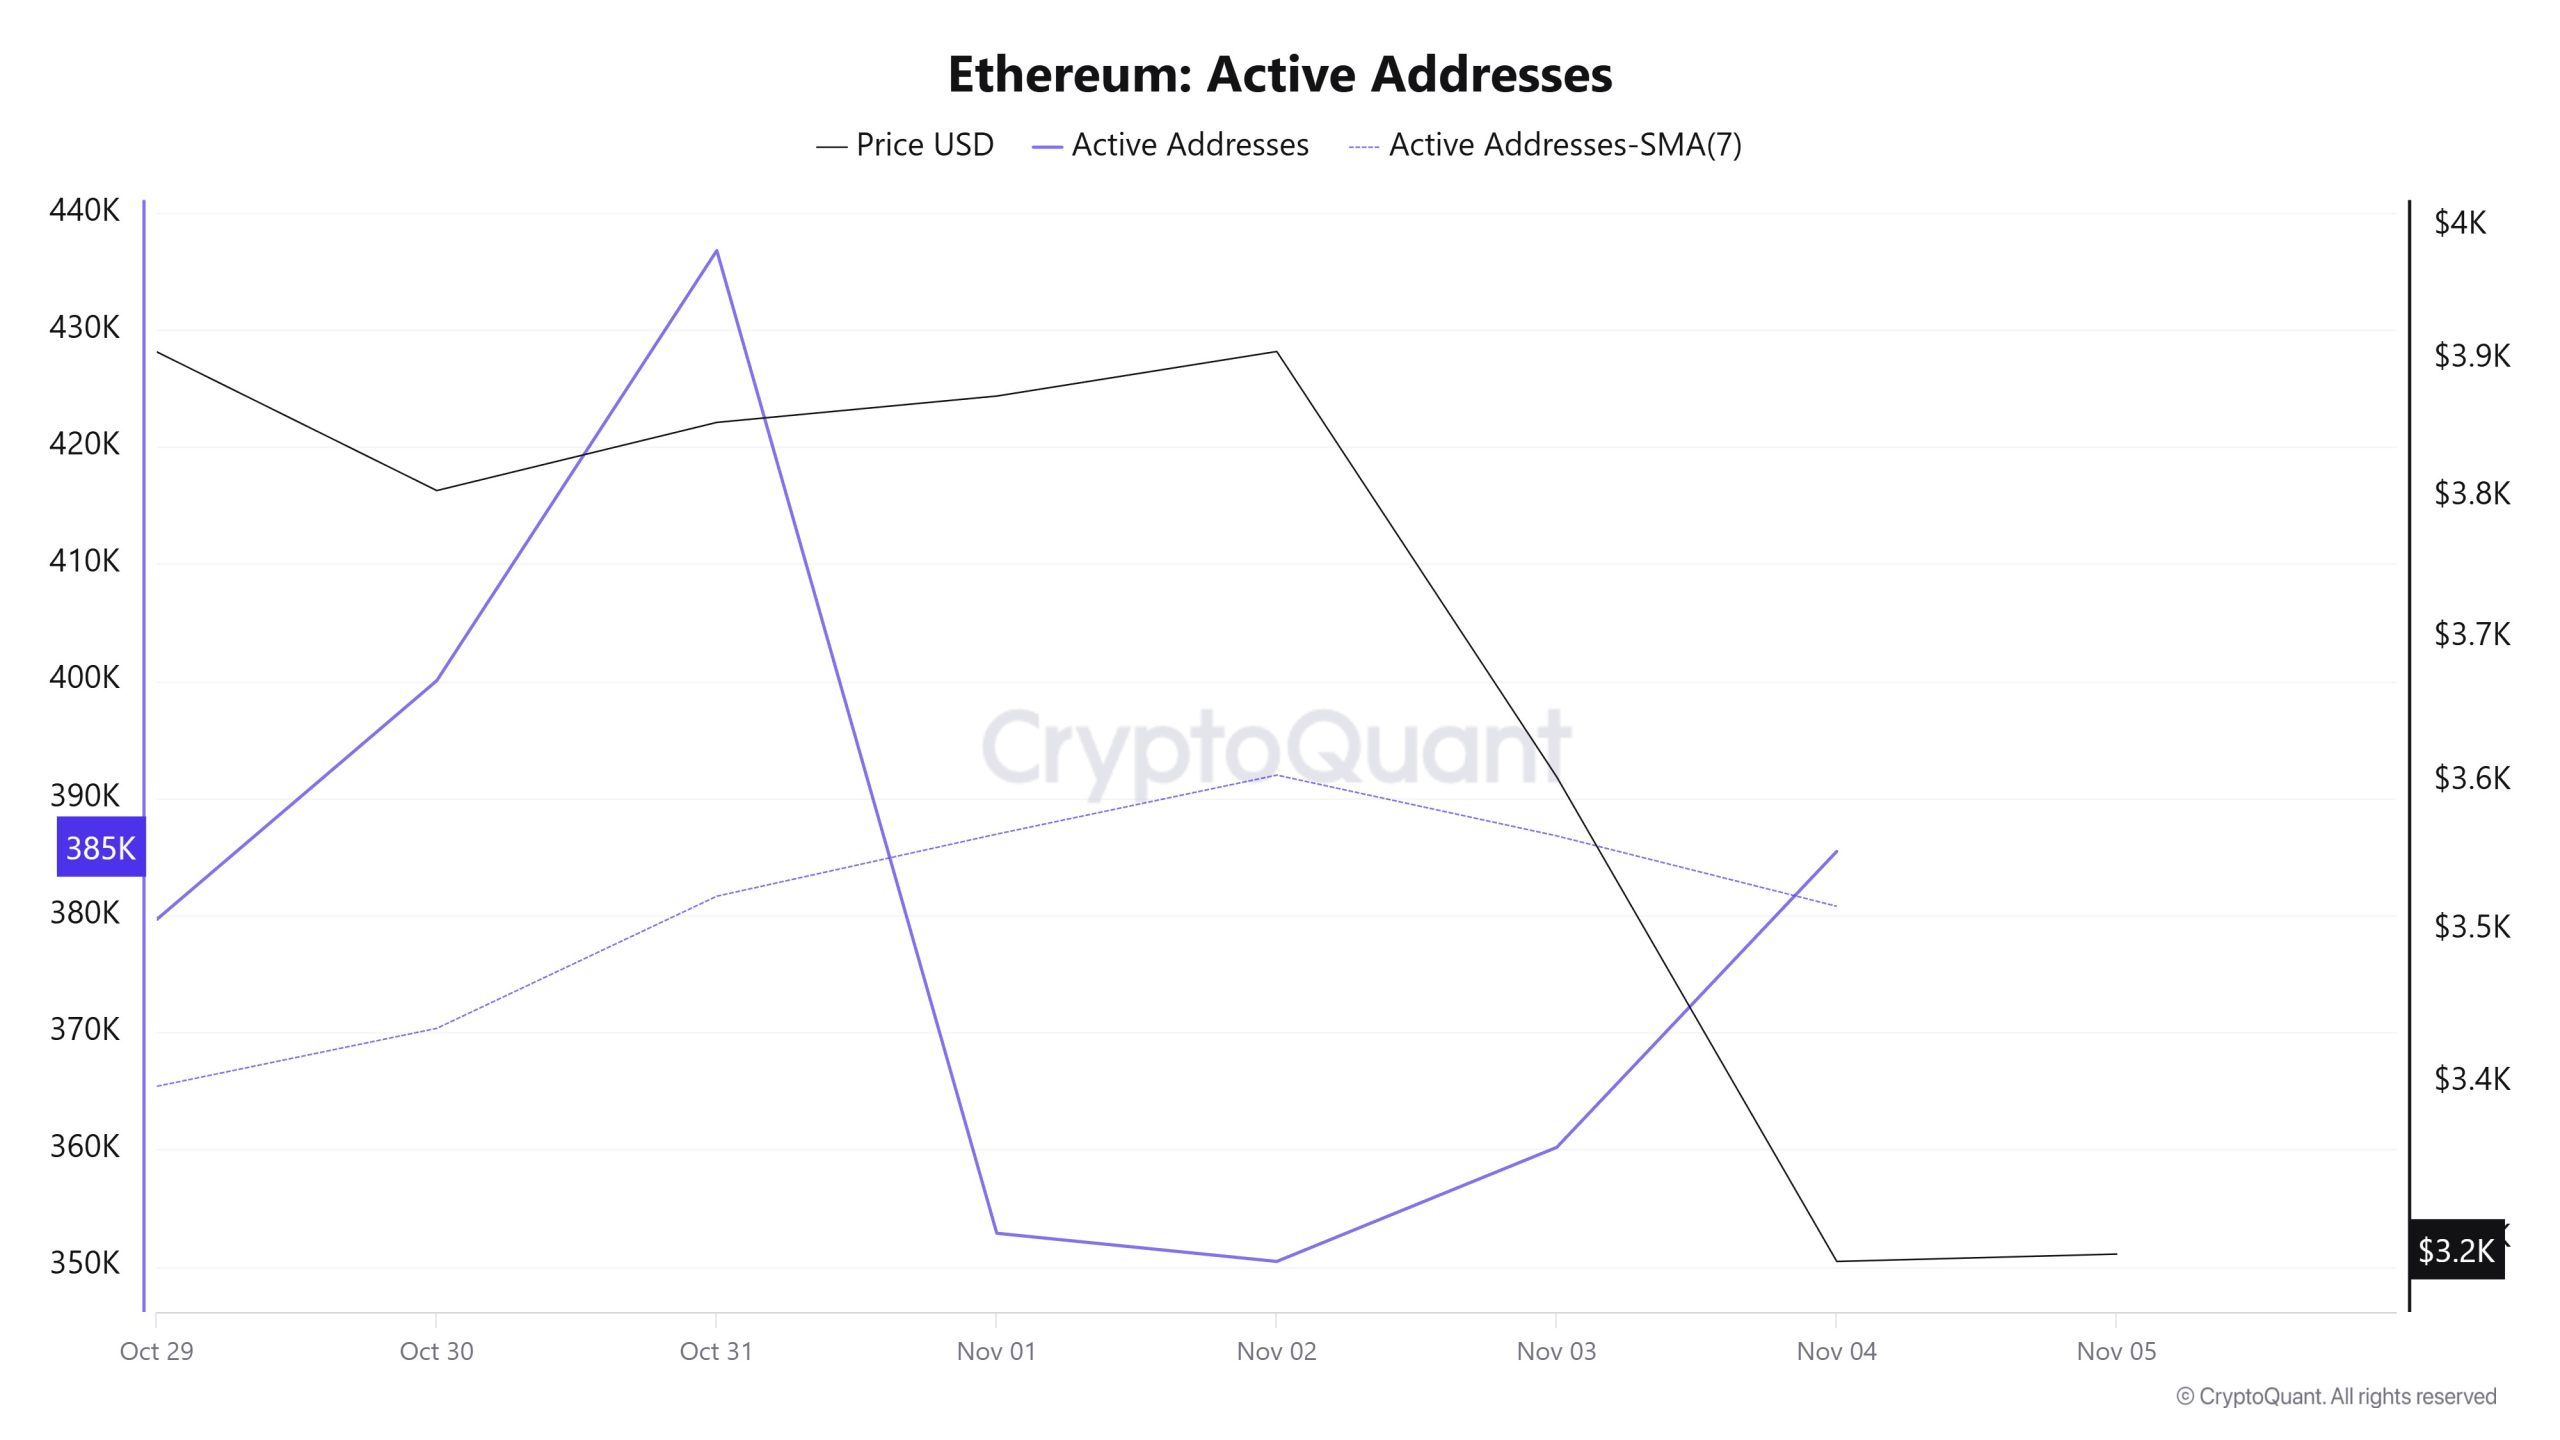
Between October 29 and November 5, a total of 436,744 active addresses were added to the Ethereum network. During this period, the Ethereum price fell from $3,905 to $3,290. Particularly on October 31, when the price reached the active address point, the number of active addresses decreased, and a decline was observed at the price point after a certain period of time. When examining the 7-day simple moving average (SMA), it can be seen that the Ethereum price is generally trending downward.
Active Sending Addresses
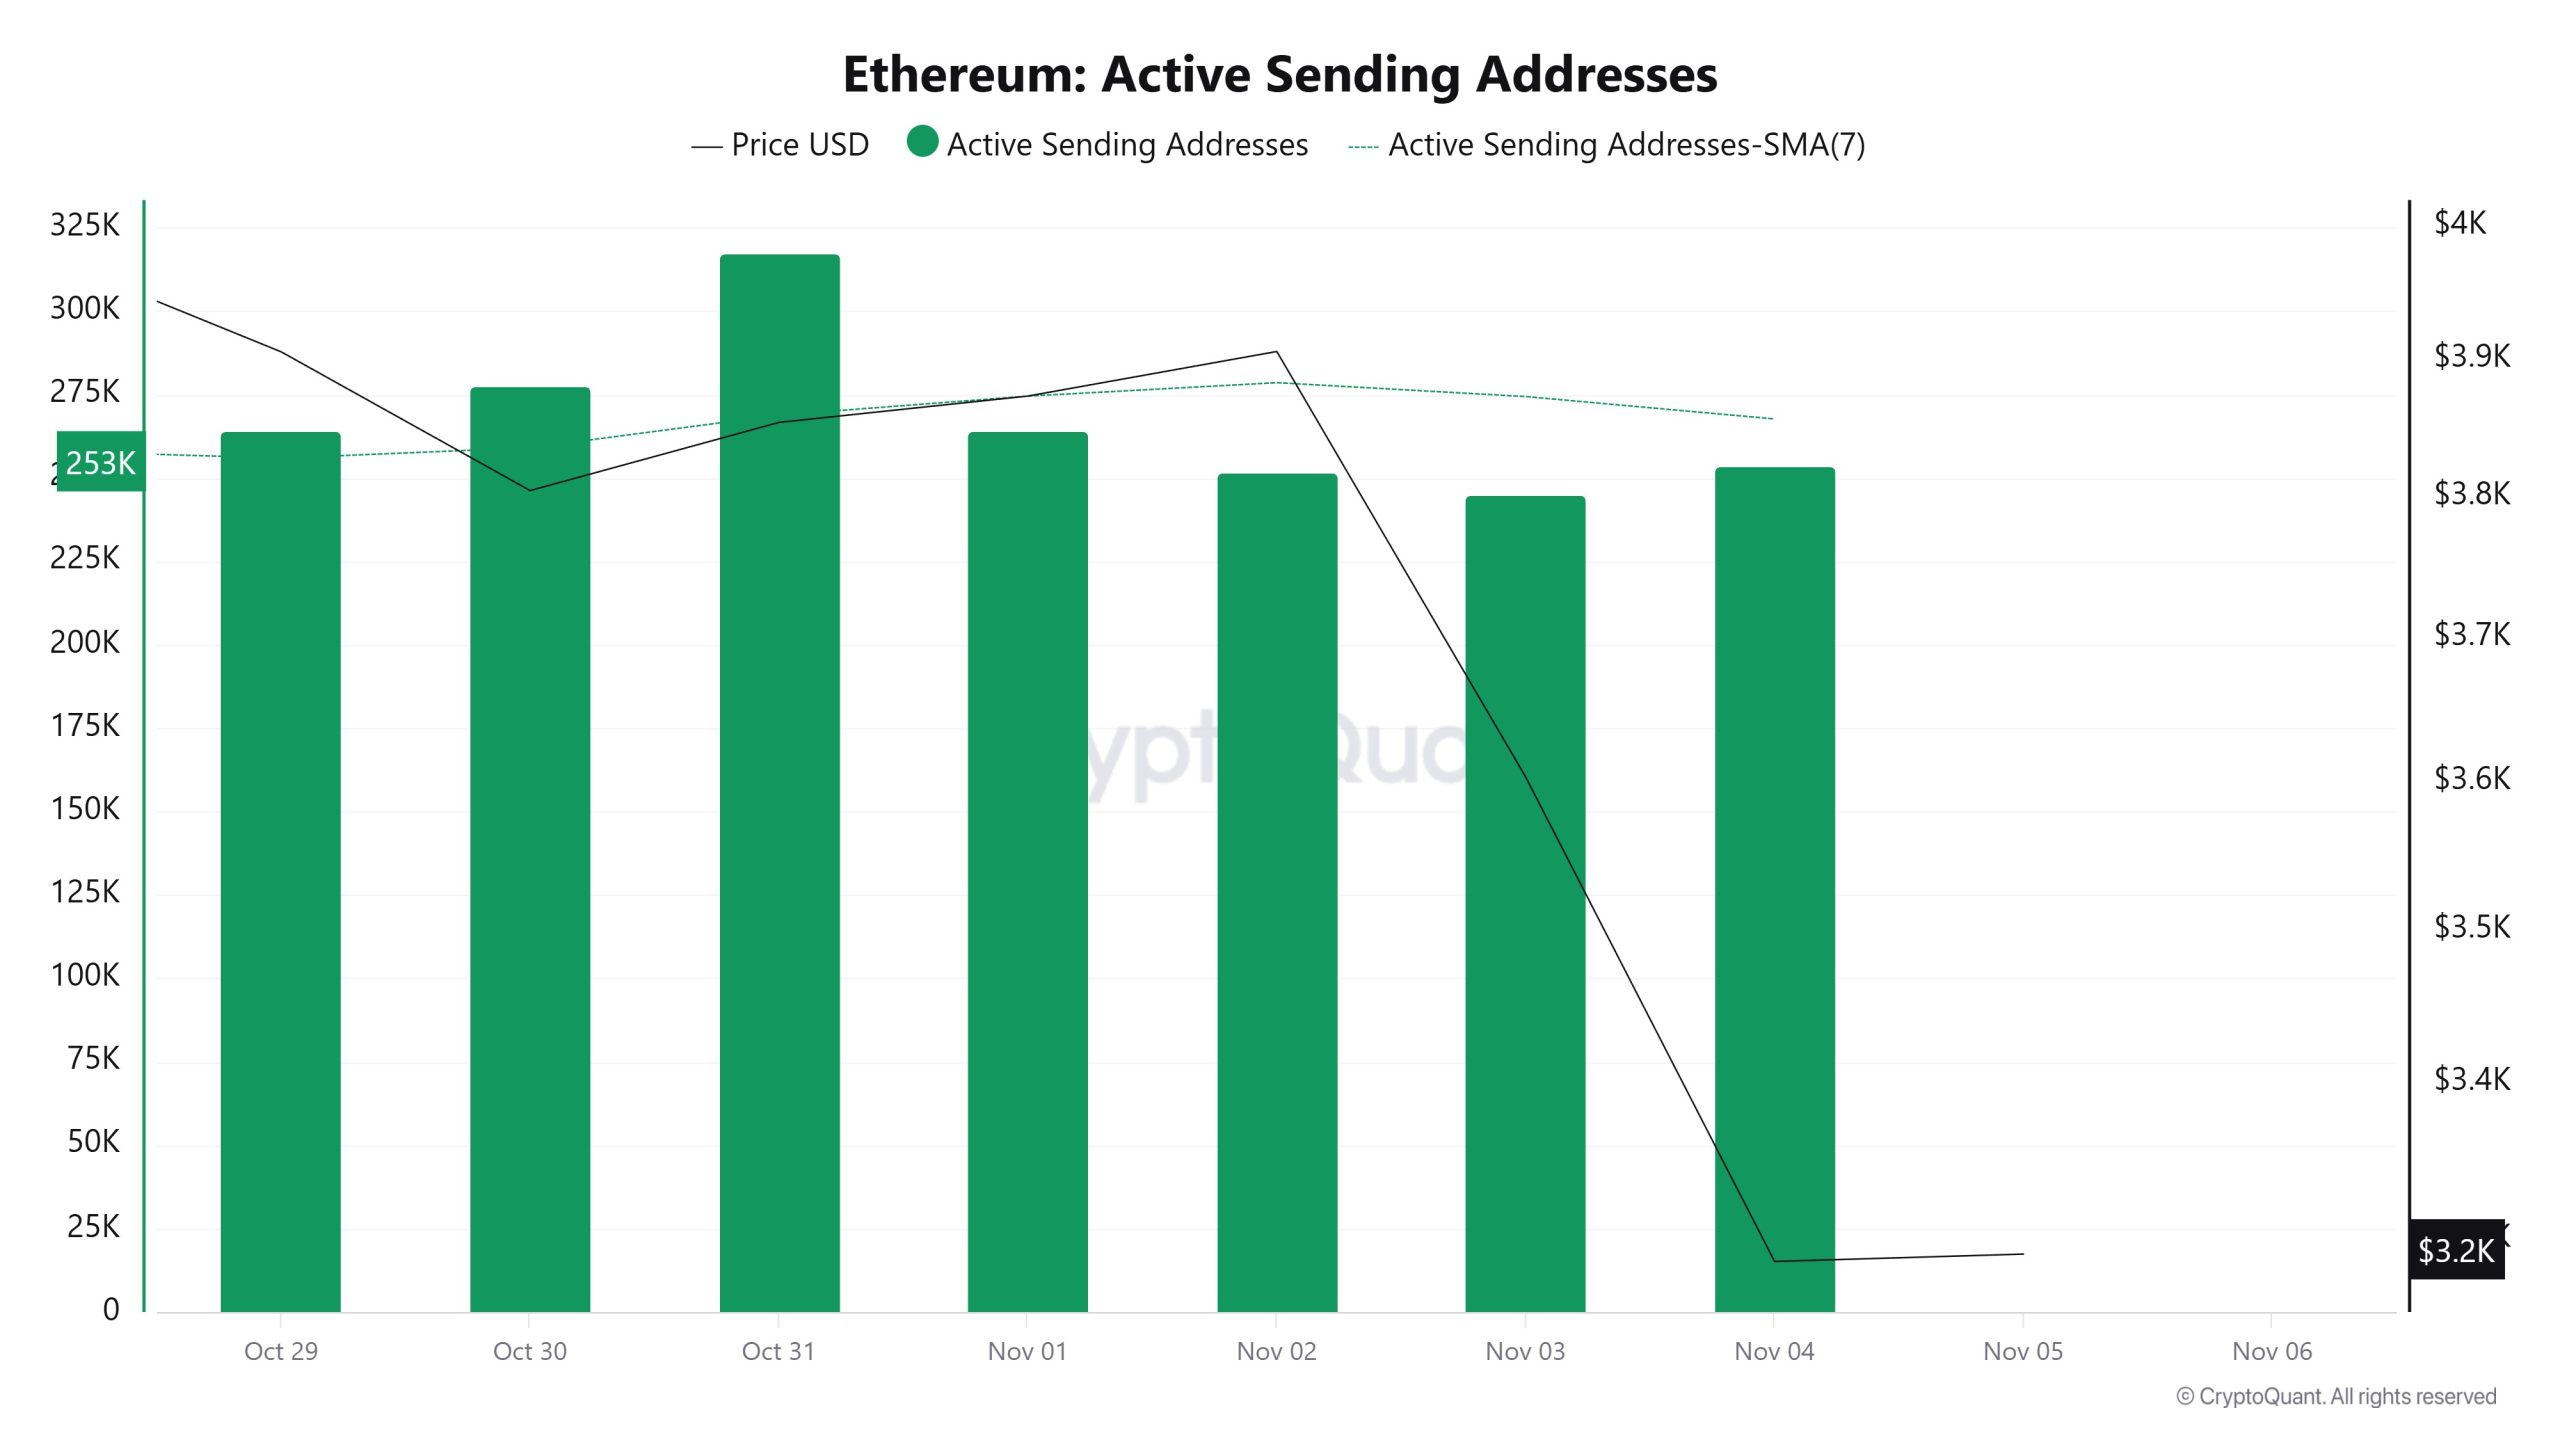
Between October 29 and November 5, high levels of active transfer activity were observed at active transfer addresses along with the Black Line (price line). On the day the price reached its highest level on a weekly basis, active transfer addresses reached 317,424.
Active Receiving Addresses
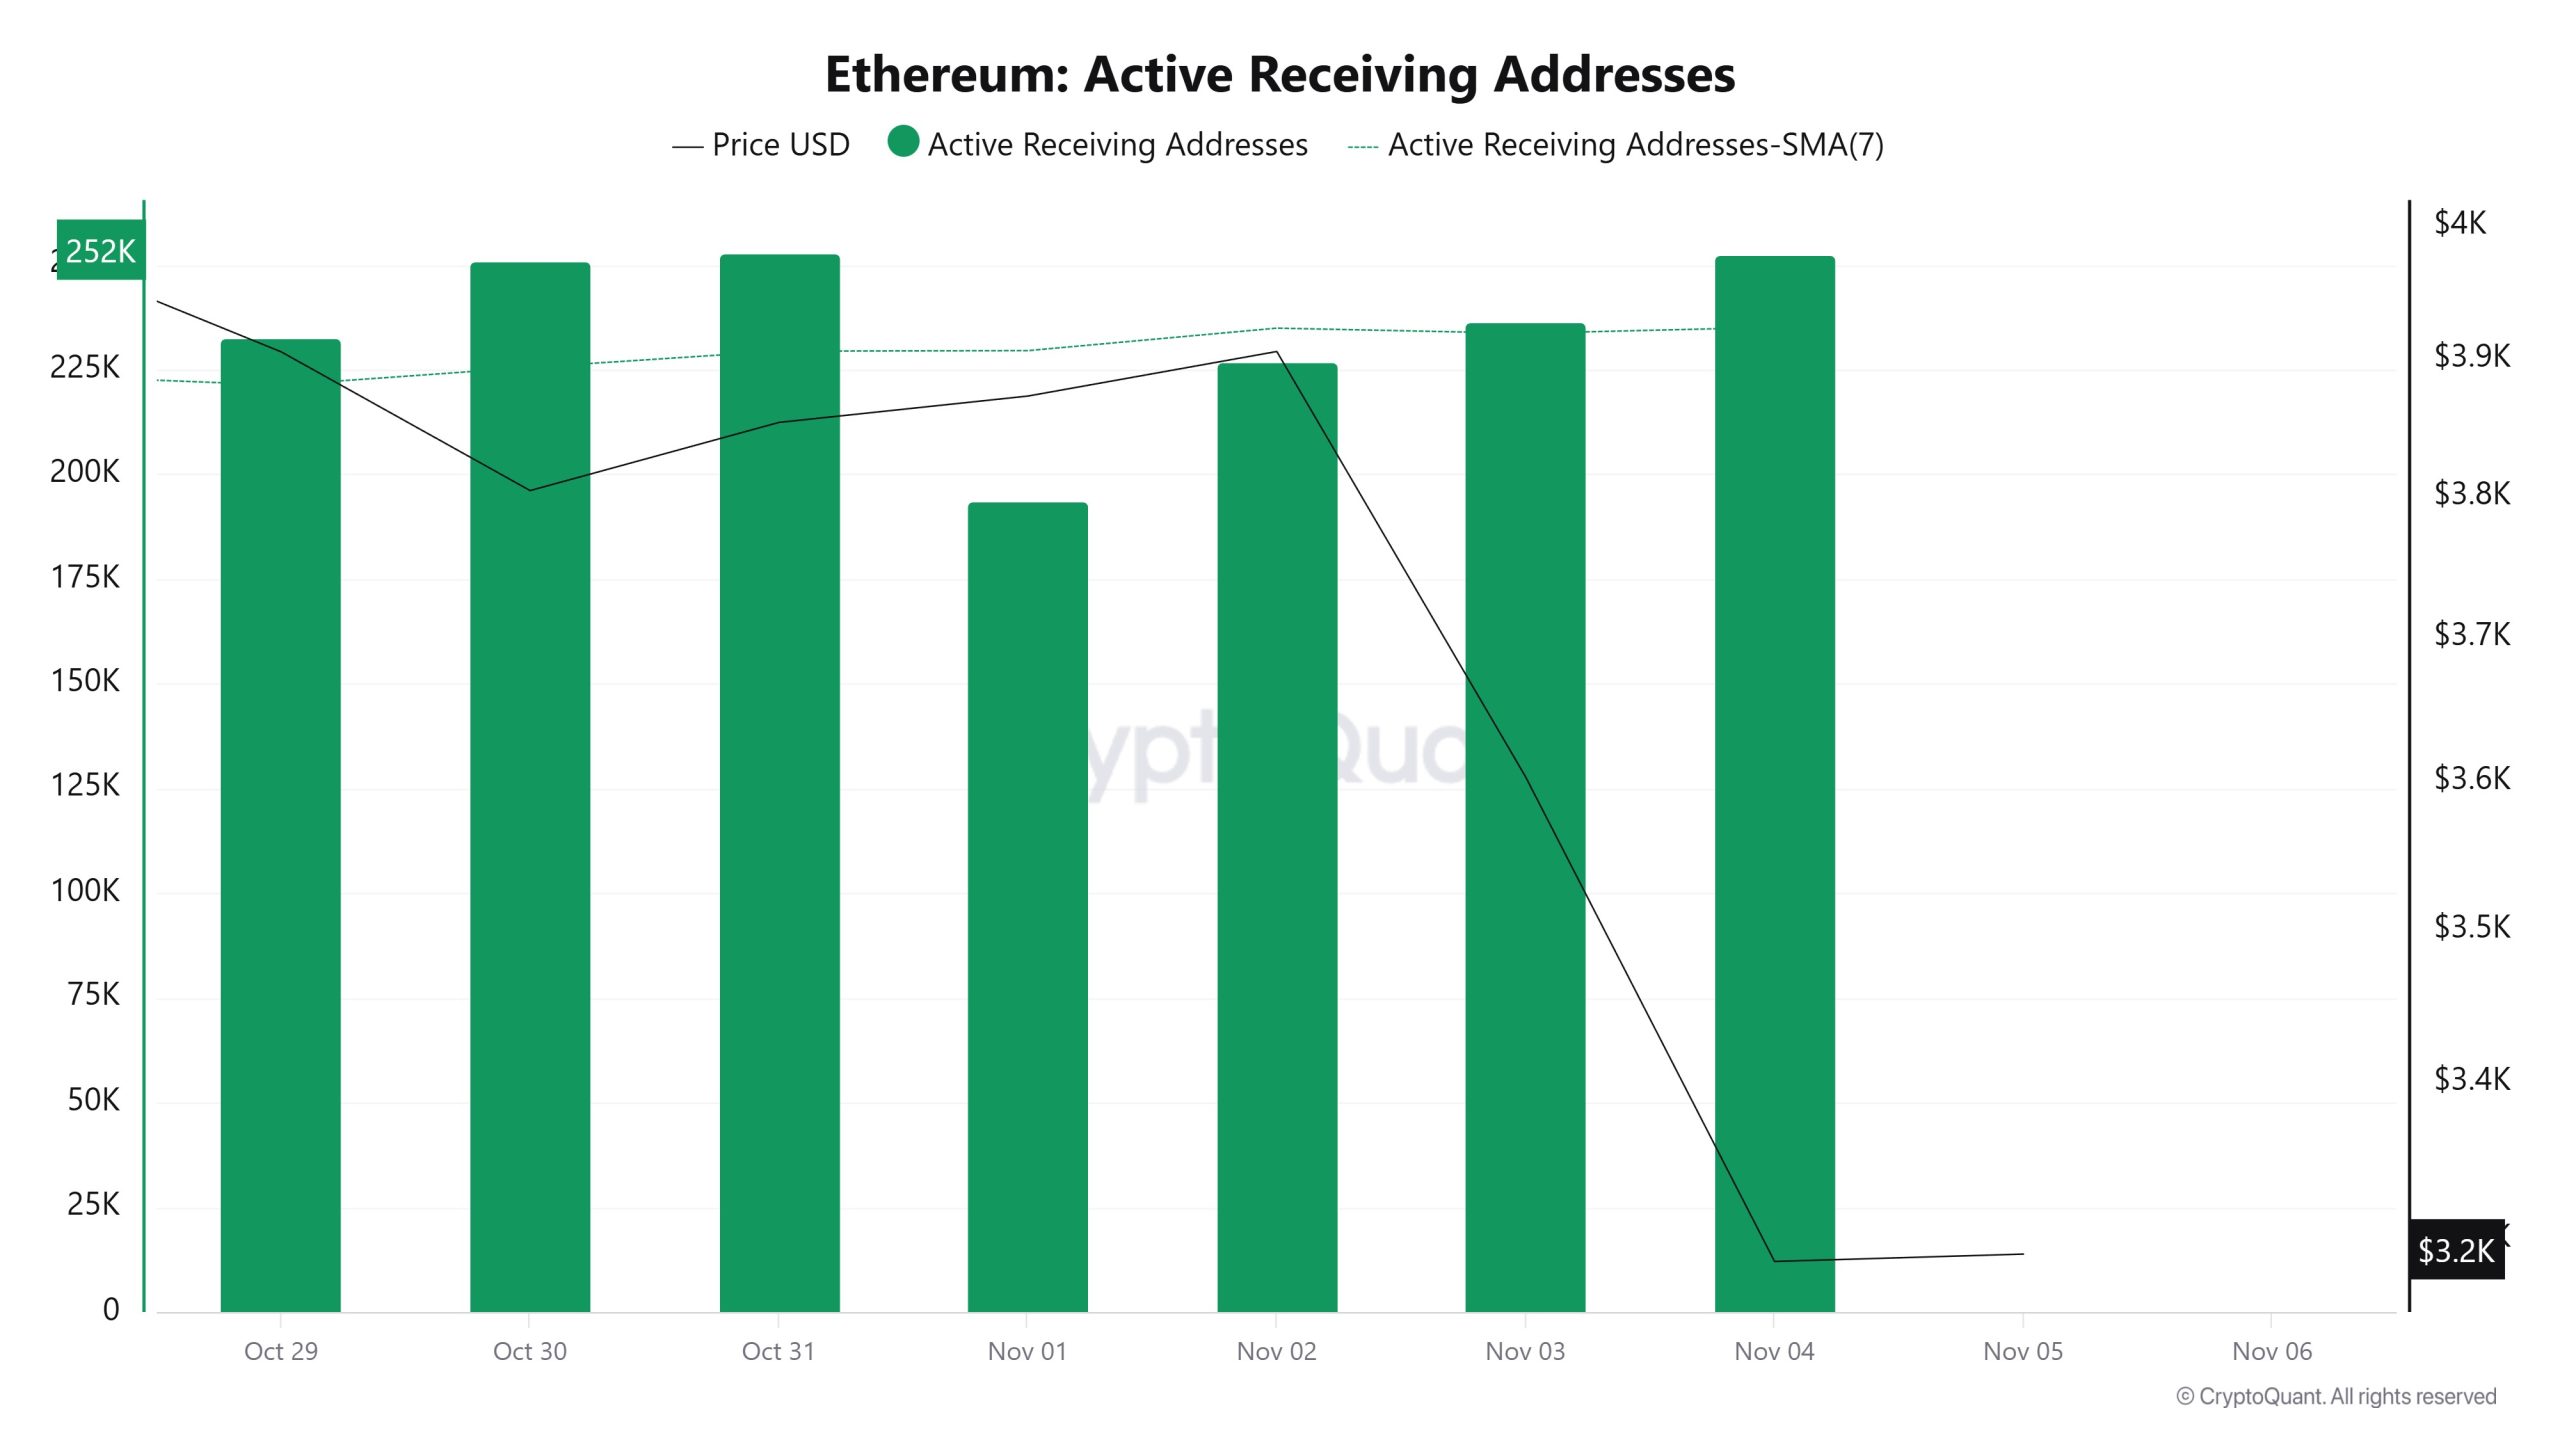
Between October 29 and November 5, while there was no significant increase in active receiving addresses, the price consolidated downward. On the day the price reached its highest level, active receiving addresses reached 252,875, indicating an increase in purchases.
Total Value Staked
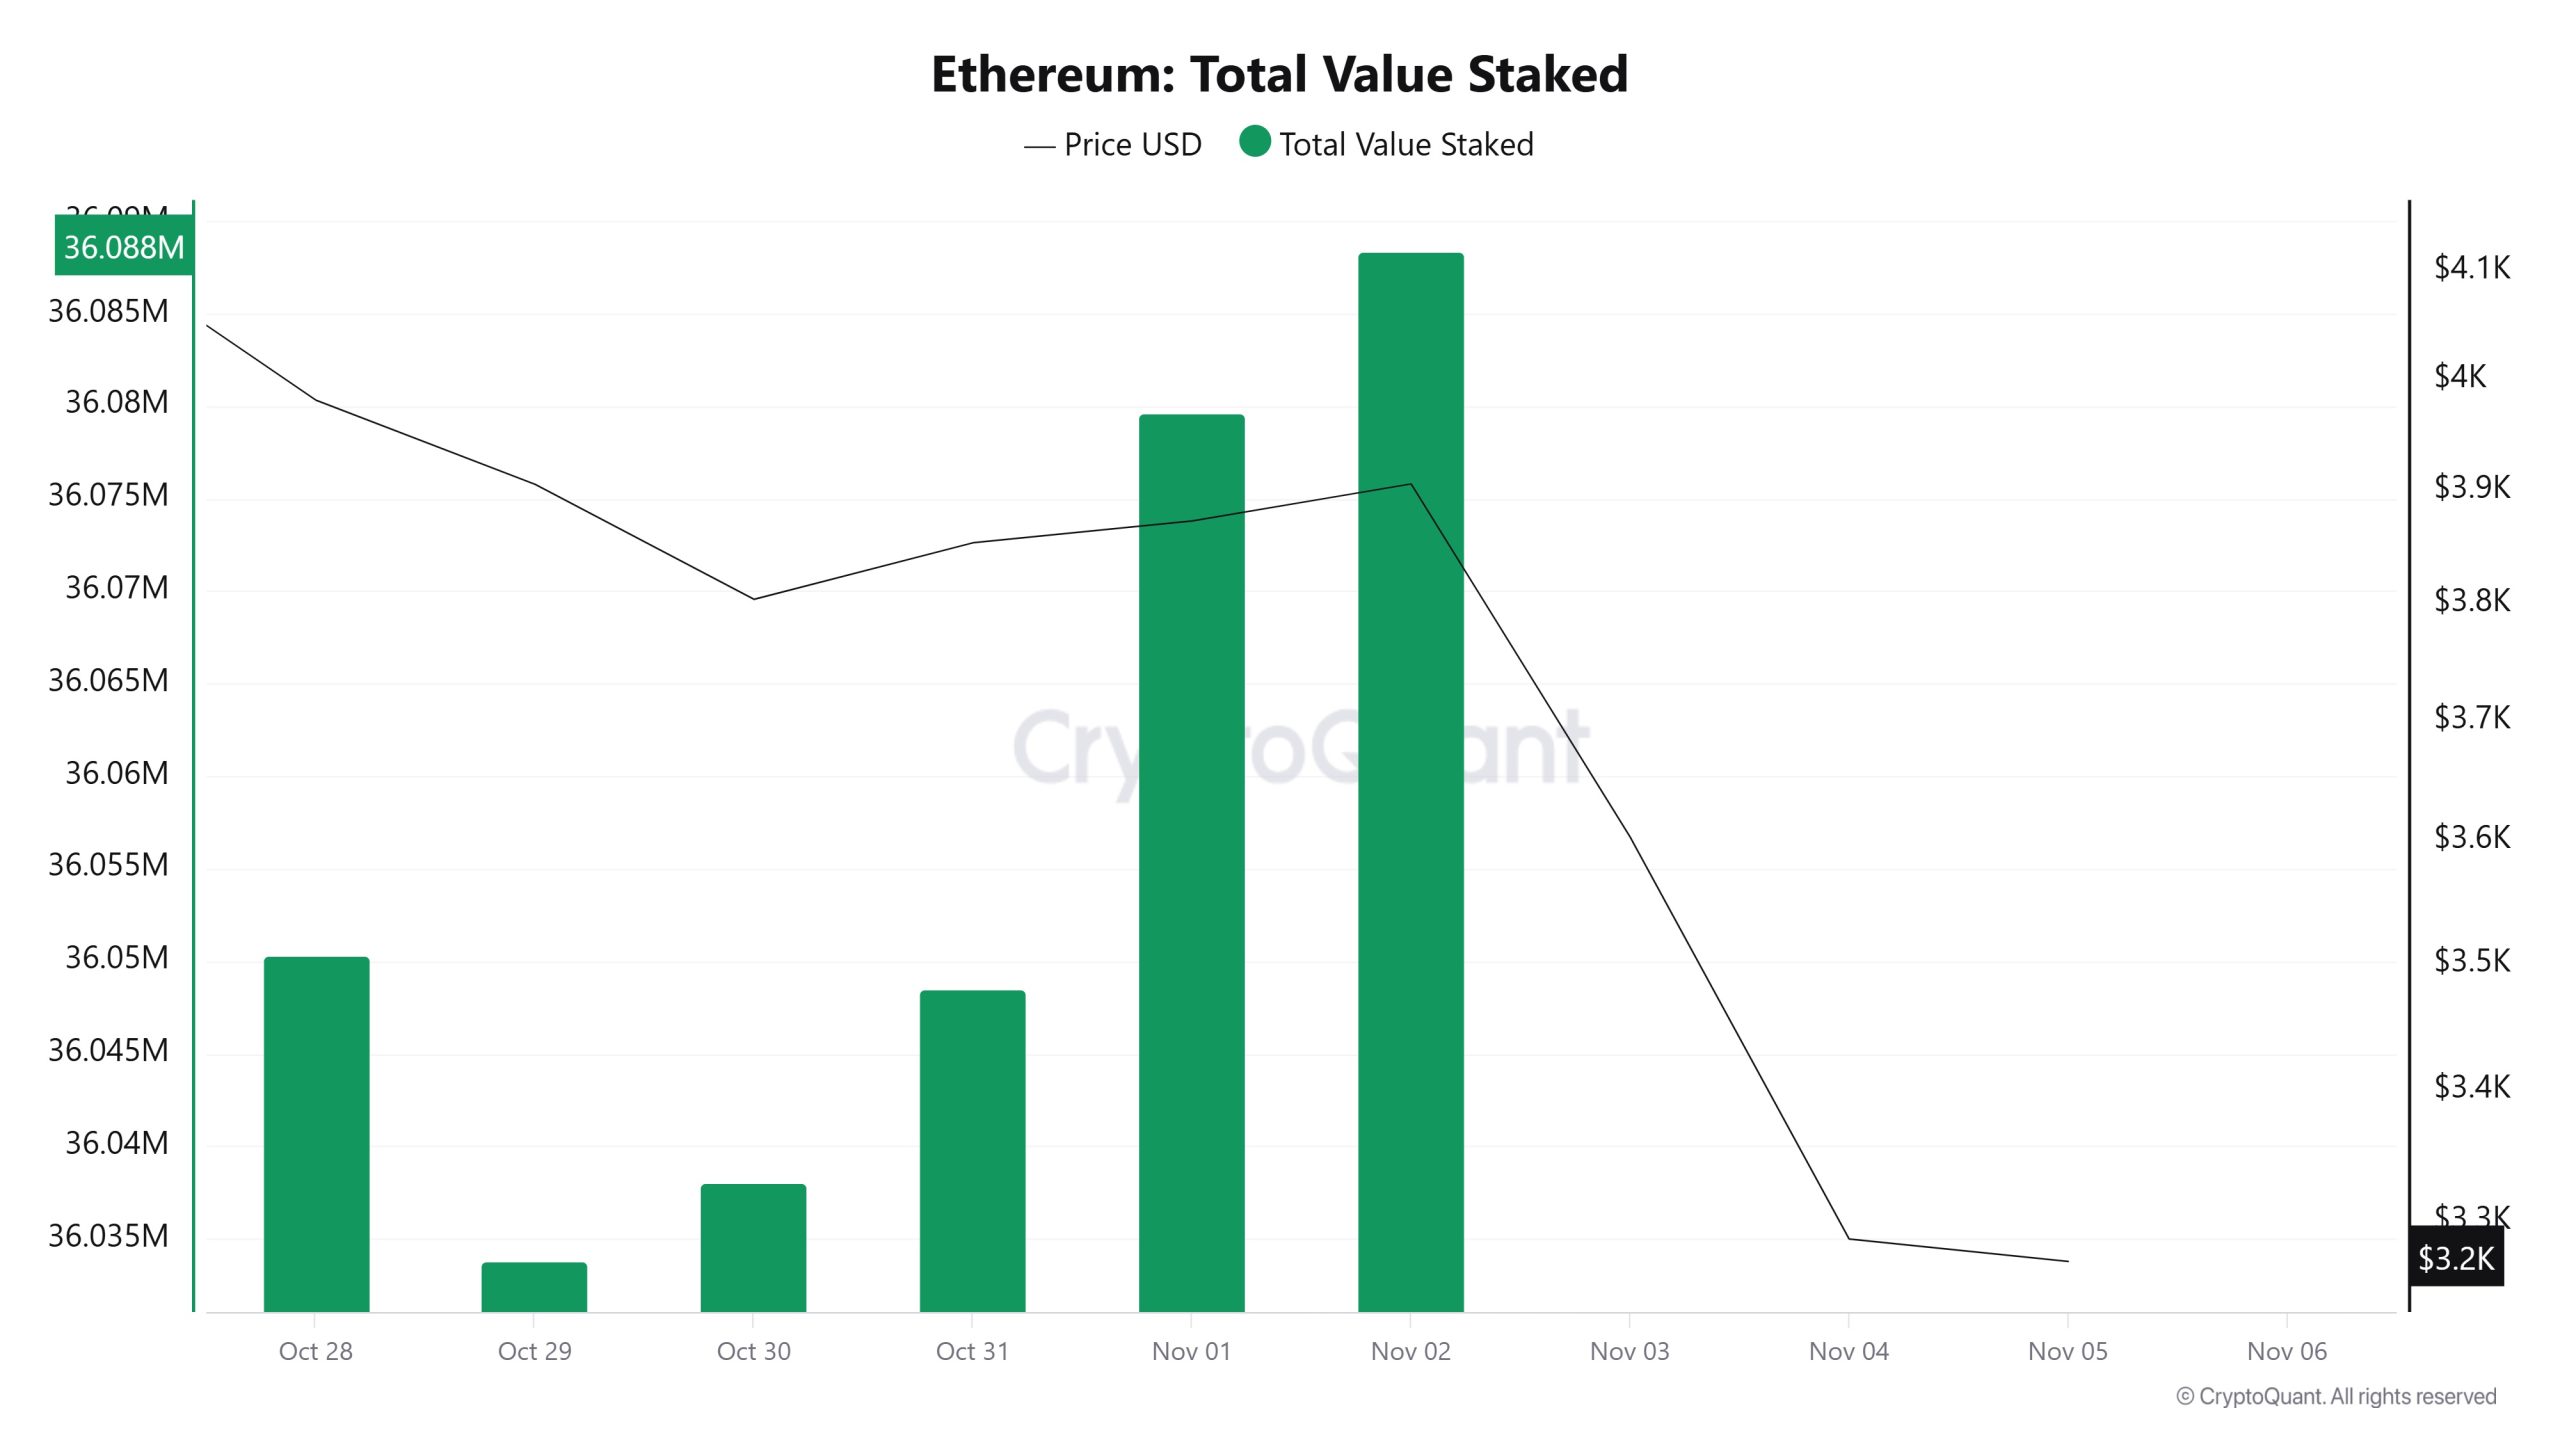
On October 29, the ETH price was trading at $3,905, while the Total Value Staked stood at 36,033,785. As of November 2, the Total Value Staked rose to 36,088,411, recording a 0.15% increase. (Note: The most recent data for Total Value Staked is November 2.)
Staking Inflows
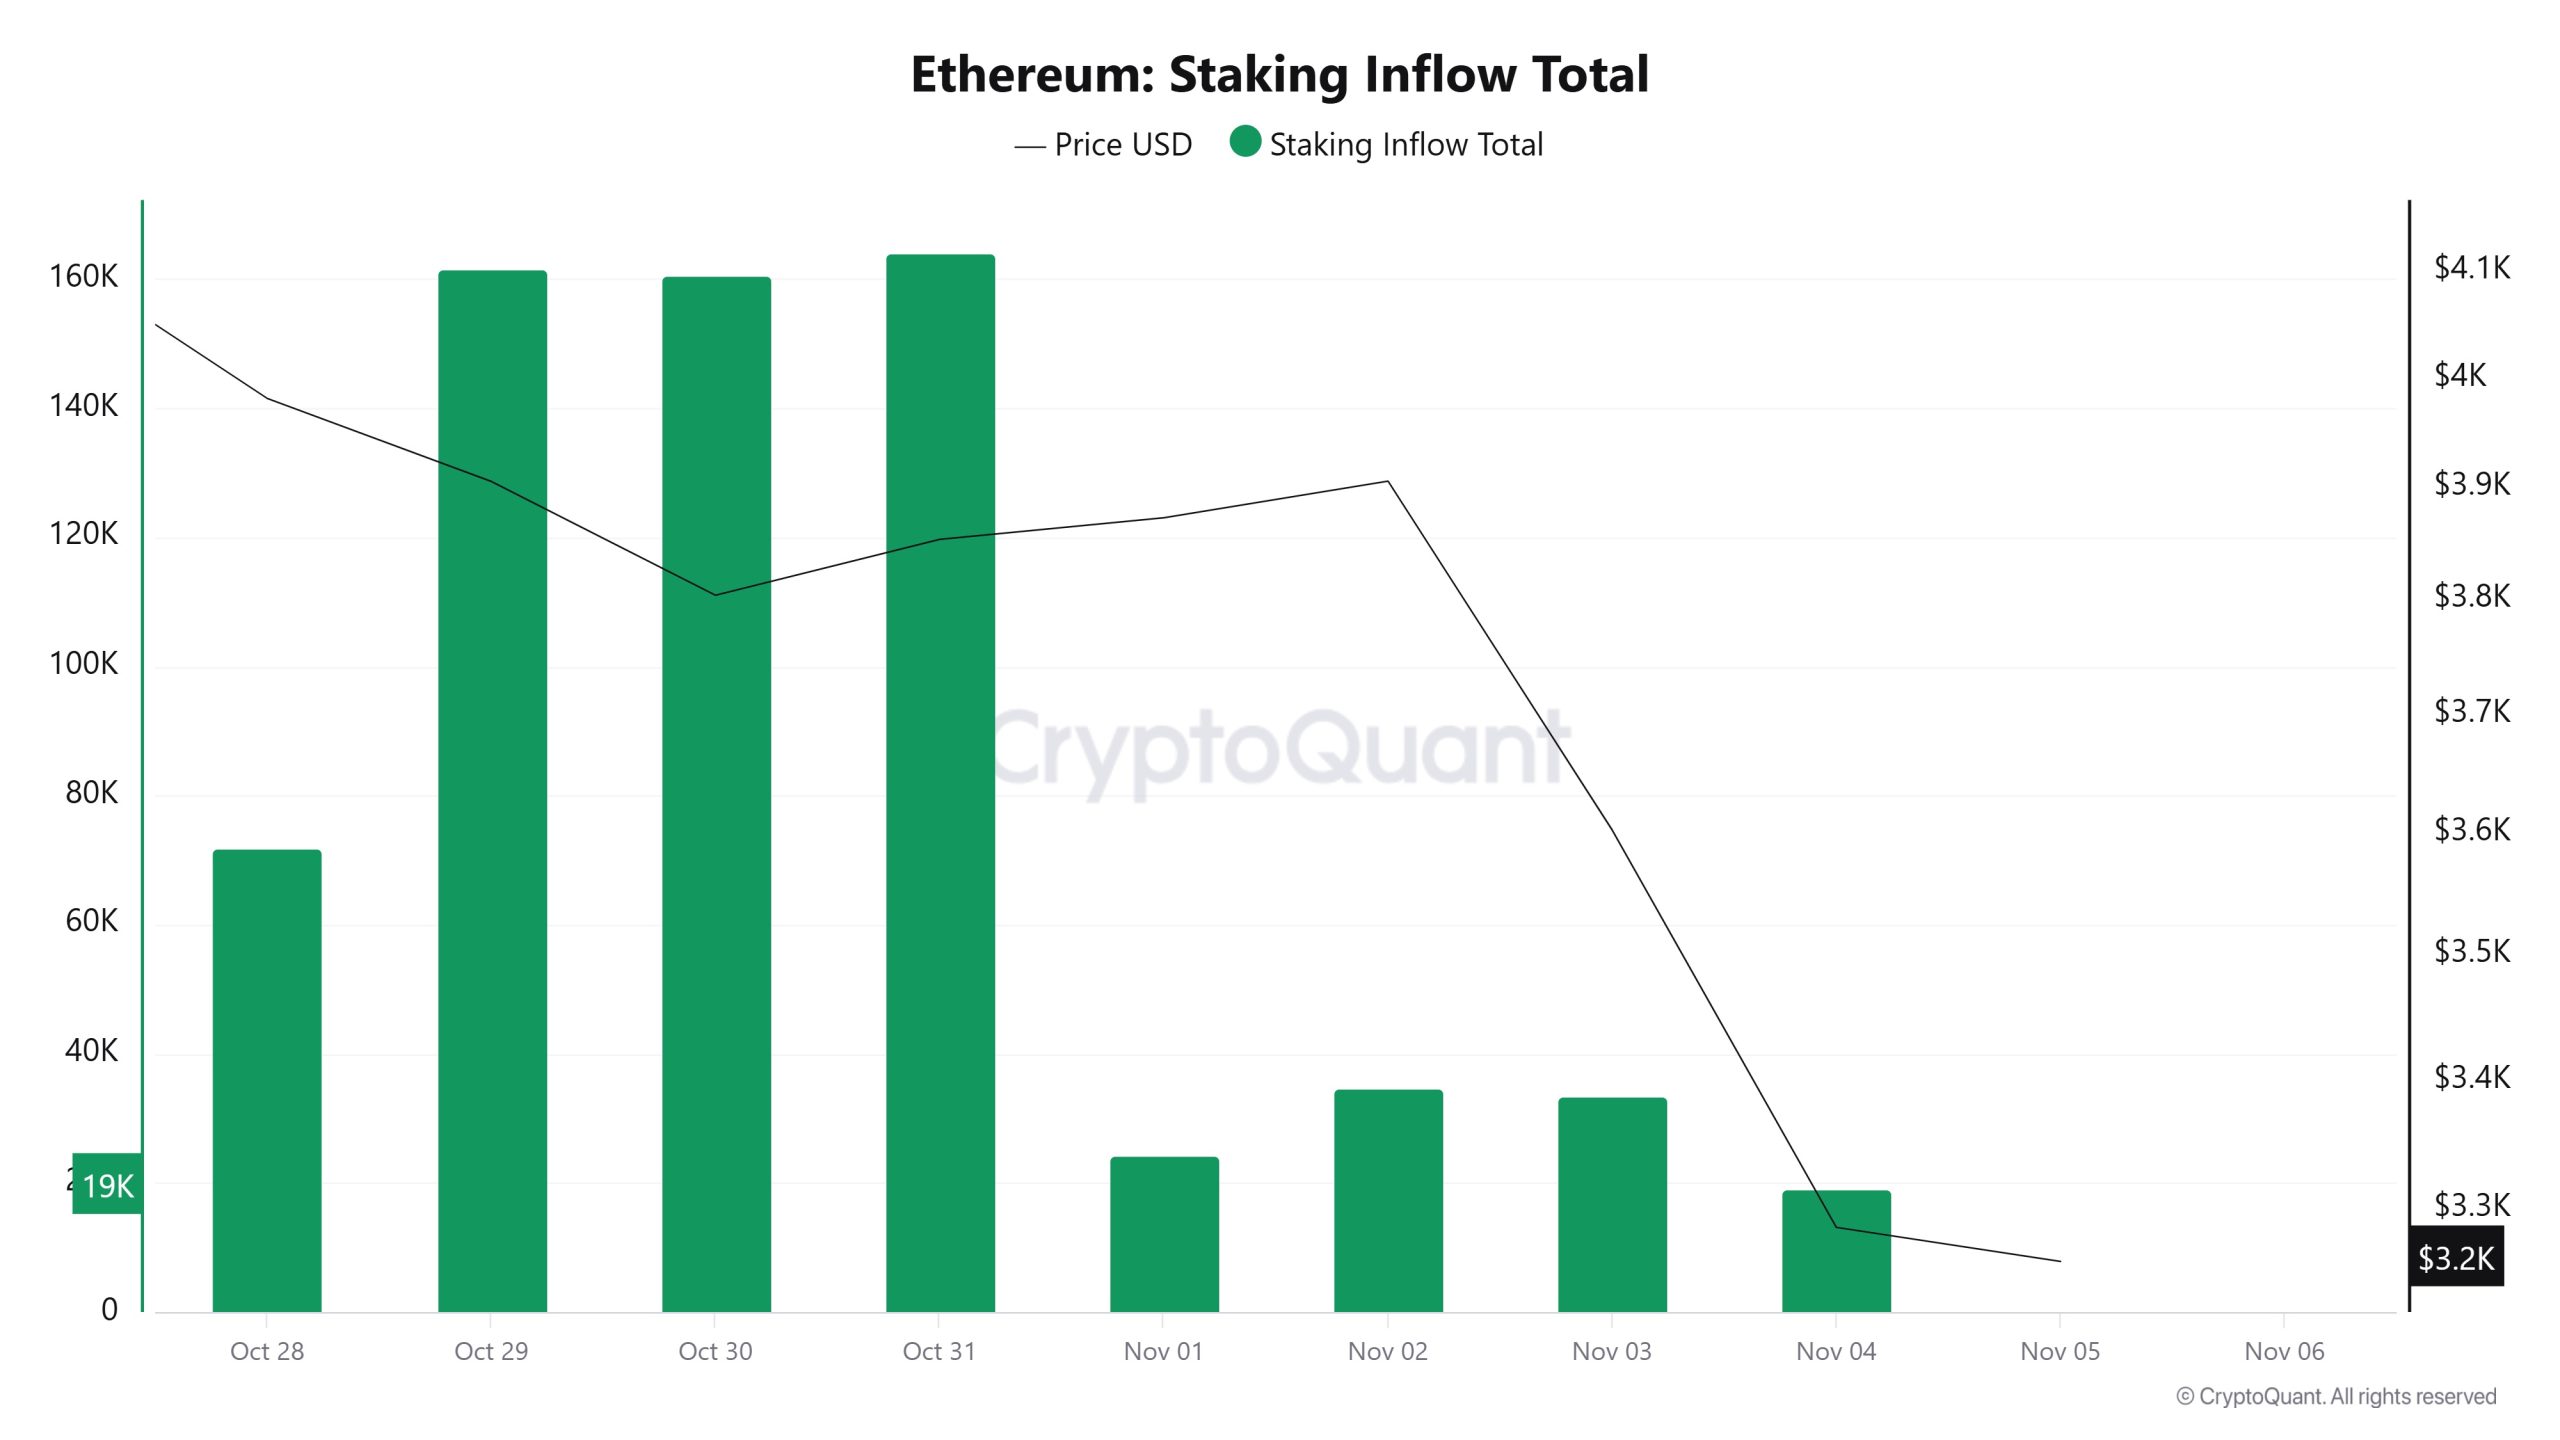
On October 29, while the ETH price was trading at $3,905, Staking Inflow was at 161,537. As of November 4, while the ETH price fell to $3,286, Staking Inflow dropped to 19,029, recording an 88.22% decrease.
Derivatives
Open Interest
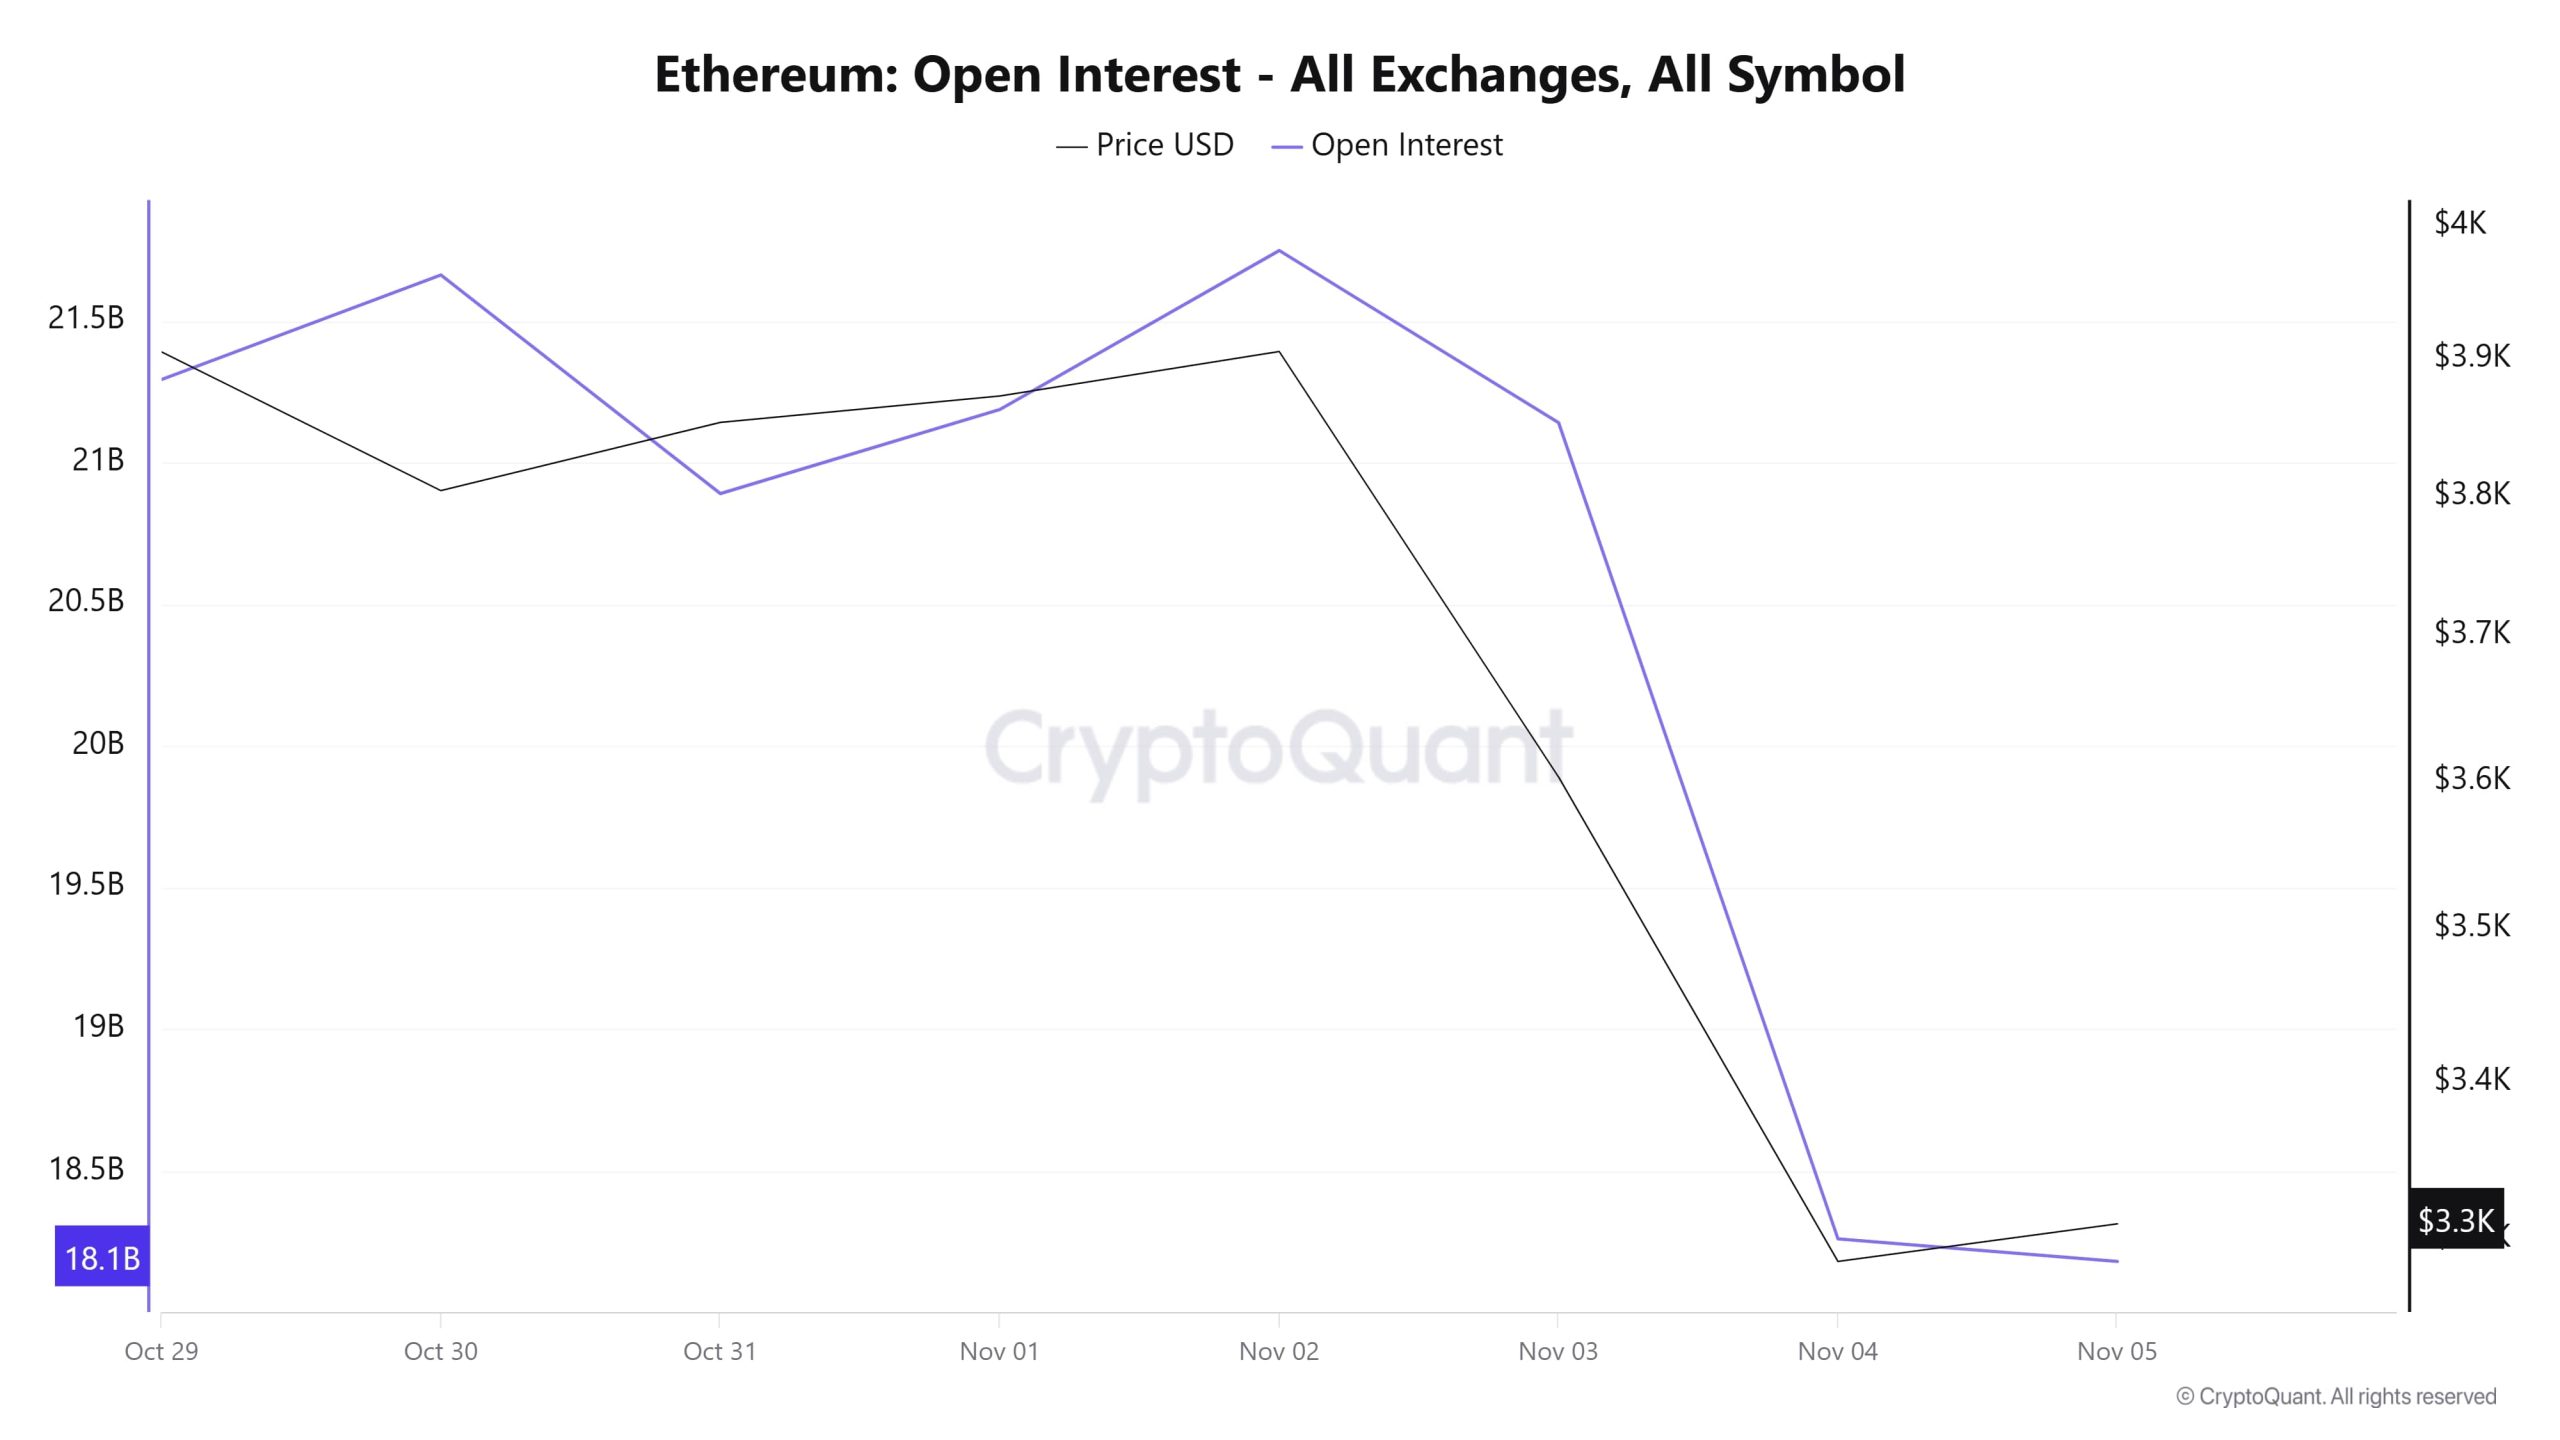
Until November 1, both prices and open interest were trending upward, indicating that new positions were being opened in the market and that investors were maintaining their bullish expectations. However, starting on November 2, the picture reversed. Both prices and open interest fell sharply, signaling a significant liquidation process on November 4. The decline in open interest from $21.5 billion to $18.1 billion indicates the closing of large leveraged positions and the market’s shift toward risk aversion in the short term. The drop in the ETH price from $3,900 to $3,030 during the same period confirms that this wave of liquidation also reflected in the spot market.
Overall, the data shows that strong position closures in the futures market increased pressure on prices, but that the market sought to rebalance after this decline.
Funding Rate
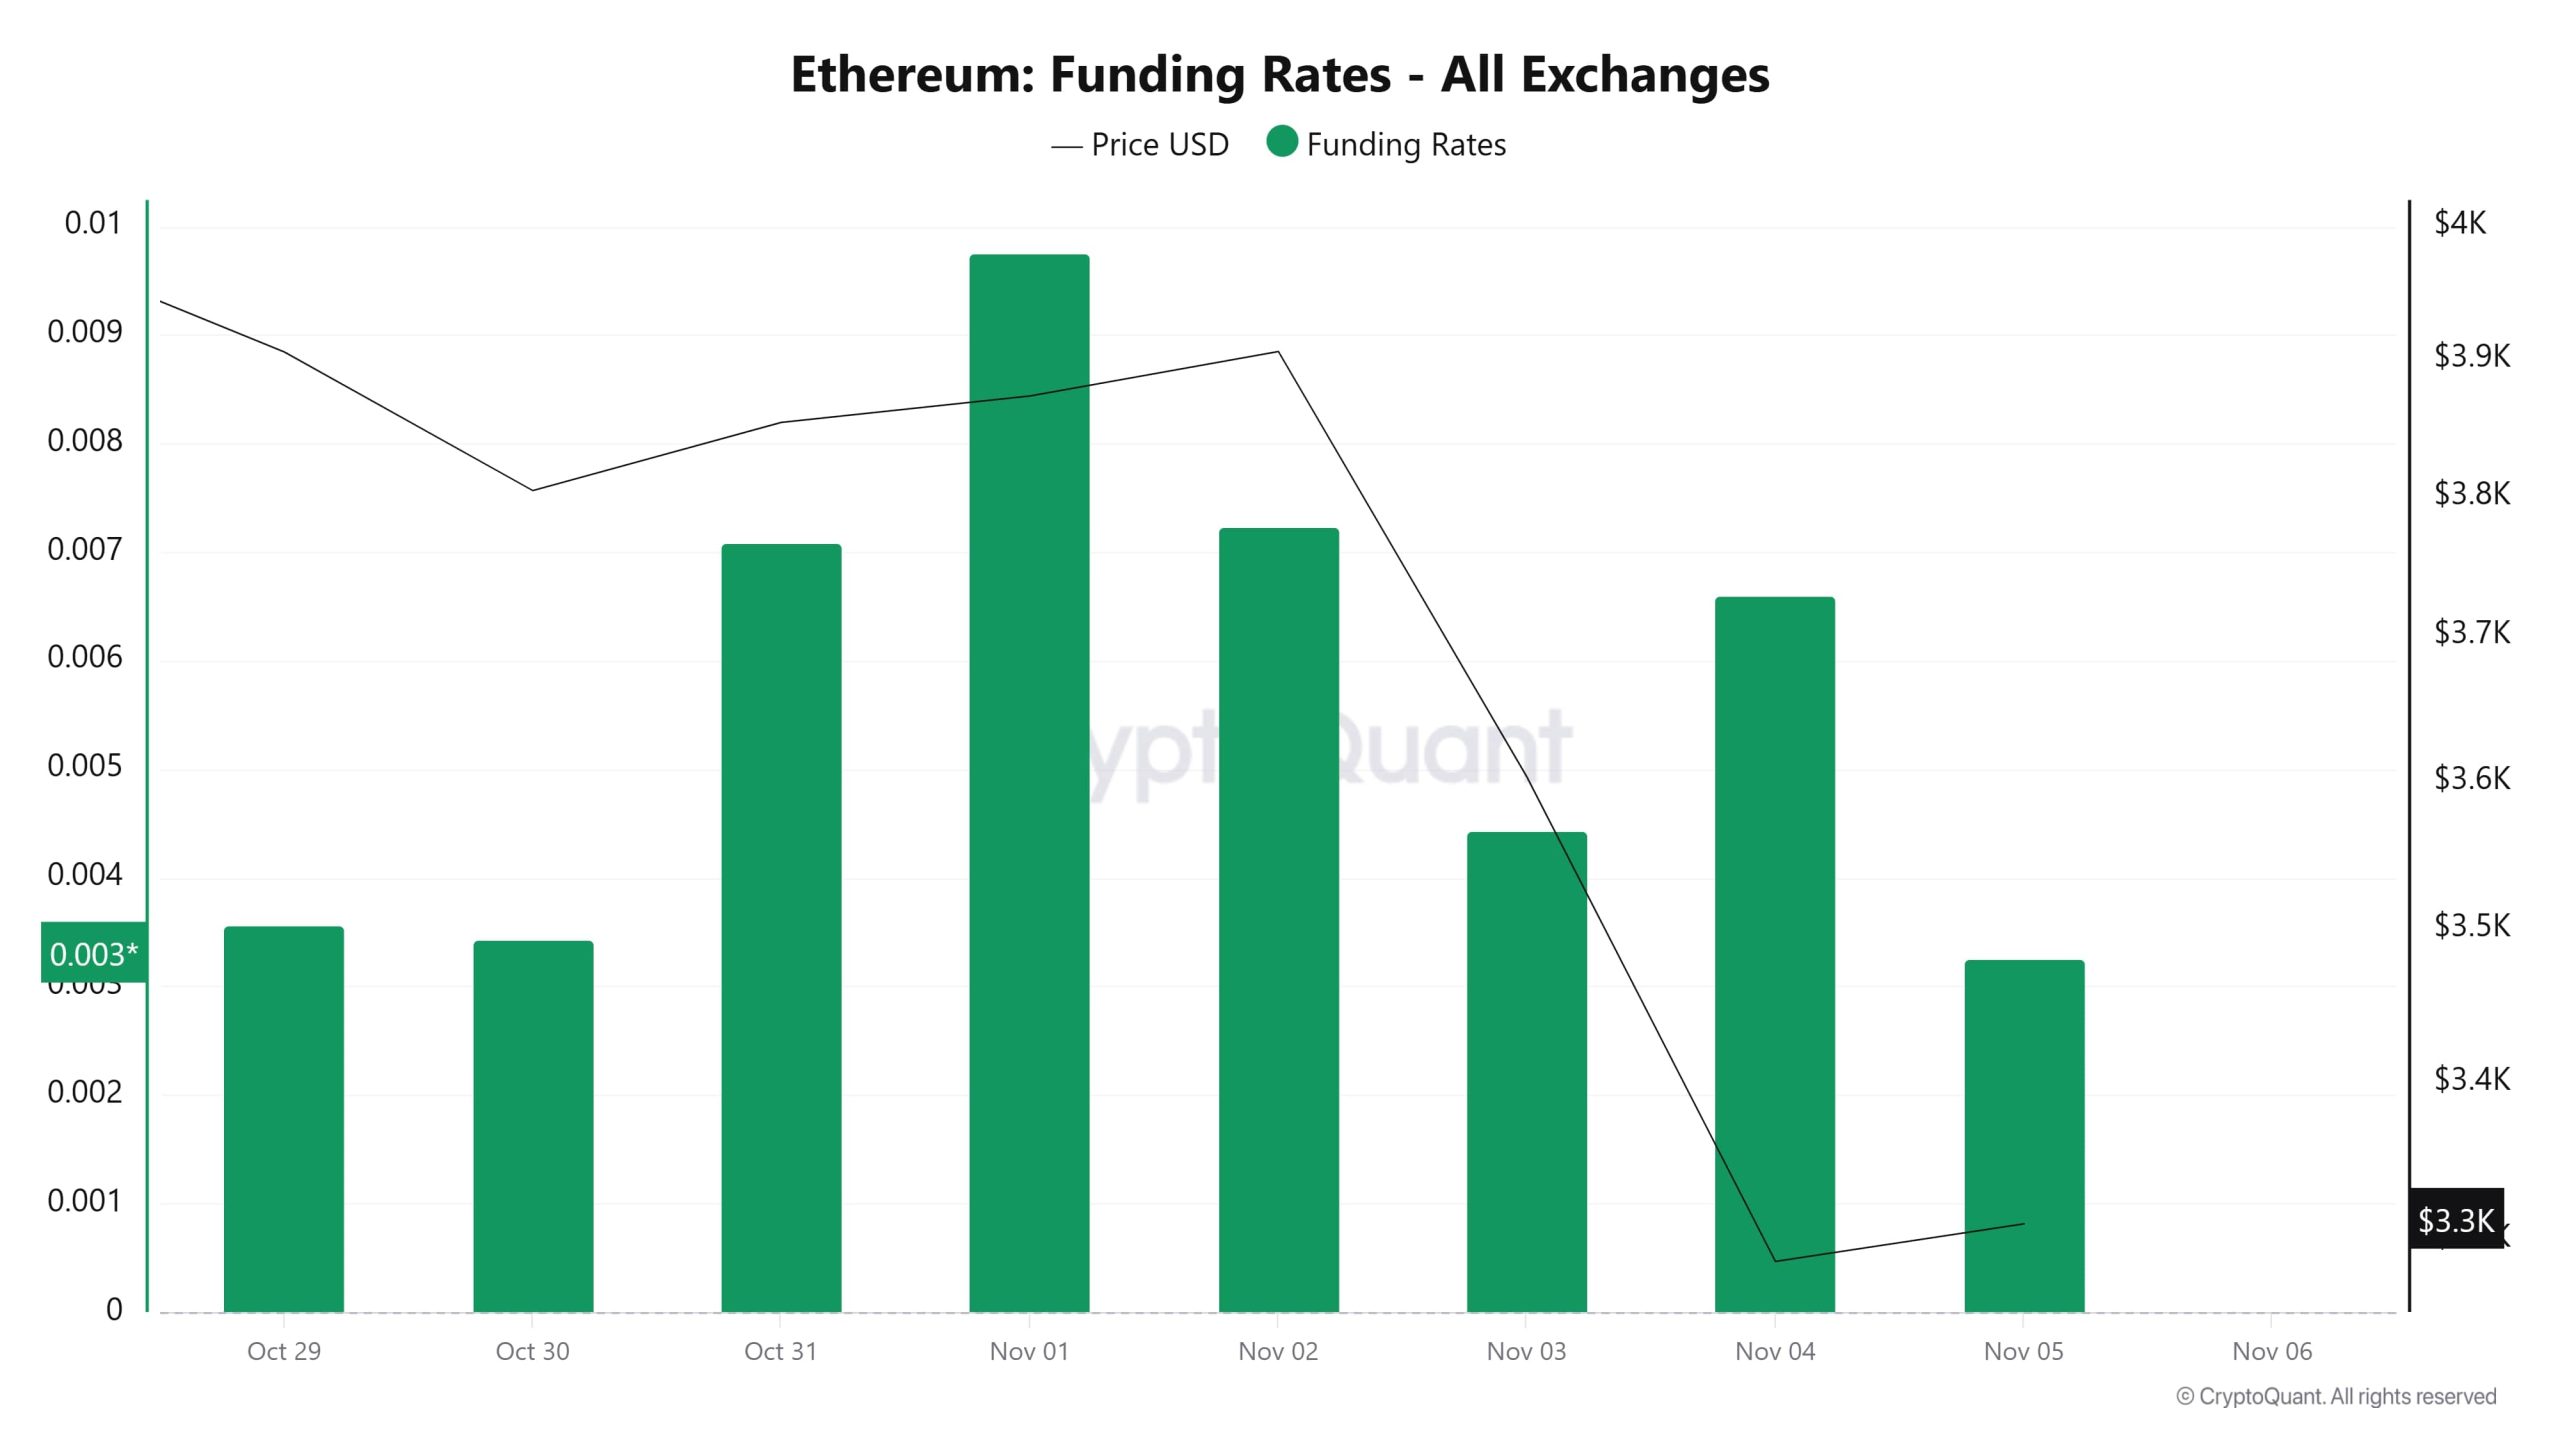
From the last days of October until November 2, the rise in funding rates in positive territory indicates that long positions predominantly dominate the market and that investors maintain their expectation of price increases. However, following November 3, the price fell from $3,900 to $3,030, accompanied by a sharp decline in funding rates. This trend reveals that leveraged long positions have begun to close and that the market has shifted to a more cautious stance.
The overall outlook indicates that short-term optimism in Ethereum futures has given way to a neutral outlook, while the decline in funding rates signals a temporary reduction in excessive leverage risk in the market.
Long & Short Liquidations
With the ETH price falling from $4,070 to $3,030, $1.076 billion worth of long positions were liquidated. During the same time frame, $576 million worth of short positions were also liquidated.
| Date | Long Amount (Million $) | Short Volume (Million $) |
|---|---|---|
| October 29 | 97.49 | 75.00 |
| October 30 | 191.55 | 28.78 |
| October 31 | 40.96 | 38.06 |
| November 1 | 7.11 | 6.53 |
| November 2 | 15.25 | 15.21 |
| November 3 | 219.74 | 168.45 |
| November 4 | 510.42 | 244.28 |
| Total | 1,076.82 | 576.31 |
Exchange Supply Ratio
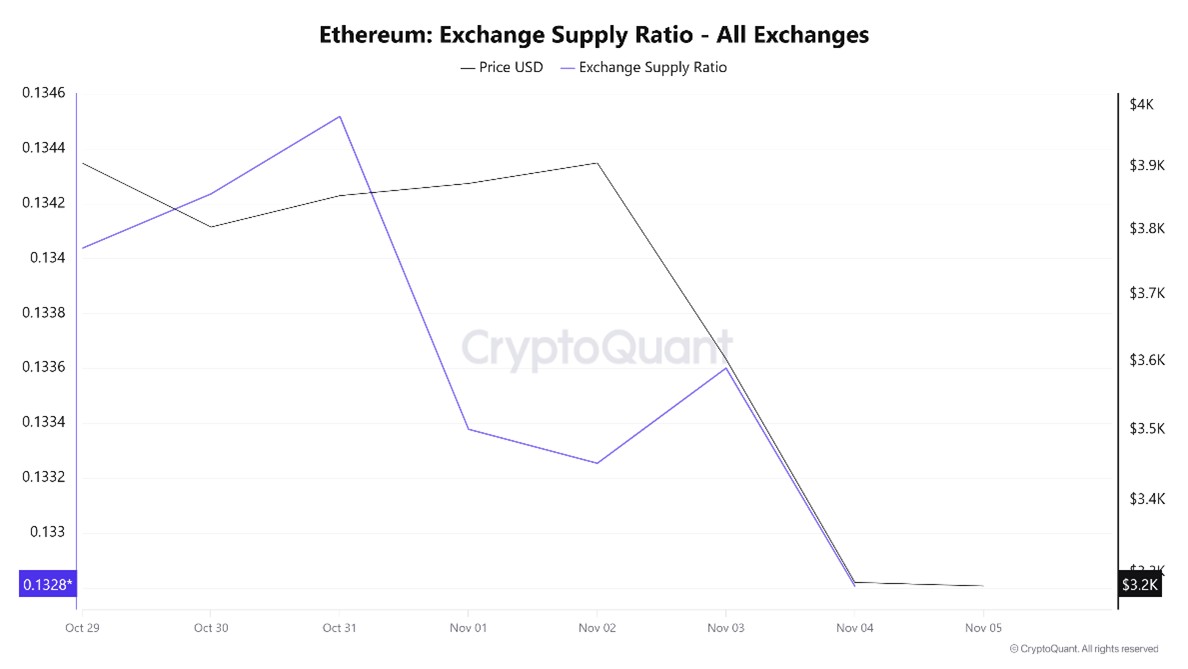
Between November 29 and November 5, the Ethereum Exchange Supply Ratio fell from 0.13403662 to 0.13280613. During this period, the price of Ethereum fell from $3,905 to $3,286. Particularly on November 3, when the price and Exchange Supply Ratio intersected, the Exchange Supply Ratio declined at the same rate as the price continued to fall. This situation indicates that, along with the price decline, the amount of Ethereum supplied to exchanges has decreased and that long-term investors have likely stopped holding their assets. Overall, a decline in the Ethereum price is evident.
Exchange Reserve
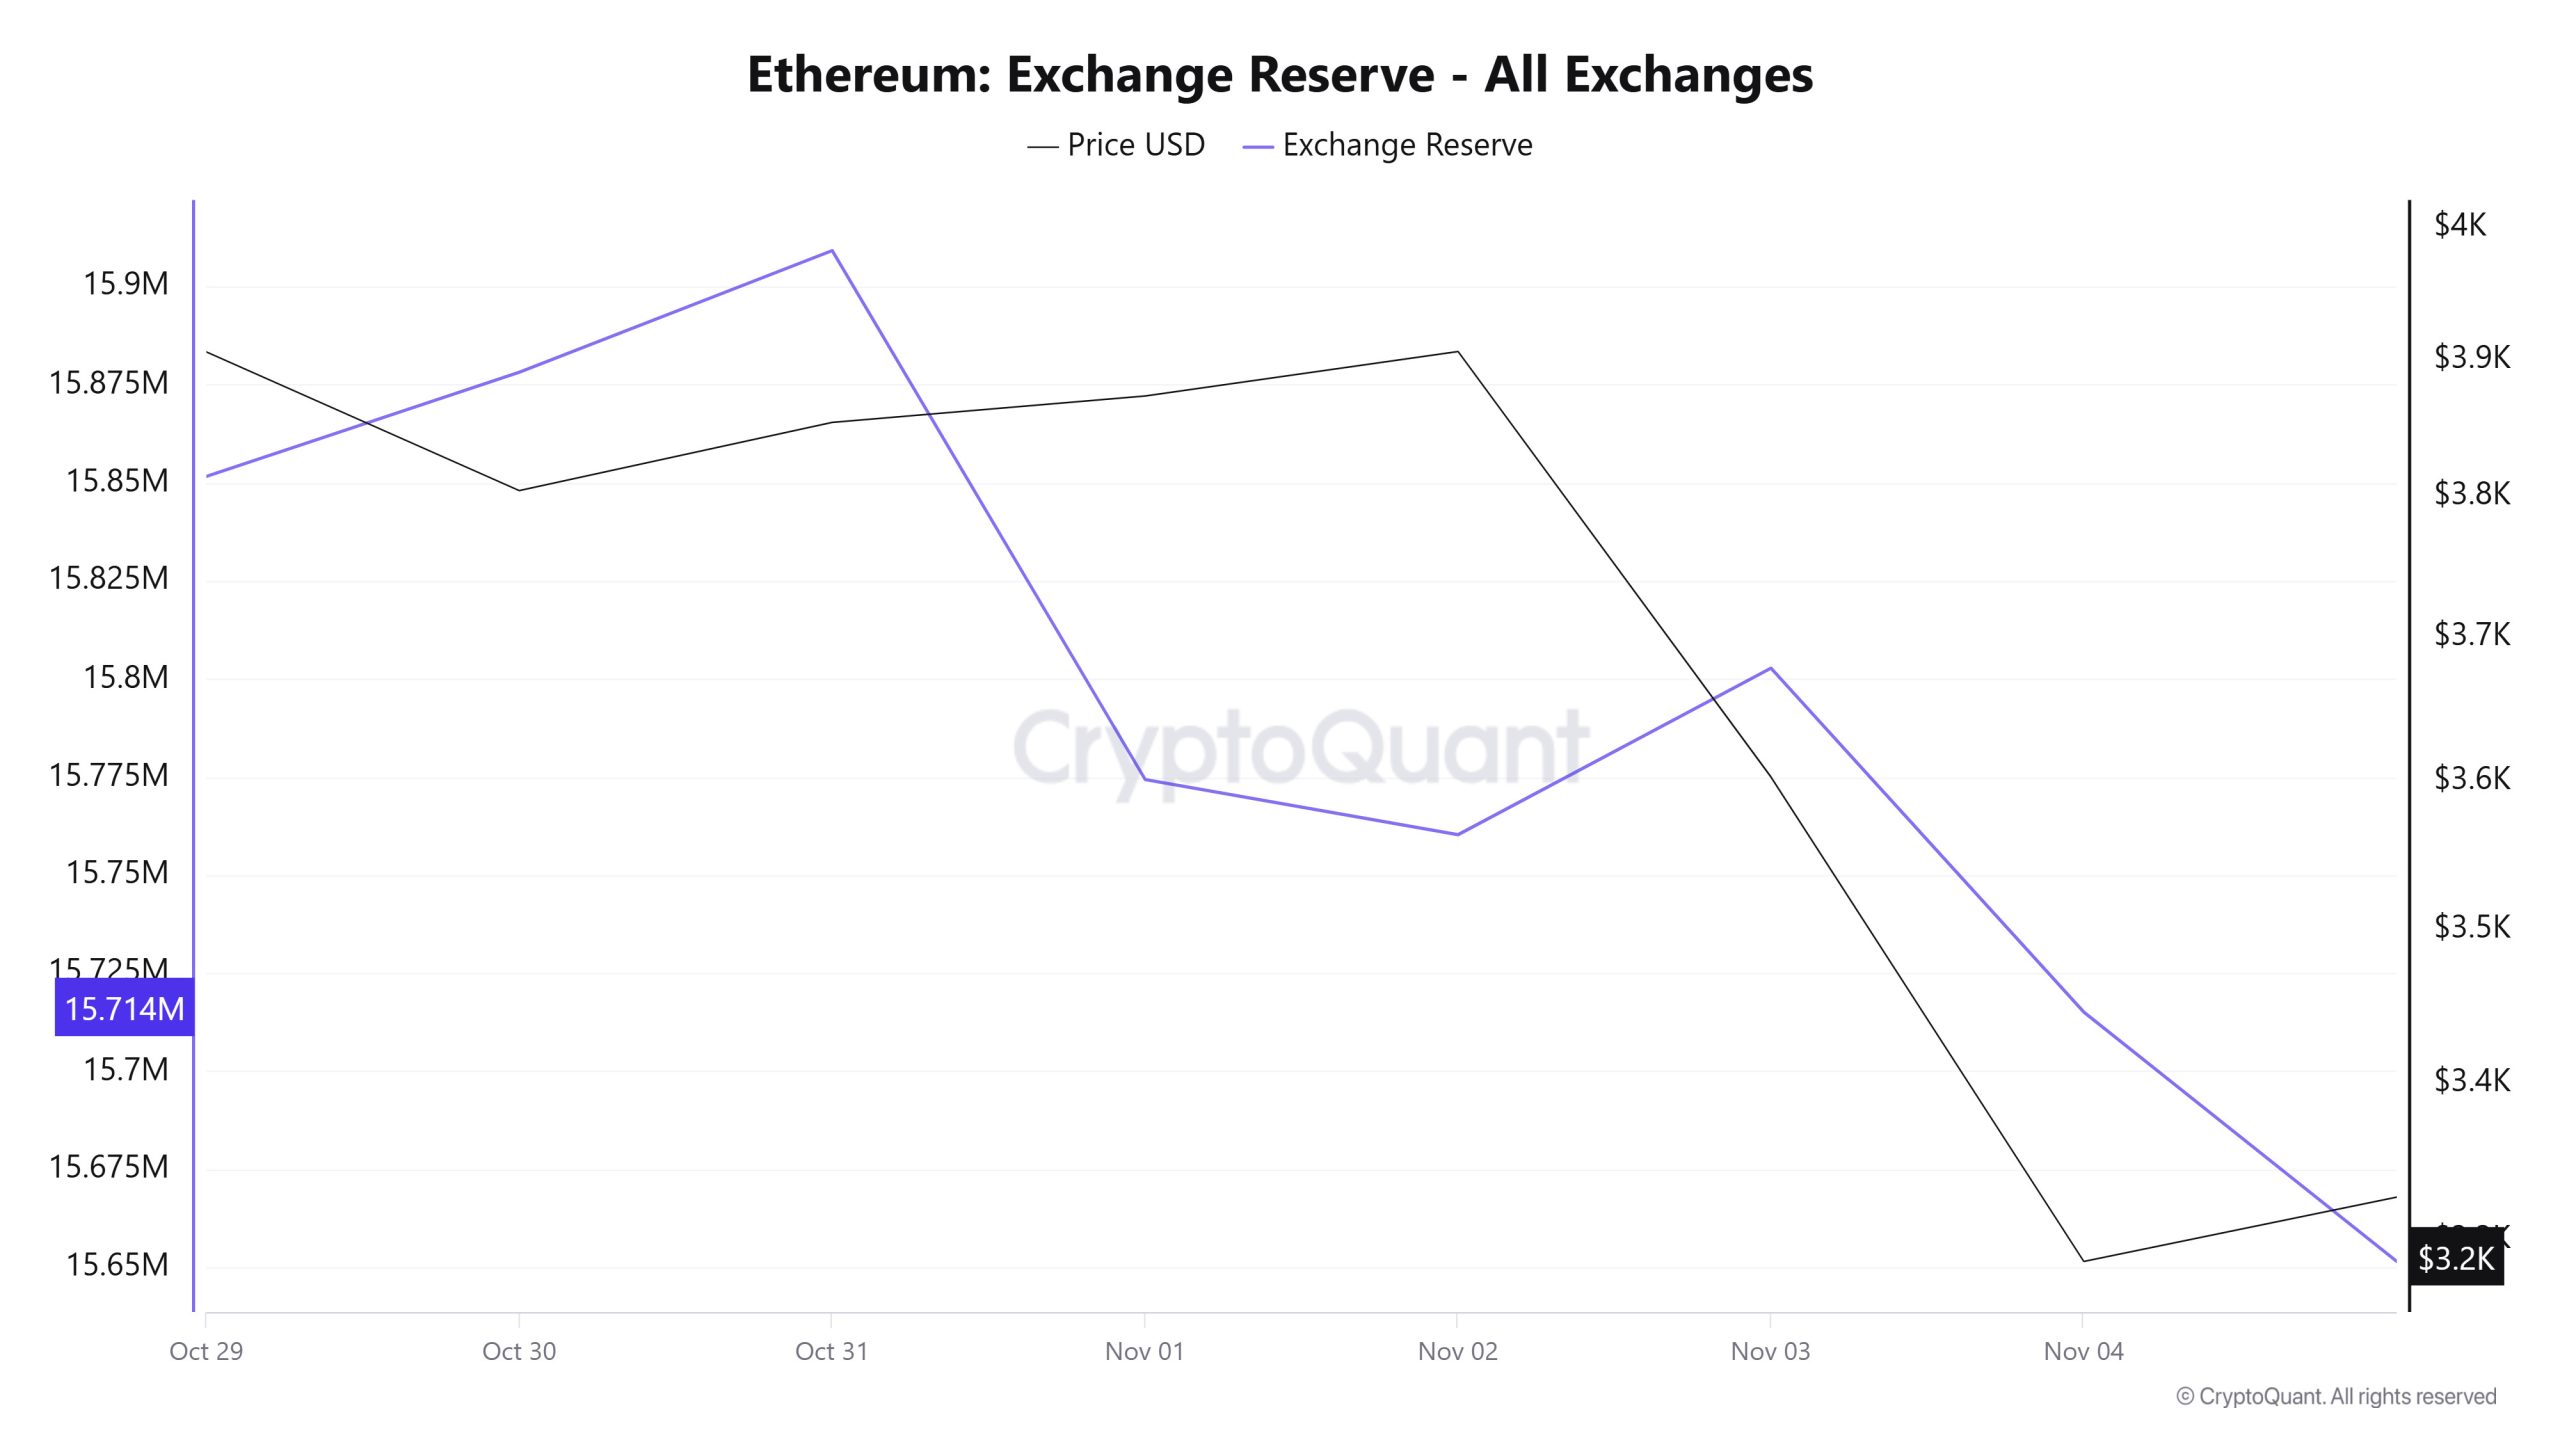
Between October 29 and November 4, 2025, Ethereum reserves on exchanges decreased from 15,851,625 ETH to 15,714,972 ETH. There was a net outflow of 138,400 ETH, and reserves decreased by approximately 0.87%. During the same period, the price of ETH fell from $3,980 to $3,286, losing 17.42% of its value. The decline in reserves accompanied by a fall in price indicates that investors viewed this drop more as an opportunity to withdraw and accumulate in their wallets rather than a selling opportunity. In other words, selling pressure is being resolved more on the spot side. This situation confirms weak demand conditions in the short term while strengthening the possibility of tightening on the supply side in the long term.
| Date | Exchange Inflow | Exchange Outflow | Exchange Netflow | Exchange Reserve | ETH Price ($) |
|---|---|---|---|---|---|
| October 29 | 868,180 | 869,927 | -1,748 | 15,851,625 | 3,980 |
| October 30 | 849,616 | 823,056 | 26,560 | 15,878,185 | 3,804 |
| October 31 | 878,015 | 846,967 | 31,048 | 15,909,233 | 3,854 |
| November 1 | 628,984 | 763,919 | -134,936 | 15,774,297 | 3,873 |
| November 2 | 202,314 | 216,368 | -14,054 | 15,760,243 | 3,906 |
| November 3 | 1,049,229 | 1,006,754 | 42,476 | 15,802,719 | 3,603 |
| November 4 | 1,737,545 | 1,825,292 | -87,747 | 15,714,972 | 3,286 |
Fees and Revenues
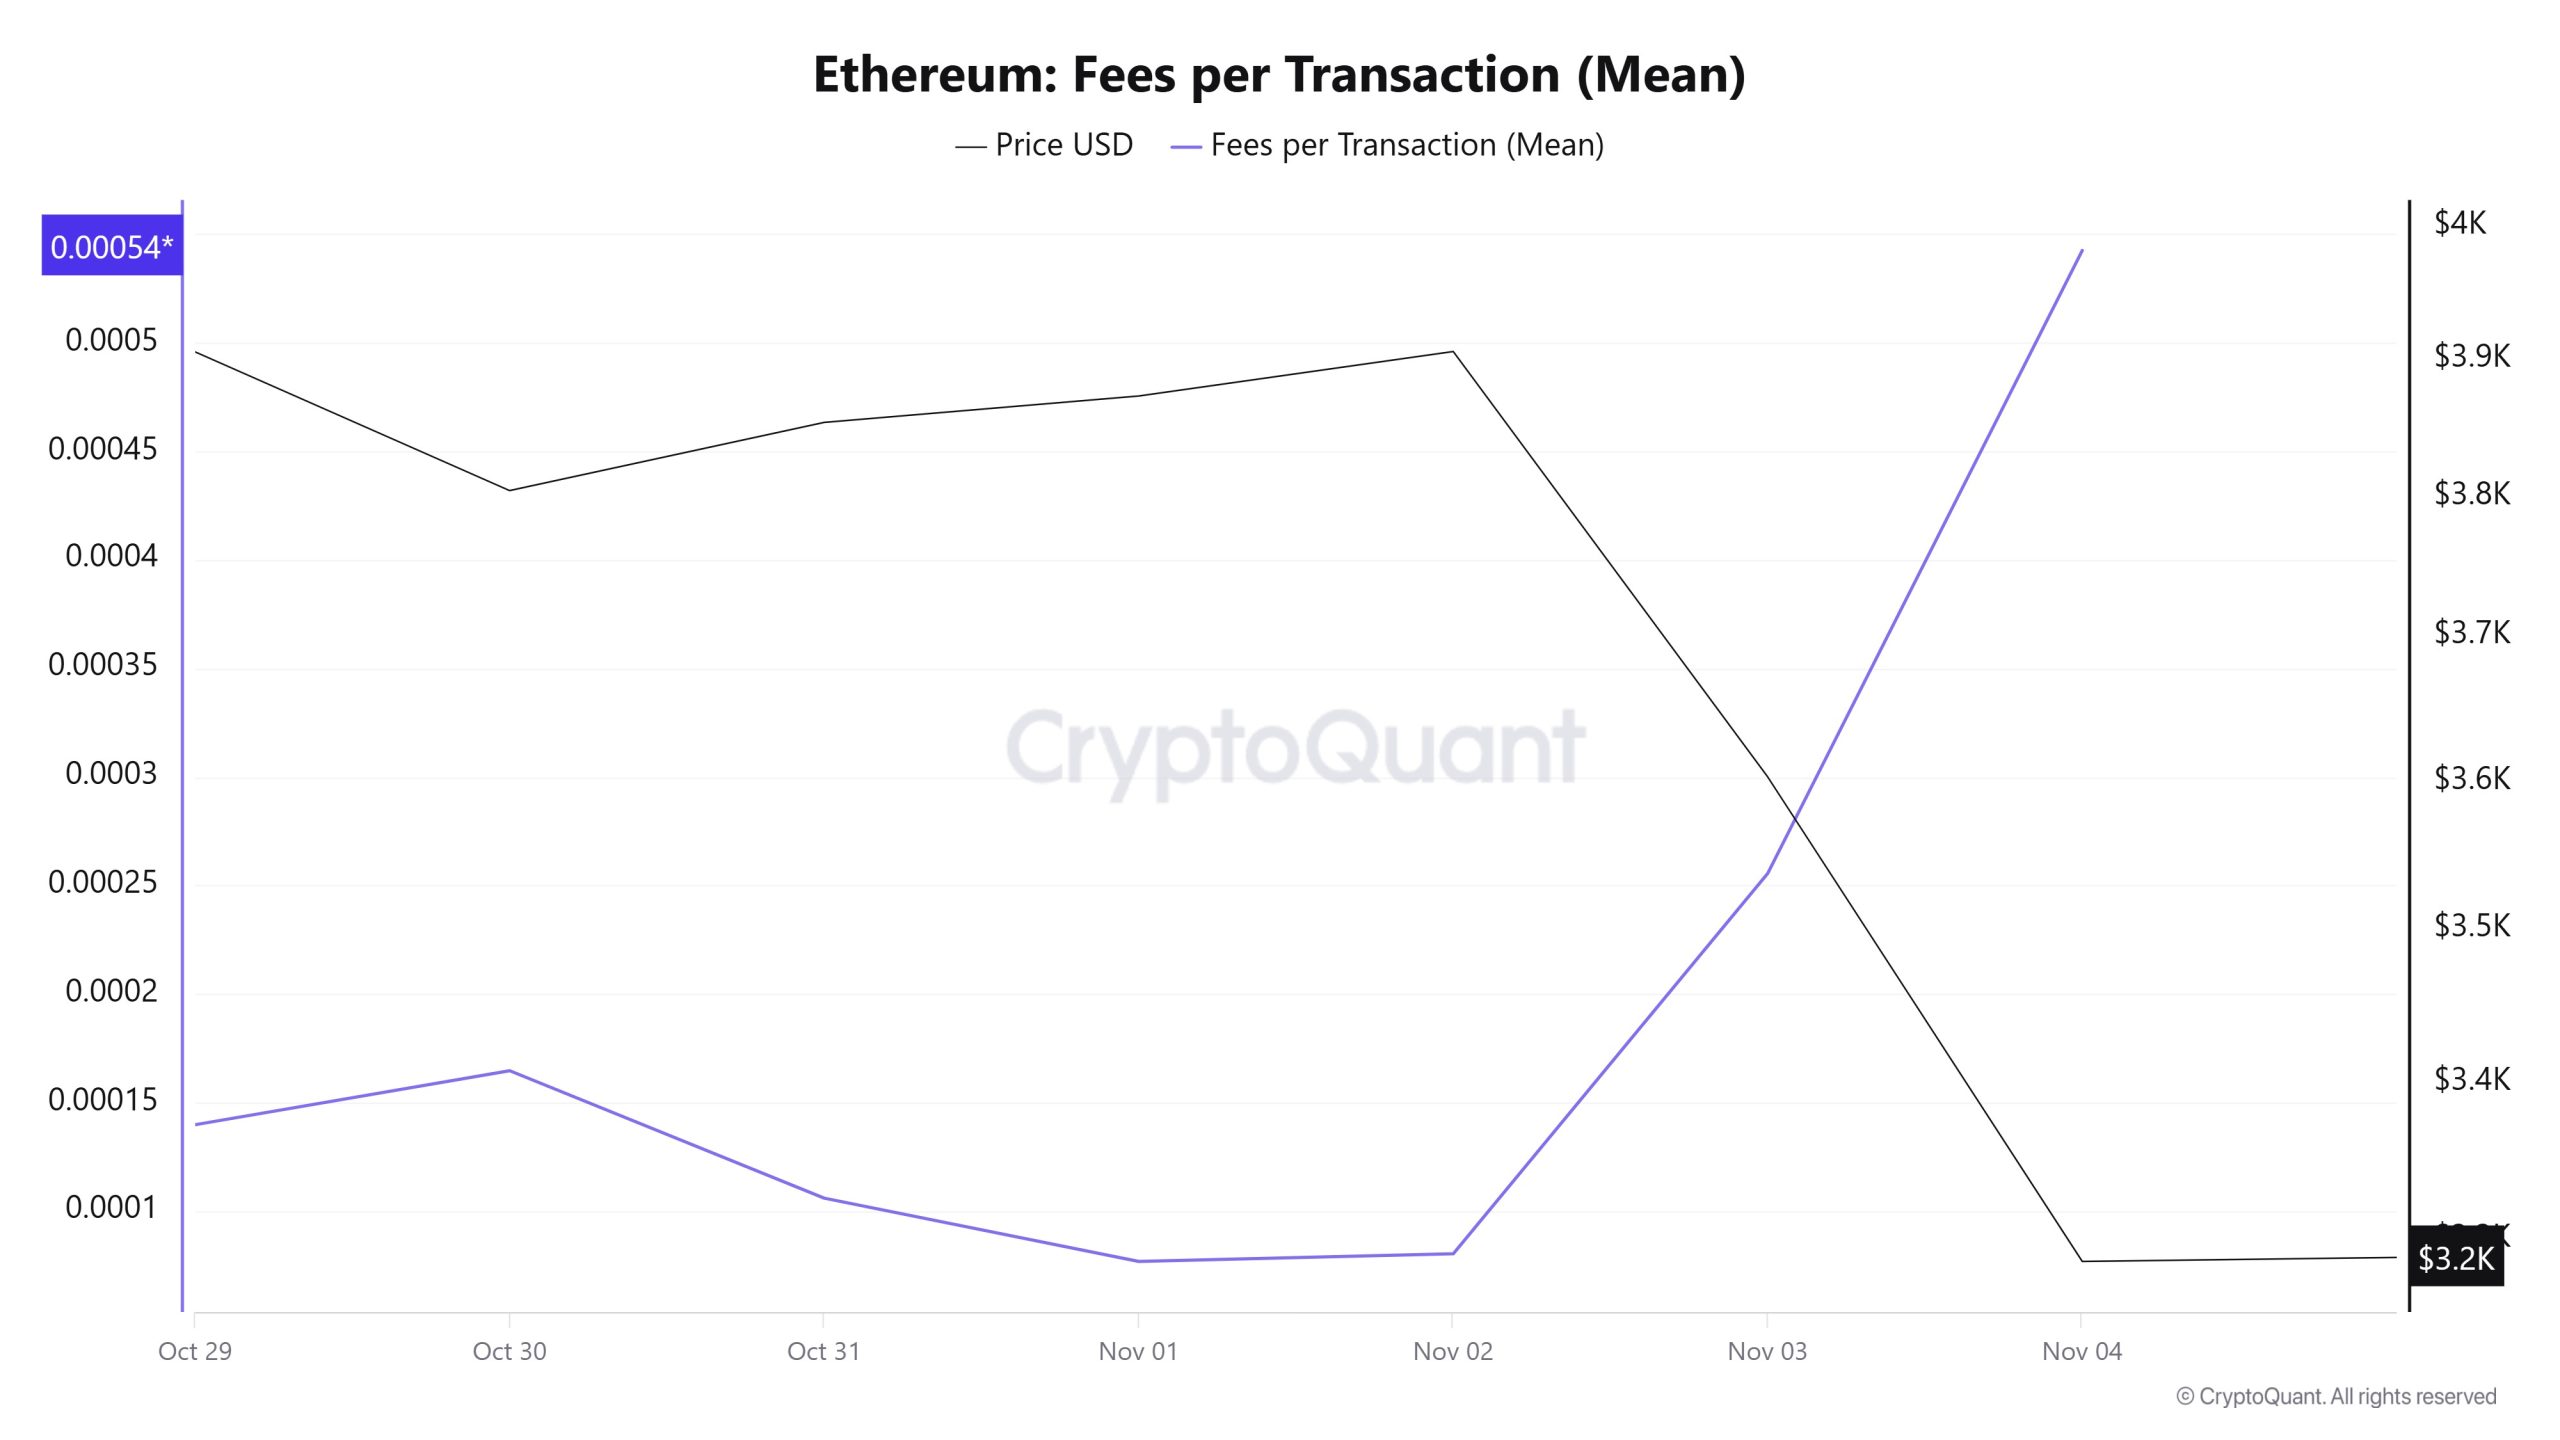
When examining the Ethereum Fees per Transaction (Mean) data for the period between October 29 and November 4, it is observed that the indicator reached 0.000139786680404605 on October 29, the first day of the week.
Although a limited increase was observed in the indicator on October 30, the value gradually declined in the following days due to the stagnation in the Ethereum price and remained at low levels until November 1.
In this context, as of November 2, with the significant increase in Ethereum price volatility, the indicator regained momentum and followed a positive trend due to the impact of price volatility. On November 4, the last day of the weekly period, the indicator reached 0.000542420213984383, recording the week’s peak value .
Ethereum: Fees (Total)
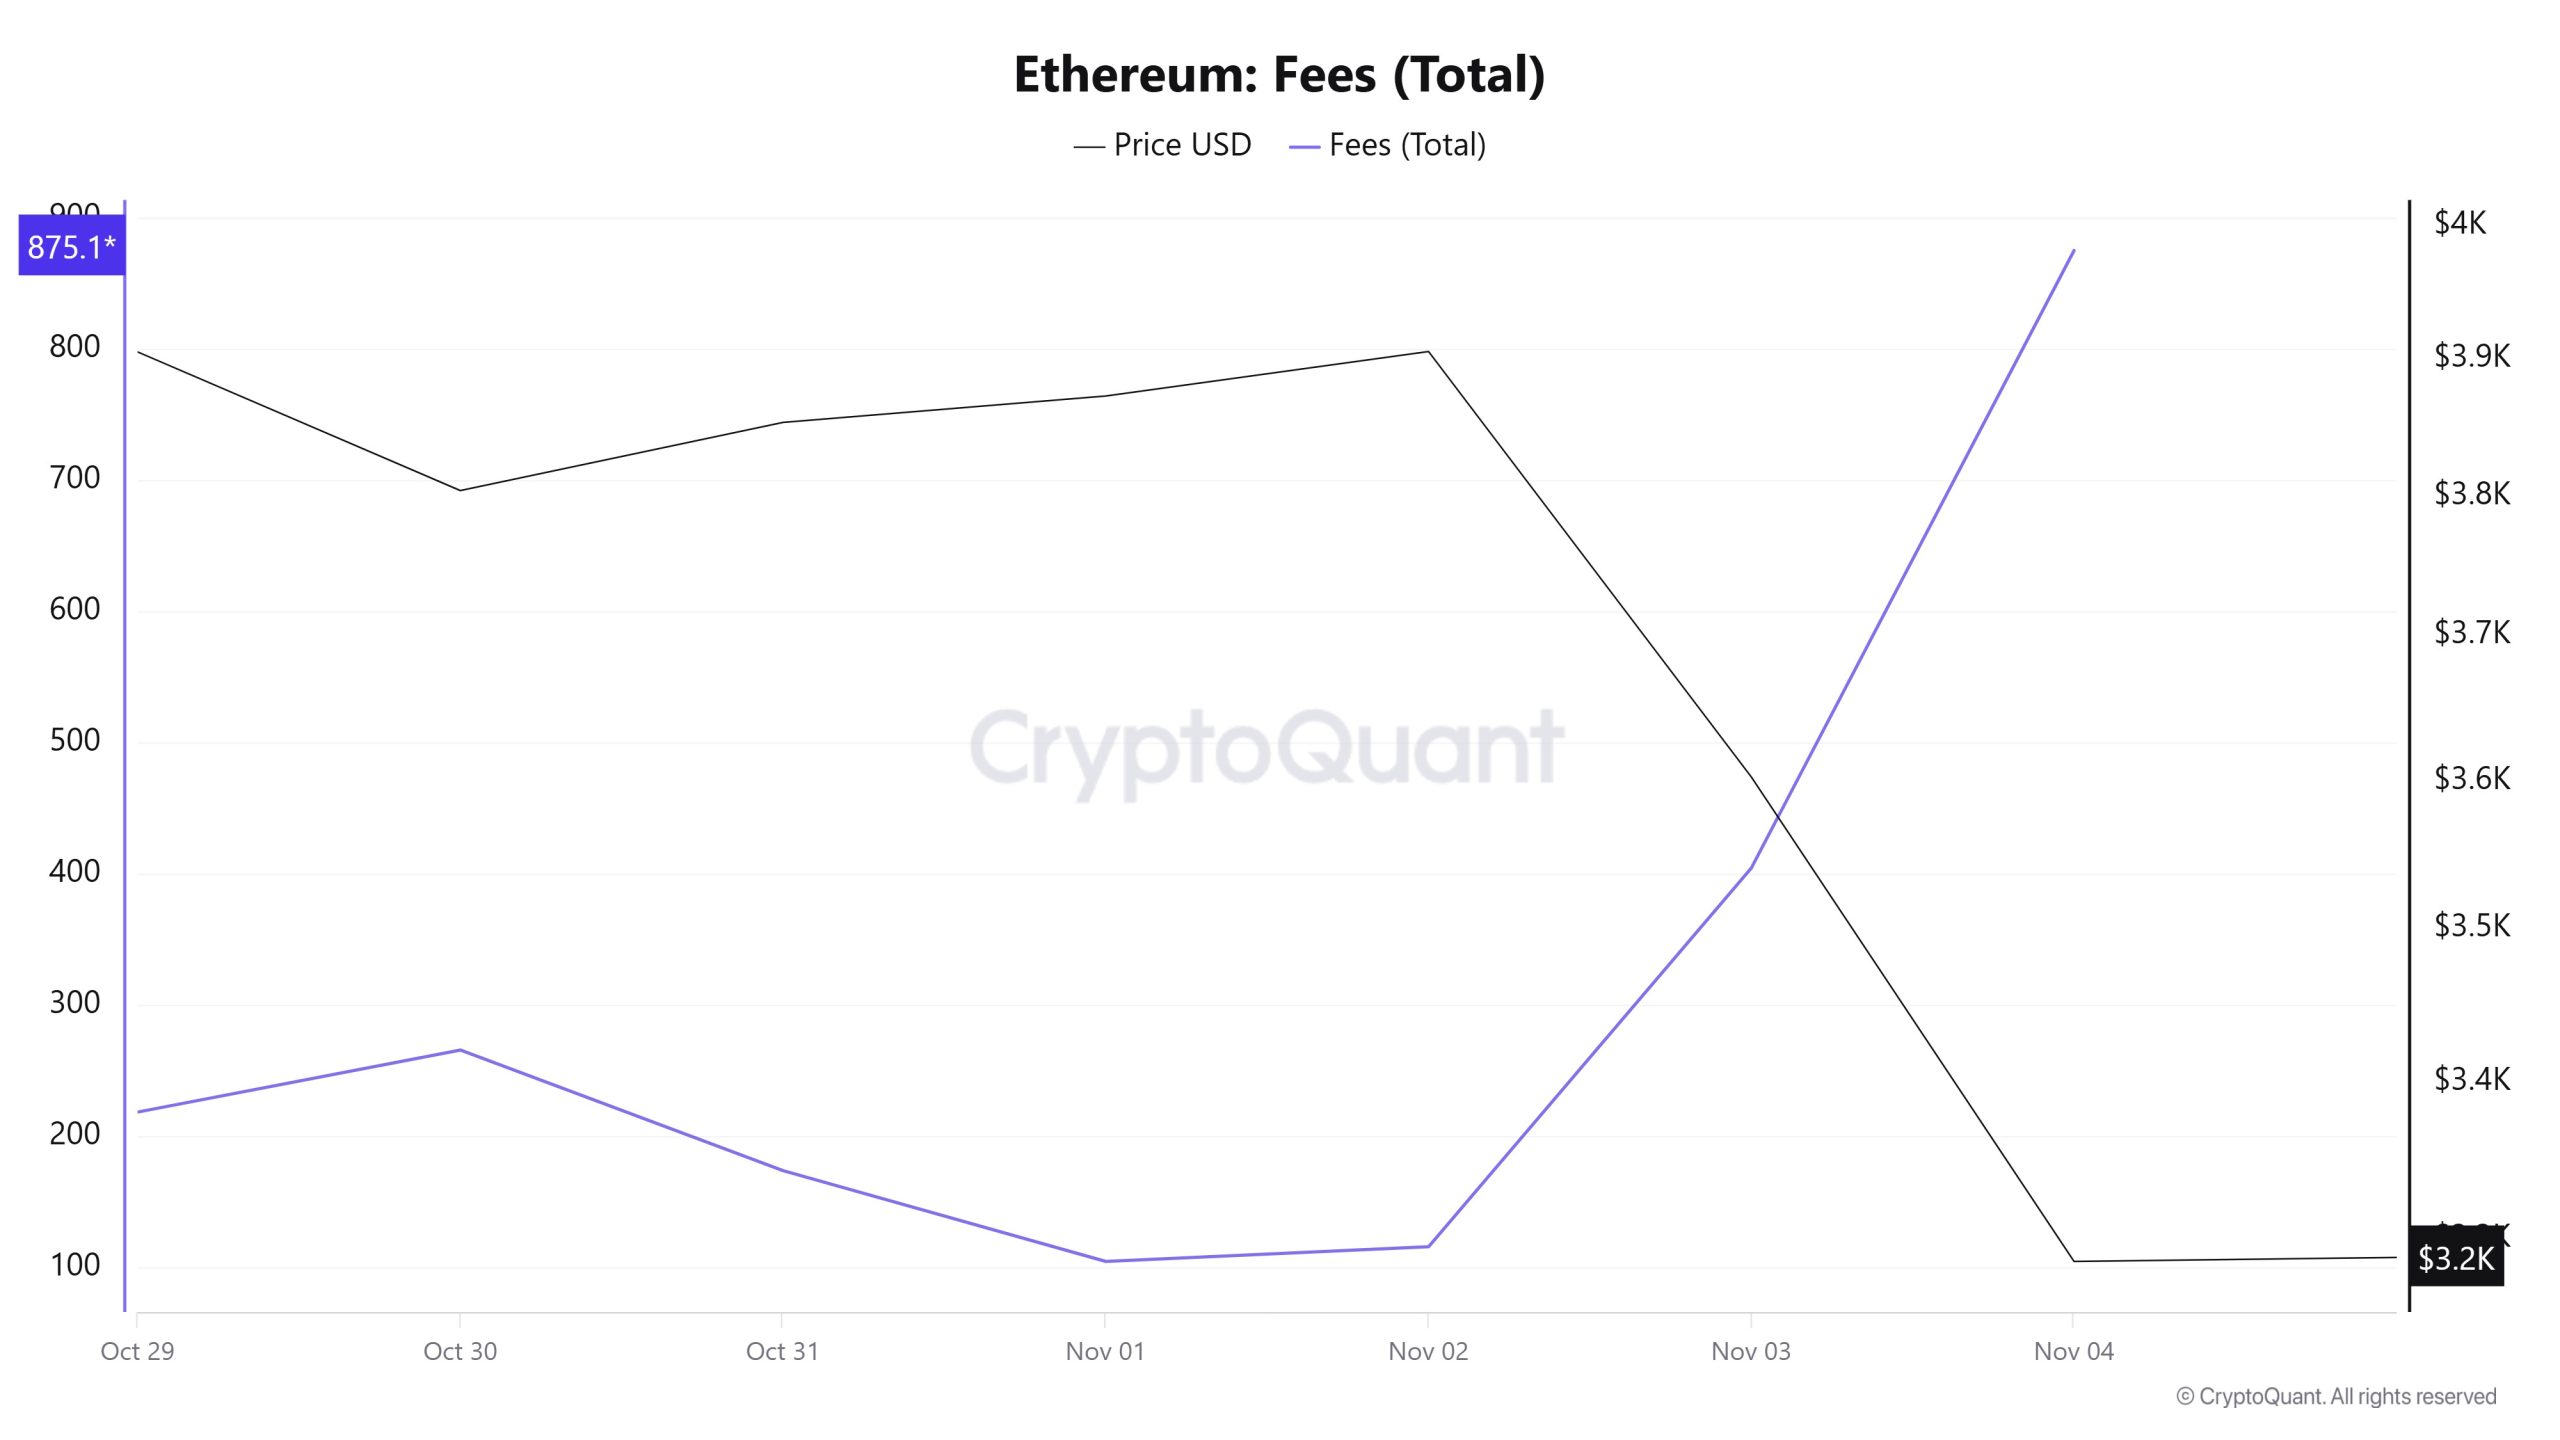
Similarly, when examining the Ethereum Fees (Total) data between October 29 and November 4, it can be seen that on October 29, the first day of the week, the indicator stood at 218.36077346003387.
Although a slight increase was observed in the indicator on October 30, it gradually declined in the following days due to the stagnation in the Ethereum price and remained at low levels until November 1.
In this context, as of November 2, the Ethereum price volatility increased significantly, and the indicator regained momentum, following a positive trend due to the impact of price volatility. On November 4, the last day of the weekly period, the indicator reached 875.1749457158846, recording the week’s peak value.
Blocks Mined
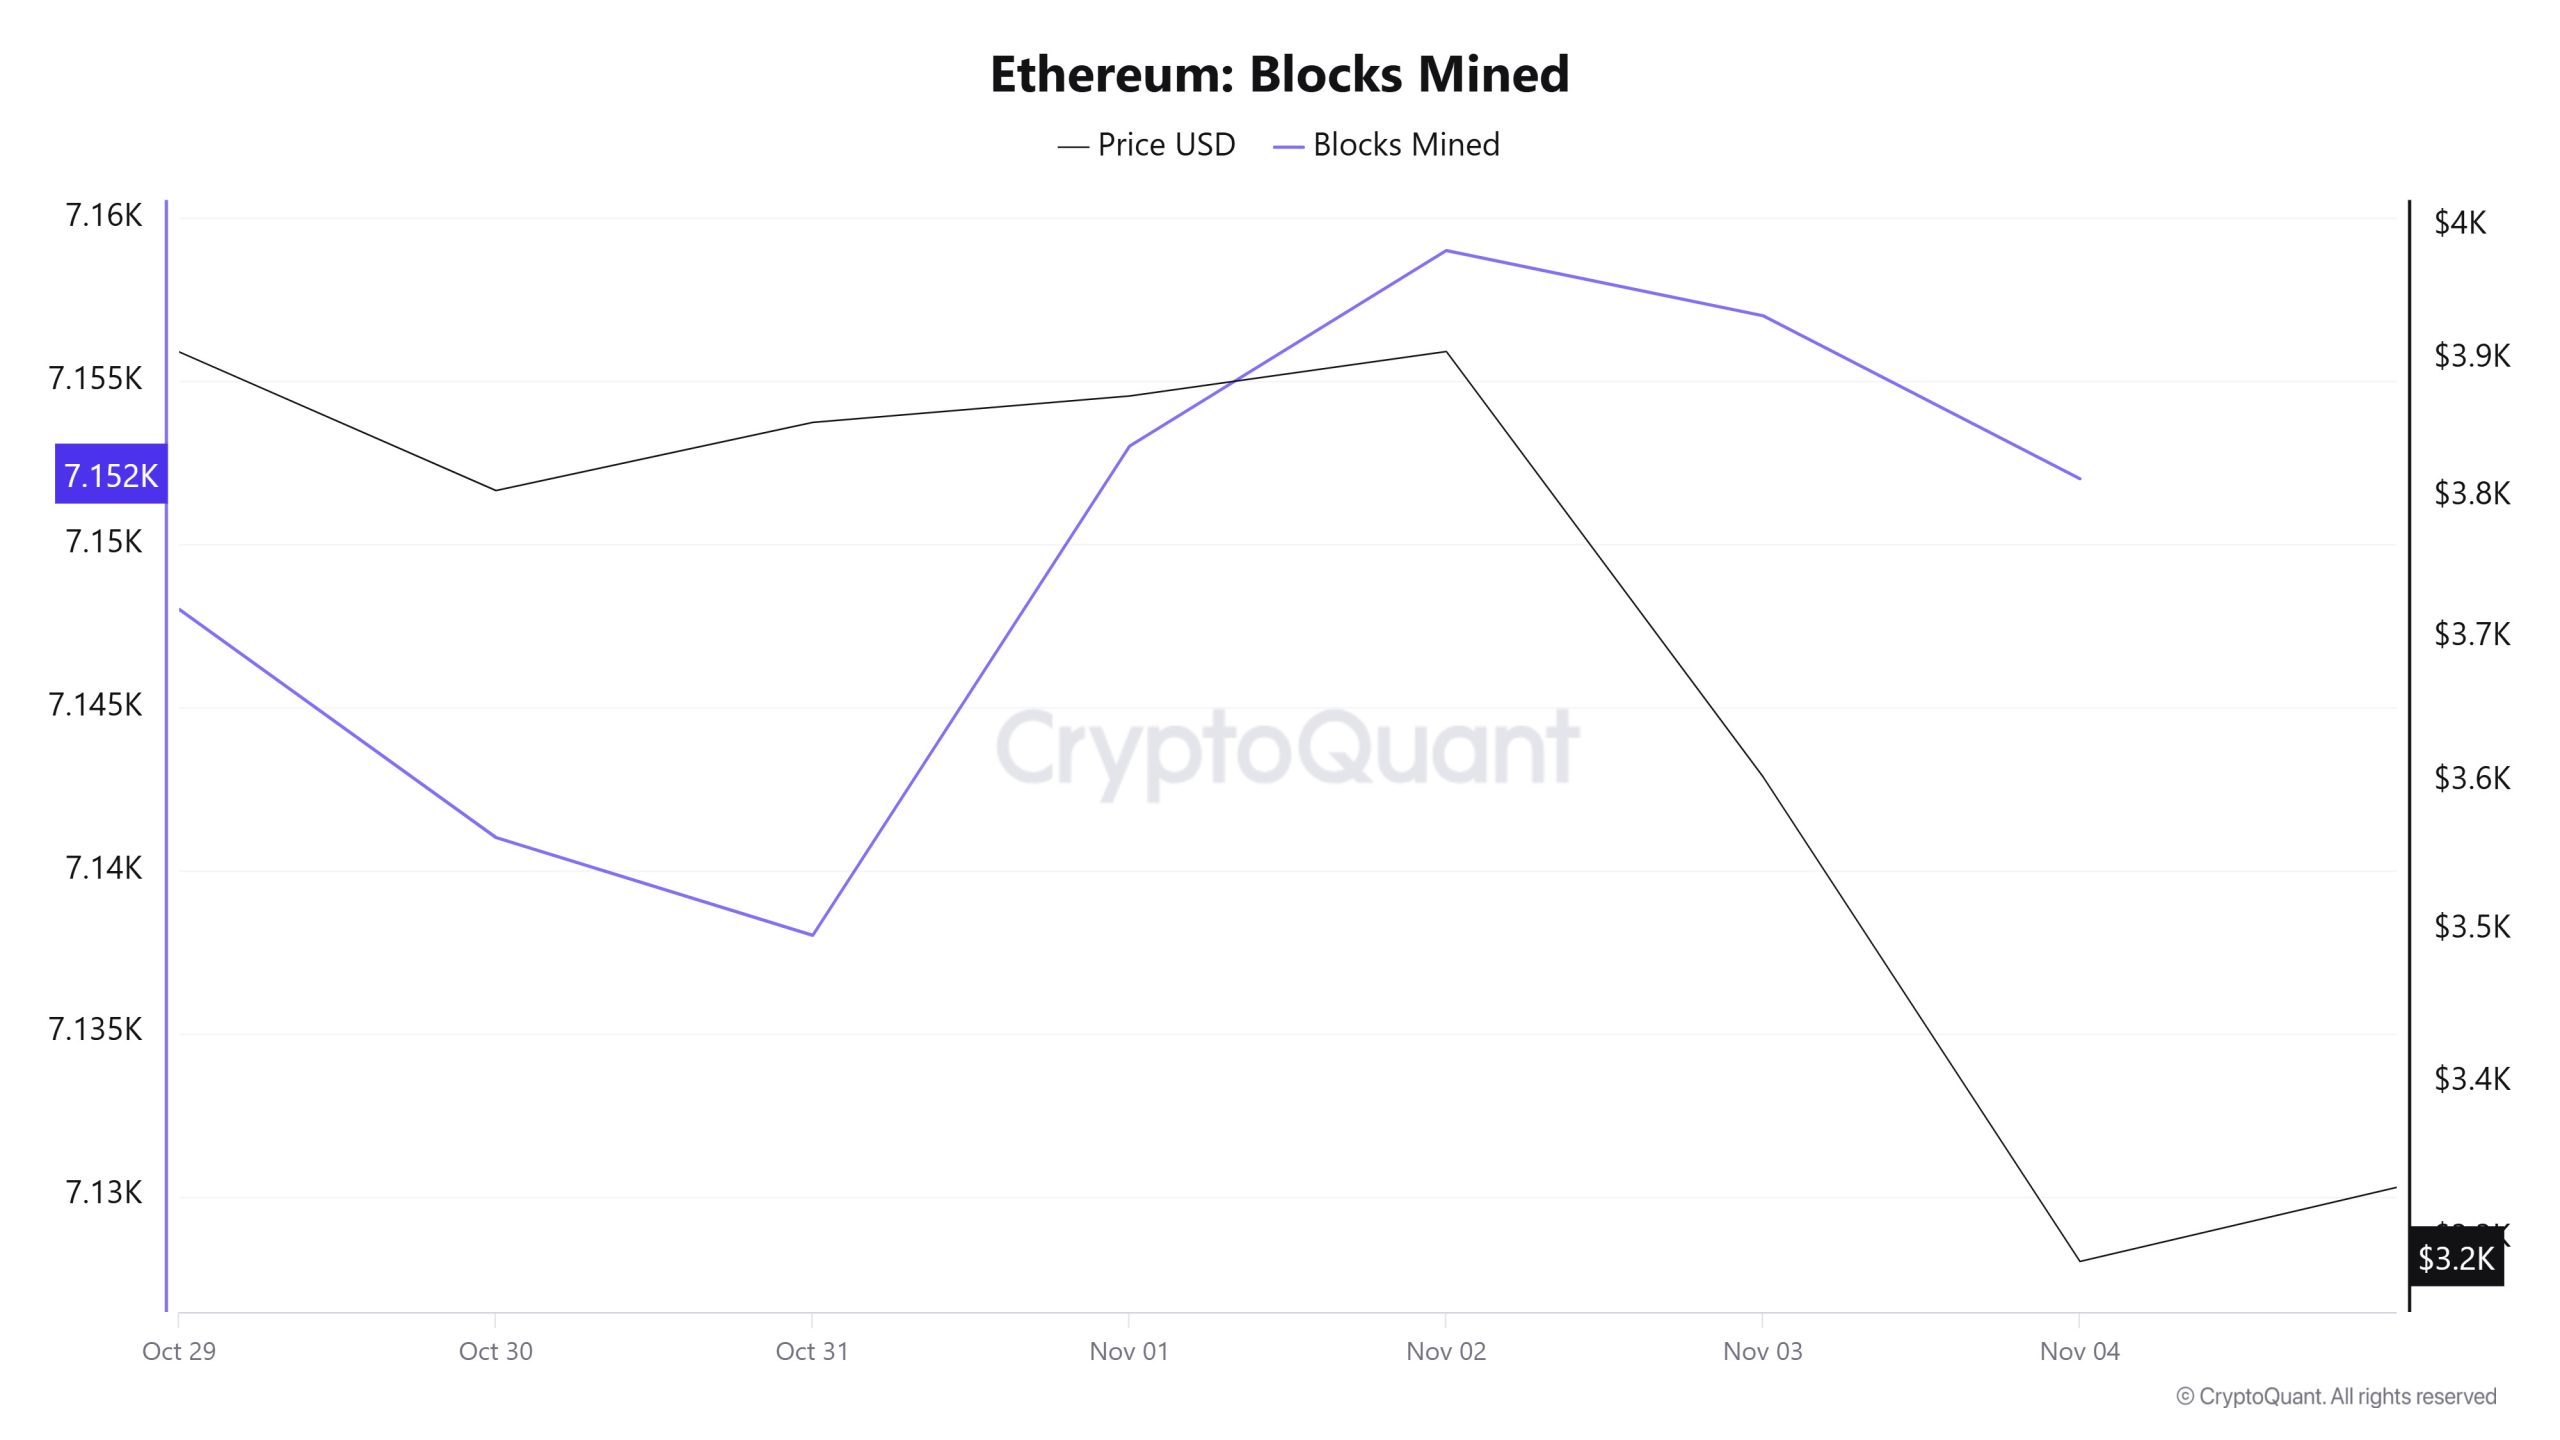
When examining Ethereum block production data between October 29 and November 4, there was a slight increase over the week. While 7,148 blocks were produced on October 29, this number rose to 7,152 as of November 4. A positive correlation was observed between the Ethereum price and the number of blocks produced throughout the week.
Block Size
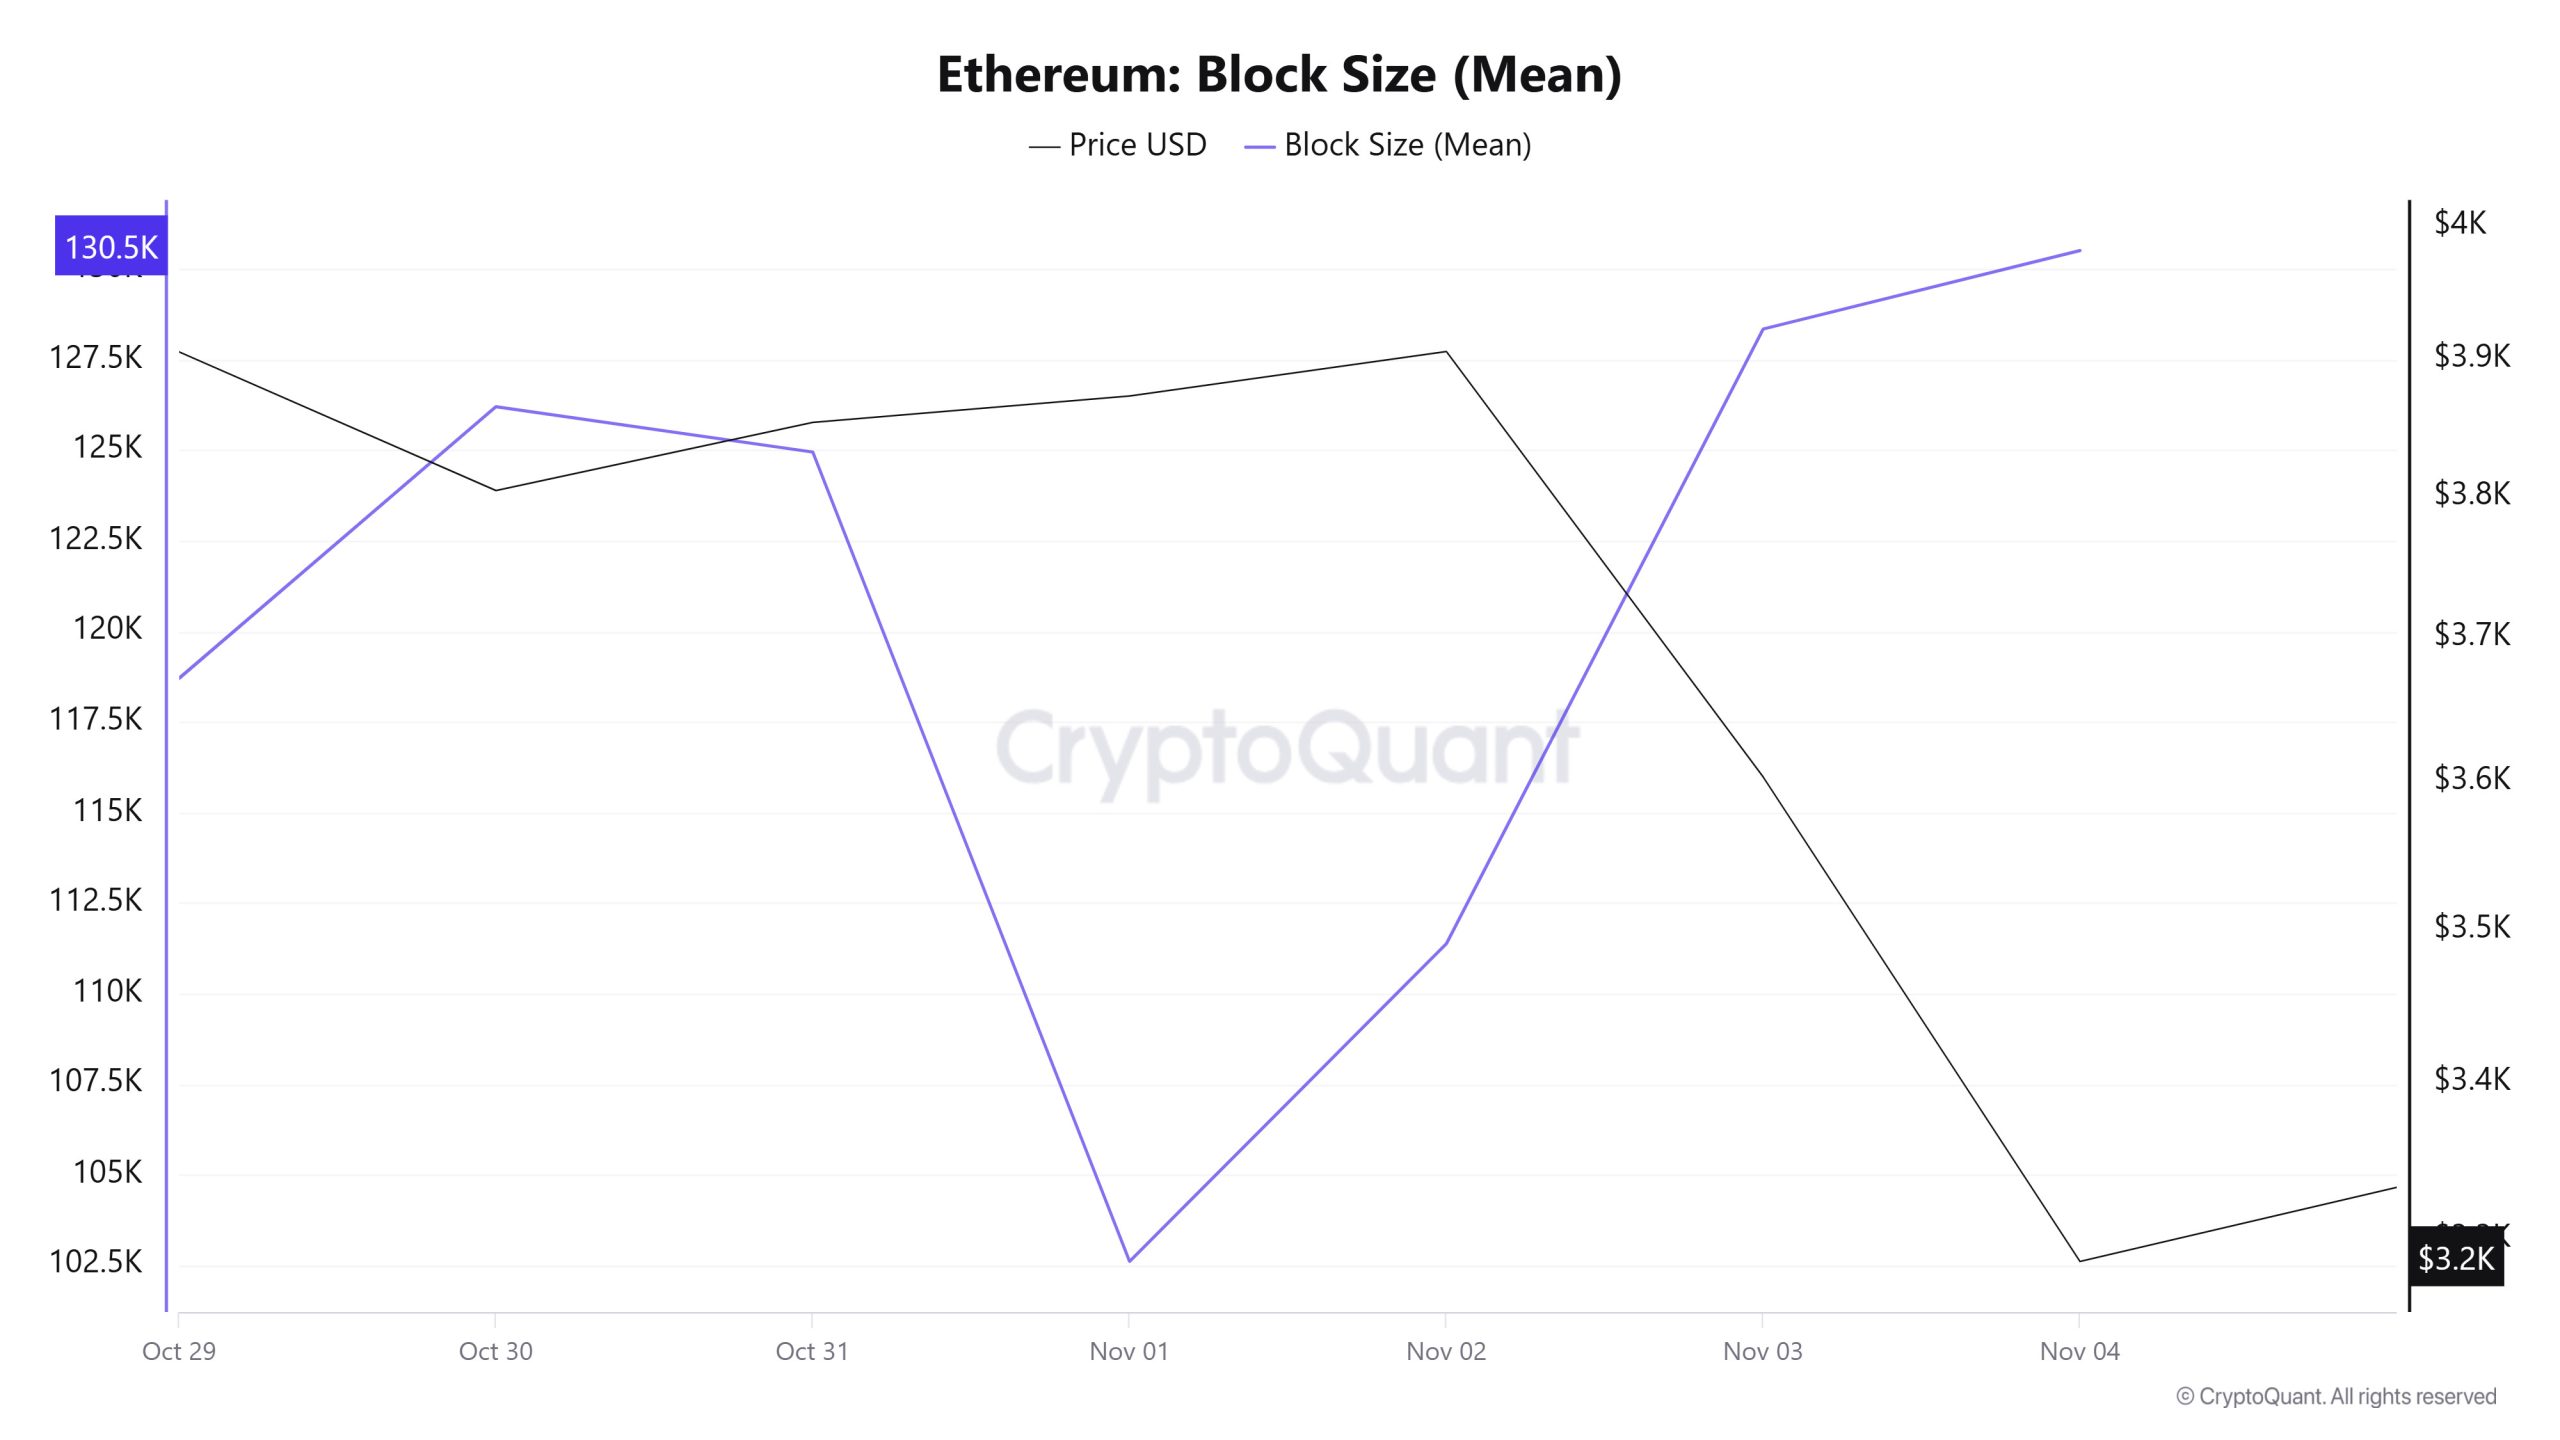
When examining Ethereum block size data between October 29 and November 4, an increase was observed throughout the week. While the average block size was measured at 118,705 bytes on October 29, this value rose to 130,515 bytes as of November 4.
During the relevant period, a time-dependent correlation structure was observed between block size and Ethereum price. However, the general trend reveals that a negative correlation between these two variables is dominant.
Block Interval
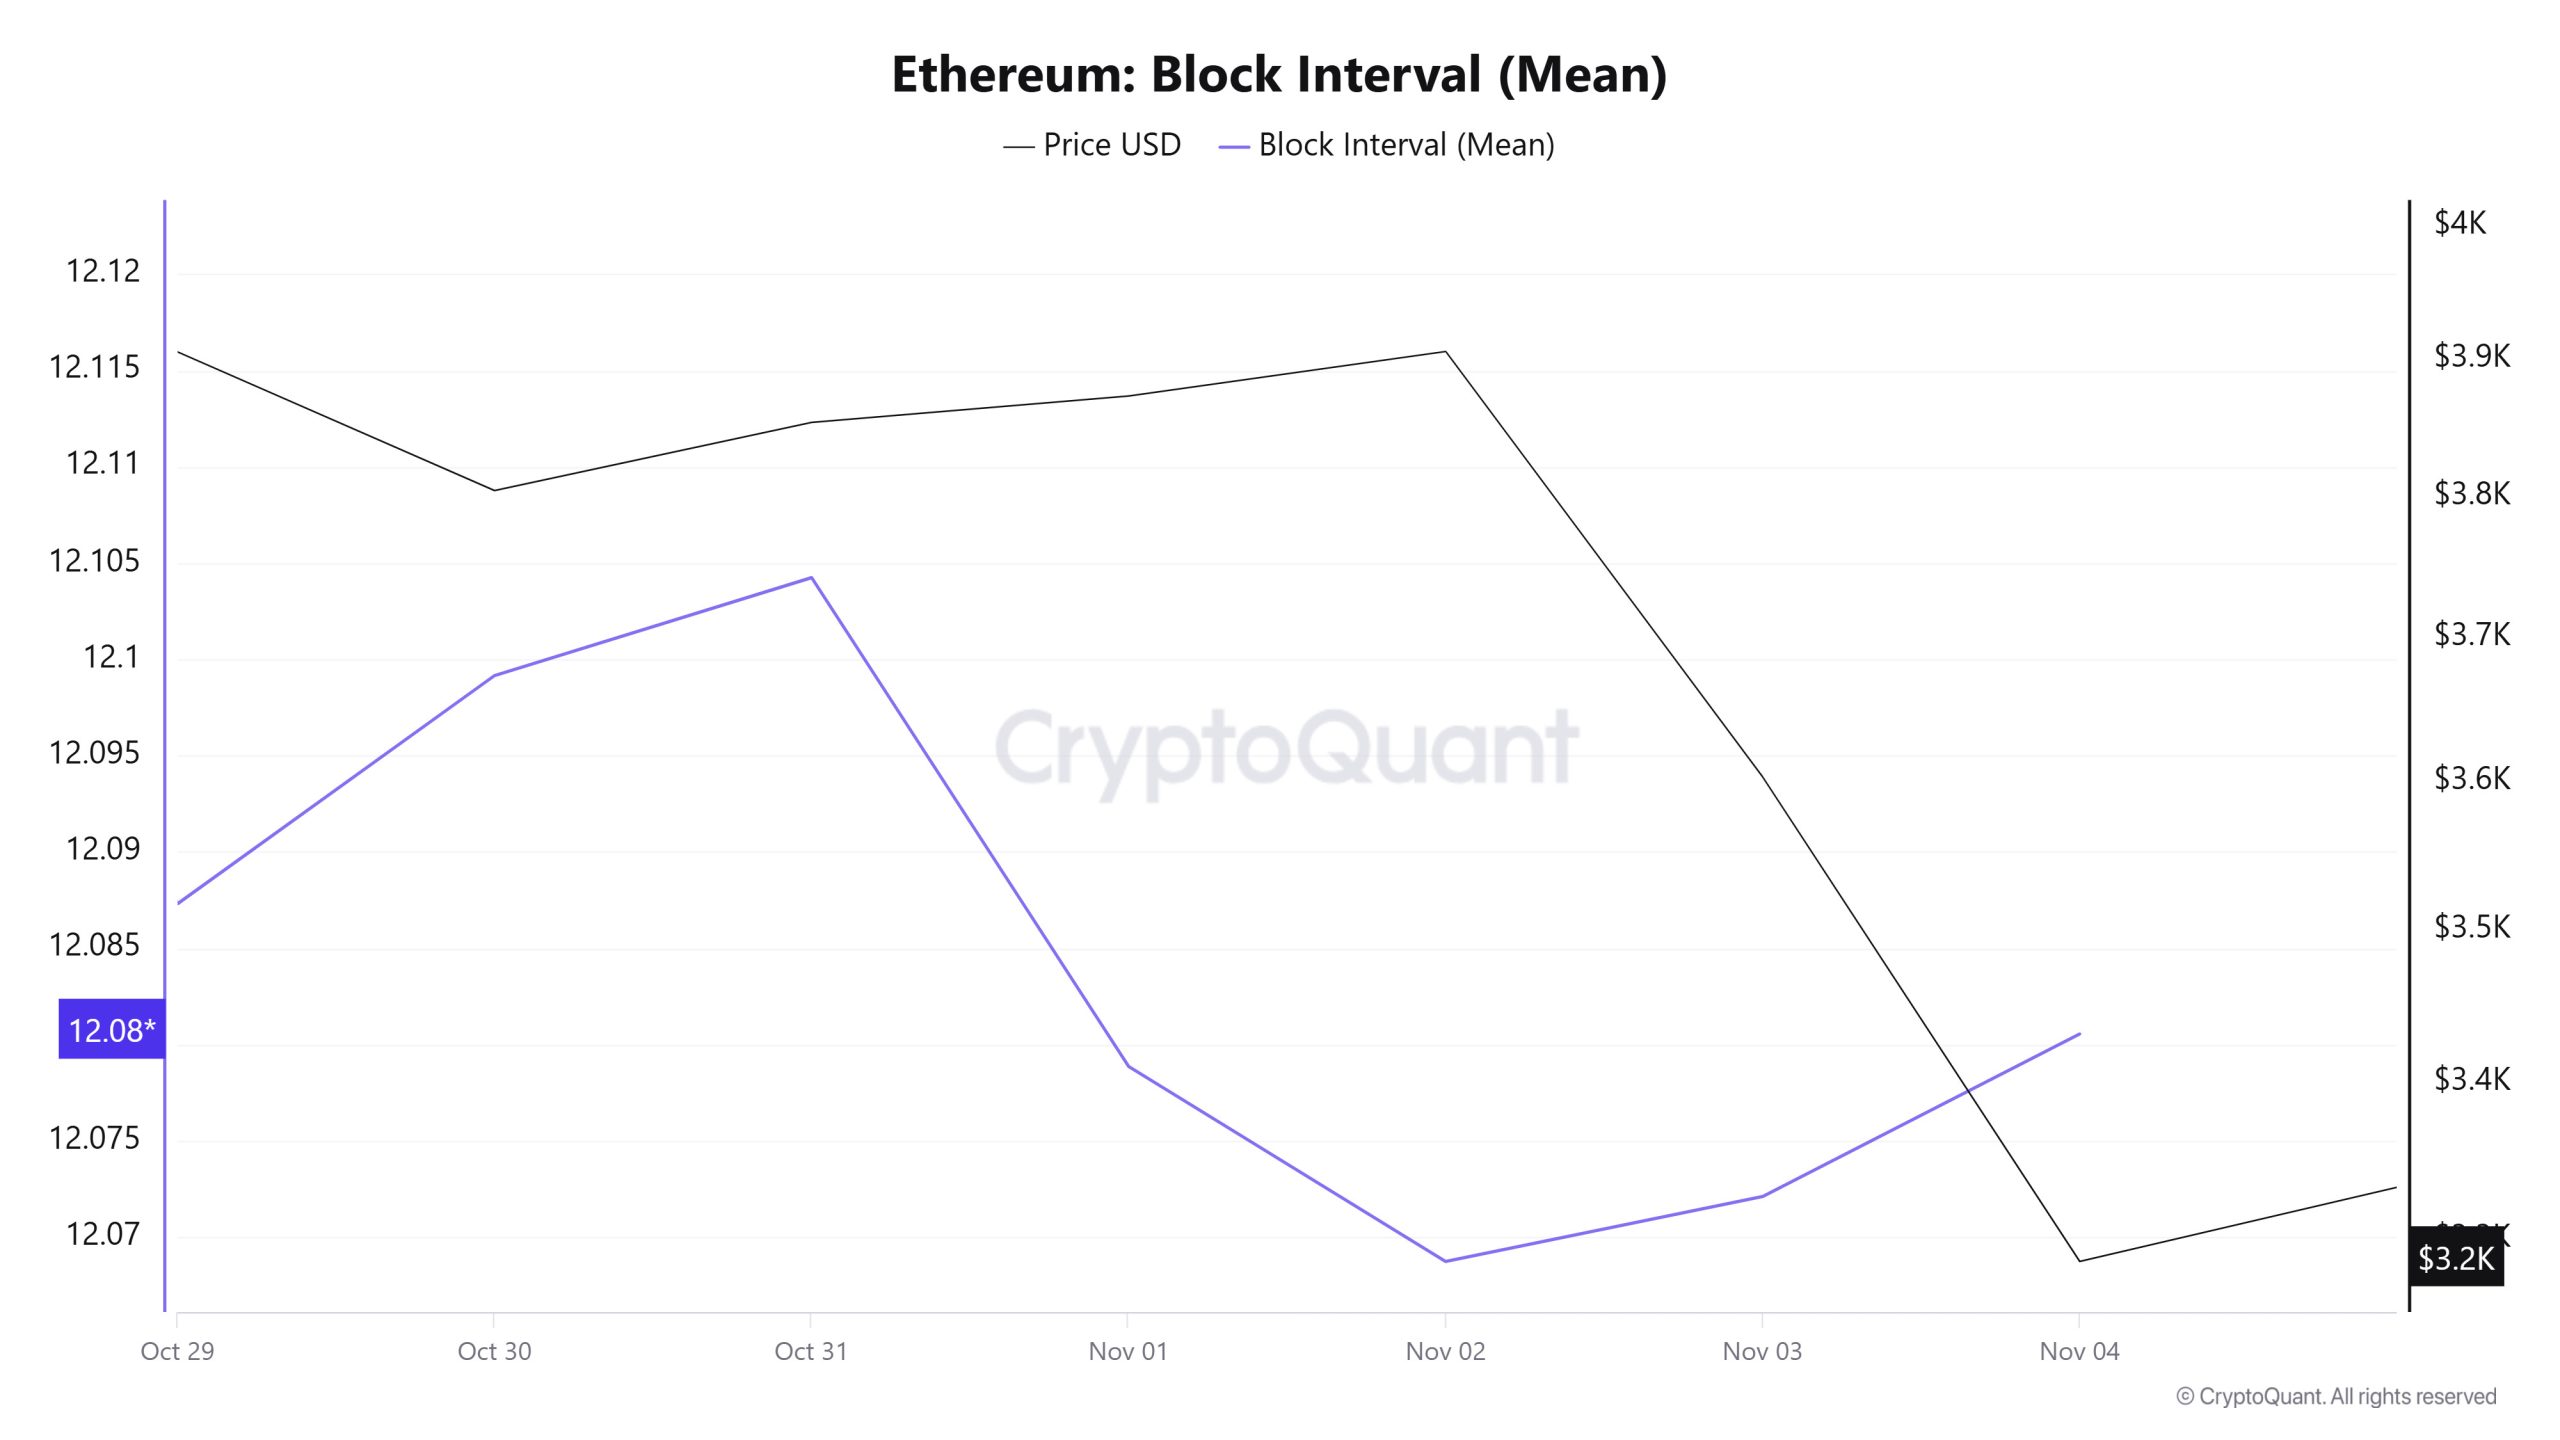
When examining the Ethereum block time between October 29 and November 4, no change occurred throughout the week. While the average block time was recorded as 12.08 seconds on October 29, it was again 12.08 seconds as of November 4.
During the period in question, a time-dependent correlation structure was observed between Ethereum block time and price movement. However, the general trend indicates that a negative correlation between these two variables is dominant.
Estimated Leverage Ratio
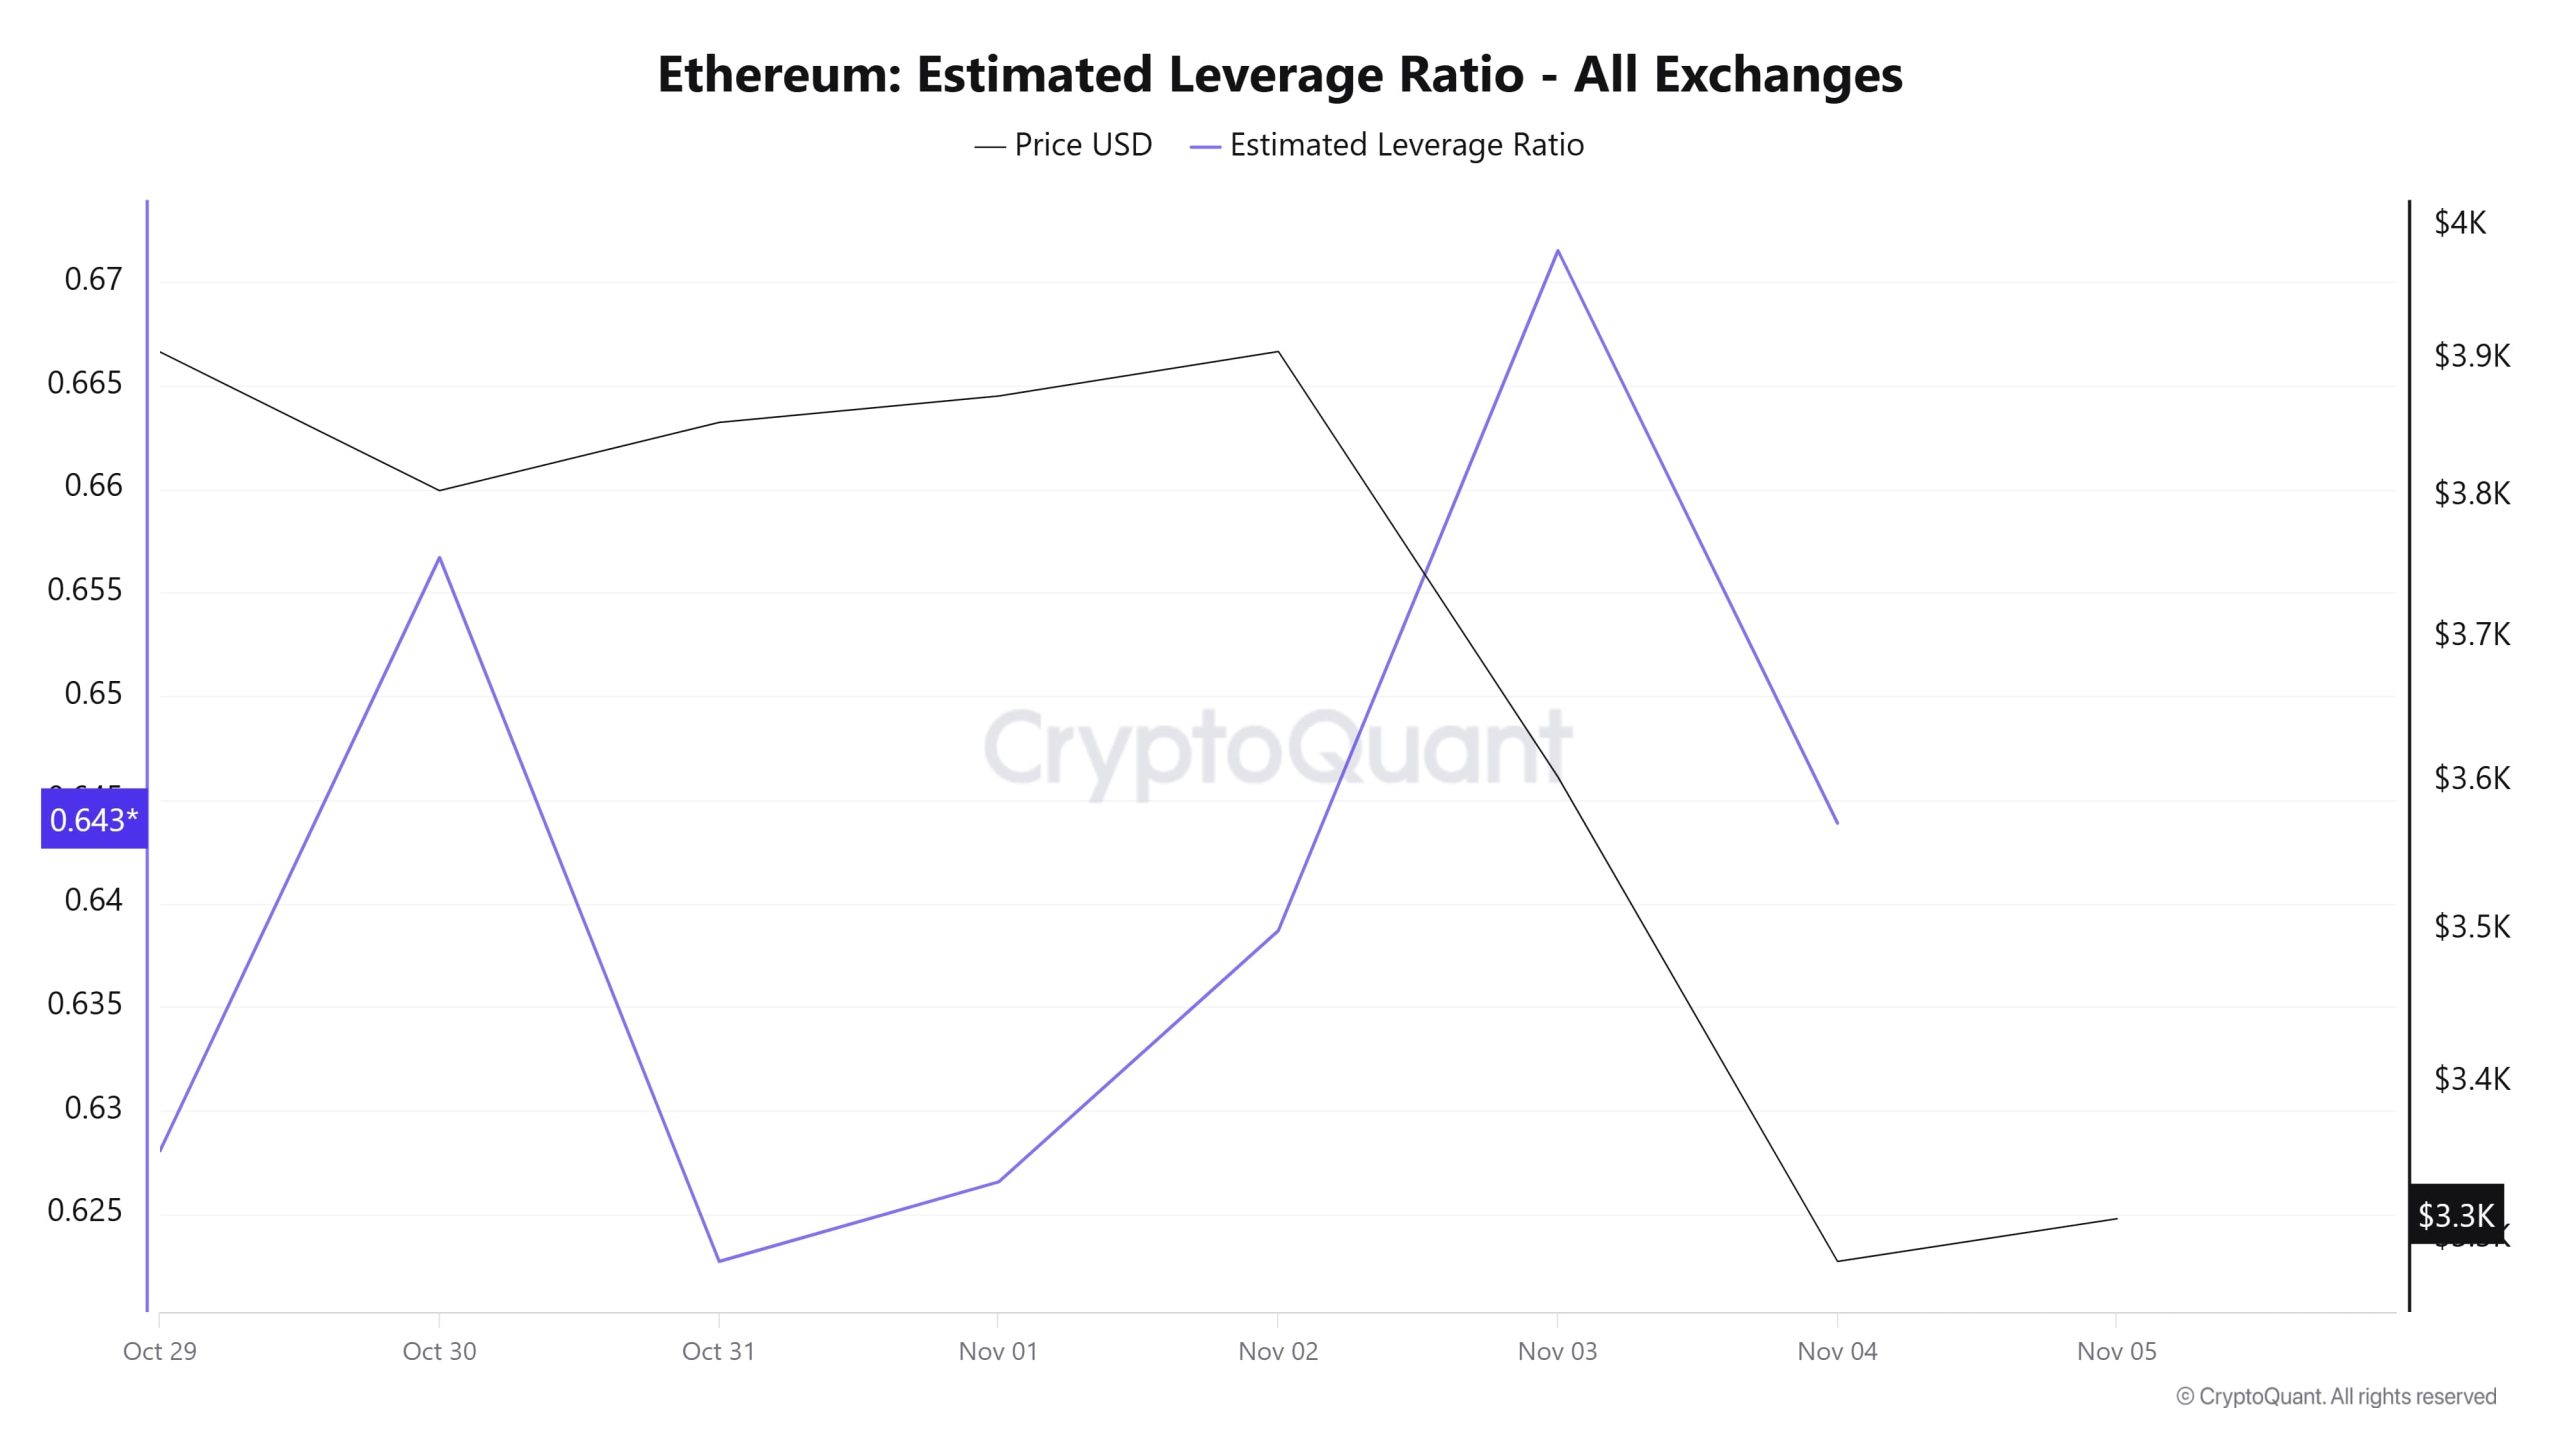
Although the metric showed an increase at the beginning of the 7-day period, it subsequently declined. After rising again in the middle of the period, the metric experienced a pullback towards the end. Starting at 0.628 at the beginning of the period, the ELR (Estimated Leverage Ratio) reached its lowest point on October 31, falling to 0.622. The metric then rose again, reaching its peak on November 3 at 0.671. At the time of writing, the metric stands at 0.643, indicating a slight decline in investor appetite. A higher ELR implies that participants are more willing to take on risk and typically indicates bullish conditions or expectations. It should be noted that these increases can also stem from a decline in reserves. Looking at Ethereum reserves, there were 15.85 million reserves at the beginning of the process, but this figure declined further during the rest of the process and currently stands at 15.64 million. At the same time, Ethereum’s Open Interest was $47.62 billion at the beginning of the process. As of now, volume has declined during the process, and the open interest value stands out at $38.19 billion. With all this data, the ELR metric experienced a balanced increase throughout the process. The asset’s price fluctuated between $3,900 and $3,110 with all this data. As of now, investors’ and traders’ risk appetite appears balanced. Consequently, the decrease in open interest volume and reserves throughout the process indicates that the slight increase in the ELR ratio is artificial.
ETH Onchain Overall
| Metric | Positive 📈 | Negative 📉 | Neutral ➖ |
|---|---|---|---|
| Active Addresses | ✓ | ||
| Total Value Staked | ✓ | ||
| Derivatives | ✓ | ||
| Exchange Supply Ratio | ✓ | ||
| Exchange Reserve | ✓ | ||
| Fees and Revenues | ✓ | ||
| Blocks Mined | ✓ | ||
| Estimated Leverage Ratio | ✓ |
*The metrics and guidance provided in the table do not alone explain or imply any expectation regarding future price changes in any asset. The prices of digital assets can fluctuate based on numerous different variables. The on-chain analysis and related guidance are intended to assist investors in their decision-making process, and basing financial investments solely on the results of this analysis may lead to unfavorable outcomes. Even if all metrics produce positive, negative, or neutral results simultaneously, the expected outcomes may not materialize depending on market conditions. It would be beneficial for investors reviewing the report to take these warnings into consideration.
Legal Notice
The investment information, comments, and recommendations contained in this document do not constitute investment advisory services. Investment advisory services are provided by authorized institutions on a personal basis, taking into account the risk and return preferences of individuals. The comments and recommendations contained in this document are of a general nature. These recommendations may not be suitable for your financial situation and risk and return preferences. Therefore, making an investment decision based solely on the information contained in this document may not result in outcomes that align with your expectations.
NOTE: All data used in Ethereum on-chain analysis is based on CryptoQuant.

