
Technical Analysis
BTC/USDT
The White House announced that the economic impact of the government shutdown is “more serious than expected” and could drag down fourth-quarter growth. Fed Vice Chair Jefferson indicated that interest rates are approaching neutral levels, while New York Fed President Williams warned of liquidity tightness in the repo market. While bipartisan agreement on crypto legislation could not be reached in the Senate, White House adviser David Sacks said a “nearly finalized draft” was being worked on.
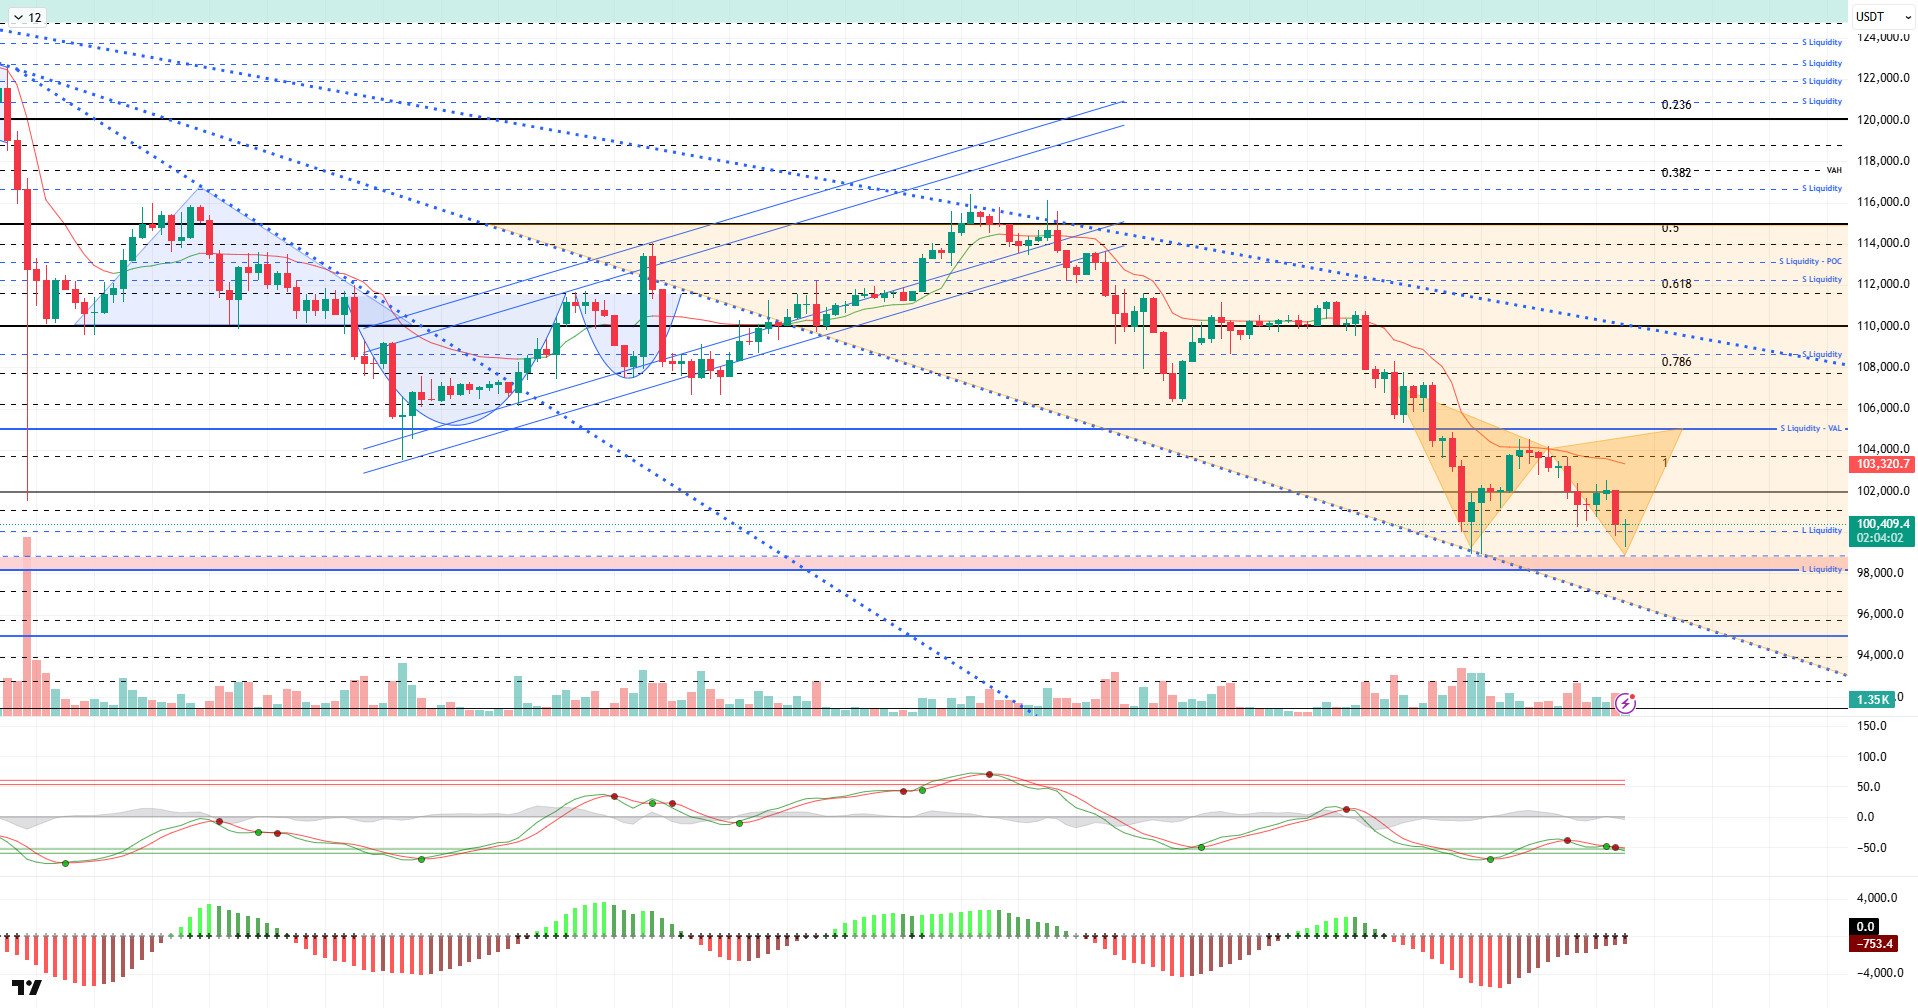
From a technical perspective, BTC continued its bearish outlook during the day, briefly losing six-figure levels. After recovering somewhat, the price continues to trade at the 100,300 level at the time of writing.
Technical indicators show an indecisive picture, with the Wave Trend (WT) Oscillator giving a buy signal in the oversold zone, while the Squeeze Momentum (SM) indicator’s histogram continues to struggle to gain strength after reaching maximum weakness in the negative zone.The Kaufman Moving Average (KAMA) is currently at $103,580, positioned above the price.
According to liquidation data, investors taking advantage of the decline have recorded intensity at the 98,000 level, while another intensity was liquidated at the 100,000 level with the latest decline. Conversely, the selling level is gaining intensity at $102,500–$103,500, while the $105,600 level emerges as another area of increased accumulation.
In summary, while the tariff dispute between the US and China is losing its significance in the equation, the prolonged government shutdown in the US and the Fed’s hawkish stance for its next meeting are emerging as factors putting pressure on the markets. On the technical side, although BTC occasionally records short-term gains, the market’s “fear” sentiment, low risk appetite, and short-term investor profile are leading to renewed selling pressure. In liquidity data, the dominance of the selling tier continues, but buyers are starting to reappear. In the coming period, we will monitor whether the price holds above the 100,000 reference level. If this level is lost, 98,000 will be monitored as both a liquidity and support area. In the event of a potential recovery, 101,800 will be monitored as the first resistance point.
Supports: 101,800 – 100,000 – 99,000
Resistances: 103,300 – 105,000 – 106,600
ETH/USDT
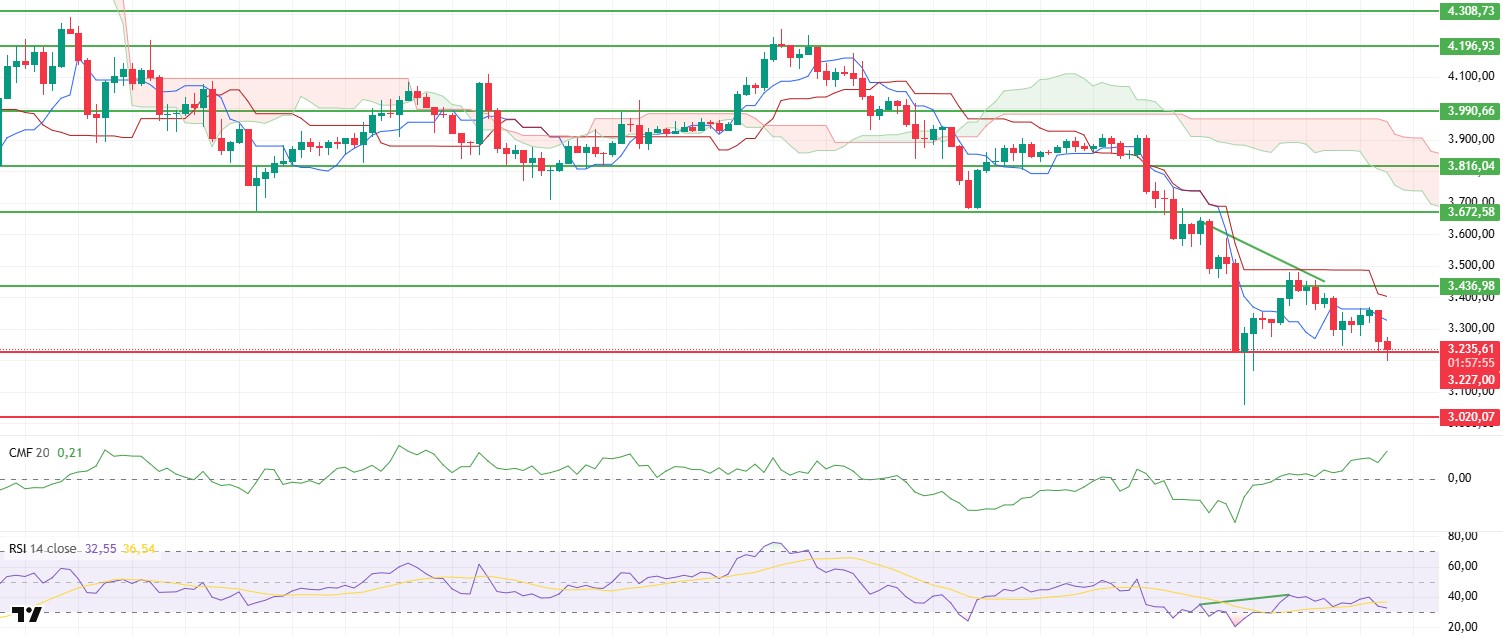
The ETH price fell below the $3,227 support level amid increased selling pressure during the day, but rebounded slightly from this level to rise to the $3,250 range. This weak recovery in the short term shows that buyers have not completely withdrawn from the market, but that selling pressure is still effective.
The Chaikin Money Flow (CMF) indicator remains in positive territory despite the decline. The CMF’s strong appearance reveals that liquidity inflows into the market continue and that sales are mostly driven by futures trading. This picture indicates that buying appetite is maintained despite short-term price pressure.
The Relative Strength Index (RSI) indicator has declined along with the price and is approaching the oversold zone. This structure indicates that market momentum has weakened and the short-term directional search has shifted downward. However, the RSI approaching the oversold zone also implies that technically, short-term rebound buying could occur.
According to the Ichimoku indicator, the price is still below the Tenkan and Kijun levels and cannot break out of the kumo cloud. This outlook confirms that the main trend remains negative and that upward attempts may encounter strong resistance.
Overall, the downtrend is expected to continue as long as the ETH price fails to break above the $3,436 level. However, regaining this level could break the current weak structure and trigger a new wave of upward movement towards the $3,672 region. The $3,227 level should be monitored as a critical support point in the short term.
Supports: 3,227 – 3,020 – 2,872
Resistances: 3,436 – 3,672 – 3,816
XRP/USDT
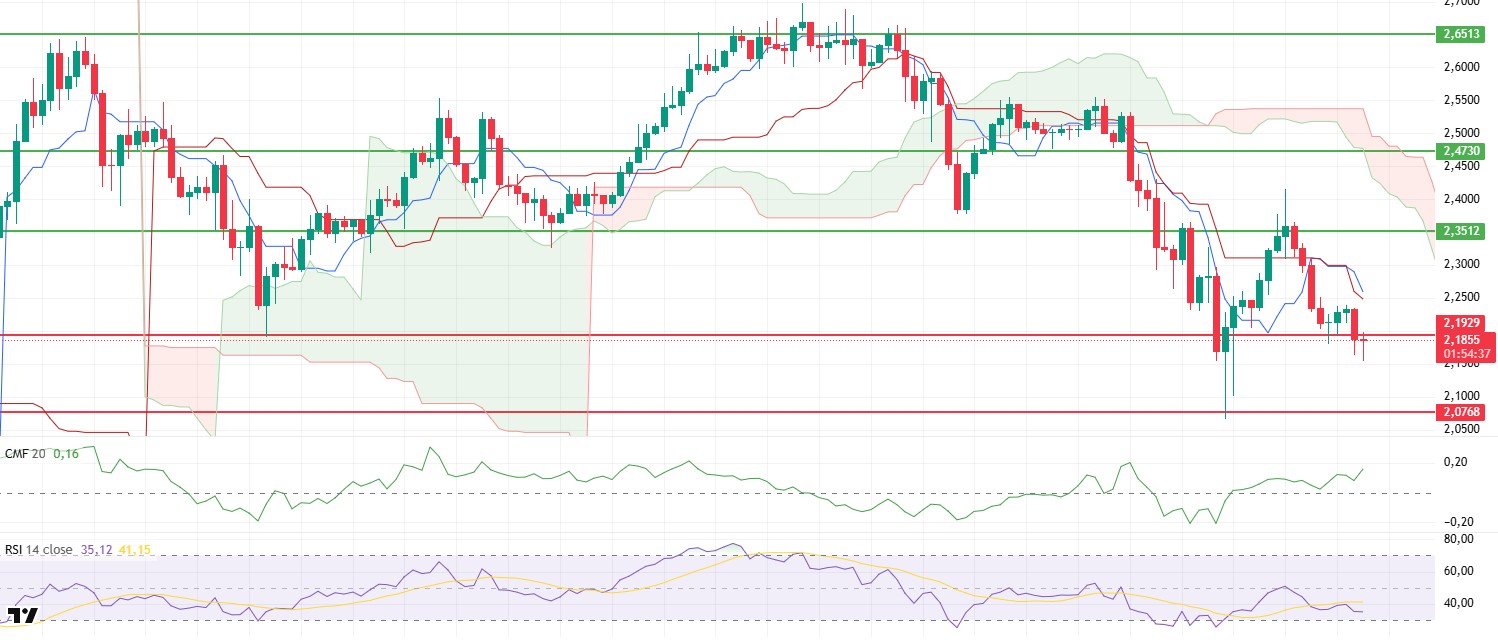
The XRP price lost its $2.19 support during the day and fell to the $2.15 level under selling pressure. However, with the reaction from this region, the price rebounded towards the support level. This short-term movement shows that buyers have not completely lost their influence in the market and that sales remain limited.
The Chaikin Money Flow (CMF) indicator continues to strengthen in positive territory despite the decline. This structure of the CMF indicates that liquidity inflows into the market continue and that sales are predominantly from futures. The weak capital outflows on the spot side show that the price retains its potential for recovery in the short term.
The Relative Strength Index (RSI) indicator has declined in line with price movements and is approaching the oversold zone. The weakening momentum reflects that the market is searching for direction in the short term and that pressure remains with sellers. However, the RSI’s proximity to the oversold zone also signals that technical rebound buying could come into play.
In the Ichimoku indicator, the price remaining below the Tenkan and Kijun levels and continuing to trade below the kumo cloud confirms that the overall trend is still negative. This outlook suggests that any attempts to rise may struggle against the cloud resistance.
If the XRP price manages to hold above the $2.19 support level, short-term rebound buying could gain momentum again. However, losing this level again could cause selling pressure to increase, pulling the price back to the $2.10 level. Breaking above $2.23 could strengthen the recovery trend.
Supports: $2.1929 – $2.0768 – $1.9092
Resistances: 2.3512 – 2.4730 – 2.6513
SOL/USDT
The SOL price showed a decline during the day. The asset tested the strong resistance level of $163.80 and experienced a pullback. However, it remained in the lower region of the downward trend that began on October 6. The price being far from the 50 EMA (Blue Line) and 200 EMA (Black Line) moving averages could strengthen the asset’s horizontal or upward movement. Currently testing the $150.67 level as support, the price could test the $138.73 level if it closes below this level. If the upward movement begins, it could test the 50 EMA (Blue Line) moving average.
On the 4-hour chart, it continues to be below the 50 EMA (Exponential Moving Average – Blue Line) and 200 EMA (Black Line). This indicates that it may be in a downtrend in the medium term. At the same time, the price being below both moving averages shows us that the asset is in a downward trend in the short term. The Chaikin Money Flow (CMF-20) is at a positive level. However, a decrease in money inflows could push the CMF into negative territory. The Relative Strength Index (RSI-14) has fallen to the lower level of the negative zone. At the same time, it is currently testing the support level of the downward trend that began on October 27. If it breaks through, the declines could deepen. In the event of an uptrend driven by macroeconomic data or positive news related to the Solana ecosystem, the $171.82 level stands out as a strong resistance point. If this level is broken upwards, the uptrend is expected to continue. In the event of pullbacks due to developments in the opposite direction or profit-taking, the $144.35 level could be tested. A decline to these support levels could increase buying momentum, presenting a potential opportunity for an upward move.
Supports: 150.67 – 144.35 – 138.73
Resistances: 163.80 – 171.82 – 181.75

DOGE/USDT
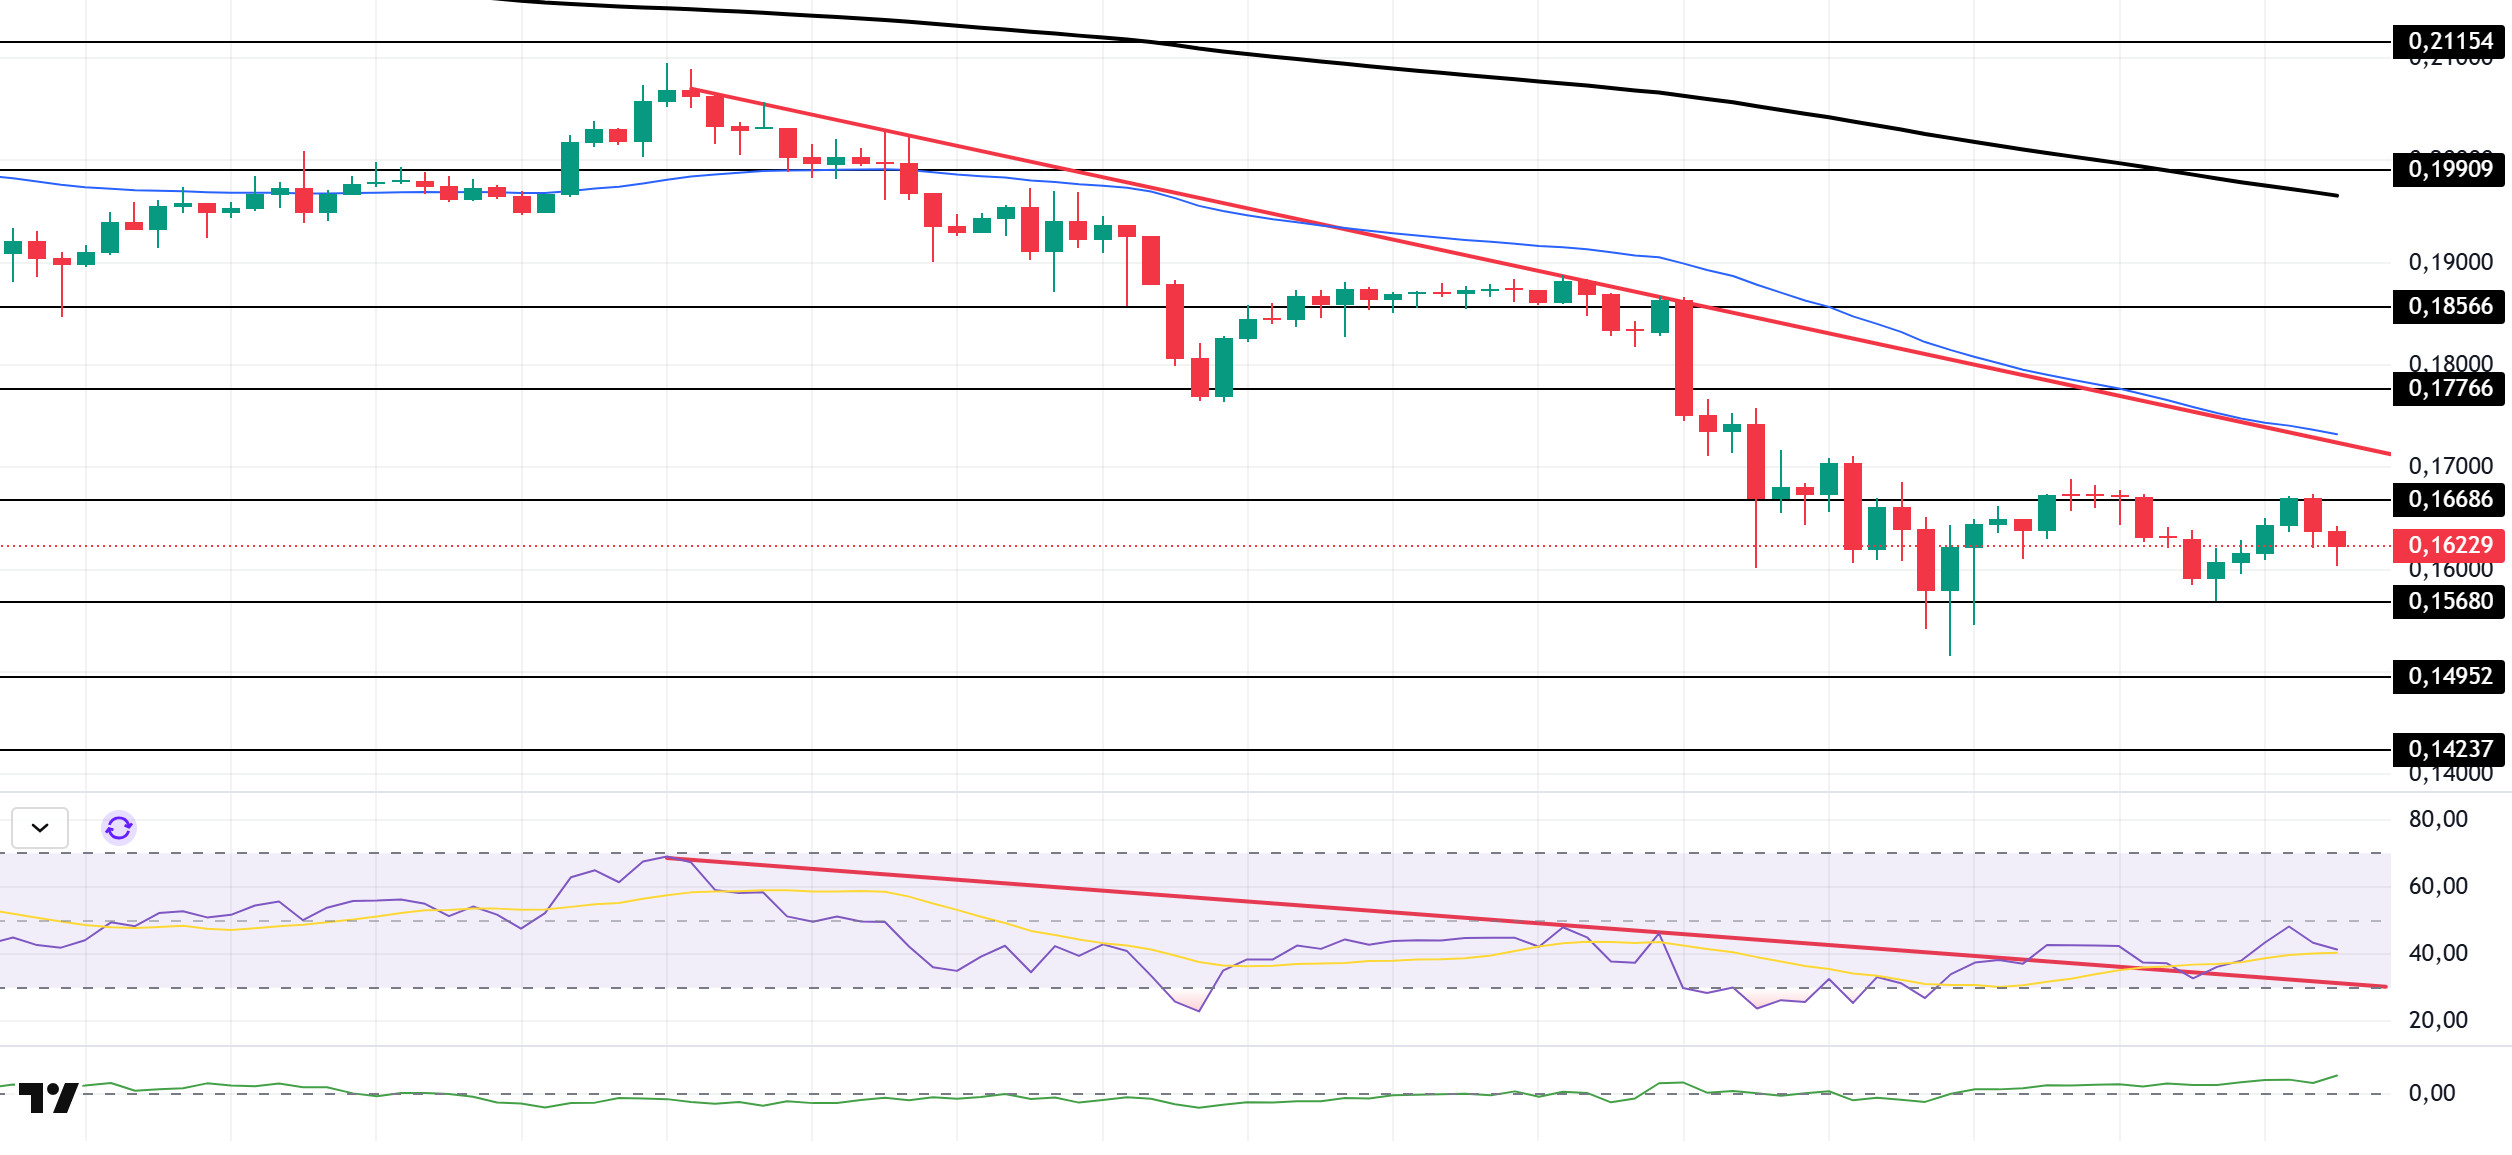
The DOGE price retreated slightly during the day. The asset remained below the downward trend that began on October 27. The price tested the $0.16686 level but failed to break through and retreated. On the other hand, the double bottom formation could bring a price increase. As of now, if the pullback continues, it may test the $0.14952 level. If it experiences an uptrend, it may test the downward trend line and the 50 EMA (Blue Line) moving average as resistance.
On the 4-hour chart, the 50 EMA (Exponential Moving Average – Blue Line) remained below the 200 EMA (Black Line). This indicates that a downtrend may begin in the medium term. The price being below both moving averages shows that the price is trending downward in the short term. The Chaikin Money Flow (CMF-20) has started to move into positive territory near the neutral zone. Additionally, a decrease in money inflows could push the CMF into negative territory. The Relative Strength Index (RSI-14) experienced a pullback towards the middle of the negative zone. At the same time, it remained above the downward trend that began on October 27. In the event of an uptrend driven by political developments, macroeconomic data, or positive news flow in the DOGE ecosystem, the $0.17766 level stands out as a strong resistance zone. Conversely, in the event of negative news flow, the $0.14237 level could be triggered. A decline to these levels could increase momentum and initiate a new wave of growth.
Supports: 0.15680 – 0.14952 – 0.14237
Resistances: 0.16686 – 0.17766 – 0.18566
ADA/USDT
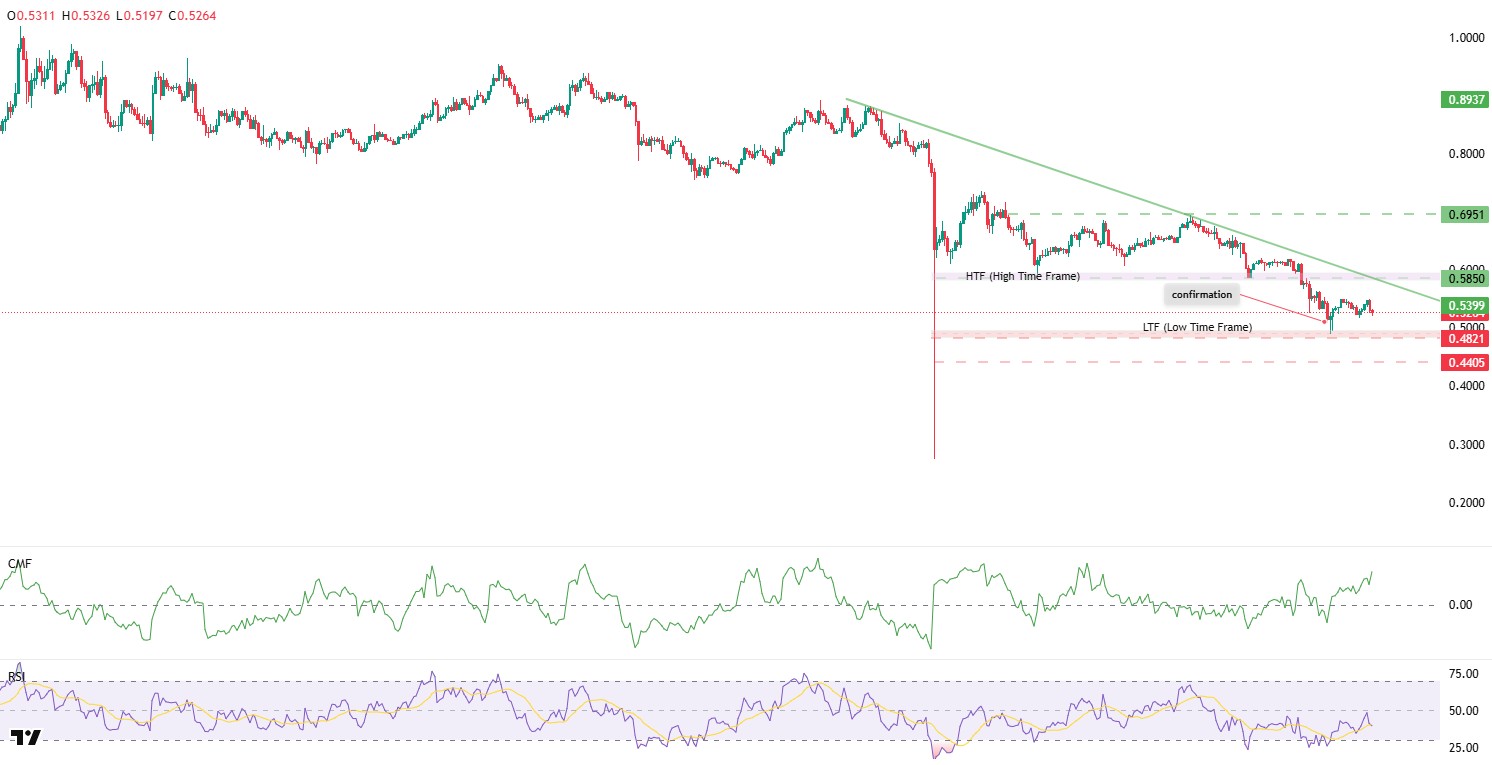
As of today, the Bitcoin price fell below $100,000, completing its retest movement. During the day, statements by White House Advisor Bessent and Trump caused volatility to narrow, leading to increased selling pressure. ADA started the second half of the day with a decline and continued at around $0.5399. 402,000 ADA is waiting to be liquidated at the $0.5481 level. In this scenario, the price intersects with the confirmation zone, which is the entry zone of the lower time frame (LTF), at the $0.4821 level. This technically increases the importance of the zone. In a more severe correction scenario, the $0.4407 level can be tracked as the main support level. However, confirmation of this movement should be monitored in terms of volume and market structure.
The Relative Strength Index (RSI-14) has fallen to 38 levels, signaling a decline along with the Chaikin Money Flow (CMF-20). Limited growth in money inflows may keep the CMF in positive territory. If the price rises during the day and re-enters the Fibonacci level of 0.5850, the resistance point of 0.6951 could emerge as an important level to watch. In this case, it could signal that the upward trend may continue in the medium term.
If there is an increase due to macroeconomic data or positive news related to the Cardano ecosystem, the $0.7437 level stands out as a strong resistance point. If this level is broken upwards, the increase is expected to continue.
Supports: 0.3896 – 0.4455 – 0.4883
Resistances: 0.6951 – 0.7437 – 0.7985
Legal Notice
The investment information, comments, and recommendations contained herein do not constitute investment advice. Investment advisory services are provided individually by authorized institutions taking into account the risk and return preferences of individuals. The comments and recommendations contained herein are of a general nature. These recommendations may not be suitable for your financial situation and risk and return preferences. Therefore, making an investment decision based solely on the information contained herein may not produce results in line with your expectations.


