
Technical Analysis
BTC/USDT
On the Fed front, Daly left the door open for interest rate cuts, while market expectations shaped up towards a cautious move at the December meeting. Strategy’s purchase of 487 BTC worth $49.9 million and BlackRock’s large-scale transfers to a centralized exchange showed that institutional investors’ interest in Bitcoin continues. Meanwhile, the Bank of England’s proposed limit on stablecoin holdings and Brazil’s update to its crypto regulations signaled that digital asset integration into the global financial system will be subject to a stricter regulatory framework. On the mining front, companies like Bitdeer and Bitplanet continued their production and acquisition moves.
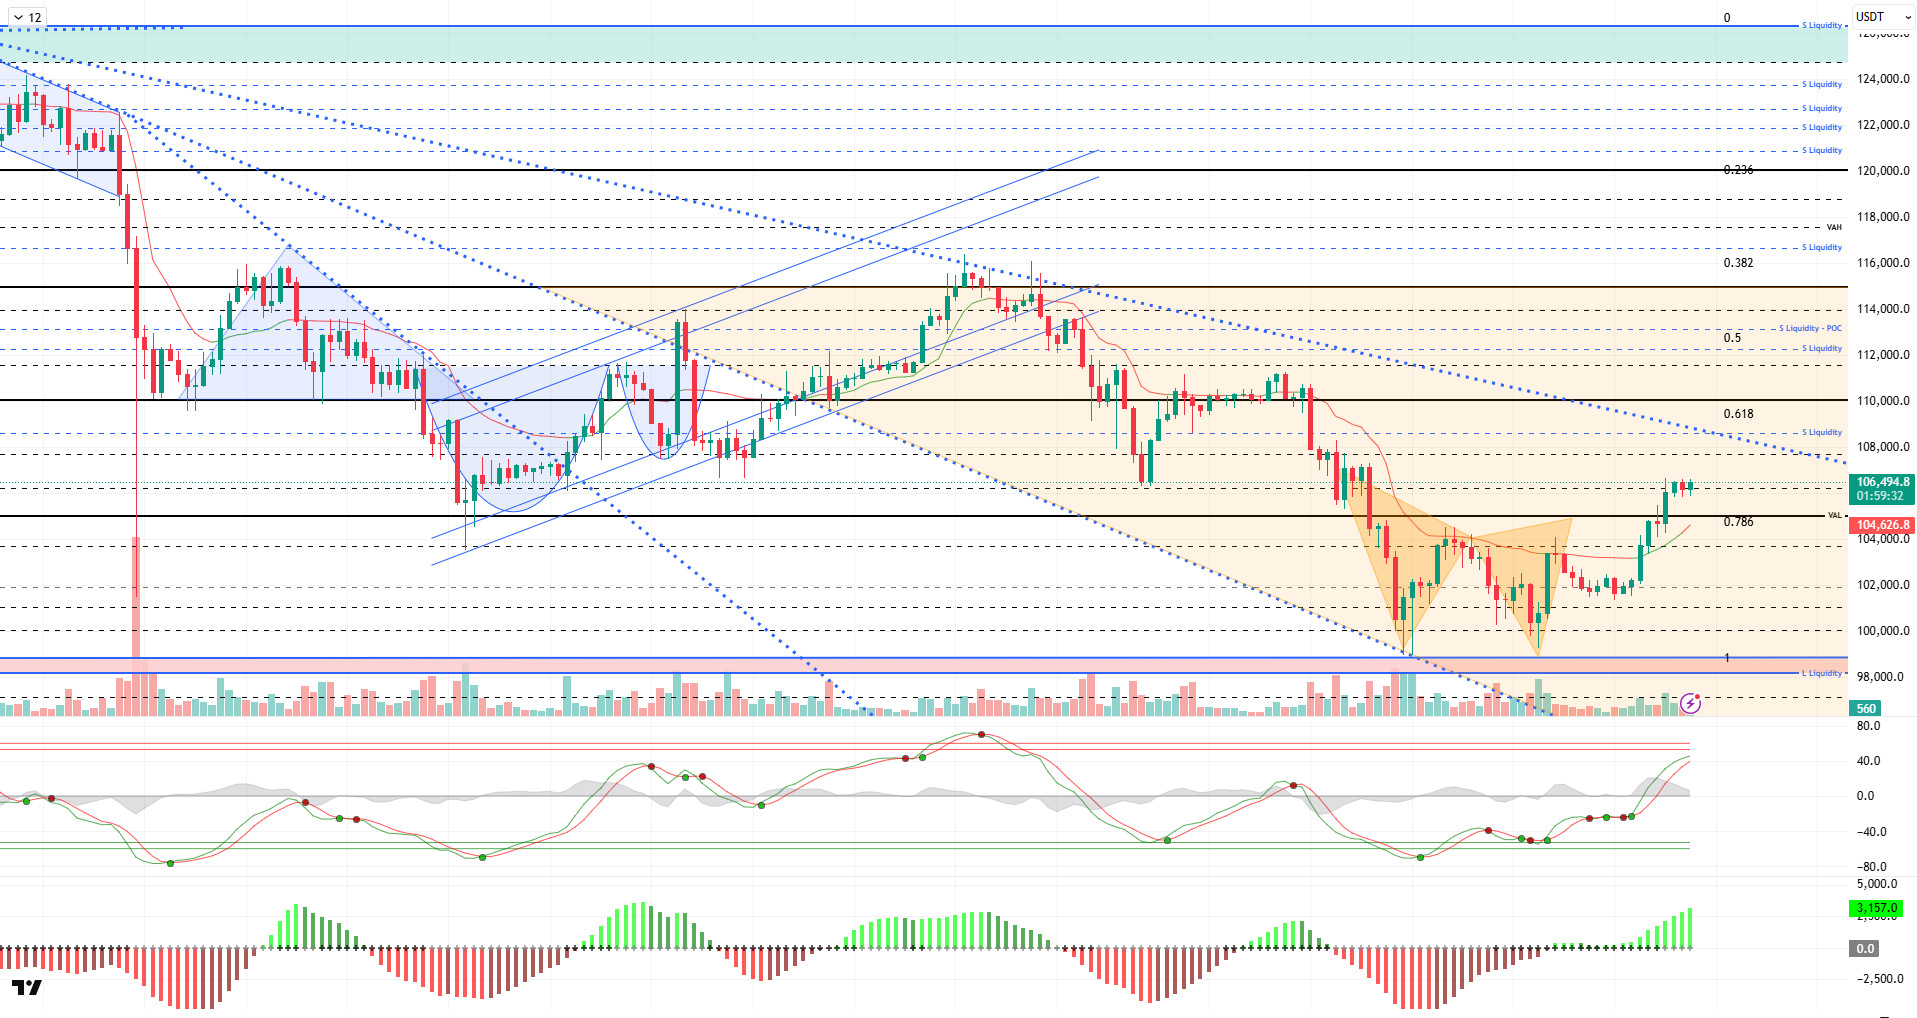
From a technical perspective, BTC continues to maintain its gains compared to the previous analysis. The price, which settled above the 106,000 level, is attempting to regain upward momentum. In a new upward movement, we will follow the price testing the descending trend line. If this level is passed, the fibo 0.618 level will come into view.
Technical indicators show that the Wave Trend (WT) Oscillator formed an uptrend parallel to the buy signal it gave in the oversold zone and reached the overbought zone. The Squeeze Momentum (SM) indicator’s histogram successfully regained strength after reaching maximum weakness in the negative zone, confirming the uptrend. The Kaufman Moving Average (KAMA) is currently at $104,600, positioned below the price.
According to liquidation data, investors who saw the decline as an opportunity recorded a concentration at the 98,000 level, while another concentration was liquidated at the 100,000 level with the latest decline. In contrast, the selling level was liquidated at 102,500 – 103,500 and 105,600. Another selling level has accumulated at the 112,000 level.
In summary, the Senate agreement on the US government reopening stood out as an optimistic development. While uncertainty about the Fed’s interest rate cuts persists, Trump’s statements on tariff revenues have reignited debate. In liquidity data, the dominance of the selling tier was one of the main factors pushing the price up.Technically, if the price holds above the 105,000 level and daily closes occur, the next reference point of 110,000 will come into focus. On the other hand, in the event of potential selling pressure, 105,000 will continue to be monitored as a critical support level.
Supports: 105,000 – 103,300 – 101,800
Resistances: 106,600 – 107,400 – 108,800
ETH/USDT
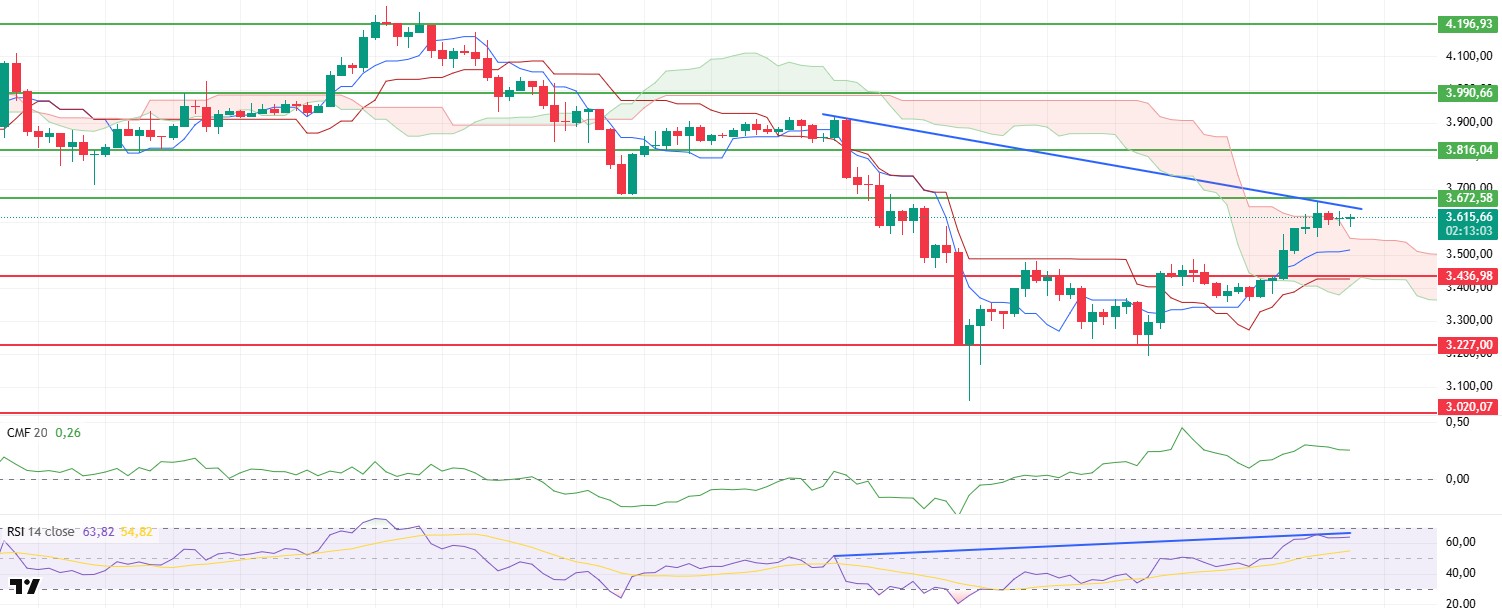
The ETH price retreated to $3,589 during the day but managed to rise back above the $3,600 level thanks to rebound buying from this area. Despite increased intraday volatility, the price holding above this critical threshold indicates that buyers remain active and are resisting selling pressure. However, upward movements appear limited due to weakening momentum.
The Chaikin Money Flow (CMF) indicator remains in positive territory, confirming continued liquidity inflows into the market. This structure indicates that institutional and spot demand persists even if prices pull back, and that declines remain limited for now. However, the CMF’s short-term horizontal trend suggests that buying momentum may weaken somewhat.
The Relative Strength Index (RSI) indicator is attempting to stabilize following the negative divergence observed in the morning hours. With the RSI pulling back slightly from its overbought threshold, a short-term cooling in momentum is being observed. This scenario suggests that the price may remain stuck in the $3,600 range for a while and that the market continues to search for direction.
In the Ichimoku indicator, the price remaining above the Tenkan and Kijun levels indicates that the overall positive structure continues. The price breaking above the upper band of the kumo cloud also supports this view.
Overall, ETH continues to maintain its upward trend despite intraday pullbacks. The $3,589 level stands out as short-term support, and the price holding above this level supports the positive outlook. However, if the $3,672 level is not breached again, the upward movement may weaken, and the possibility of a gradual correction down to the $3,508 Tenkan level may increase. A sustained break above $3,672, on the other hand, could re-support the bullish scenario and drive the price towards the $3,760 region.
Supports: 3,436 – 3,227 – 3,020
Resistances: 3,672 – 3,816 – 3,990
XRP/USDT
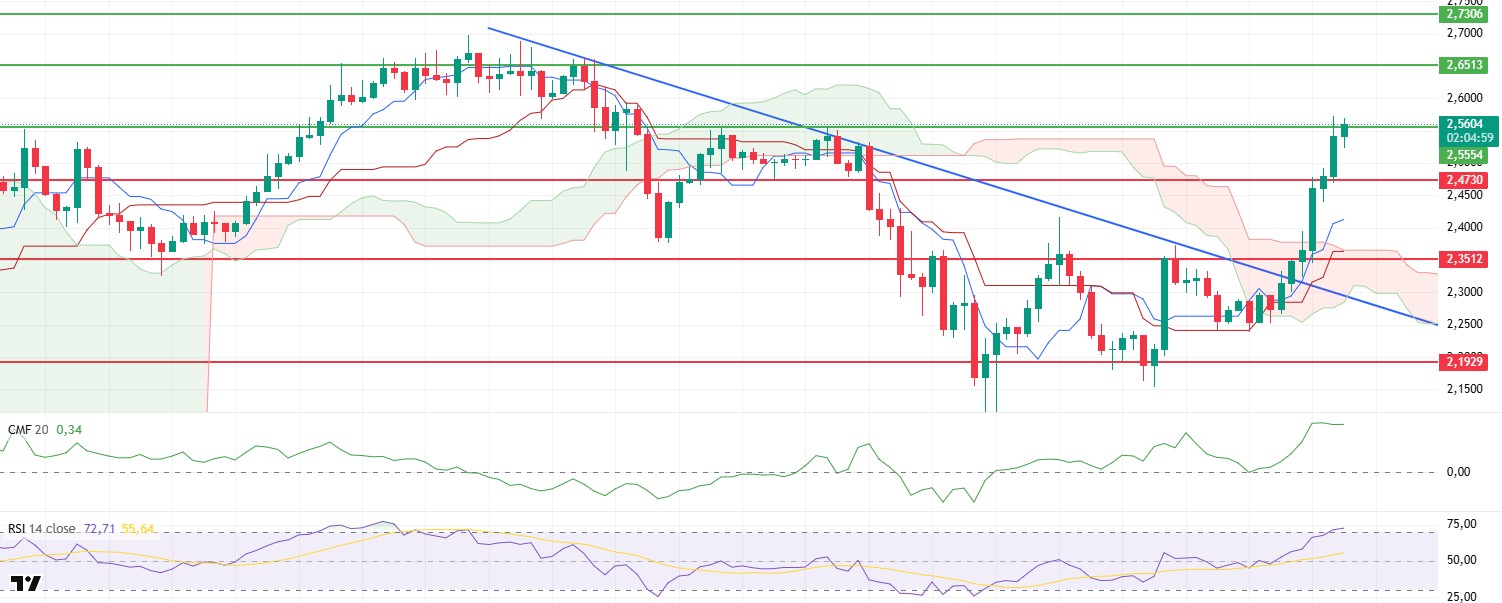
The XRP price maintained its positive outlook during the day, continuing its upward trend and managing to break through the significant resistance level of $2.55. The momentum that strengthened in the morning led to buyers increasing their dominance in the market throughout the day. The price managing to stay above this threshold indicates that the upward trend has solidified and that a new momentum area has formed in the short term.
The Chaikin Money Flow (CMF) indicator continued its upward trend during the day, gaining strength in positive territory. The increase in liquidity inflows indicates that the rise is supported by the spot market and that buying remains strong. This outlook confirms that the market is progressing with a healthy capital flow and that the upward trend is taking shape on solid foundations.
The Relative Strength Index (RSI) indicator remains in the overbought zone. Despite the intraday rise, the RSI stabilizing at high levels indicates that buyers are still strong and the market is maintaining its momentum. However, the possibility of a slight cooling off at these levels in the short term should not be overlooked.
The Ichimoku indicator confirms that the uptrend is technically supported, as the price continues to stay above the Tenkan and Kijun levels. With the price remaining above the Kumo cloud, the medium-term trend reversal appears to be complete. This technical structure strengthens the potential for the upward movement to expand.
In general, the XRP price can maintain its upward trend as long as it stays above the $2.55 level. Limited profit-taking seen during the day could cause a short-term correction down to the $2.47 level, but the current outlook remains positive. If the upward movement continues, the next target is likely to be the $2.65 region.
Supports: 2.4730 – 2.3512 – 2.1929
Resistances: 2.5554 – 2.6513 – 2.7306
SOL/USDT
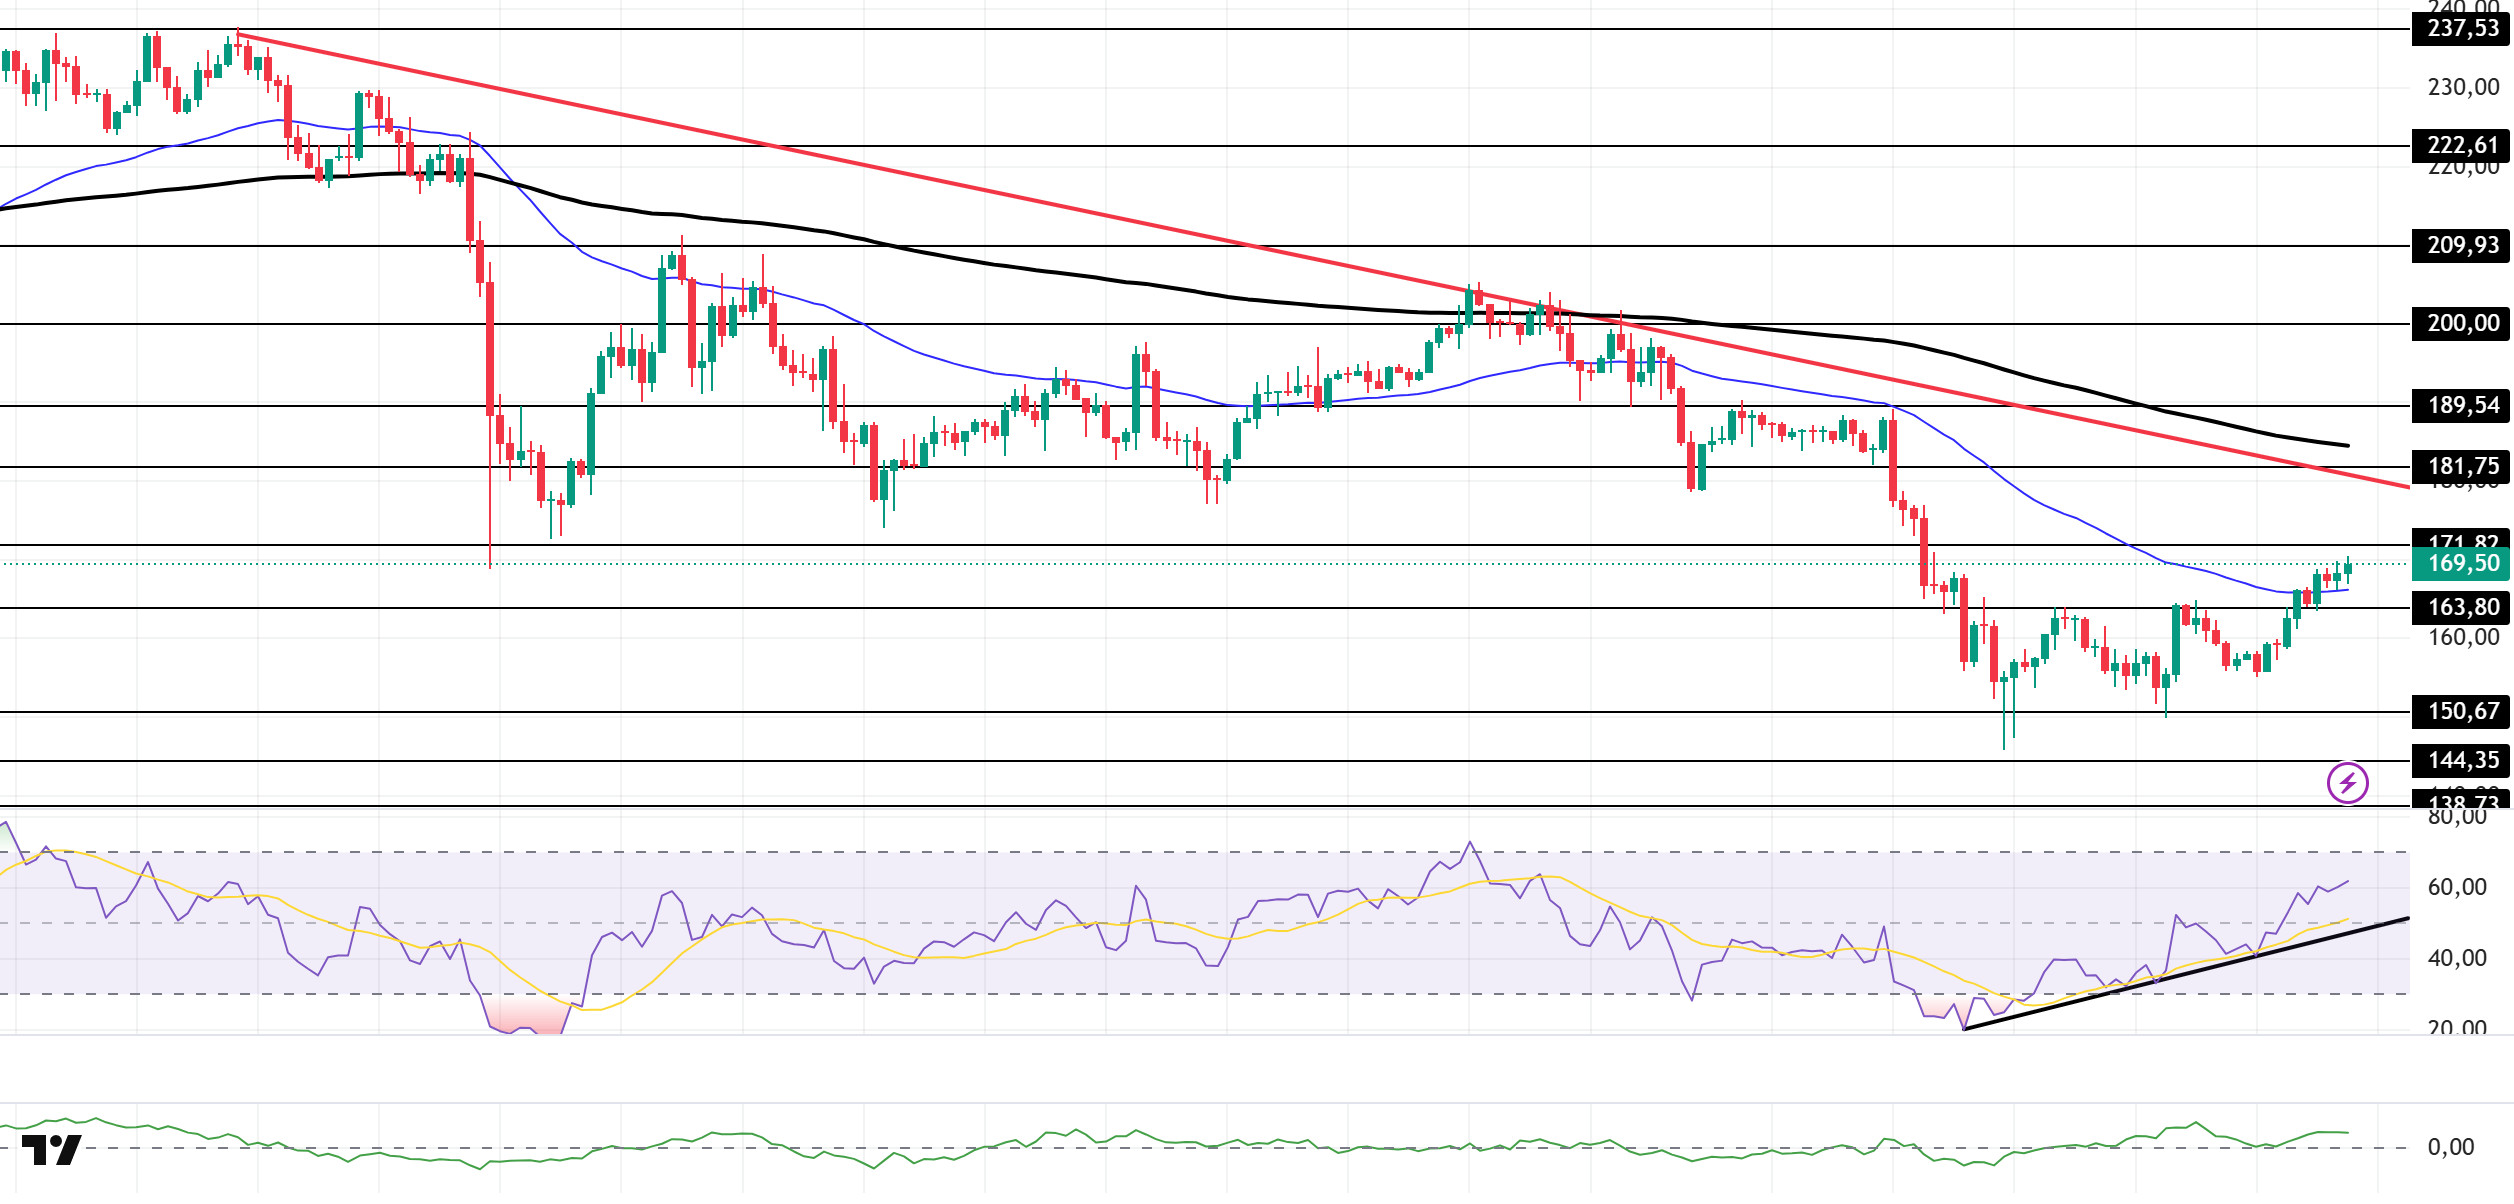
The SOL price traded sideways during the day. The asset tested and broke through the strong resistance level of $163.80 and the 50 EMA (Blue Line) moving average, continuing its upward movement. However, it remained in the lower region of the descending line that began on October 6. Currently trading above the 50 EMA moving average, the price could test the descending trend line as resistance if the upward movement continues. In the event of a pullback, it could track the $163.80 level.
The price remained below the 50 EMA (Exponential Moving Average – Blue Line) and 200 EMA (Black Line) on the 4-hour chart. This indicates a potential downtrend in the medium term. At the same time, the price being between both moving averages shows us that the asset is in a decision phase in the short term. The Chaikin Money Flow (CMF-20) is at a positive level. However, a decrease in cash inflows could push the CMF into negative territory. The Relative Strength Index (RSI-14) remained in the middle of the positive zone. It also continued to be in the upper region of the upward trend that began on November 4. These indicate increased buying pressure. If there is an uptrend due to macroeconomic data or positive news related to the Solana ecosystem, the $181.75 level stands out as a strong resistance point. If this level is broken upwards, the uptrend is expected to continue. If there are pullbacks due to developments in the opposite direction or profit-taking, the $150.67 level could be tested. A decline to these support levels could increase buying momentum, presenting a potential opportunity for an upward move.
Supports: 163.80 – 150.67 – 144.35
Resistances: 171.82 – 181.75 – 189.54
DOGE/USDT
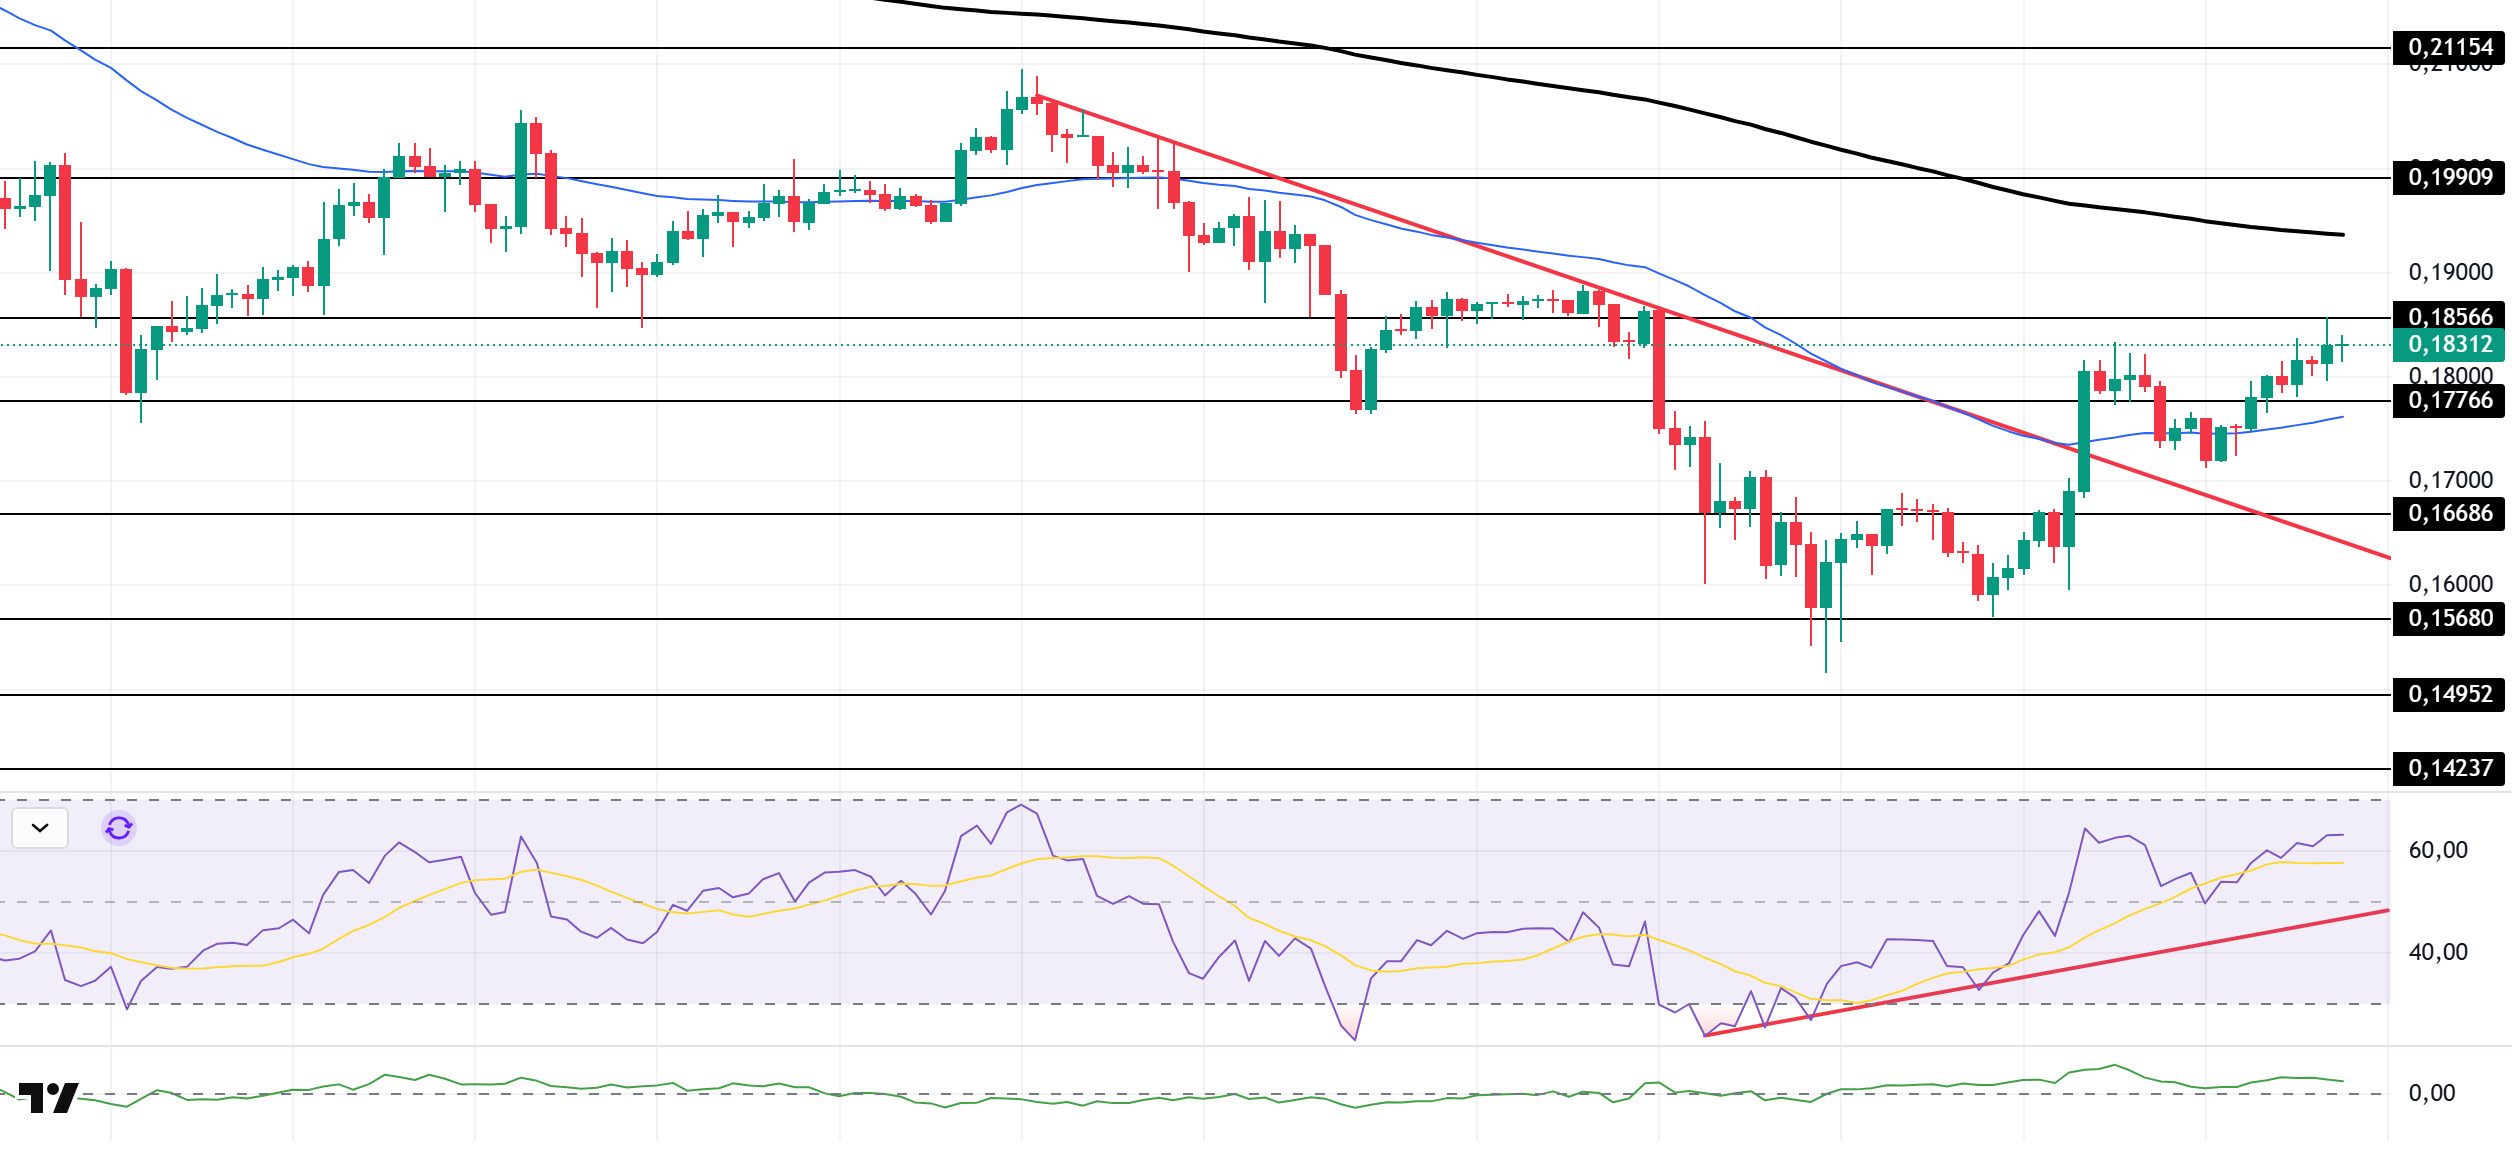
The DOGE price experienced a slight increase during the day. The asset broke through the downward trend that began on October 27 with a strong upward candle and moved above it. Continuing its rise with support from the 50 EMA (Blue Line) moving average, the price tested the strong resistance level of $0.18566 and experienced a slight pullback. If the upward trend continues, it may test the 200 EMA (Black Line) moving average as resistance. In the event of a pullback, it may retest the 50 EMA moving average.
On the 4-hour chart, the 50 EMA (Exponential Moving Average – Blue Line) remained below the 200 EMA (Black Line). This indicates that a downtrend may begin in the medium term. The price being between the two moving averages indicates that the price is in a decision phase in the short term. The Chaikin Money Flow (CMF-20) continued to be in the positive zone, close to the neutral zone. Additionally, a decrease in money inflows could push the CMF into negative territory. The Relative Strength Index (RSI-14) maintained its position in the middle of the positive zone. It also remained above the upward trend that began on November 3. These factors signaled buying pressure. In the event of potential increases driven by political developments, macroeconomic data, or positive news flow within the DOGE ecosystem, the $0.19909 level stands out as a strong resistance zone. Conversely, in the event of negative news flow, the $0.16686 level could be triggered. A decline to these levels could increase momentum and initiate a new wave of growth.
Supports: $0.17766 – $0.16686 – $0.15680
Resistances: 0.18566 – 0.19909 – 0.21154
LTC/USDT
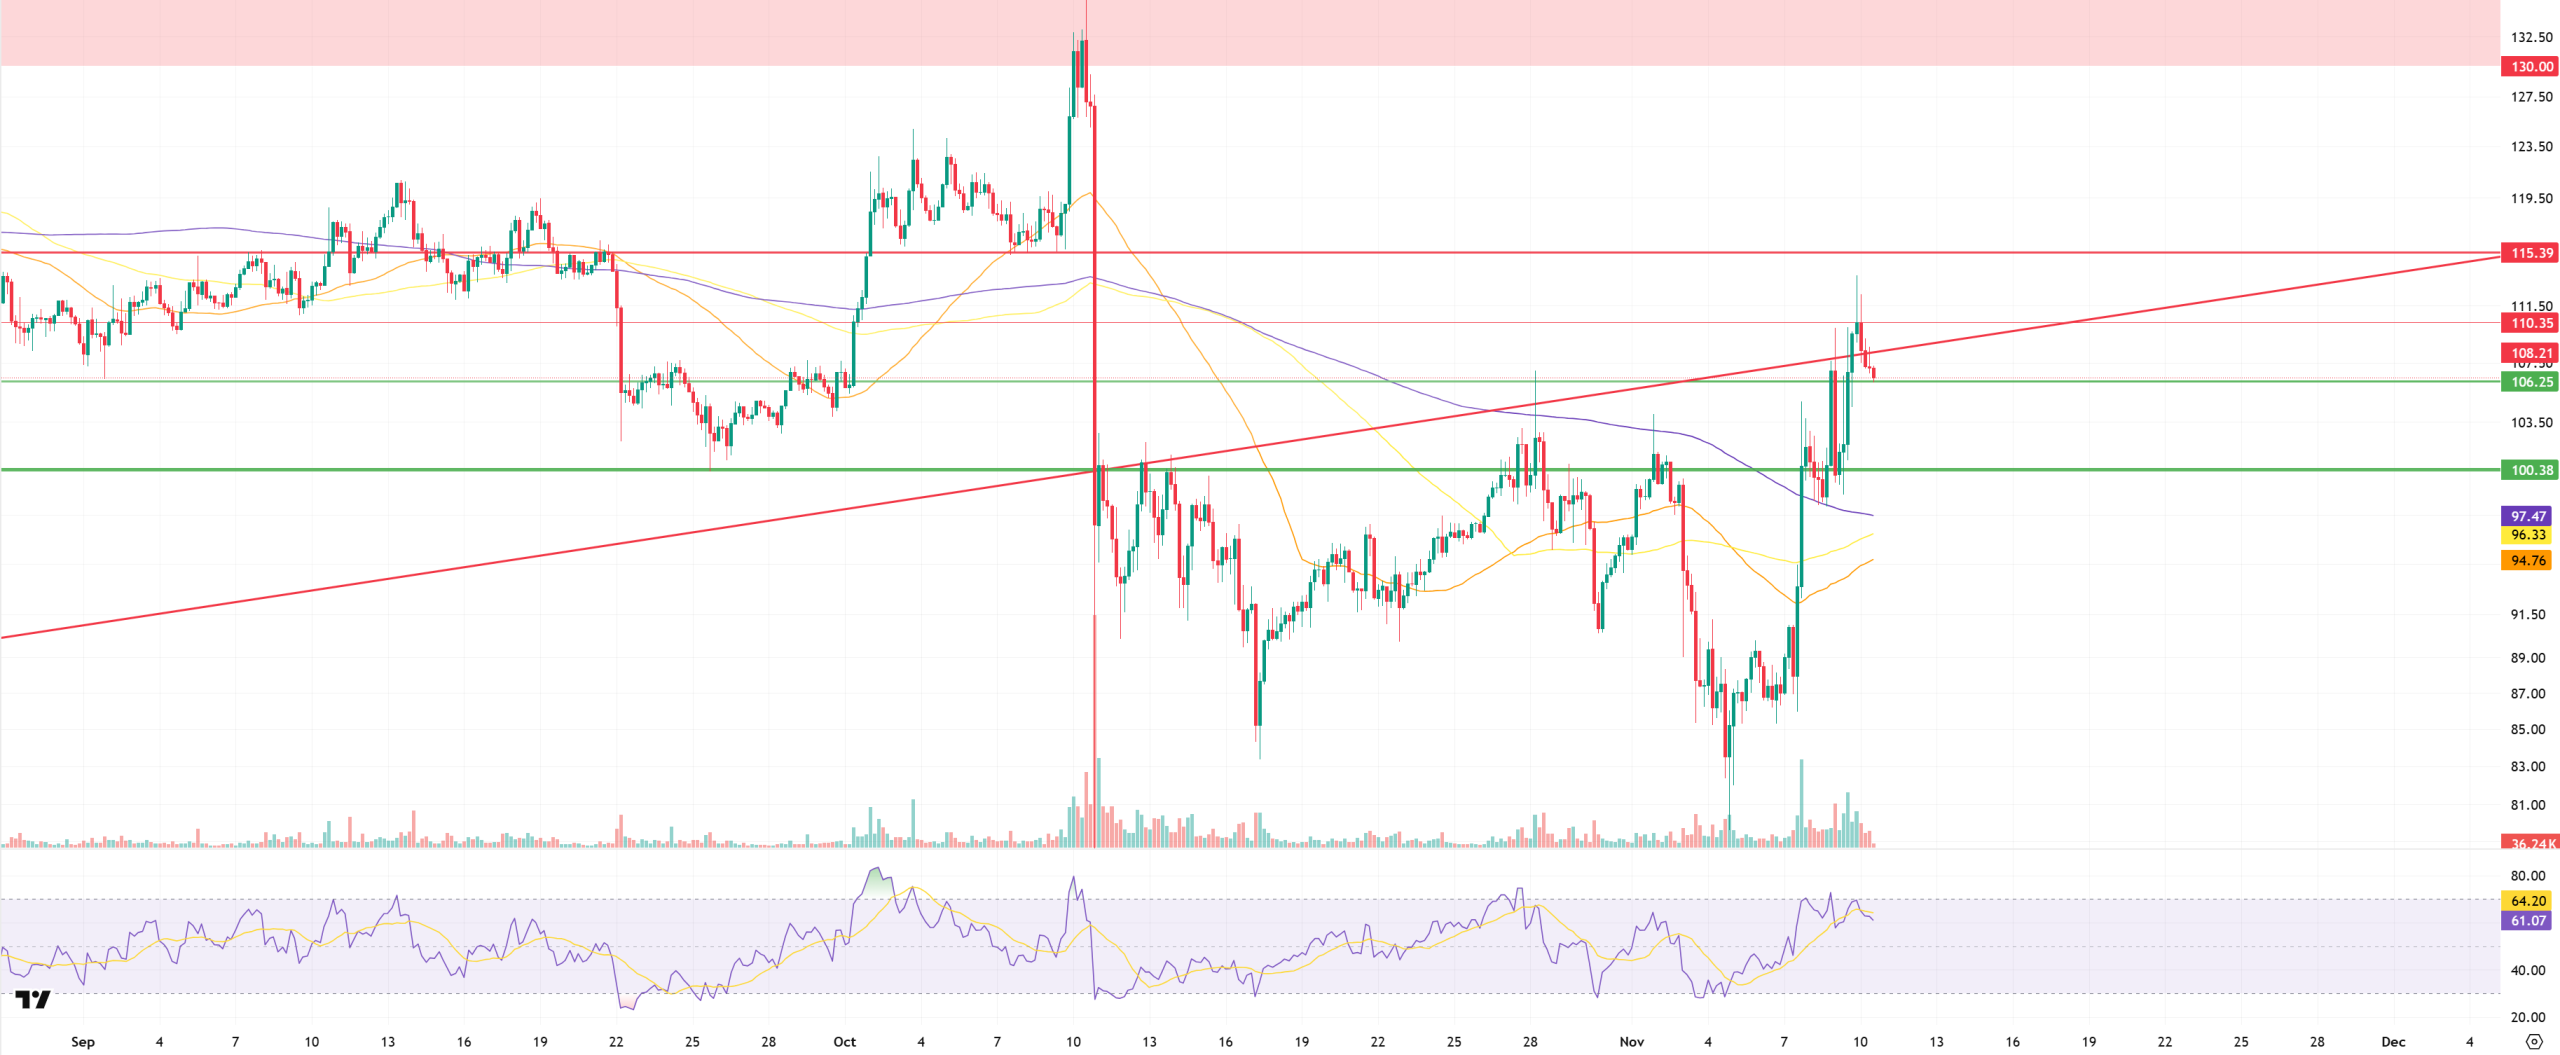
Litecoin (LTC) lost 3.4% against USDT in the first half of the day and recorded a 4.37% decline compared to Bitcoin. On the futures side, the long/short position ratio opened in the last 24 hours being at 0.9608 indicates that derivative market participants continue to have downward expectations. Funding rates continue to move at neutral-negative levels. This picture indicates that investors expect the decline seen in the derivatives markets in the first half of the day to continue for the remainder of the day.
From a technical perspective, examining Litecoin’s (LTC) 4-hour USDT pair chart reveals that the price continues to trade above all moving averages but below the rising trend line. While this situation, combined with a significant increase in short positions in the derivatives market, partially strengthens expectations of a decline, it also indicates that upward movements are possible. It is important for investors to be cautious under these conditions and be prepared for possible breakouts. If an upward movement occurs, the first strong resistance level will be the rising trend’s lower band, currently at $108.21. Breaking through this level could be an important signal for the price to rise further. The next important resistance point will be the horizontal resistance at $110.35. This level stands out as another critical zone where Litecoin’s price movement could stall. If the price rises to $110.35, it is likely to consolidate here or face selling pressure. The $115.39 level has the potential to be the local high for the day. This level could mark the highest price point following a sharp rise and would be a significant resistance zone in the event of potential profit-taking or a weakening of the uptrend.
In line with expectations, the $106.25 level stands out as a critical zone where the price could find support in the first instance. At this level, short-term buyers may step in, and the price could rebound from this zone. However, if the price falls below this level, the $100.38 level could come into play as a stronger support. This level is a very critical zone for Litecoin, and a close here could signal a deeper decline. Another factor to watch for in downward movements is the narrowing area formed by the 200, 100, and 50-period moving averages (purple, yellow, and orange lines). These three moving averages could form a strong support zone if the price approaches this area ( ). The lowest point of these three averages is around $94.78, and this level is an important support level that should be closely monitored as it has the potential to be the lowest point of a possible decline.
Supports: 106.25 – 100.38 – 94.78
Resistances: 108.21 – 110.35 – 115.39
BNB/USDT
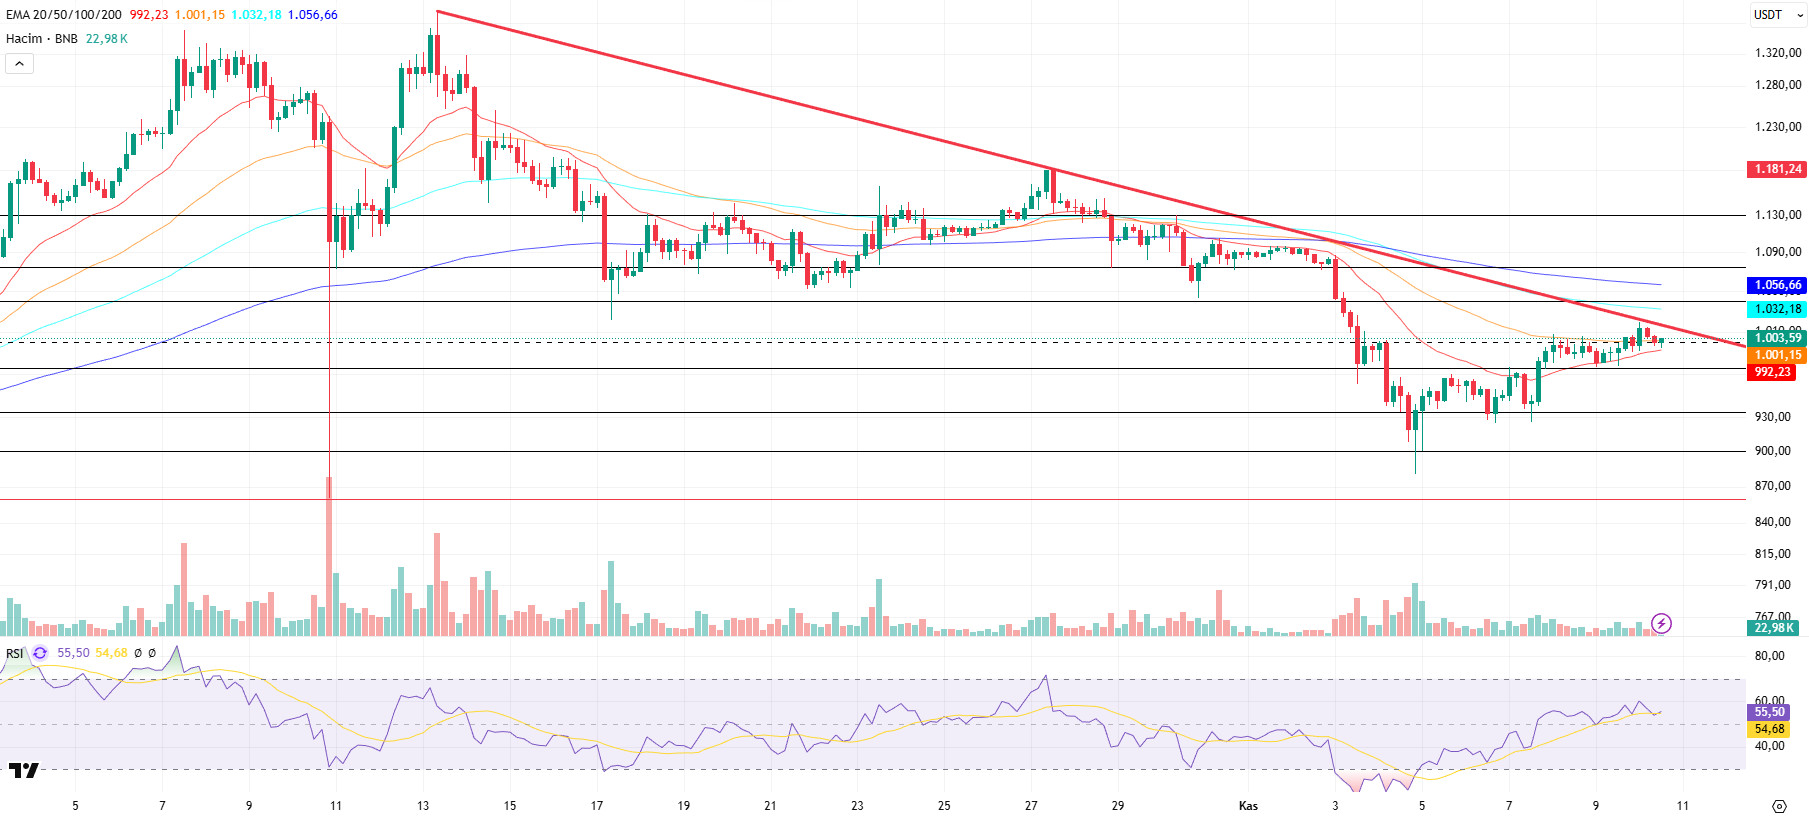
From a technical perspective, the correction that began after the all-time high (ATH) resulted in a pullback to the $900 support zone identified in previous technical analyses. After seeking support above these levels for a while, the asset ended its downward momentum with the new candles that formed and turned its direction upward again. With this rise, the price showed positive acceleration up to the falling trend zone.
Currently, BNB/USDT has broken through the psychological price level of $1,100, showing a positive outlook, but it has encountered resistance below the downtrend line, indicating that it is searching for direction.
Technical indicators for BNB, currently trading in the $975–1,040 range, suggest that the positive trading volume observed in recent rallies is supporting the upward momentum. Additionally, the Relative Strength Index (RSI) indicator has risen above the 50 level due to recent buying pressure, strengthening its positive outlook with support from this level.
Based on the current technical picture, if buying appetite is maintained and market momentum recovers, BNB is expected to break above the falling trend line in the first stage. If the downward trend is broken upward and sustainability is achieved at this level, the price is likely to retest the $1,040 resistance level. If this level is exceeded, it is technically possible for the price to rise towards the $1,075 and $1,130 levels, respectively.
On the other hand, if selling pressure increases again, the price is expected to test the psychological support level of $975. If this level is broken downward, the price may retreat to the support zones of $935 and $900, respectively.
Supports: 975 – 935 – 900
Resistances: 1,040 – 1,075 – 1,130
ADA/USDT
As of today, the Bitcoin price has surpassed $106,000, rising in line with expectations regarding the US government reopening. FED member Daly’s statements during the day may cause increased pressure on liquidity along with profit-taking. ADA started the second half of the day with an increase and continued at $0.5964 levels. 76,590 ADA is waiting for liquidation at $0.6079 levels.
Although the Relative Strength Index (RSI-14) rose to 63 levels, the Chaikin Money Flow (CMF-20) is giving a downward signal. This negative correlation may be a sign of limited growth in cash inflows and may keep the CMF in negative territory. If the price approaches the $0.6653 level again with possible intraday gains, the resistance level of $0.6951 could emerge as an important level to watch. In this case, it could signal that the upward trend may continue in the medium term. If there is an increase due to macroeconomic data or positive news related to the Cardano ecosystem, the $0.7437 level stands out as a strong resistance point. If this level is broken upwards, the rise is expected to continue.
In the opposite scenario, the price may fall again and intersect with the confirmation zone, which is the entry zone of the low time frame (LTF), and the $0.4821 level. This technically increases the importance of the zone. In a more severe correction scenario, the $0.4407 level can be monitored as the main support level. However, confirmation of this movement should be monitored in terms of volume and market structure.
Supports: 0.3896 – 0.4455 – 0.4883
Resistances: 0.6951 – 0.7437 – 0.7985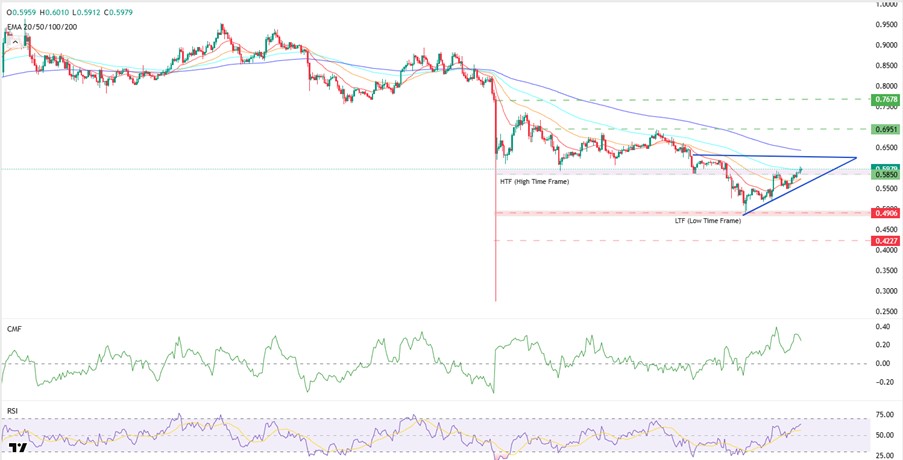
Legal Notice
The investment information, comments, and recommendations contained herein do not constitute investment advice. Investment advisory services are provided individually by authorized institutions taking into account the risk and return preferences of individuals. The comments and recommendations contained herein are of a general nature. These recommendations may not be suitable for your financial situation and risk and return preferences. Therefore, making an investment decision based solely on the information contained herein may not produce results in line with your expectations.


