
Weekly Ethereum Onchain Report
Active Addresses
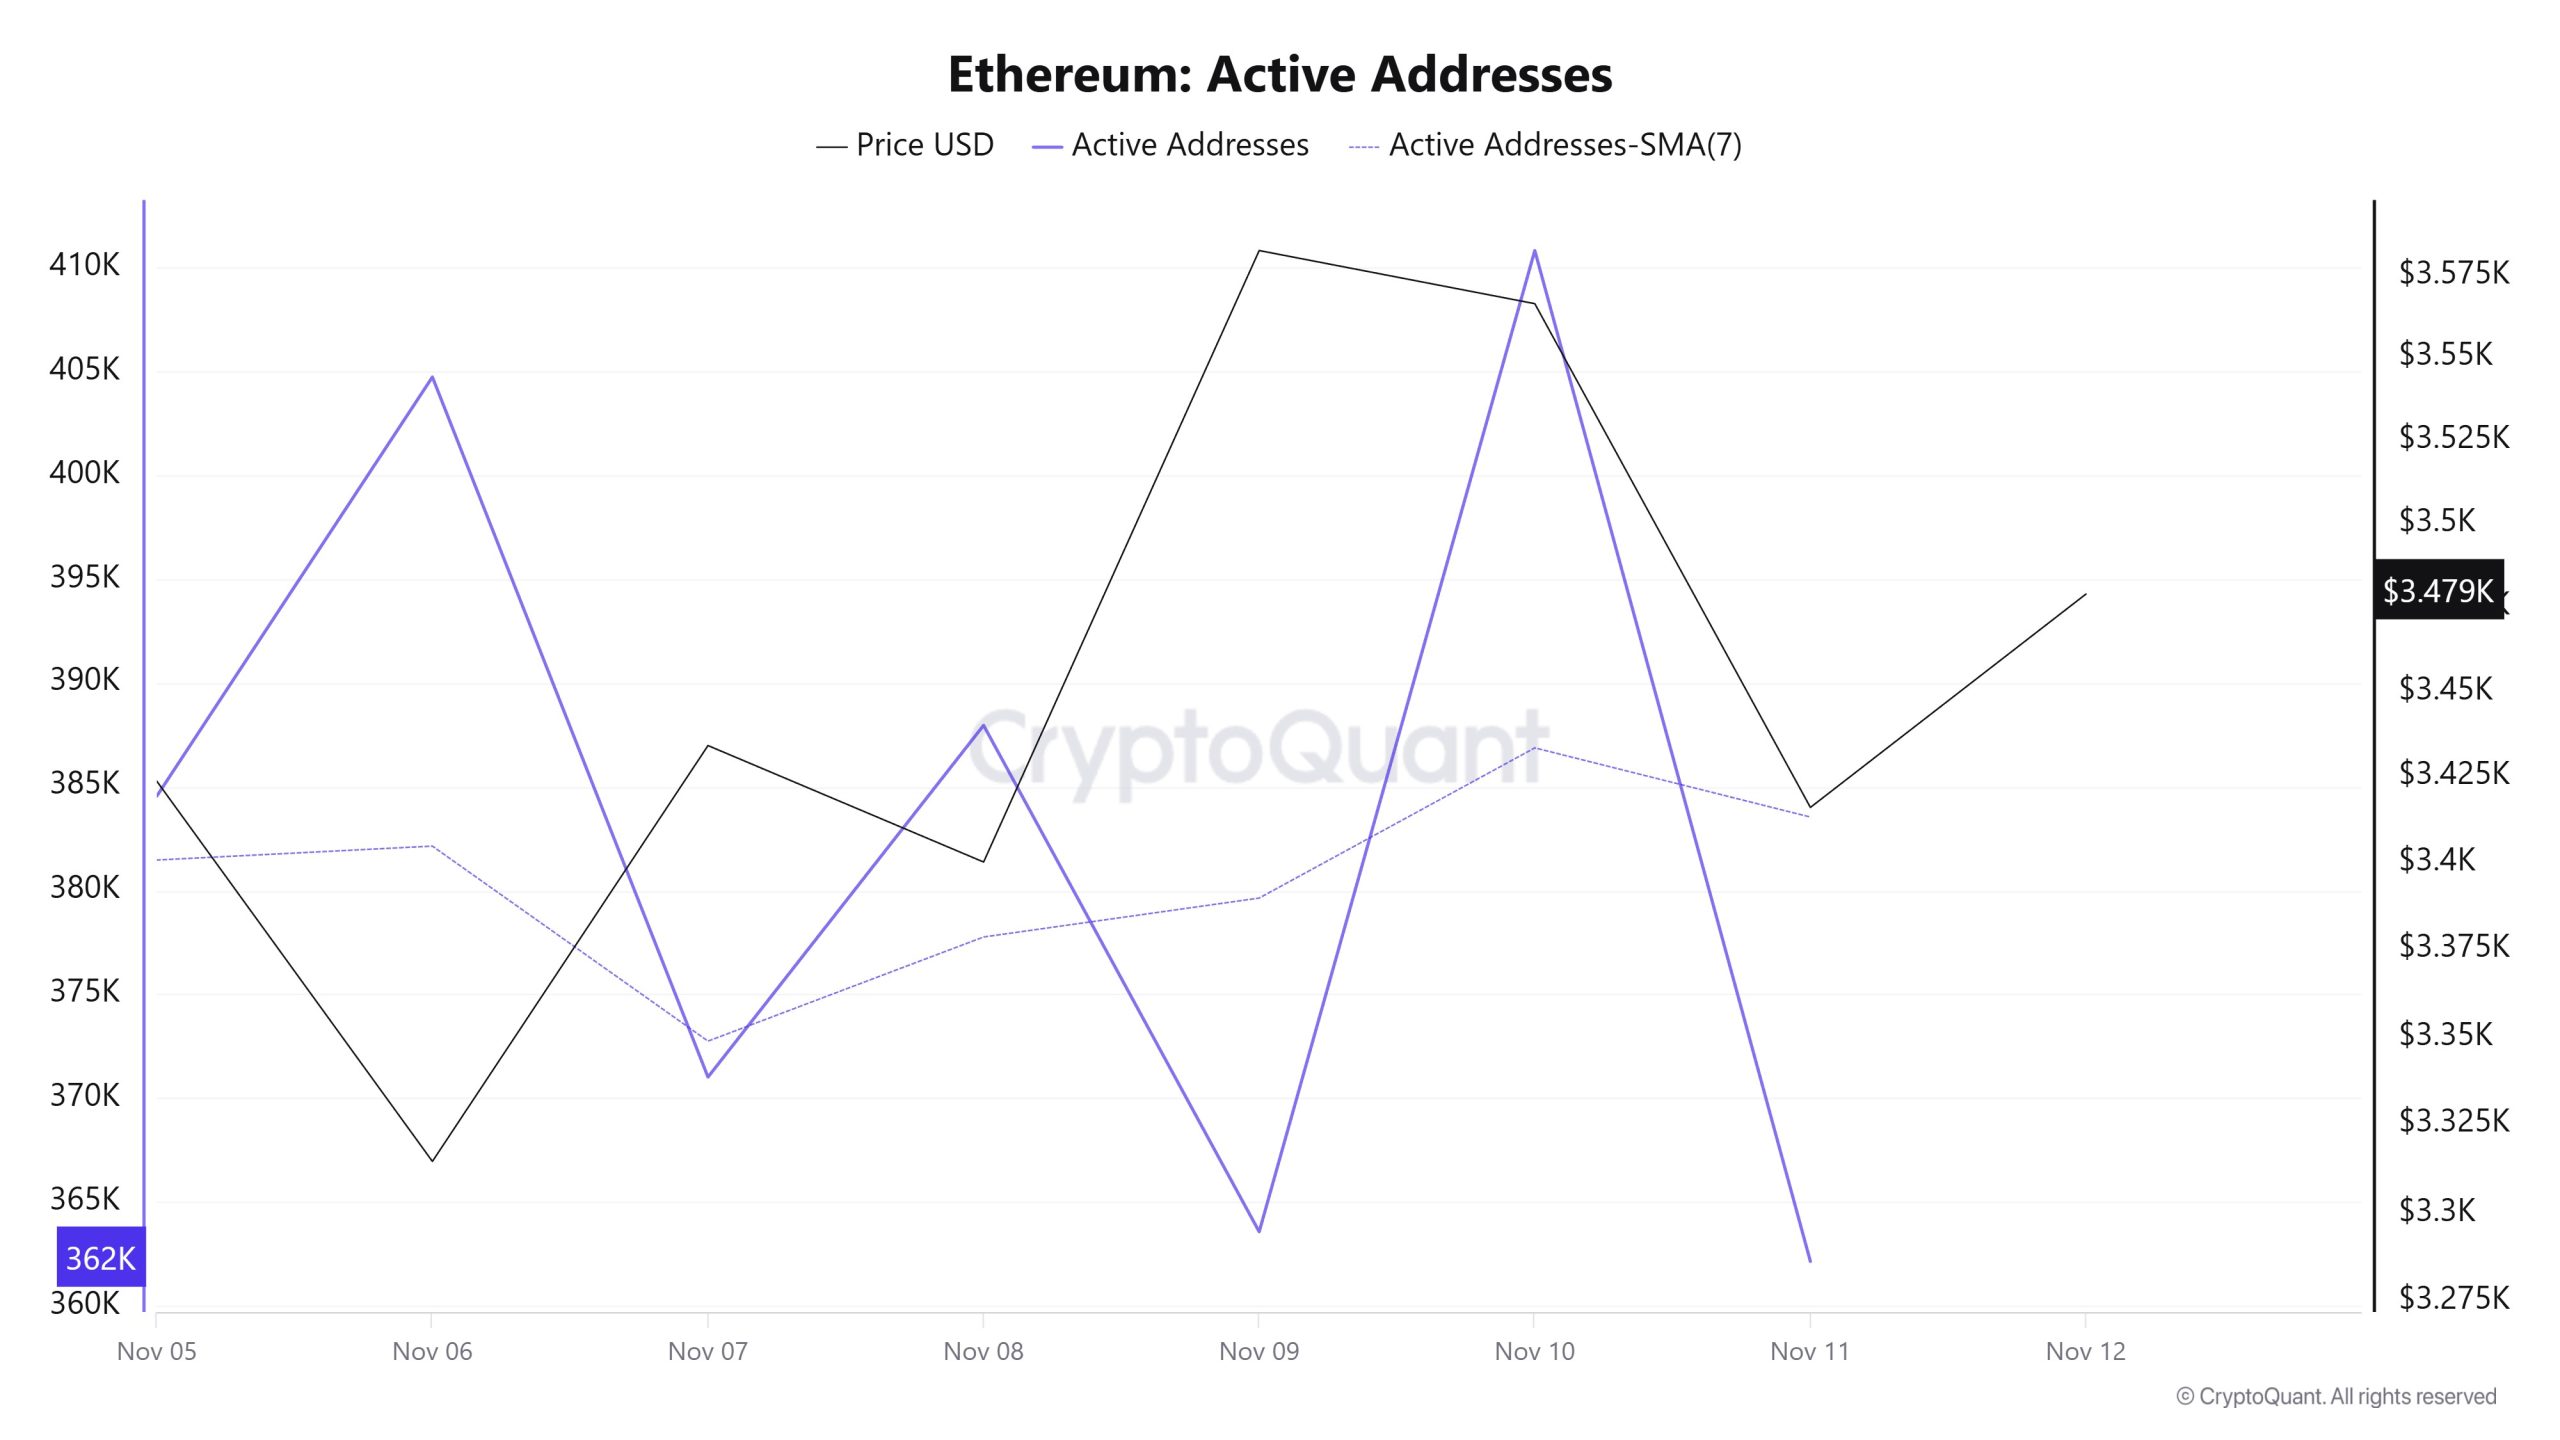
Between November 5 and November 12, a total of 410,822 active addresses were added to the Ethereum network. During this period, the Ethereum price fell from $3,582 to $3,314. Notably, on November 9, when the price reached the active address point, the number of active addresses increased, and a rise in the price was observed after a certain period. When examining the 7-day simple moving average (SMA), it is seen that the Ethereum price is generally trending upward.
Active Sending Addresses
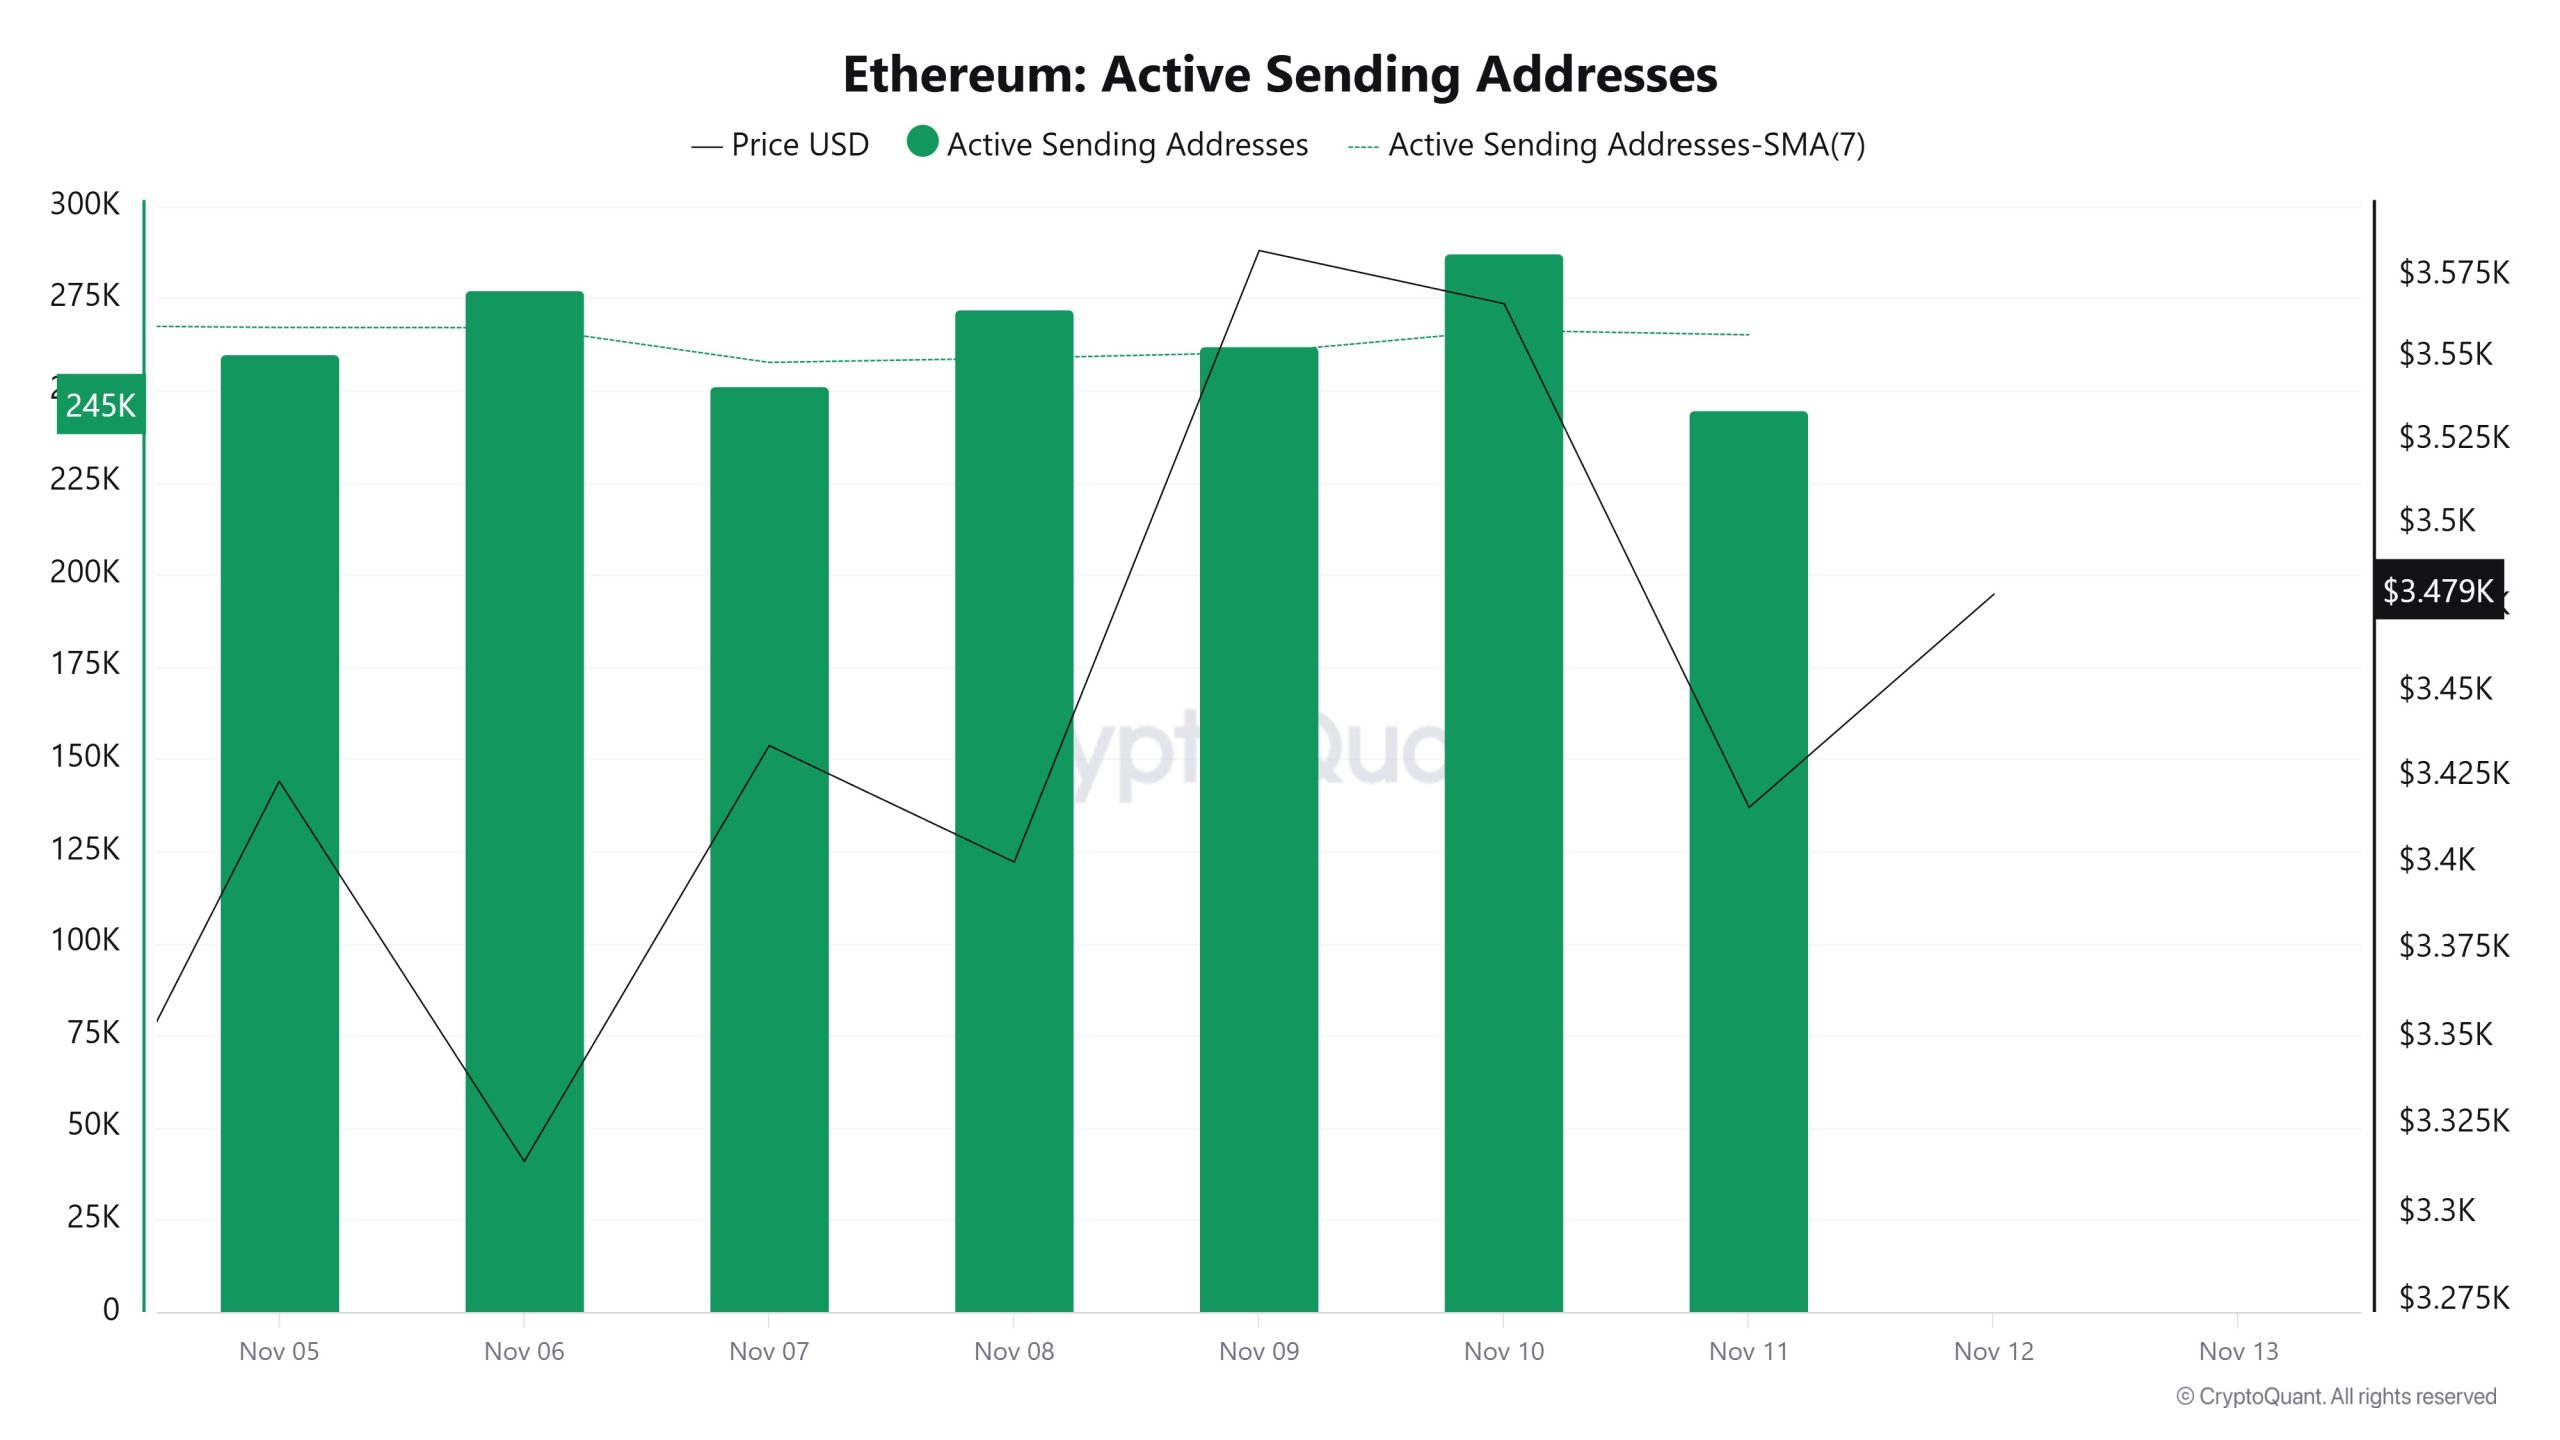
Between November 5 and November 12, high levels of active sending activity were observed alongside the Black Line (price line). On the day the price reached its highest level on a weekly basis, active sending addresses reached 287,303.
Active Receiving Addresses
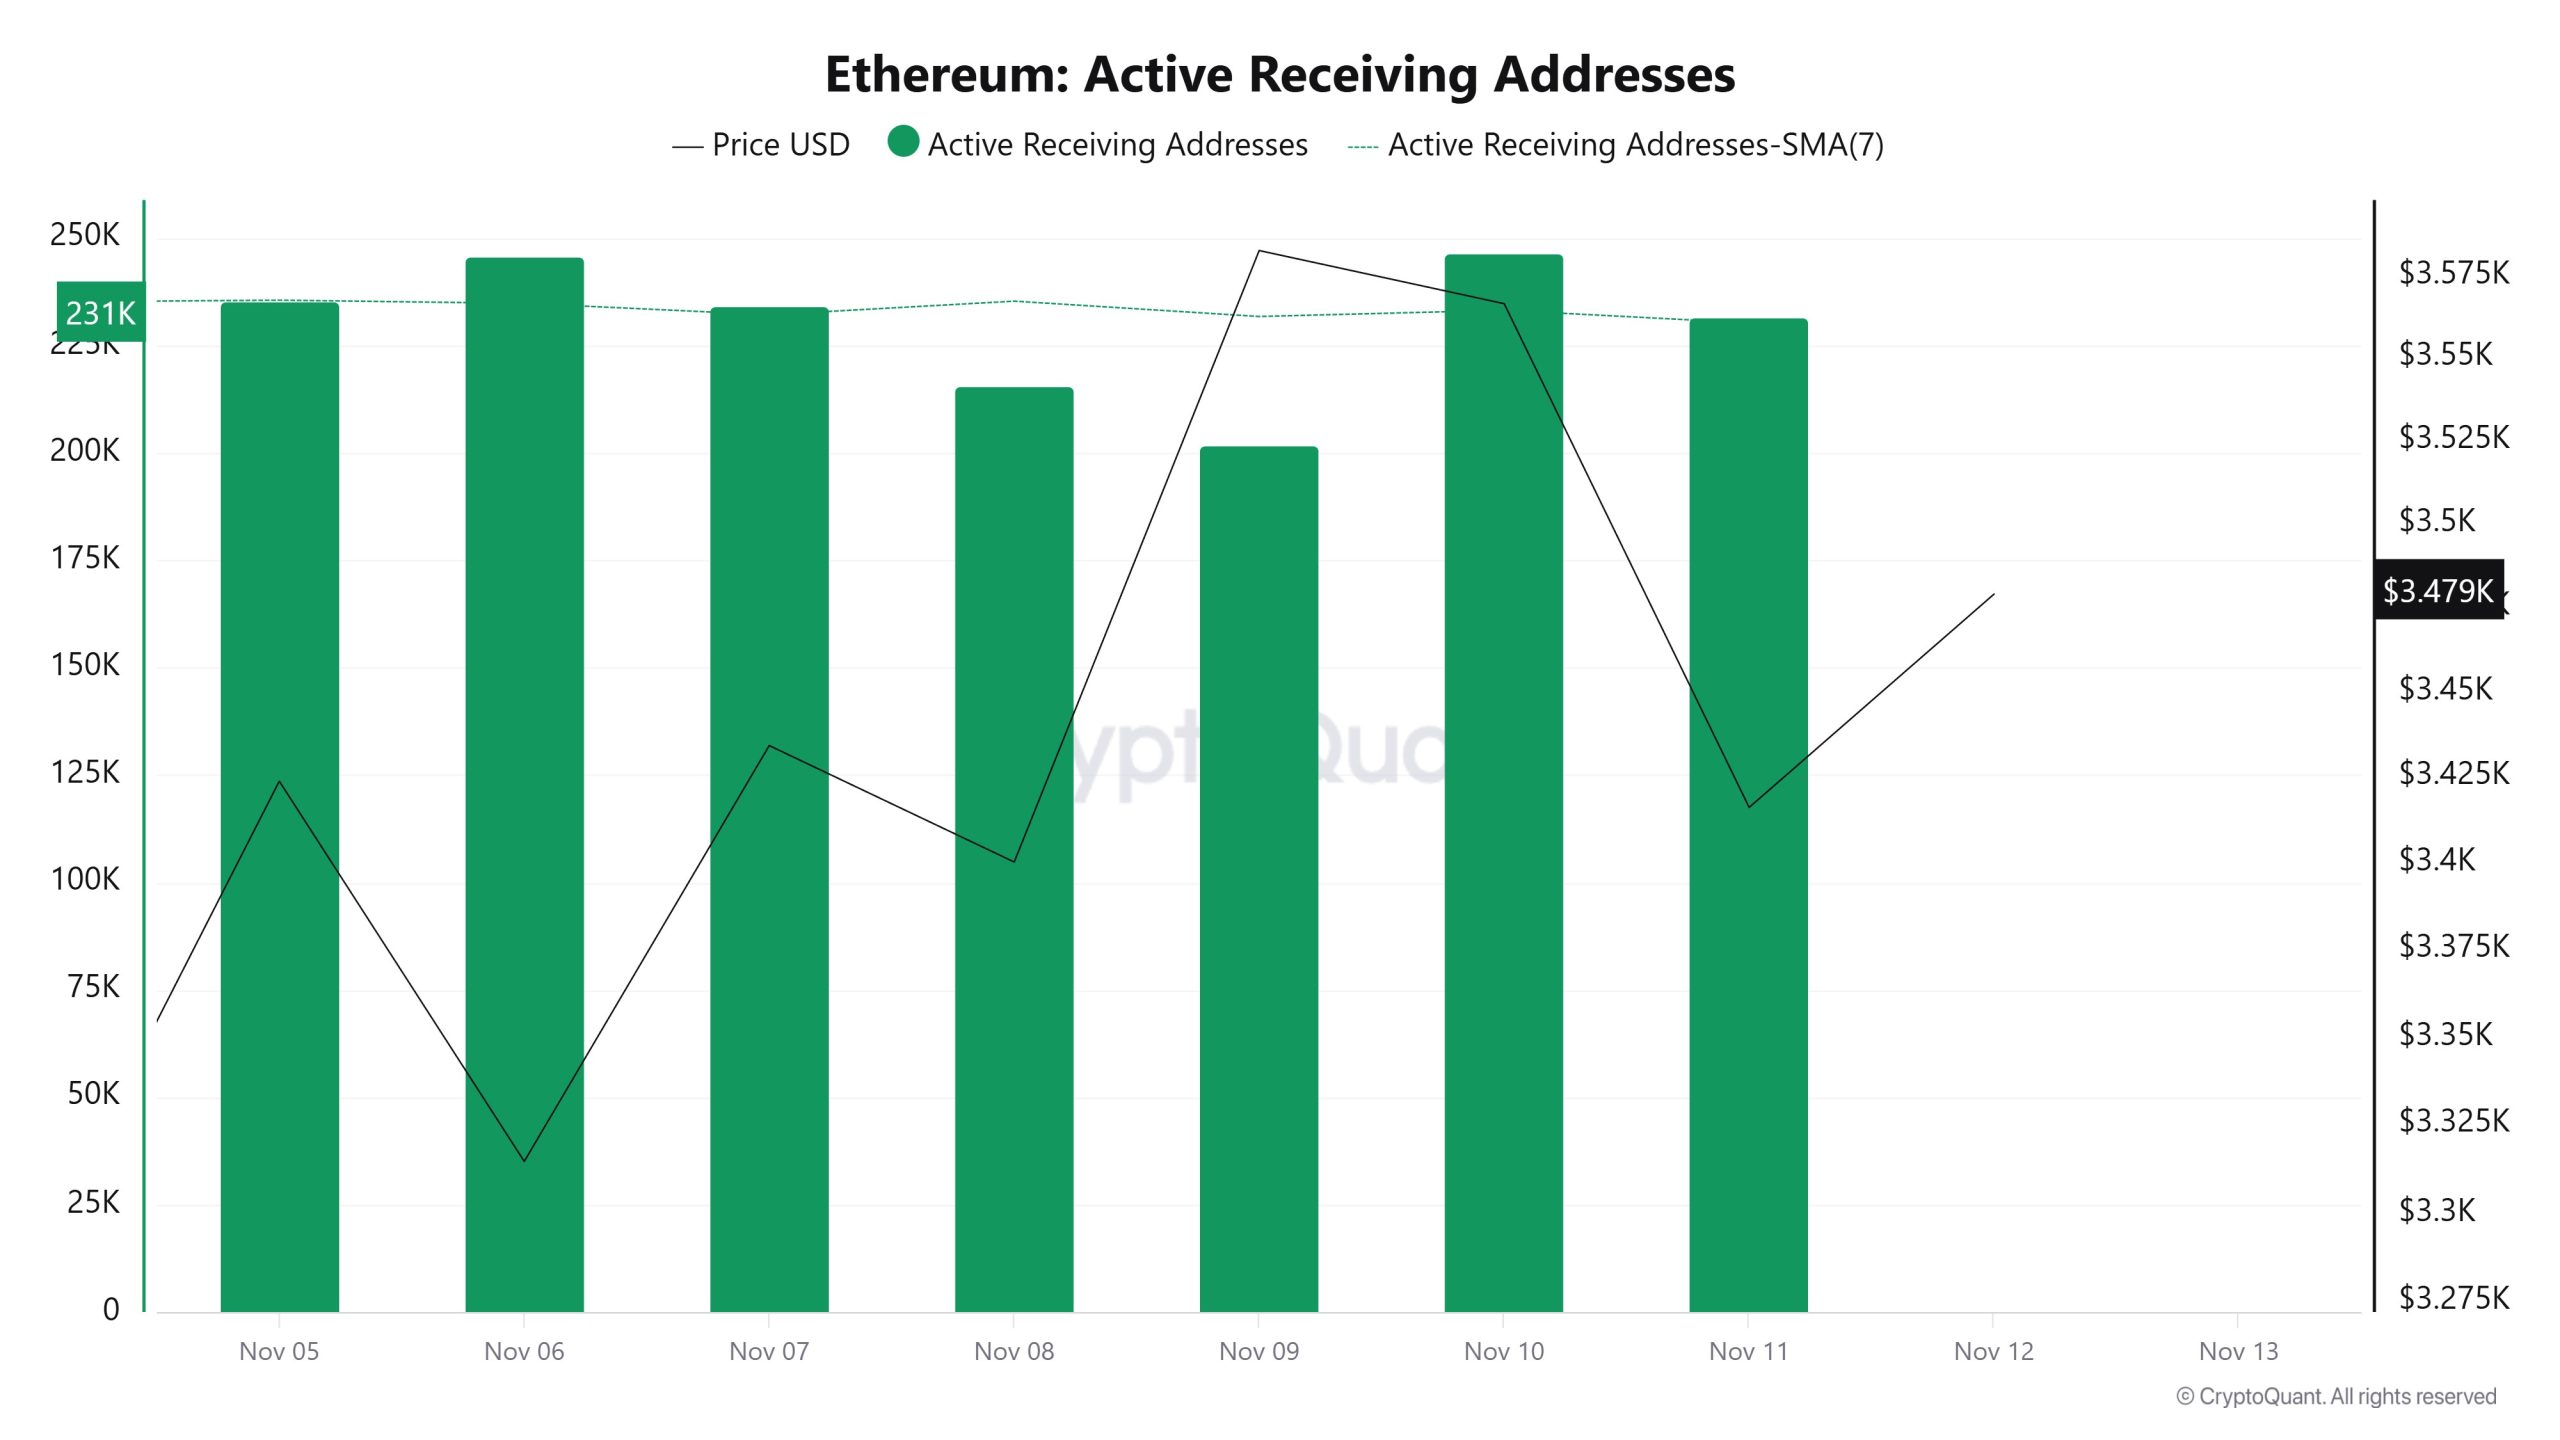
Between November 5 and November 12, while there was no significant increase in active receiving addresses, the price was seen to consolidate horizontally. On the day the price reached its highest level, active receiving addresses reached 246,543, indicating an increase in purchases.
Total Value Staked
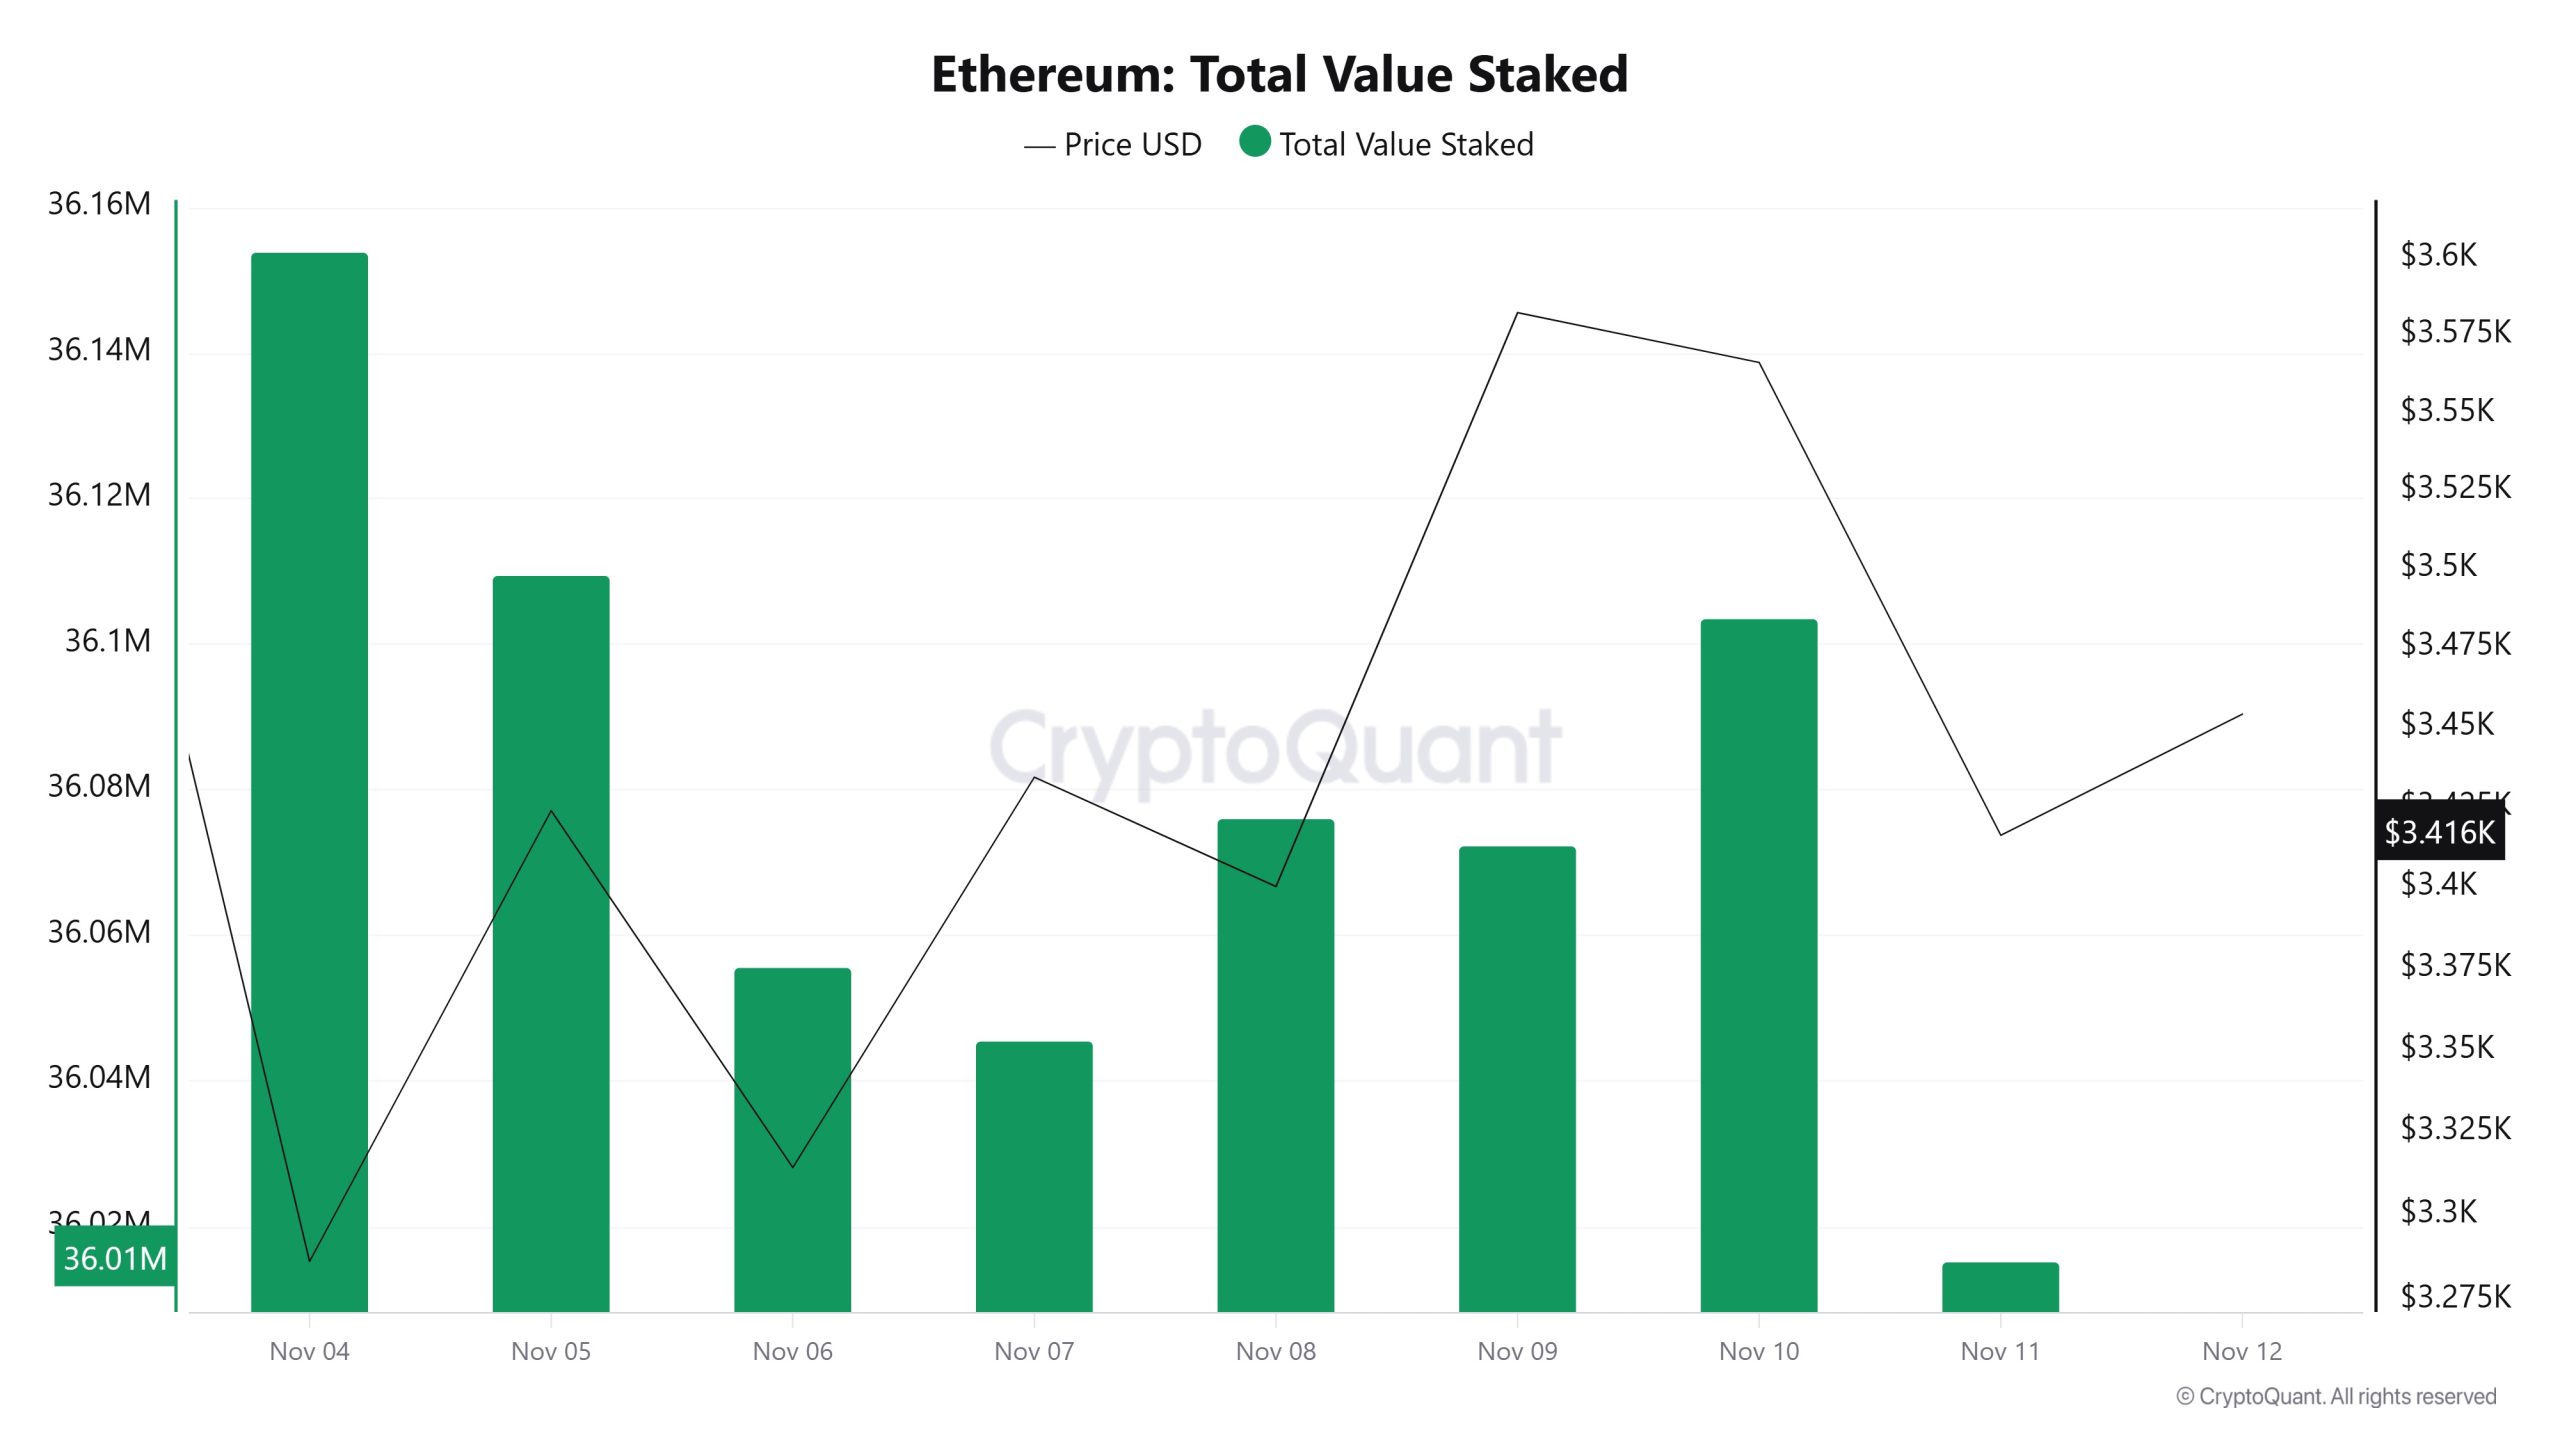
On November 5, when the ETH price was trading at $3,423, the Total Value Staked was at 36,109,484. As of November 11, the ETH price fell to $3,416, while the Total Value Staked dropped to 36,015,212, recording a 0.26% decline.
Staking Inflows
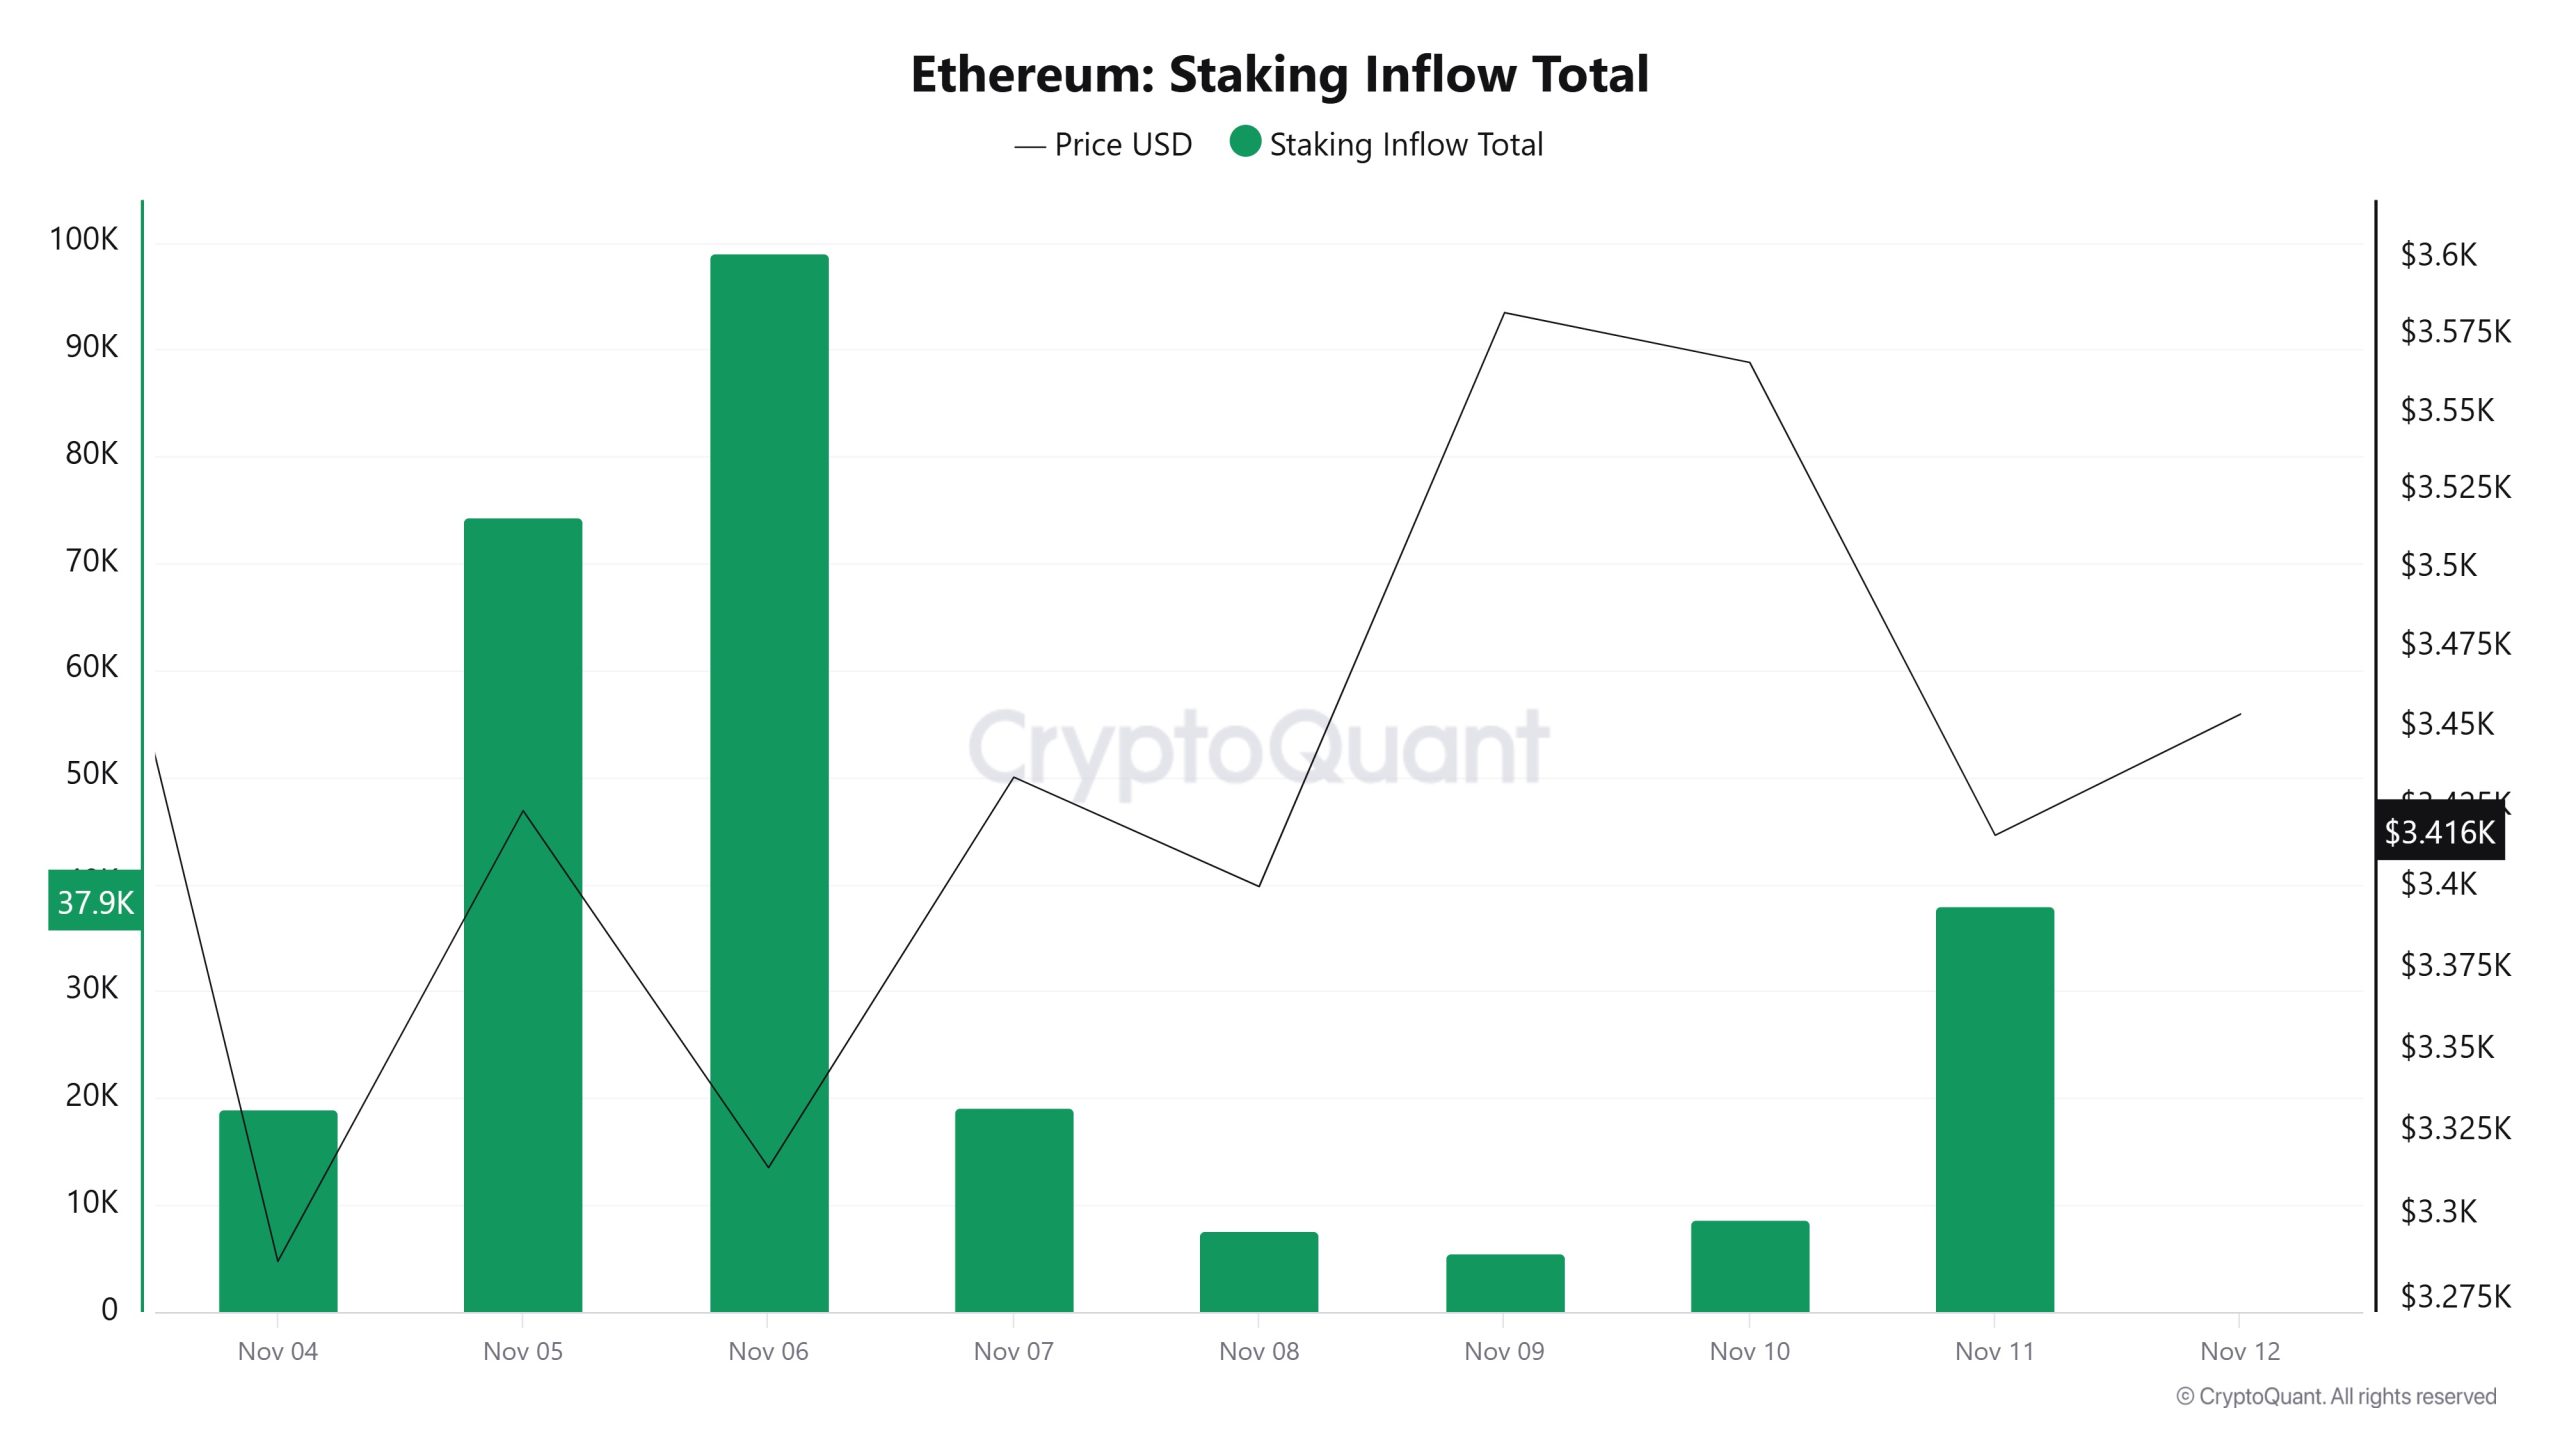
On November 5, while the ETH price was trading at $3,423, the Staking Inflow was at 74,320. As of November 11, the ETH price fell to $3,416, while the Staking Inflow dropped to 37,998, recording a 48.87% decrease.
Derivatives
Open Interest
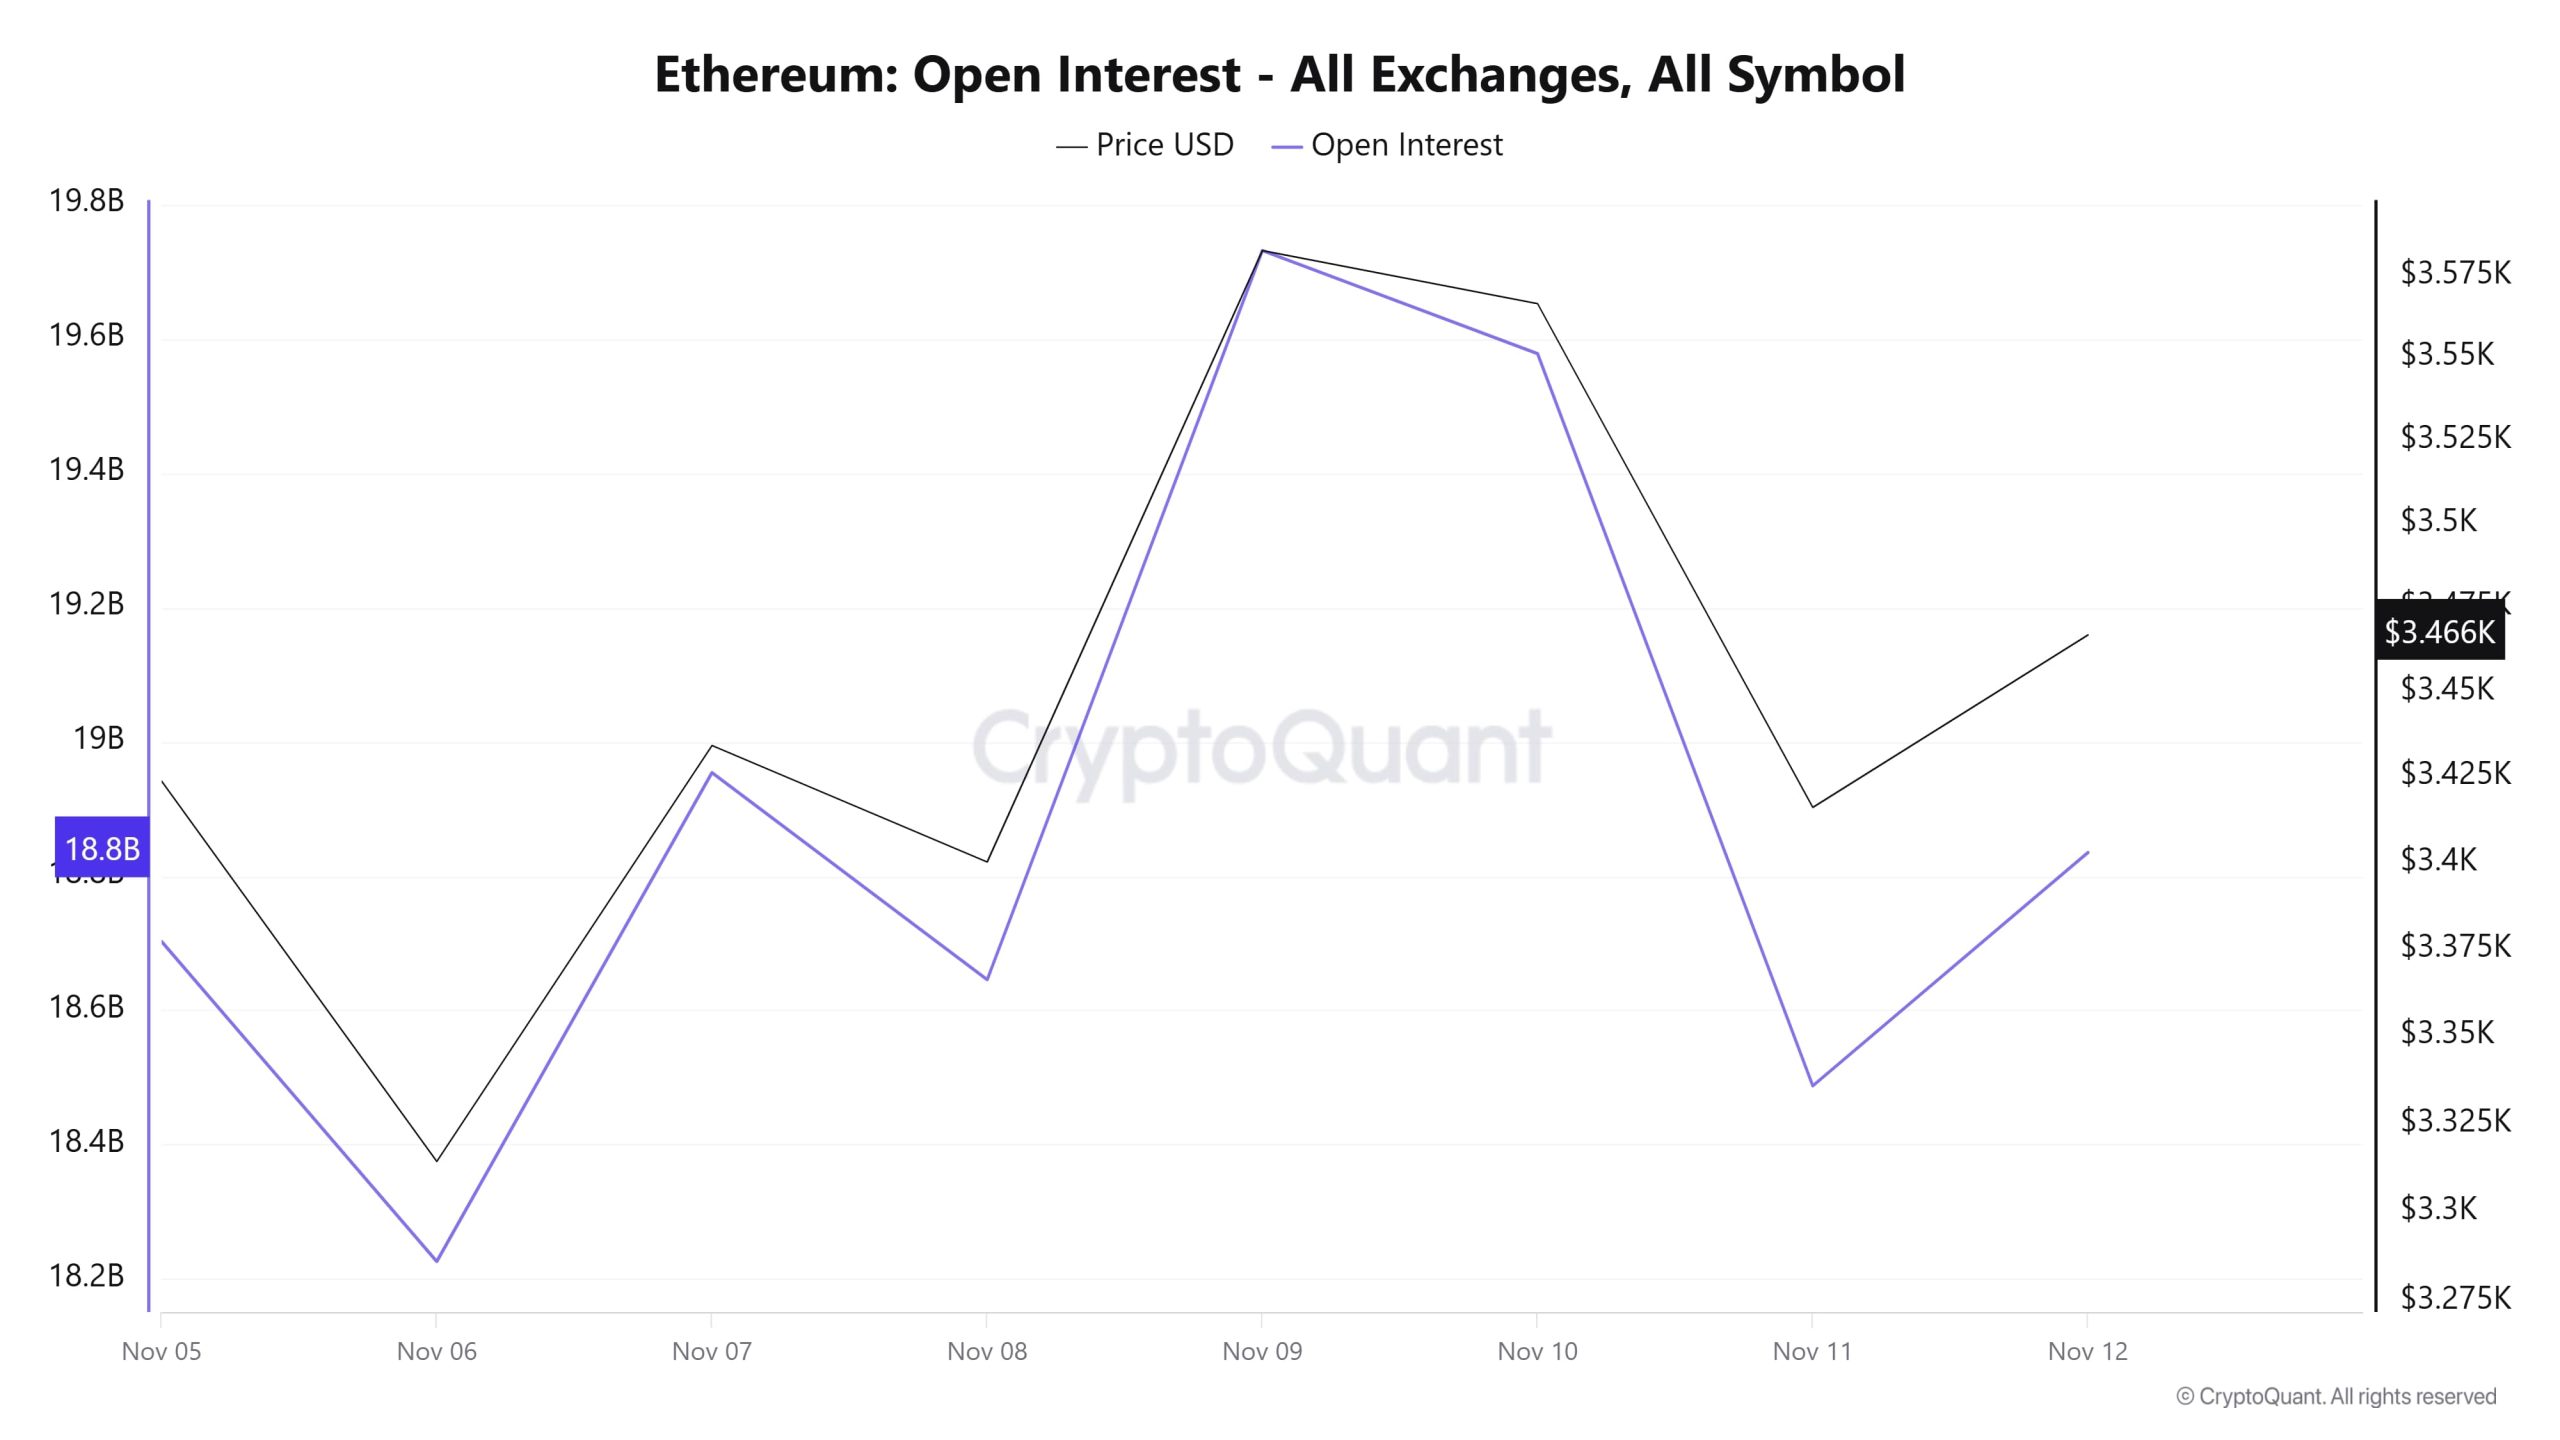
While open interest declined at the beginning of the week, there was a significant increase on November 9, rising to approximately $19.8 billion. This increase was accompanied by a similar rise in price, indicating increased market interest.
However, on November 10 and 11, both the price and open positions declined, which may indicate a period of profit-taking or risk aversion among investors. Towards the end of the week, there was a slight recovery in both price and open interest. Overall, the Ethereum market appears volatile but active.
Funding Rate
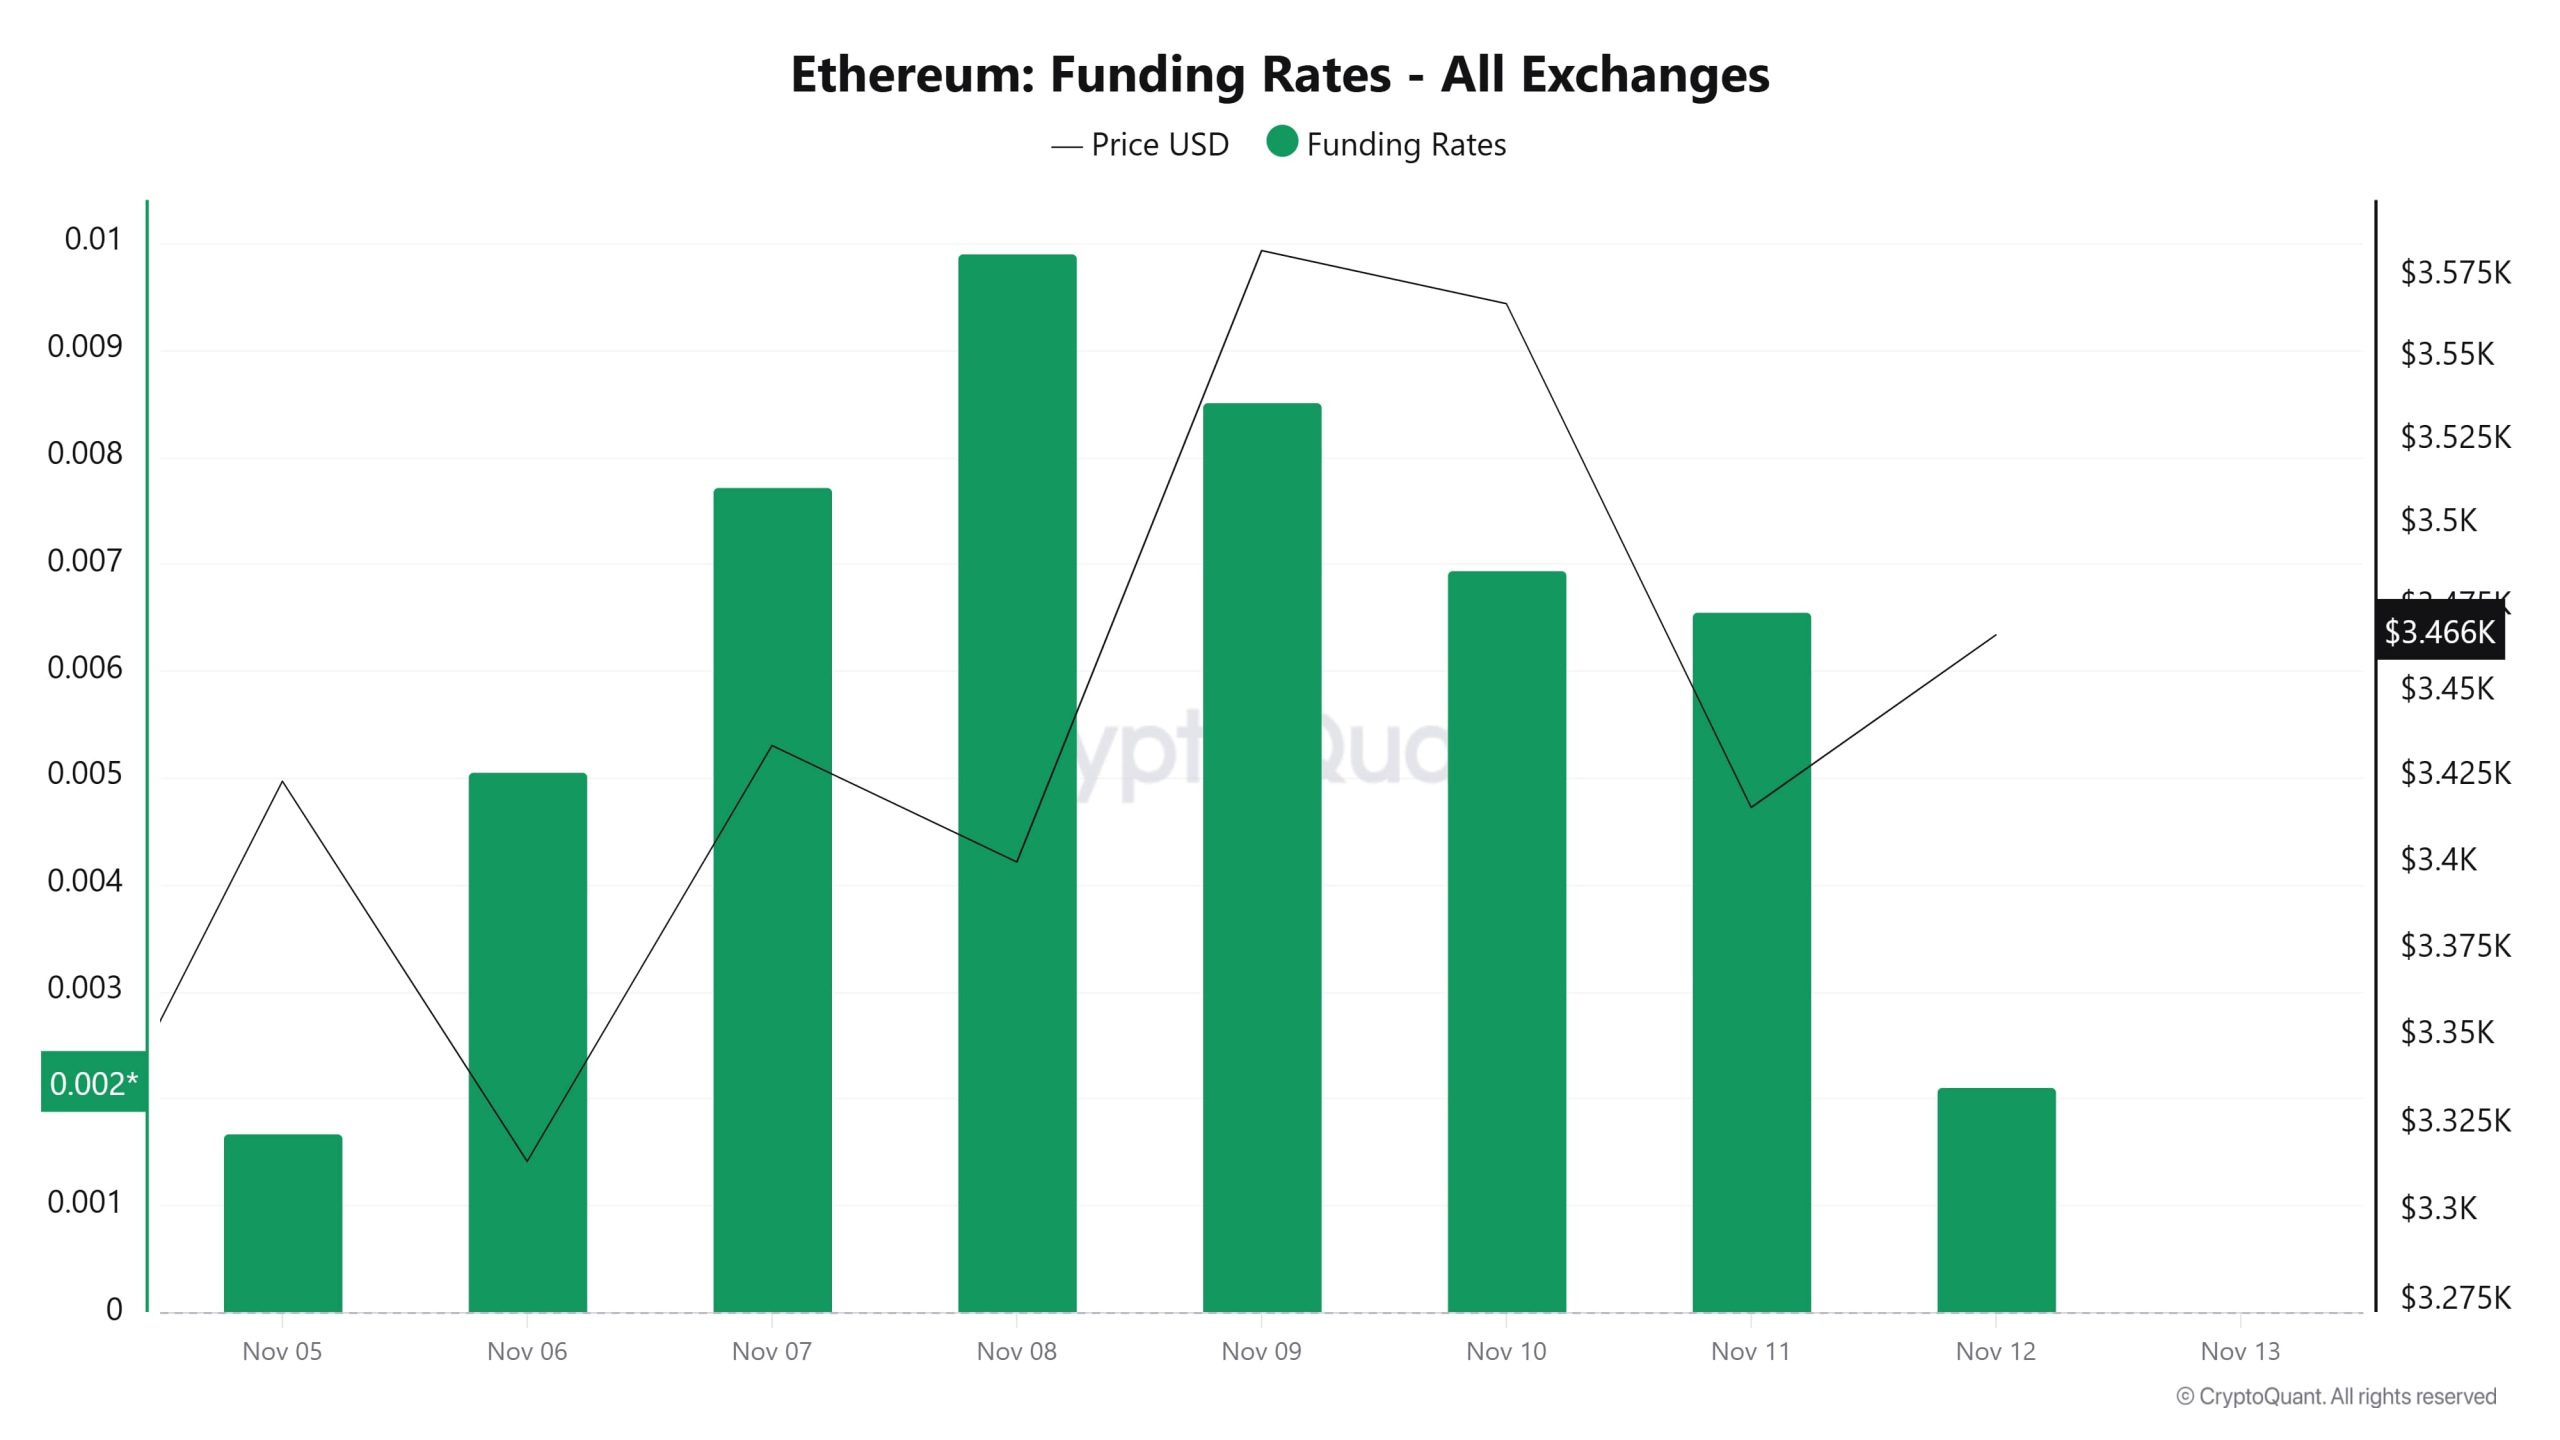
From the last days of October until November 2, the rise in funding rates in positive territory indicates that long positions predominantly dominate the market and that investors maintain their expectation of price increases. However, following November 3, the price fell from $3,900 to $3,030, accompanied by a sharp decline in funding rates. This trend reveals that leveraged long positions have begun to close and the market has shifted to a more cautious stance.
The overall outlook suggests that short-term optimism in Ethereum futures has given way to a neutral outlook, while the decline in funding rates indicates that excessive leverage risk in the market has temporarily decreased.
Long & Short Liquidations
ETH, which fell from $3,440 to $3,197, rose to $3,680 and then fell again. However, $432 million in long positions were liquidated. During the same time period, $491 million in short positions were also liquidated.
| Date | Long Volume (Million $) | Short Volume (Million $) |
|---|---|---|
| November 5 | 45.84 | 92.28 |
| November 6 | 113.40 | 44.58 |
| November 7 | 67.73 | 83.50 |
| November 8 | 29.91 | 15.28 |
| November 9 | 17.12 | 93.41 |
| November 10 | 48.43 | 40.59 |
| November 11 | 110.32 | 121.74 |
| Total | 432.75 | 491.38 |
Supply Distribution
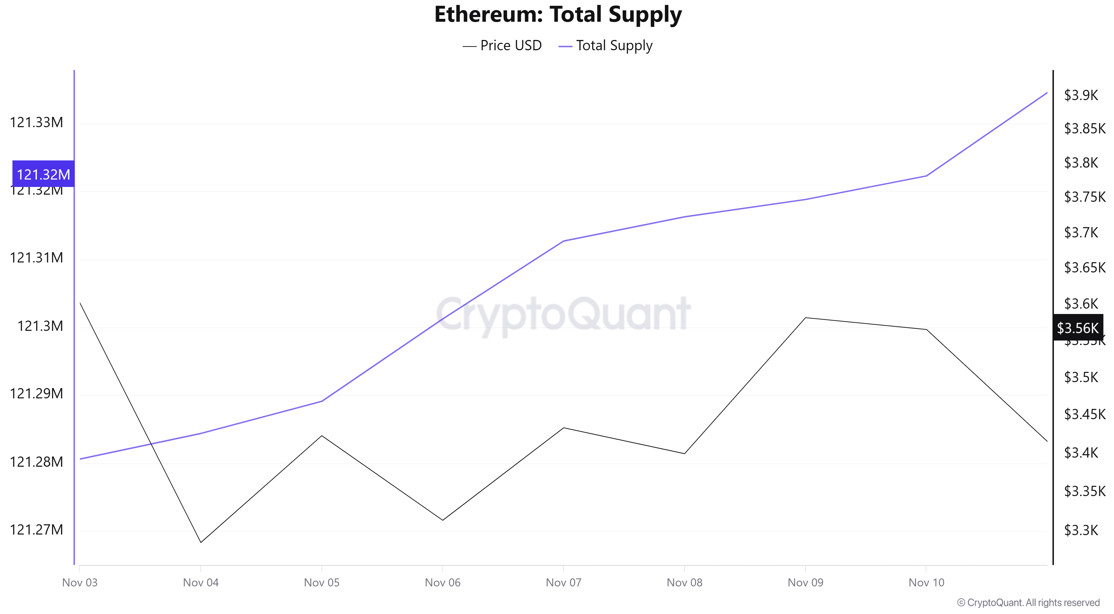
Total Supply: Reached 121,322,253 units, an increase of approximately 0.0343% compared to last week.
New Supply: The amount of ETH produced this week was 41,663.
Velocity: The velocity, which was 10.00 last week, reached 10.04 as of November 10.
| Wallet Category | November 3, 2025 | November 10, 2025 | Change (%) |
|---|---|---|---|
| 100 – 1k ETH | 8.6052M | 8.4539M | −1.76 |
| 1k – 10k ETH | 11.9918M | 12.05M | +0.49 |
| 10k – 100k ETH | 22.1482M | 22.1732M | +0.11 |
| 100k+ ETH | 4.0551M | 4.2899M | +5.79 |
According to the latest weekly data, the Ethereum wallet distribution presents a mixed picture.
The total balance of wallets in the 100–1k ETH range decreased by approximately 1.76%, indicating selling pressure among mid-sized investors. In contrast, the 1k–10k ETH range saw an increase of 0.49%, and the 10k–100k ETH range saw an increase of 0.11%. The most notable change was a strong 5.79% increase in addresses holding 100k+ ETH, indicating that large wallets have been accumulating in recent times.
Exchange Supply Ratio
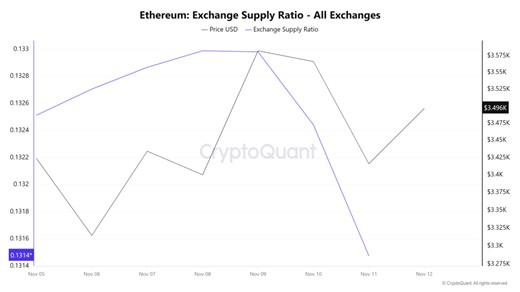
Between November 5 and November 12, the Ethereum Exchange Supply Ratio fell from 0.13251286 to 0.13147561. During this period, the price of Ethereum fell from $3,423 to $3,416. Particularly around November 9, when the price and Exchange Supply Ratio intersected, the correlation between the price and Exchange Supply Ratio turned positive. This indicates that despite the price decline, the amount of Ethereum supplied to exchanges has increased, and long-term investors are likely shifting their assets towards Ethereum. It appears that an overall upward trend in the Ethereum price may prevail.
Exchange Reserve
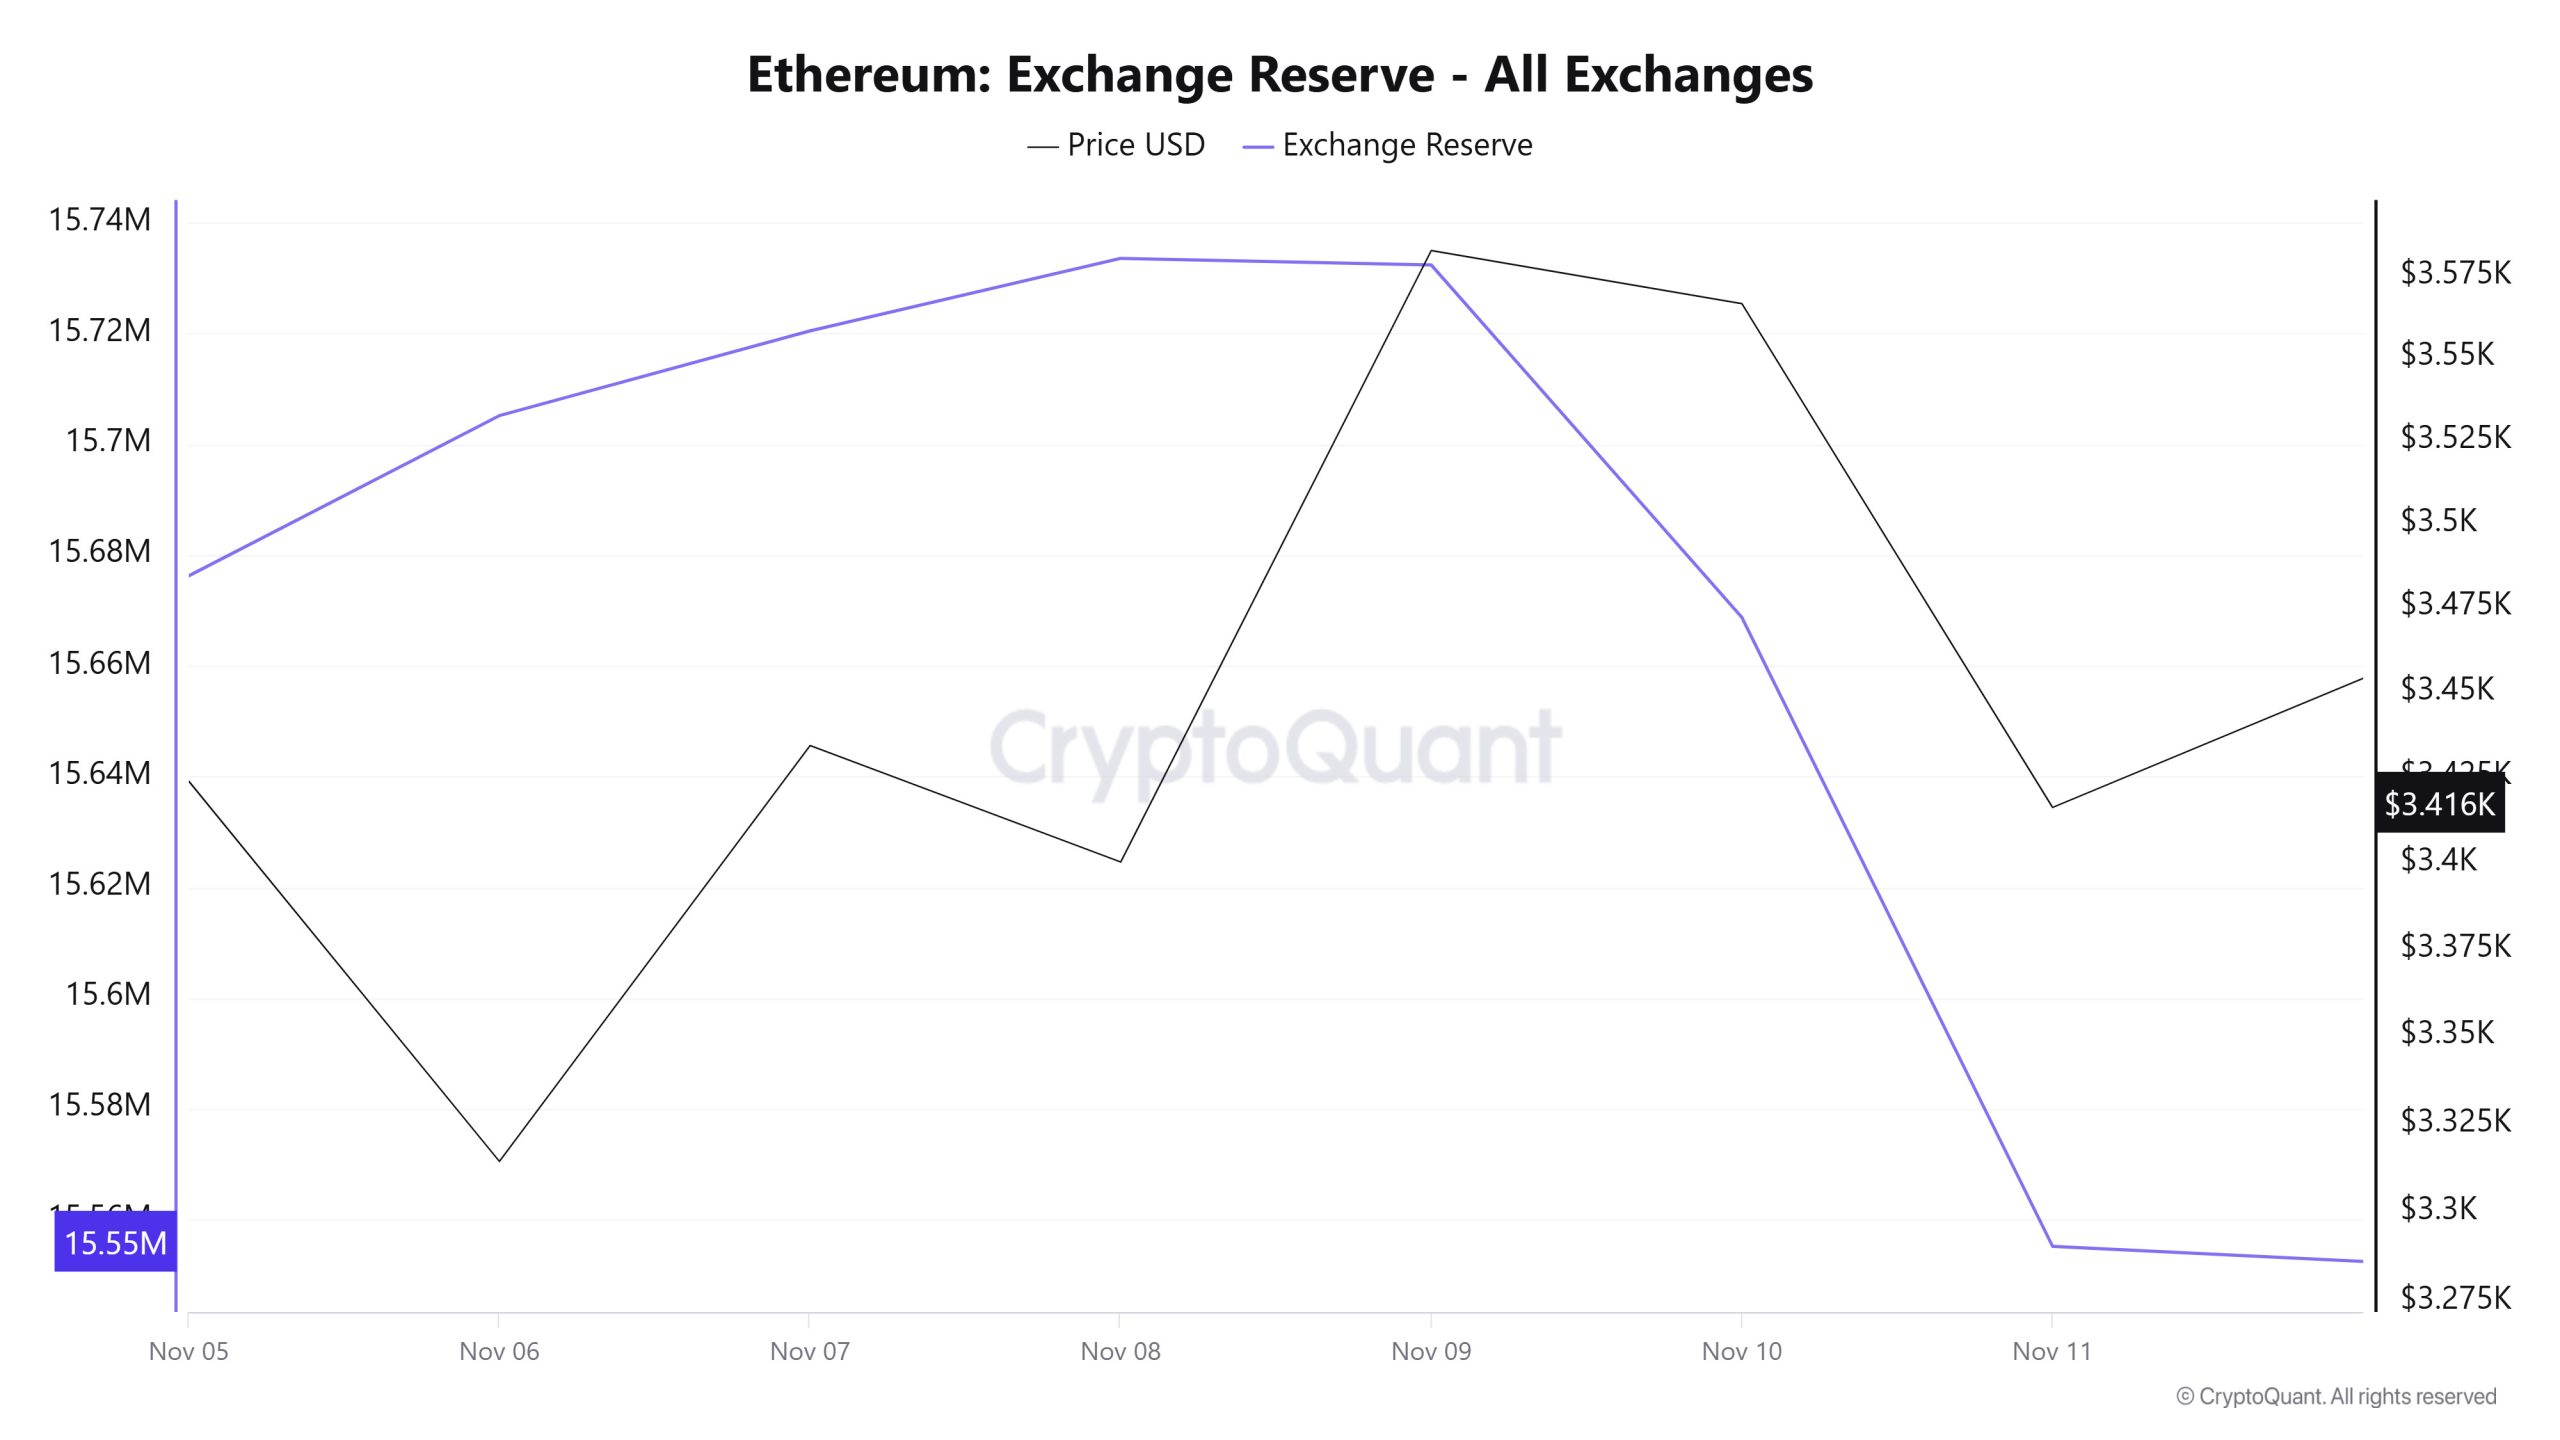
Between November 5 and 11, 2025, Ethereum reserves on exchanges decreased from 15,734,972 ETH to 15,555,147 ETH. There was a net outflow of 179,826 ETH, and reserves decreased by approximately 1.14%. During this period, the price of ETH rose from $3,287 to $3,416, gaining 3.94% in value. The decline in reserves while the ETH price rose during this period indicated that buying was more dominant and that investors were withdrawing their ETH to their own wallets rather than keeping them on exchanges. This situation signaled that confidence was maintained in the market during this period and that investors believed the price could regain strength in the medium term.
| Asset / Index | Value ($) | Daily Change (%) |
|---|---|---|
| Bitcoin (BTC) | 103,610.0 | +0.41% |
| Ethereum (ETH) | 3,447.56 | +0.91% |
| Bitcoin Spot ETF | +524.0M | Net Inflow |
| Ethereum Spot ETF | −107.1M | Net Outflow |
| Nasdaq (NAS100) | 25,699.7 | +0.57% |
| S&P 500 (SPX) | 6,846.62 | +0.21% |
| Russell 2000 (RUT) | 2,462.0 | +0.20% |
| U.S. Dollar Index (DXY) | 99.177 | +0.08% |
| VIX Volatility Index (VIX) | 17.28 | −1.82% |
| U.S. 10-Year Treasury Yield (US10Y) | 4.116 | +0.08% |
| Brent Crude Oil (BRENT) | 65.252 | −0.34% |
| LBMA Gold (XAU) | 4,115.32 | −0.27% |
| LBMA Silver (XAG) | 51.393 | +0.55% |
Fees and Revenues
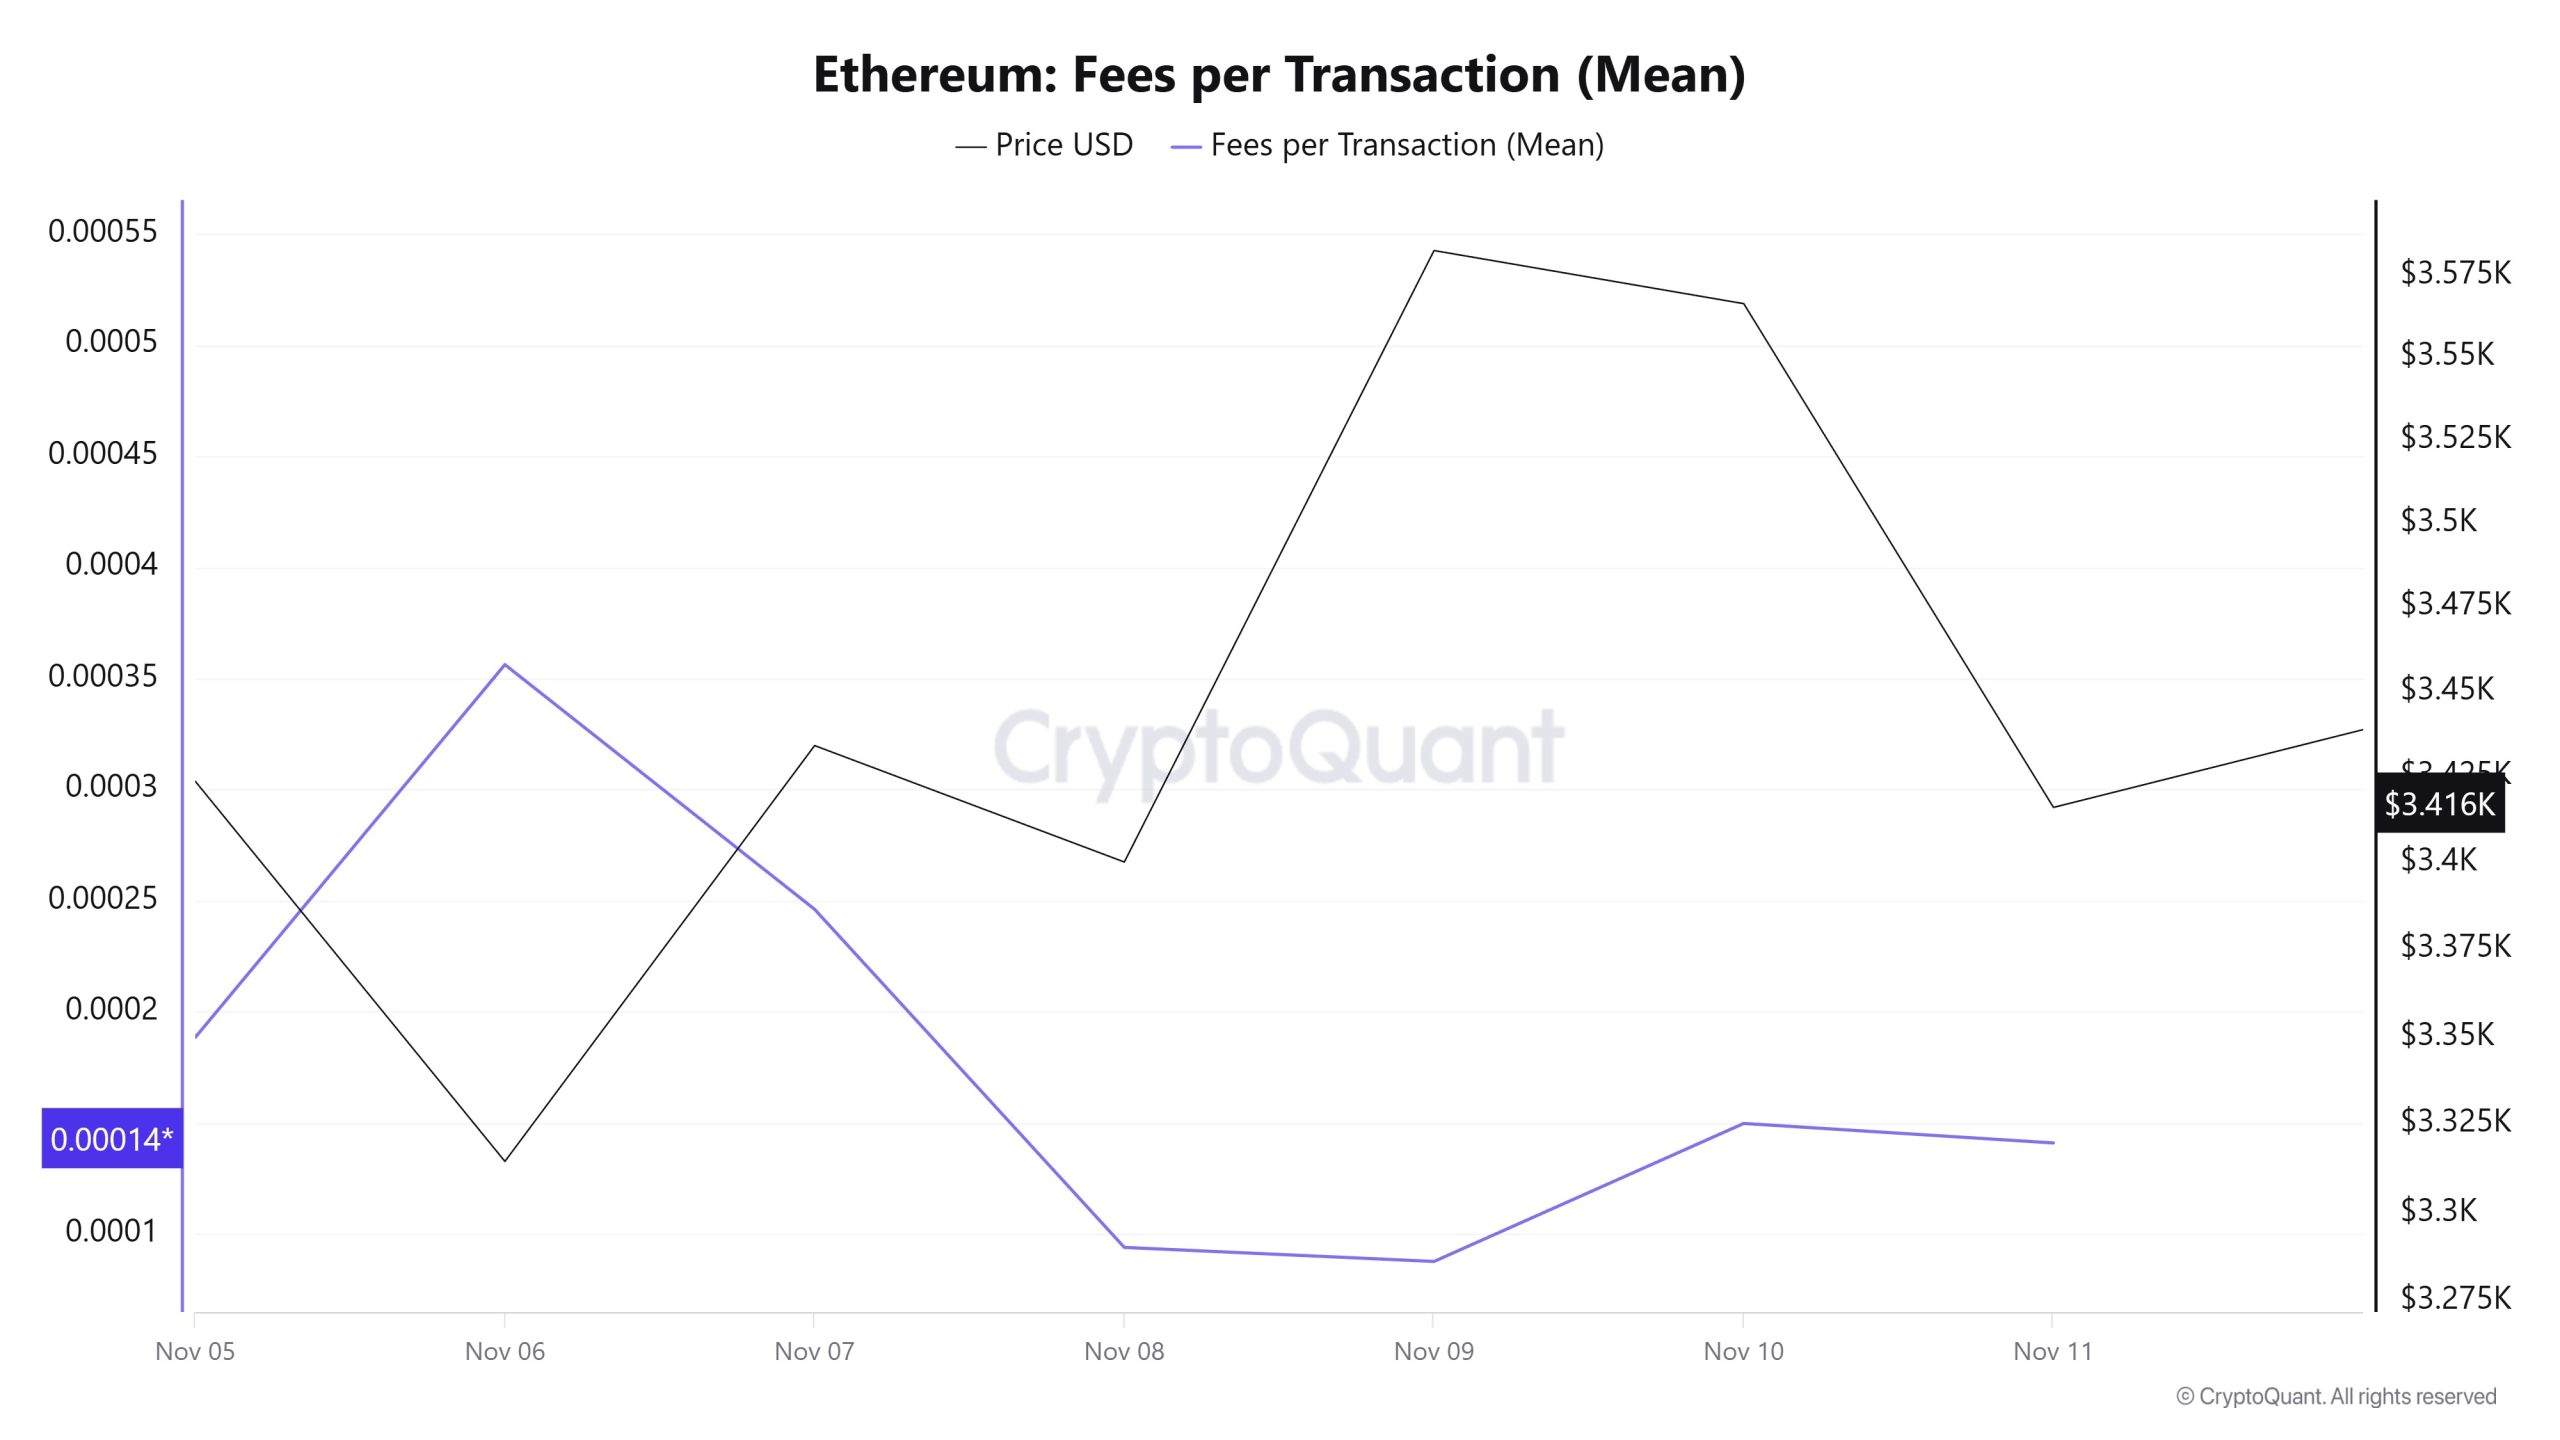
When examining the Ethereum Fees per Transaction (Mean) data for the period between November 5 and 11, it is observed that the indicator reached 0.00001057 on November 5, the first day of the week.
A downward trend was observed until November 9, when the indicator recorded its lowest value of the week at 0.00000492.
In this context, as a result of a significant increase in Ethereum price volatility as of November 10, the indicator regained momentum and followed a positive trend due to the impact of price volatility.
On November 11, the last day of the weekly period, the indicator closed the week at 0.00000558.
Ethereum: Fees (Total)
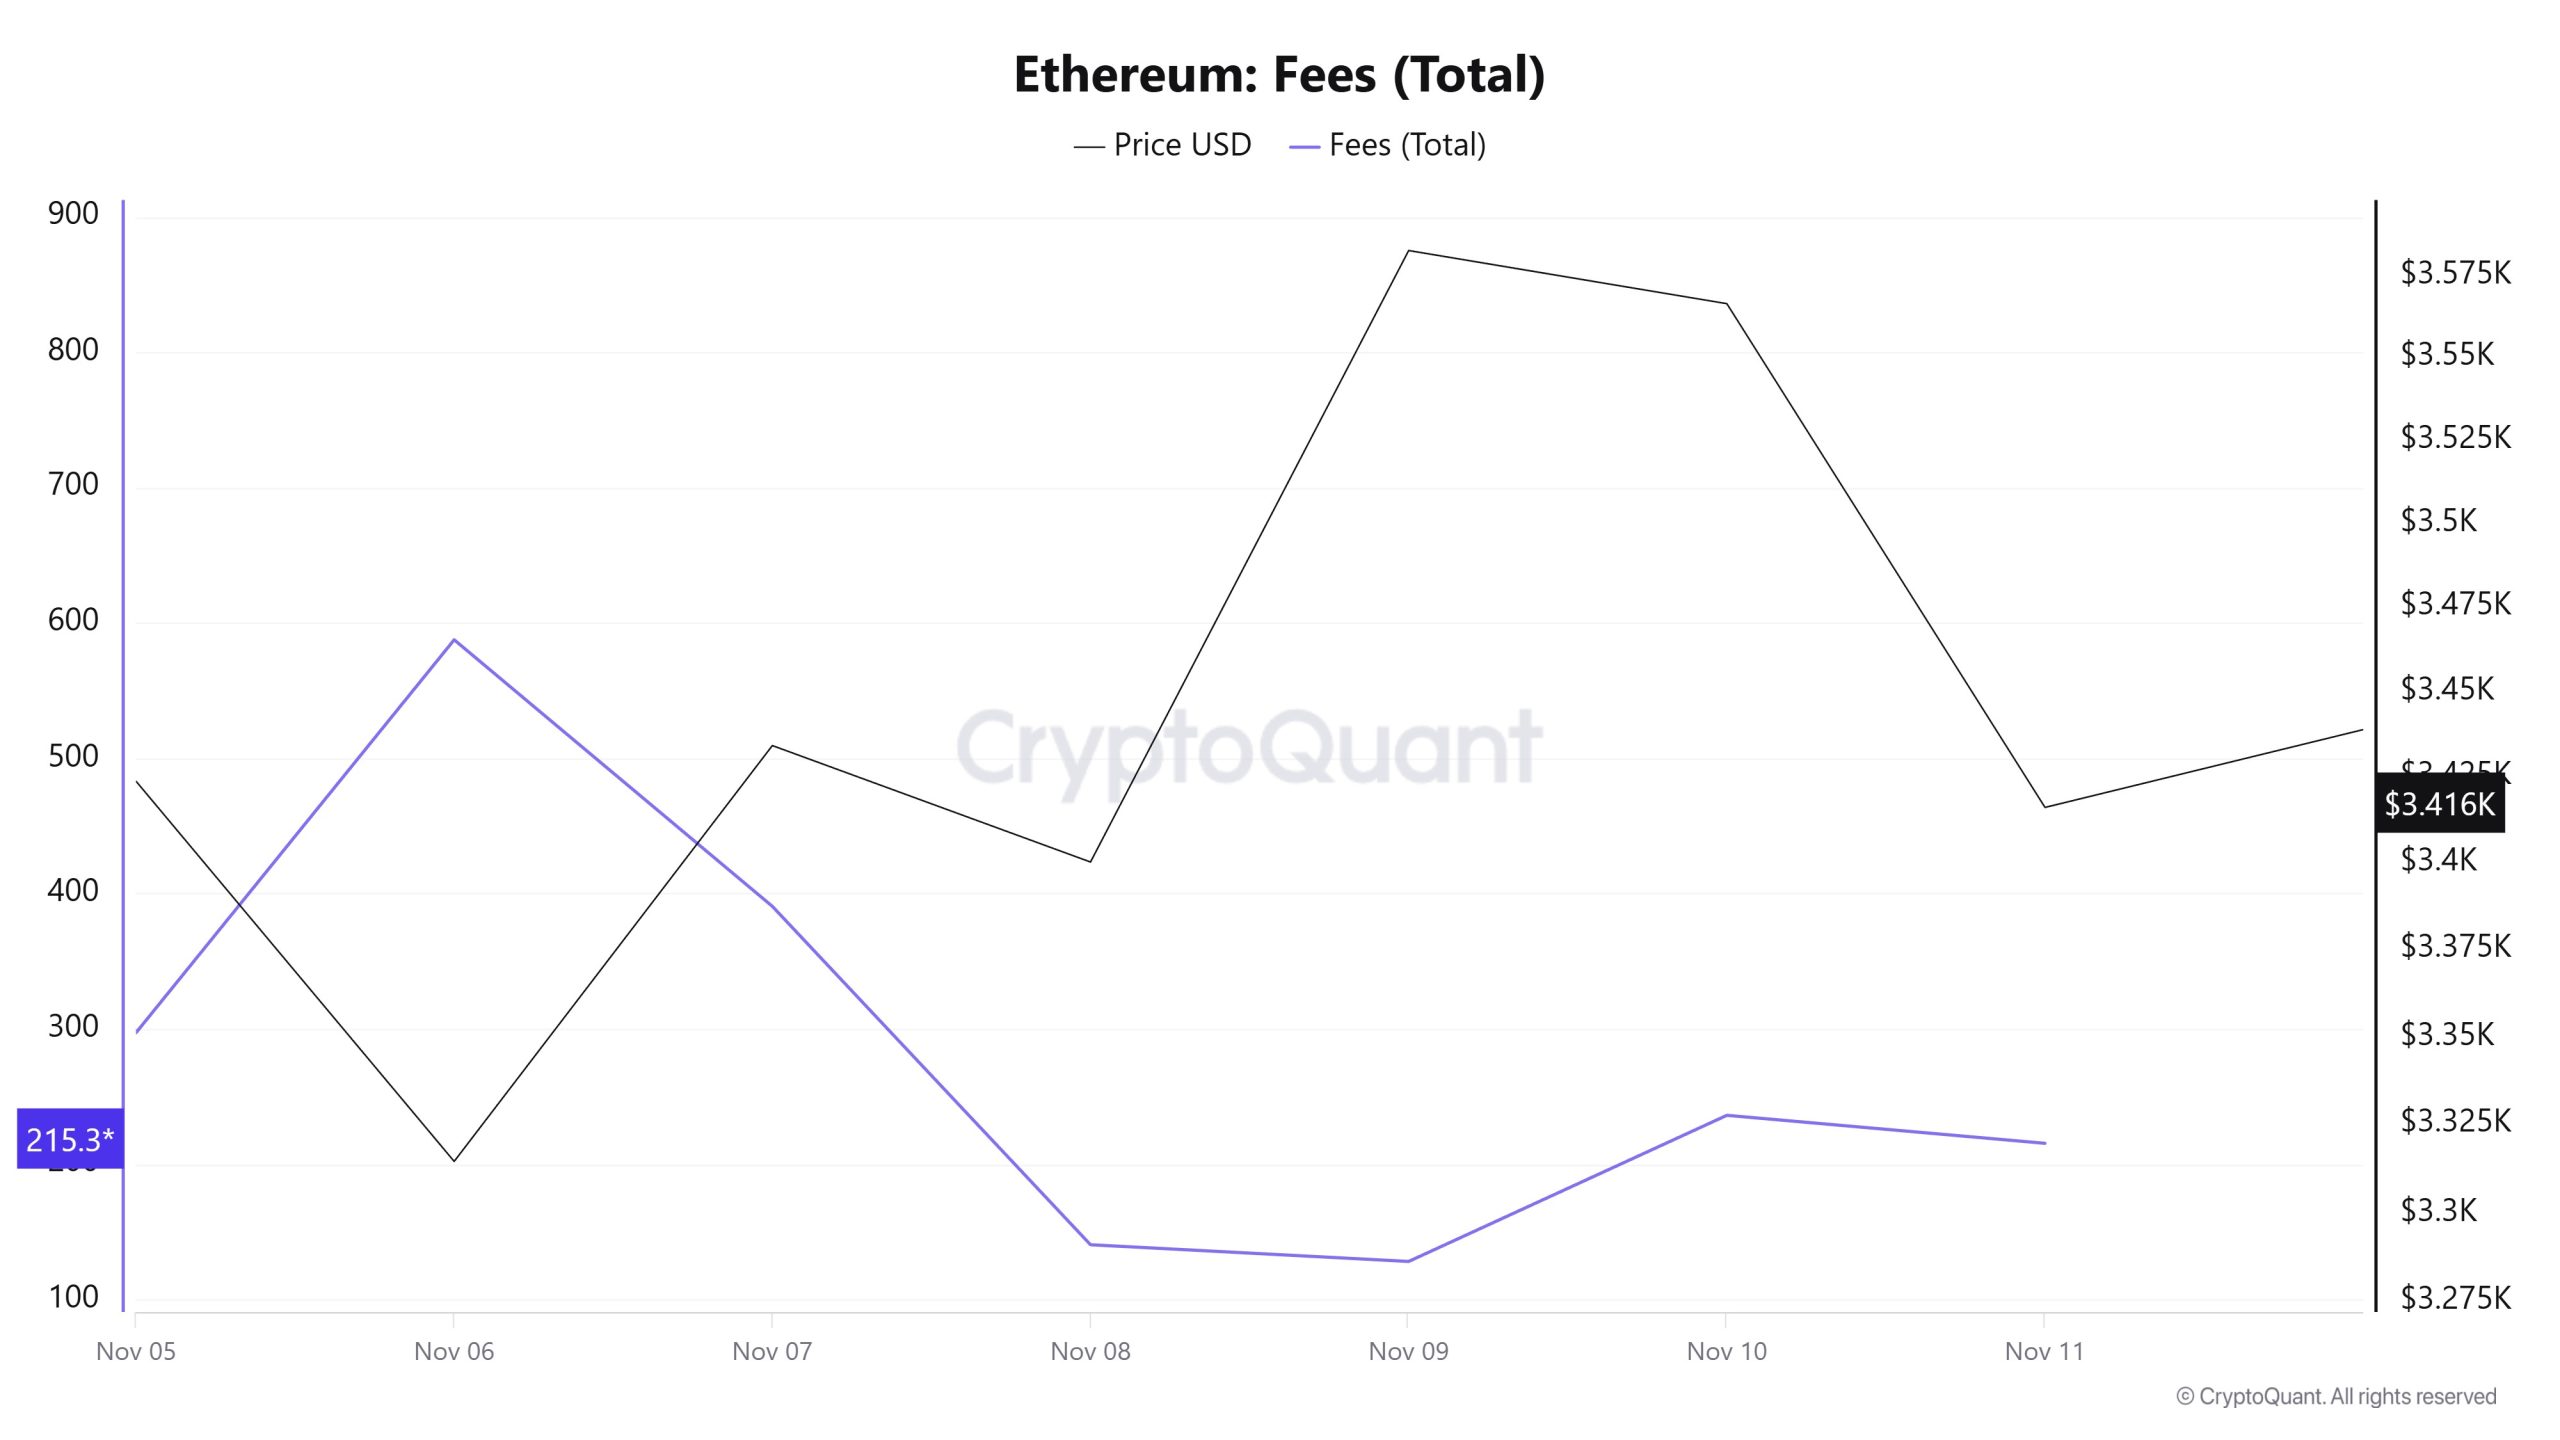
Similarly, when examining the Ethereum Fees (Total) data between November 5 and 11, it can be seen that on November 5, the first day of the week, the indicator stood at 297.0202884528865.
A downward trend was observed until November 9, when the indicator recorded its lowest value of the week at 127.9828649915871.
In this context, as of November 10, a significant increase in Ethereum price volatility resulted in the indicator regaining momentum and following a positive trend due to the impact of price volatility.
On November 11, the last day of the weekly period, the indicator closed the week at 215.30151398554693.
Blocks Mined
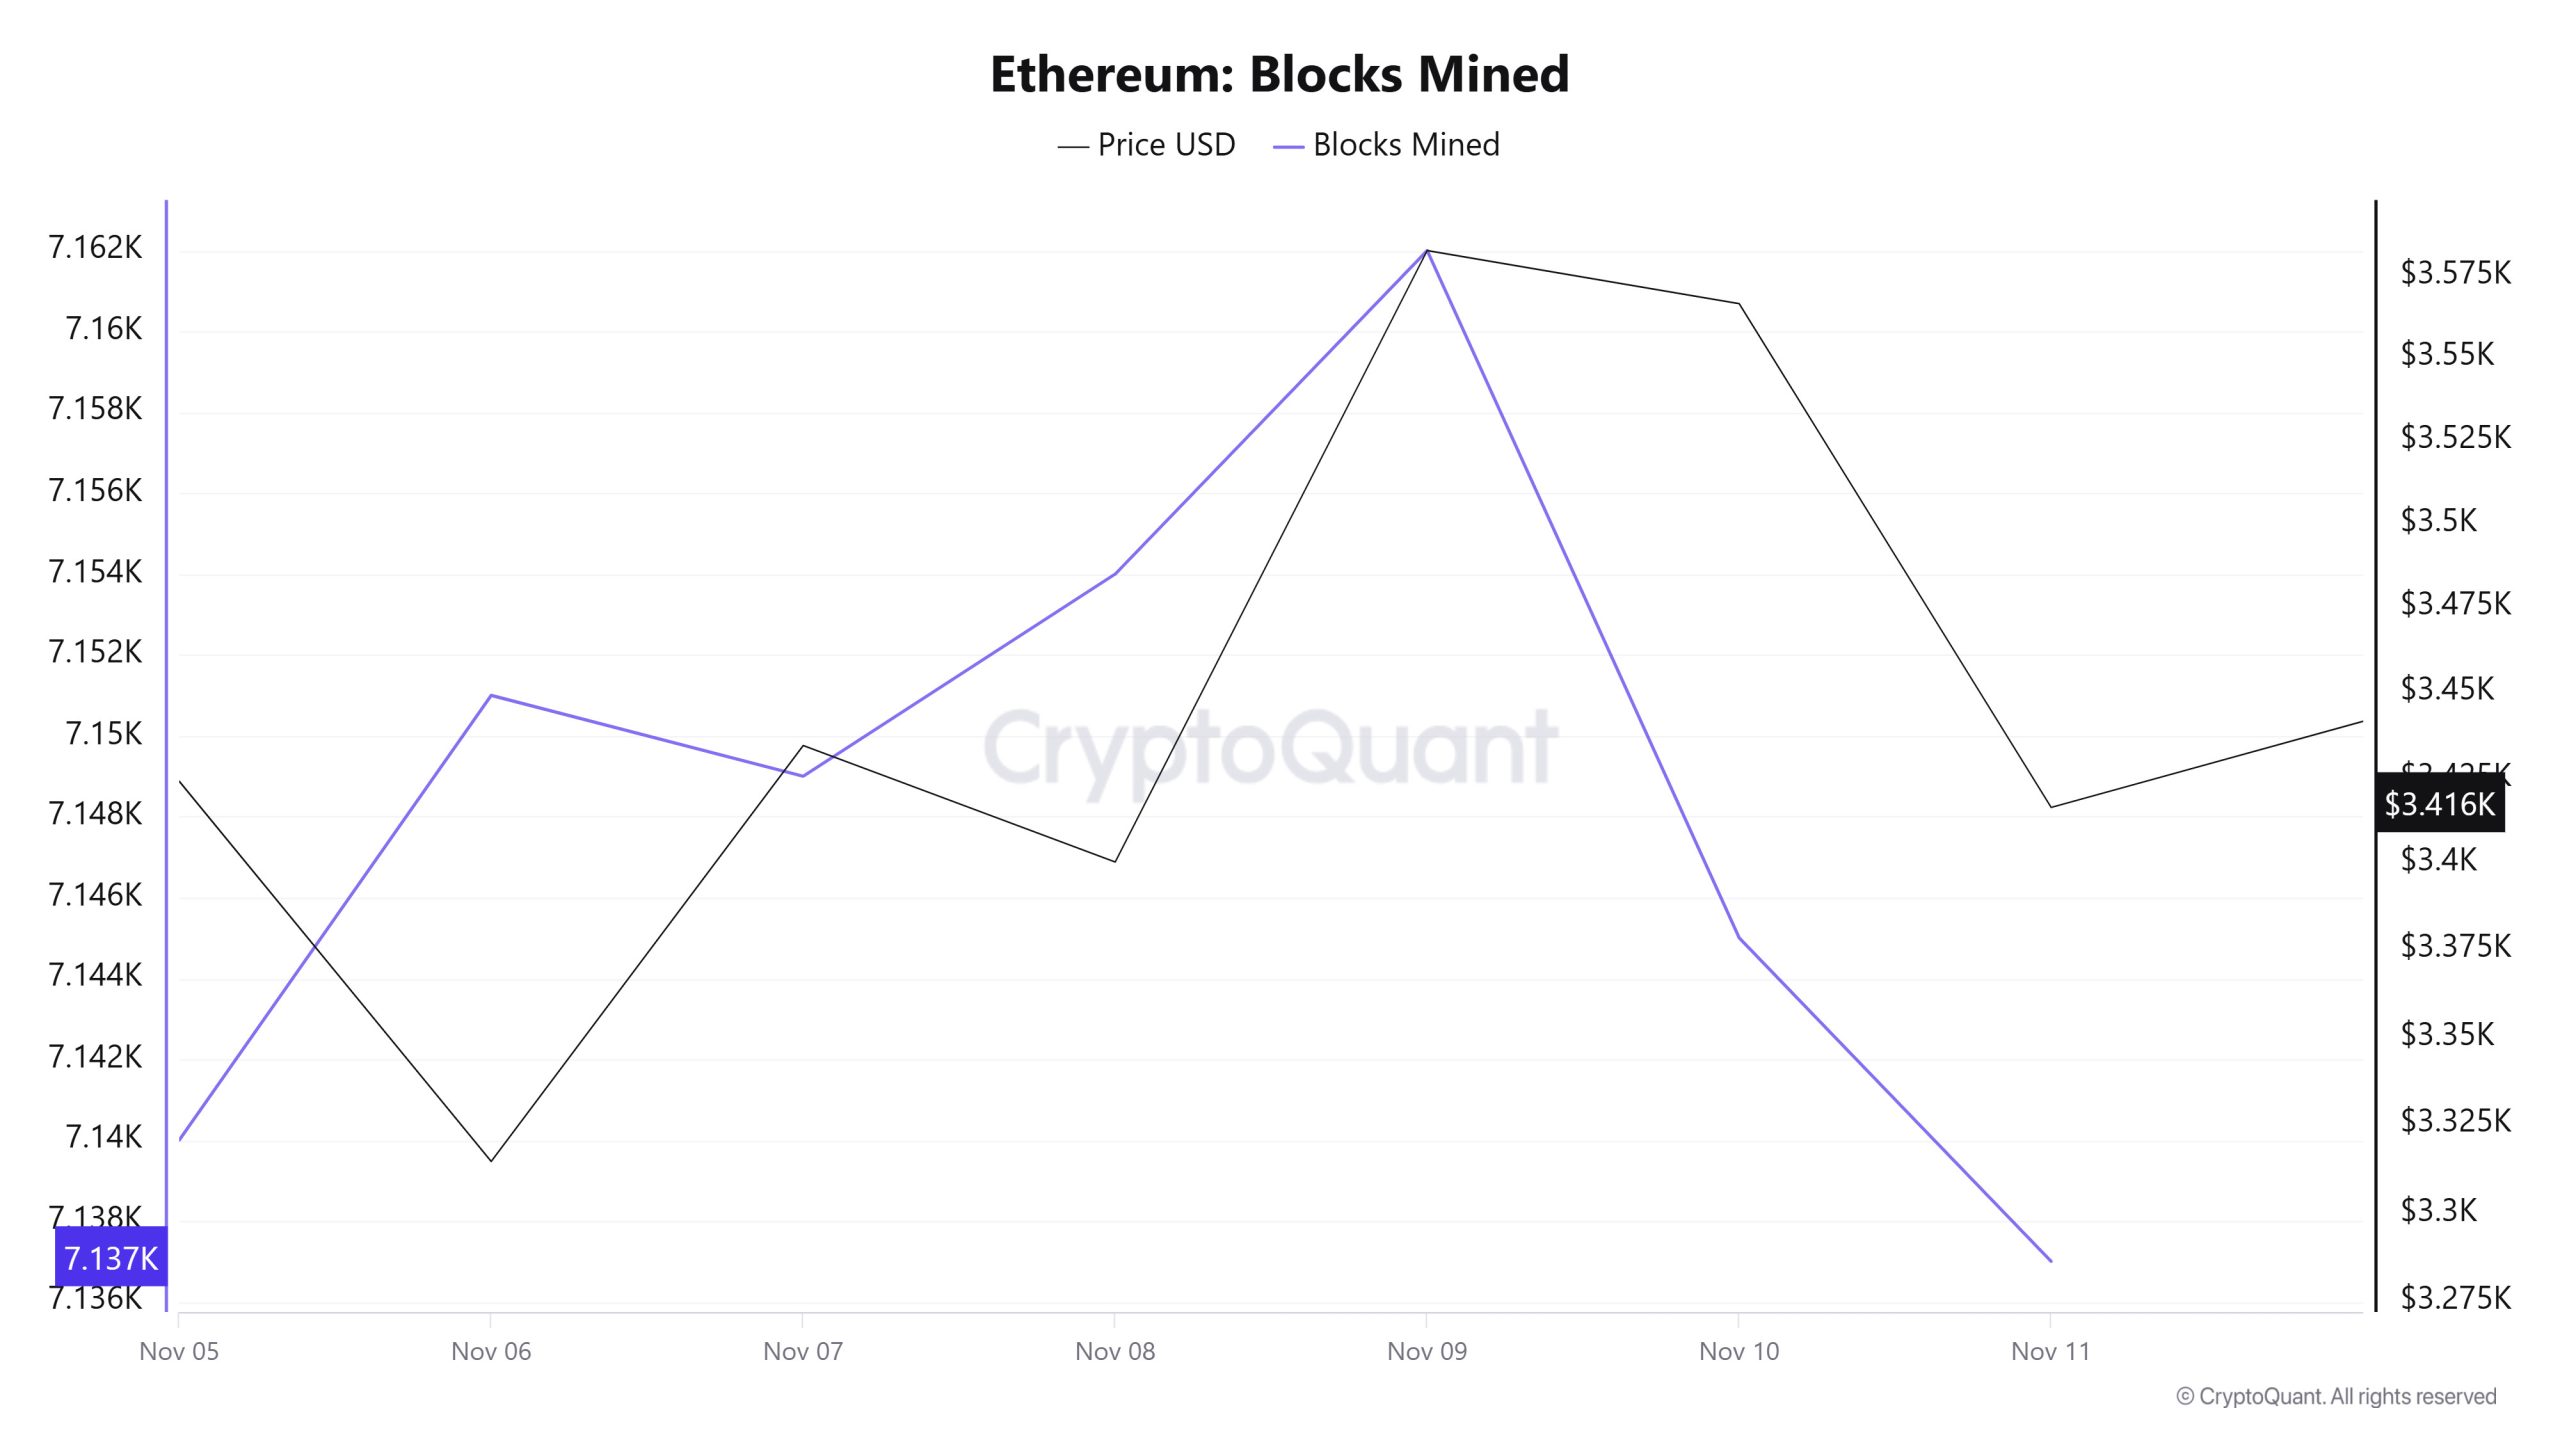
When examining Ethereum block production data between November 5 and 11, a slight decrease was observed throughout the week. While 7,140 blocks were produced on November 5, this number declined to 7,137 by November 11.
During the period in question, a time-dependent correlation structure was observed between the Ethereum price and the number of blocks produced. However, the general trend reveals that a positive correlation between these two variables is dominant.
Block Size

When examining Ethereum block production data between November 5 and 11, a slight decrease was observed throughout the week. While 7,140 blocks were produced on November 5, this number decreased to 7,137 as of November 11.
During the period in question, a time-dependent correlation structure was observed between the Ethereum price and the number of blocks produced. However, the general trend reveals that a positive correlation between these two variables is dominant.
Block Interval
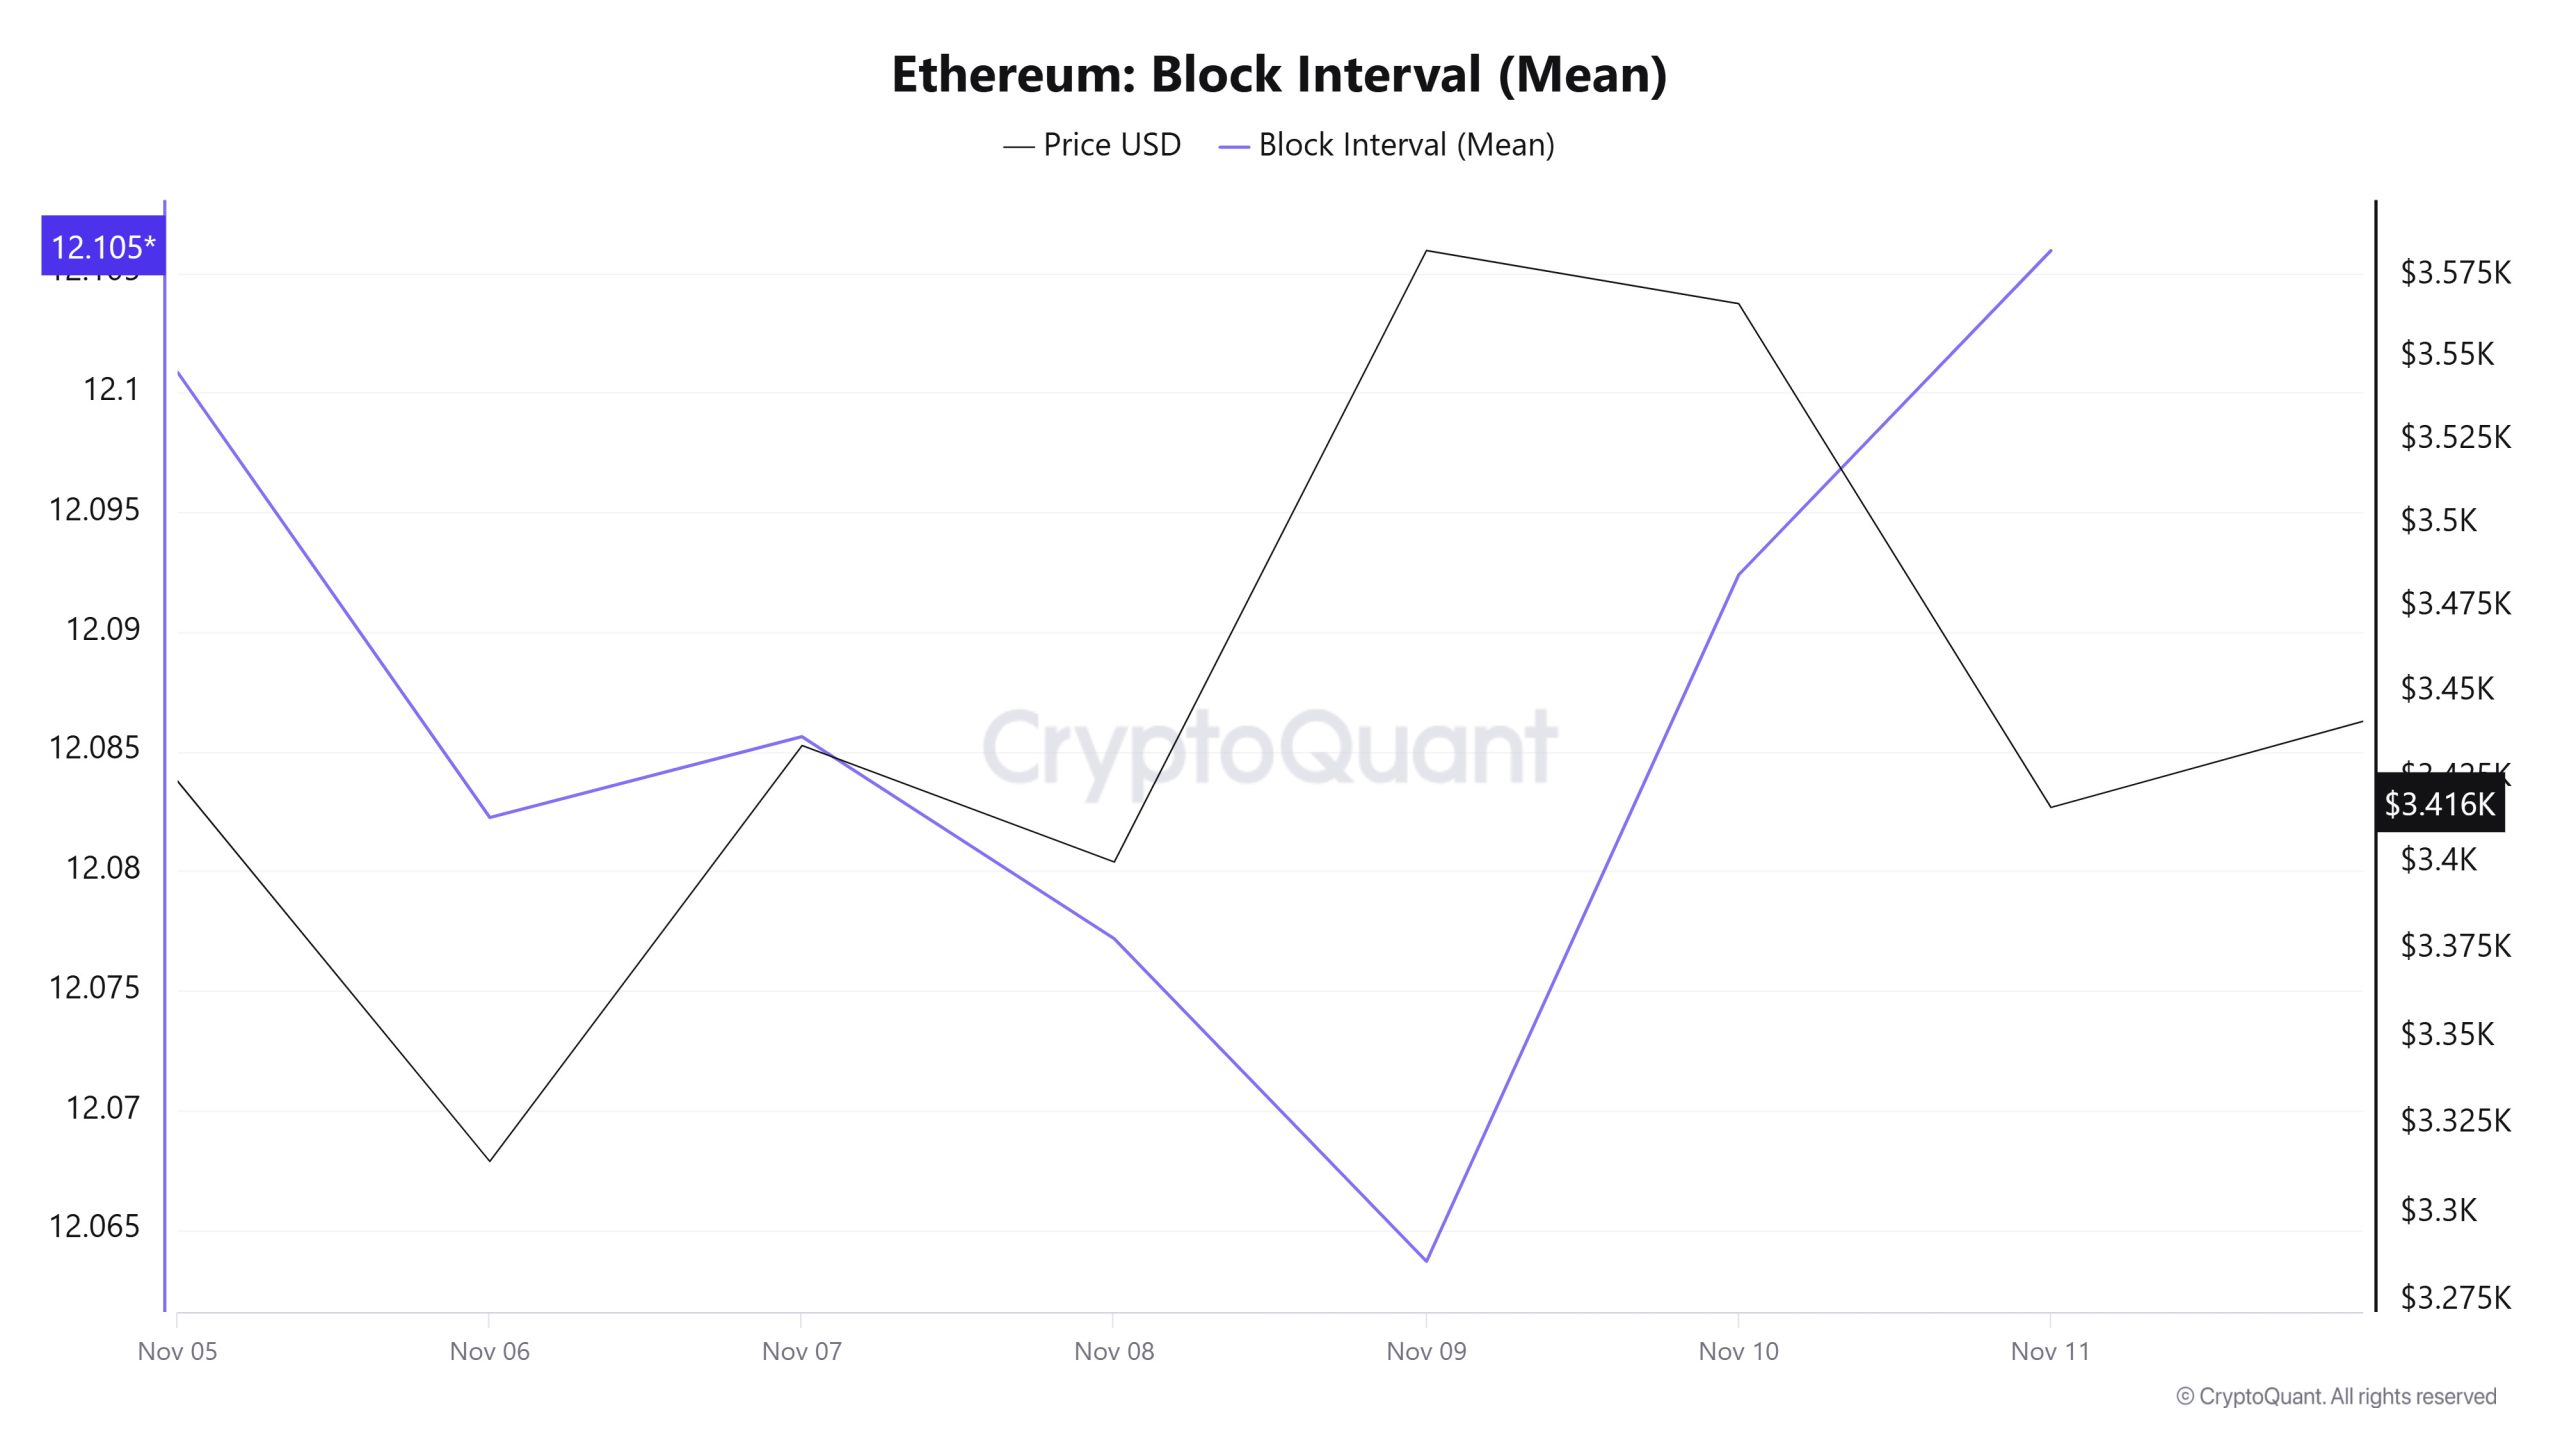
When examining the Ethereum block time between November 5 and 11, no change occurred throughout the week. While the average block time was recorded as 12.10 seconds on November 5, it was again 12.10 seconds as of November 11.
During this period, a time-dependent correlation structure was observed between the Ethereum block time and price movement. However, the general trend indicates that a negative correlation between these two variables is dominant.
Transaction
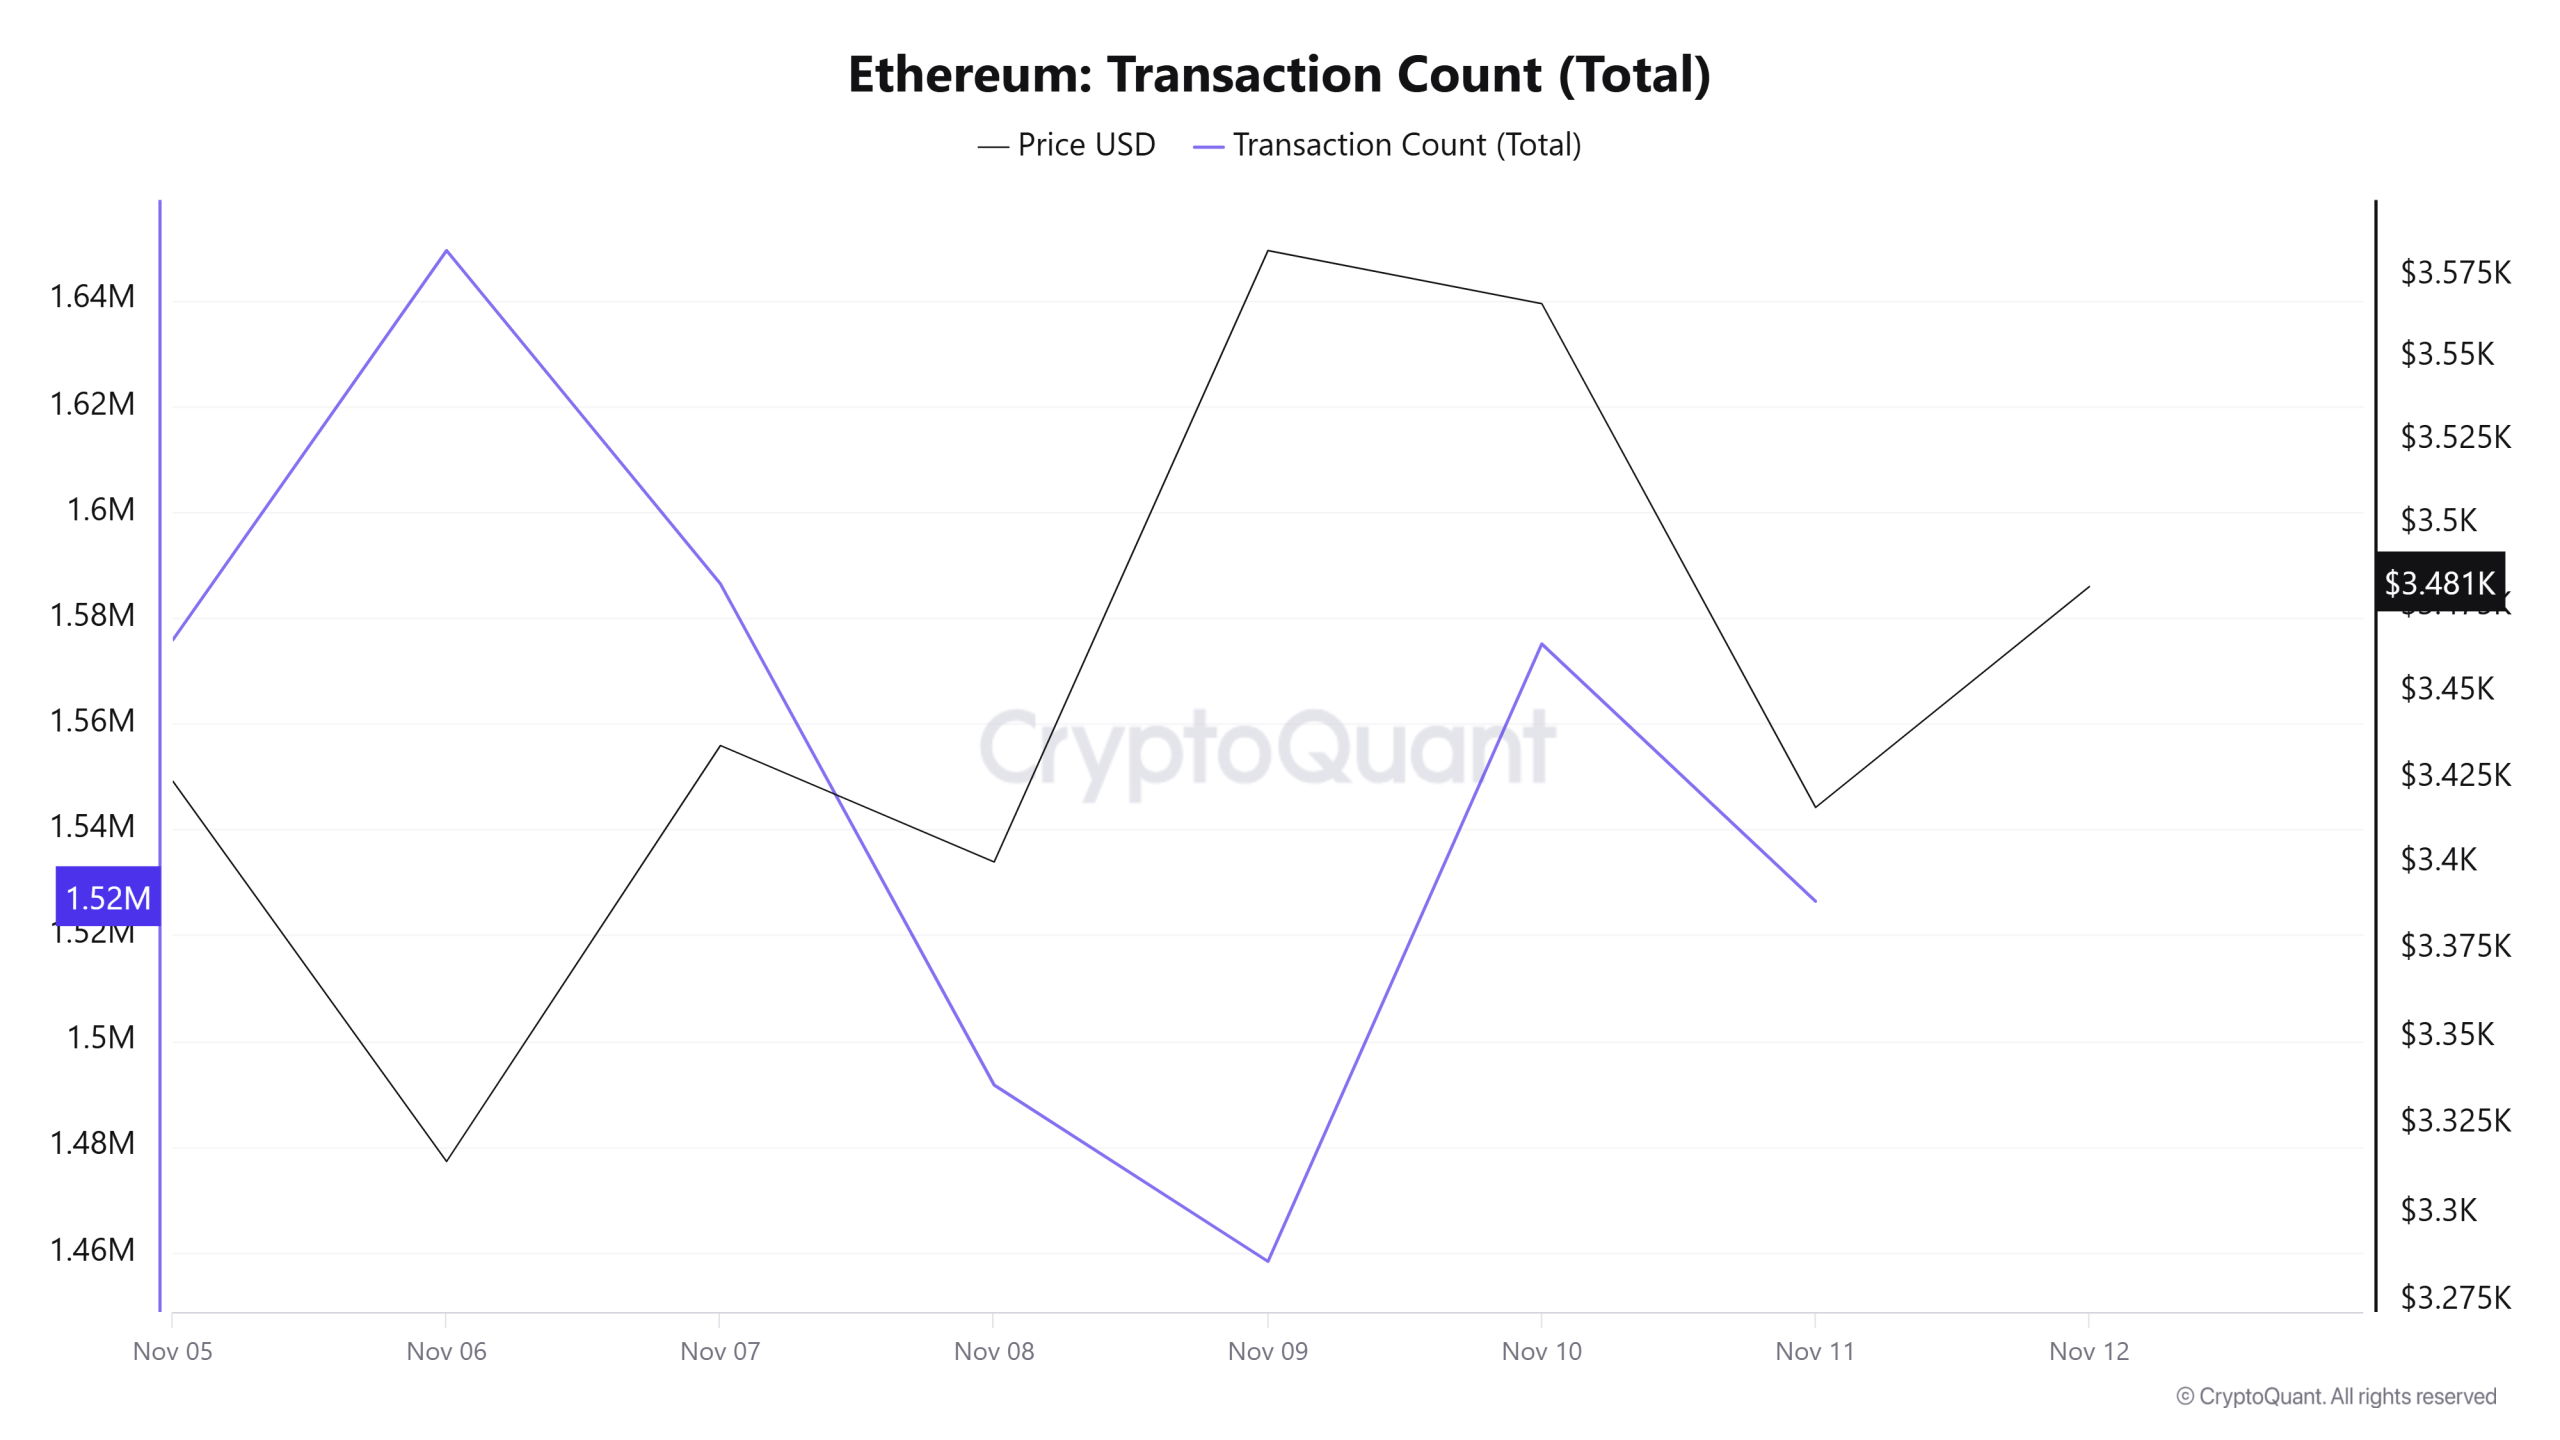
While a total of 11,859,662 transactions were executed on the Ethereum network last week, this week the number of transactions decreased by approximately 8.4% to 10,862,898. The highest weekly transaction count was recorded on November 6 at 1,649,380, while the lowest was on November 9 at 1,458,302. The correlation between transaction volume and price showed a predominantly negative trend throughout the week. This suggests that activity on the network was largely driven by sell-side transactions. Meanwhile, the lower stability of network activity compared to the previous period indicates a weakening of transaction momentum on the Ethereum network.
Tokens Transferred
The total amount of ETH transferred between last week and this week increased by approximately 13.3%, rising from 11,286,569 to 12,791,470. The highest weekly transfer occurred on November 5 at 3,117,181 ETH, while the lowest transfer was on November 8 at 639,471 ETH. Combined with the nearly 600% change in daily transfer amounts and the decrease in transaction numbers, the on-chain activity seen on Ethereum raises strong suspicions that major stakeholders or those seeking to become major stakeholders are intensively changing hands on Ethereum. This change of hands during the period may indicate that partial upward purchases were more dominant on the network.
Estimated Leverage Ratio
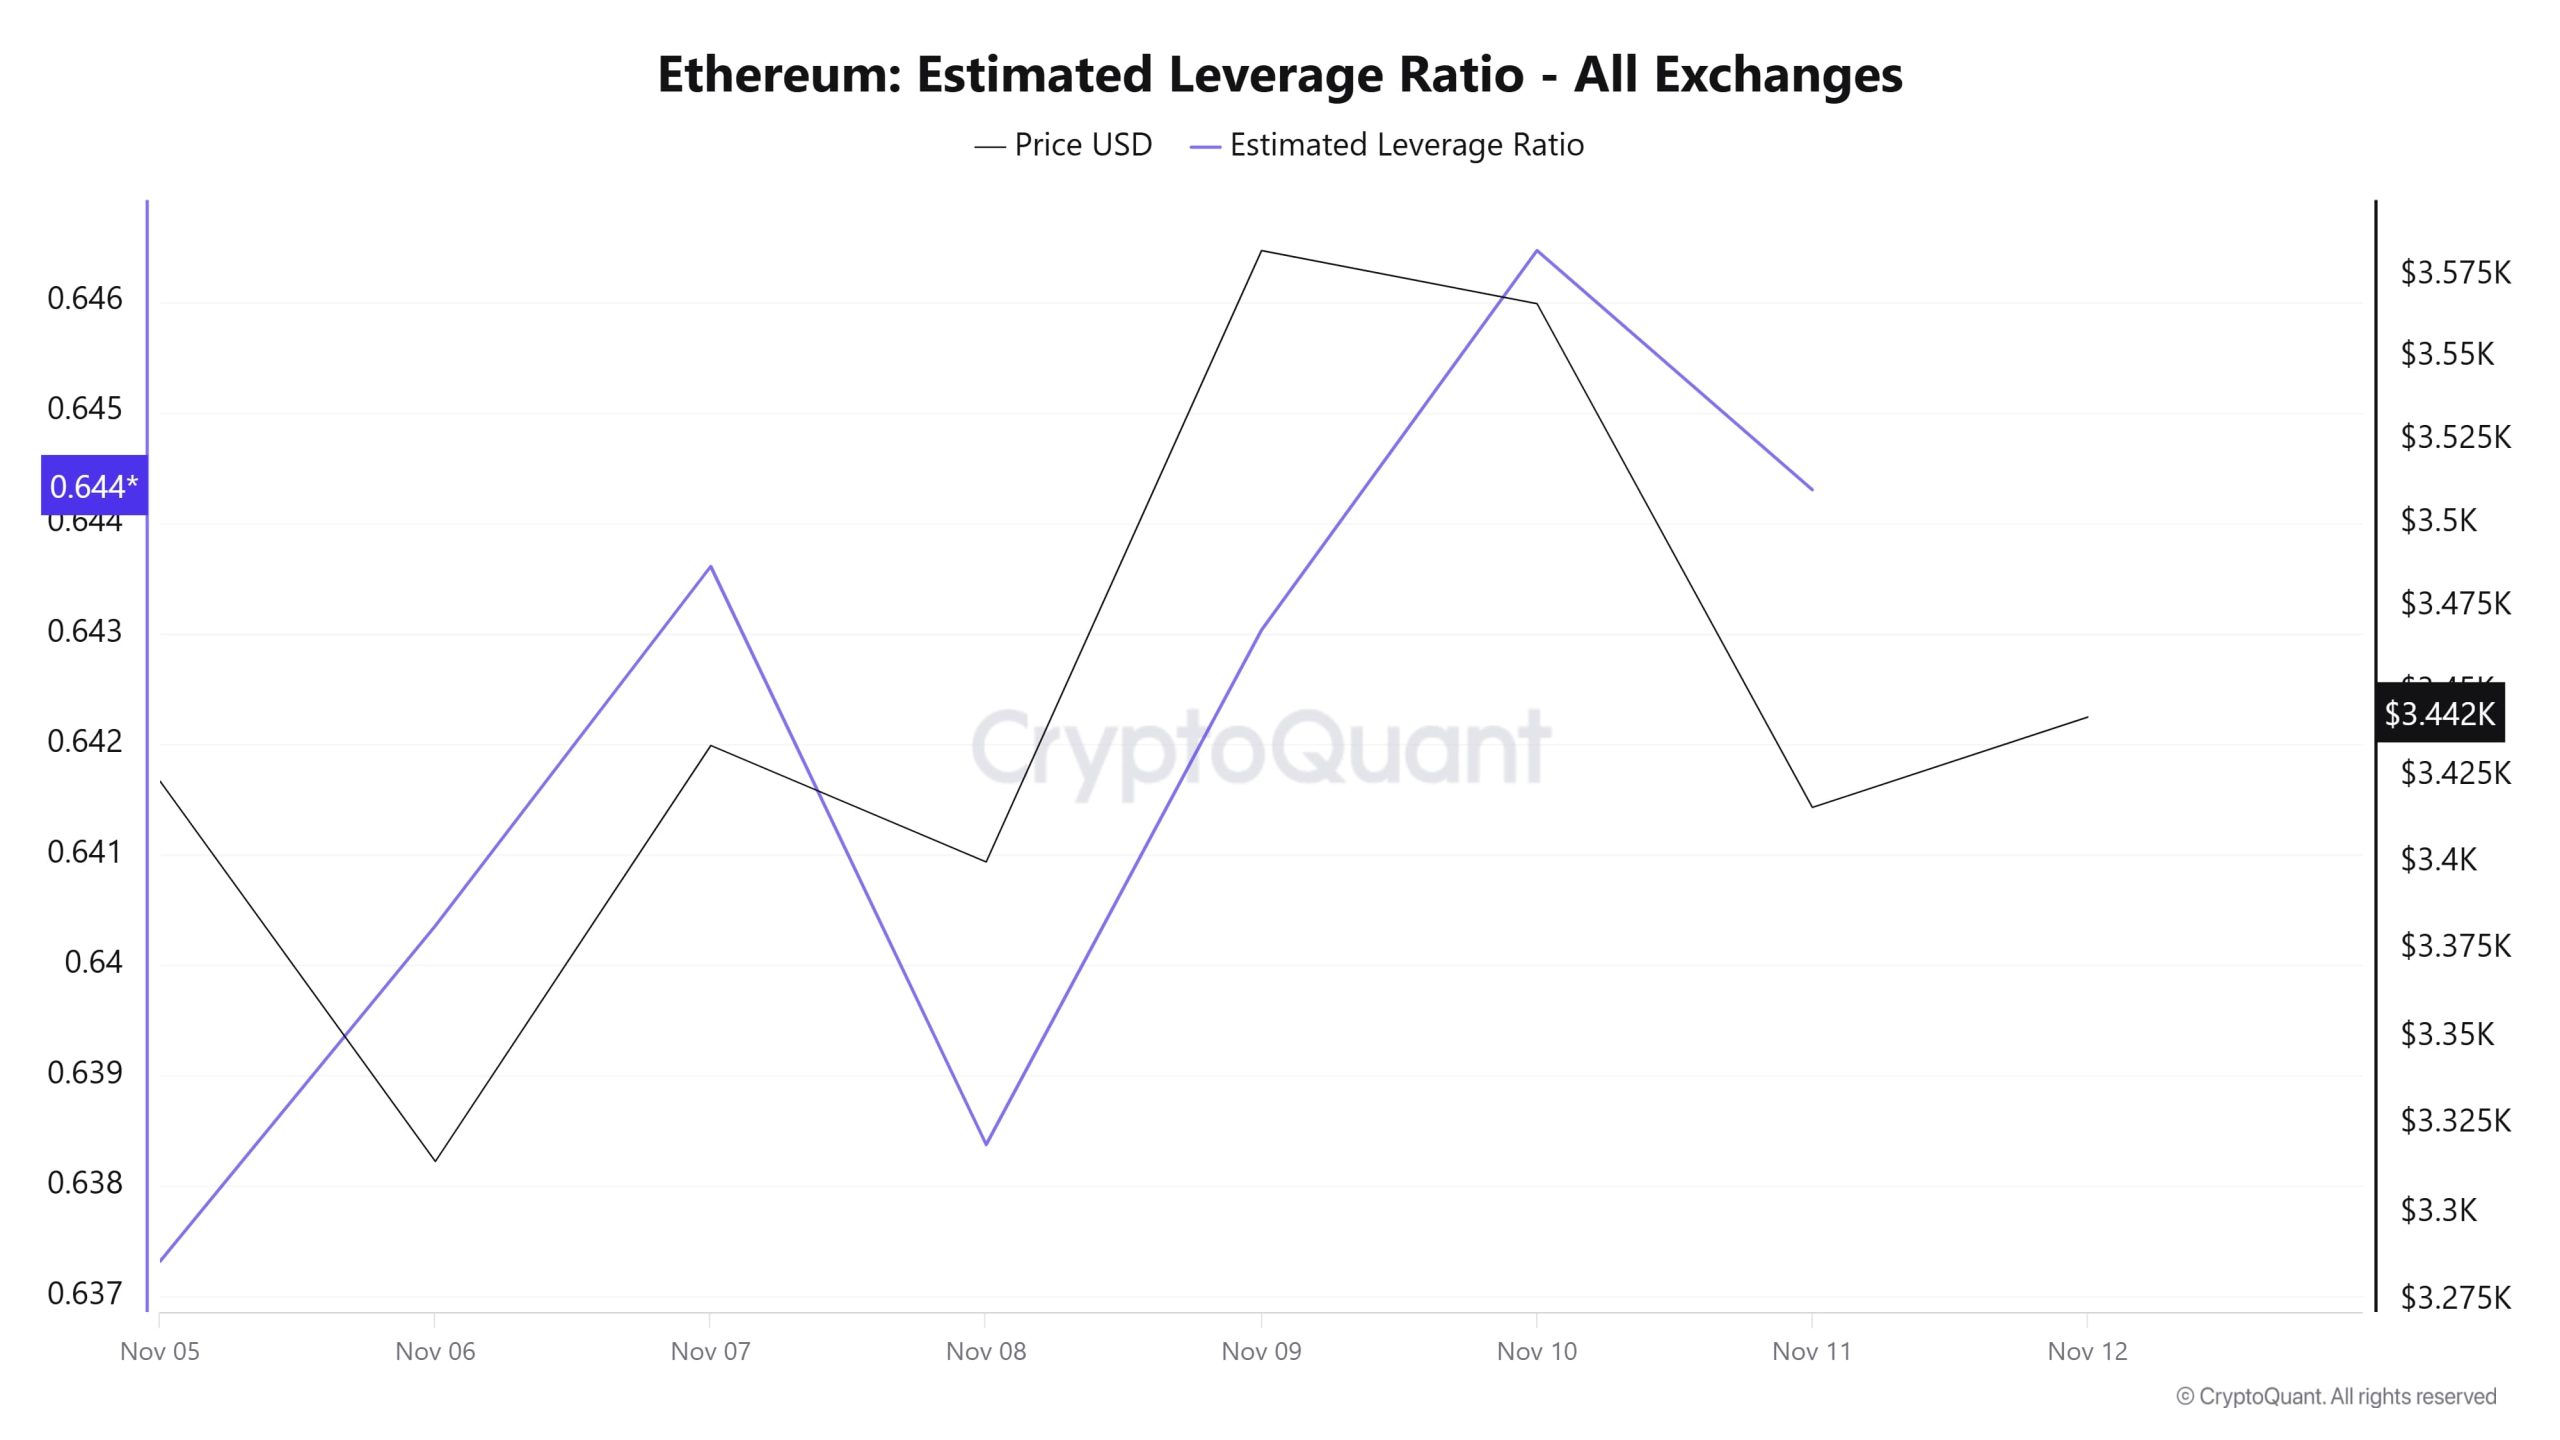
Over the 7-day period, the metric showed a steady increase from start to finish. The ELR (Estimated Leverage Ratio), which stood at 0.637 on November 5, the start of the period, also marked the lowest point of the process. The metric then began to rise, reaching its peak on November 10 at a value of 0.646. At the time of writing, the metric stands at 0.644, indicating a slight decline in investor appetite. A higher ELR implies that participants are more willing to take on risk and typically indicates bullish conditions or expectations. It should be noted that these increases may also stem from a decline in reserves. Looking at Ethereum reserves, there were 15.67 million reserves at the beginning of the process, but this figure declined further during the rest of the process and currently stands at 15.51 million. At the same time, Ethereum’s Open Interest was $38.19 billion at the beginning of the process. As of now, the volume has shown a slight increase during the process, and the open interest value stands out at $38.61 billion. With all this data, the ELR metric experienced a balanced increase throughout the process. The price of the asset fluctuated between $3,200 and $3,650 with all this data. As of now, investors’ and traders’ risk appetite appears balanced. Consequently, the stable volume of open interest data throughout the process, coupled with the decline in reserves, indicates that the rise in the ELR ratio is artificial. This, in turn, shows us that there is no appetite in the market.
ETH Onchain Overall
| Metric | Positive 📈 | Negative 📉 | Neutral ➖ |
|---|---|---|---|
| Active Addresses | ✓ | ||
| Total Value Staked | ✓ | ||
| Derivatives | ✓ | ||
| Supply Distribution | ✓ | ||
| Exchange Supply Ratio | ✓ | ||
| Exchange Reserve | ✓ | ||
| Fees and Revenues | ✓ | ||
| Blocks Mined | ✓ | ||
| Transaction | ✓ | ||
| Estimated Leverage Ratio | ✓ |
*The metrics and guidance provided in the table do not alone explain or imply any expectation regarding future price changes in any asset. Digital asset prices can fluctuate based on numerous variables. The on-chain analysis and related guidance are intended to assist investors in their decision-making process, and basing financial investments solely on the results of this analysis may lead to unfavorable outcomes. Even if all metrics produce positive, negative, or neutral results simultaneously, the expected outcomes may not materialize depending on market conditions. It would be beneficial for investors reviewing the report to take these warnings into consideration.
Legal Notice
The investment information, comments, and recommendations contained in this document do not constitute investment advisory services. Investment advisory services are provided by authorized institutions on a personal basis, taking into account the risk and return preferences of individuals. The comments and recommendations contained in this document are of a general nature. These recommendations may not be suitable for your financial situation and risk and return preferences. Therefore, making an investment decision based solely on the information contained in this document may not result in outcomes that align with your expectations.
NOTE: All data used in Ethereum on-chain analysis is based on CryptoQuant.
