
Technical Analysis
BTC/USDT
Treasury Secretary Scott Bessent stated that the government shutdown had only limited effects on the economy and announced that new customs duty decisions would be announced in the coming days. According to a Reuters poll, the vast majority of economists expect the Fed to cut interest rates by 25 basis points in December. Meanwhile, publicly traded companies purchased 195K BTC in the third quarter, demonstrating continued institutional demand for Bitcoin. China accused the US of stealing 127,272 BTC (approximately $13 billion) in 2020.
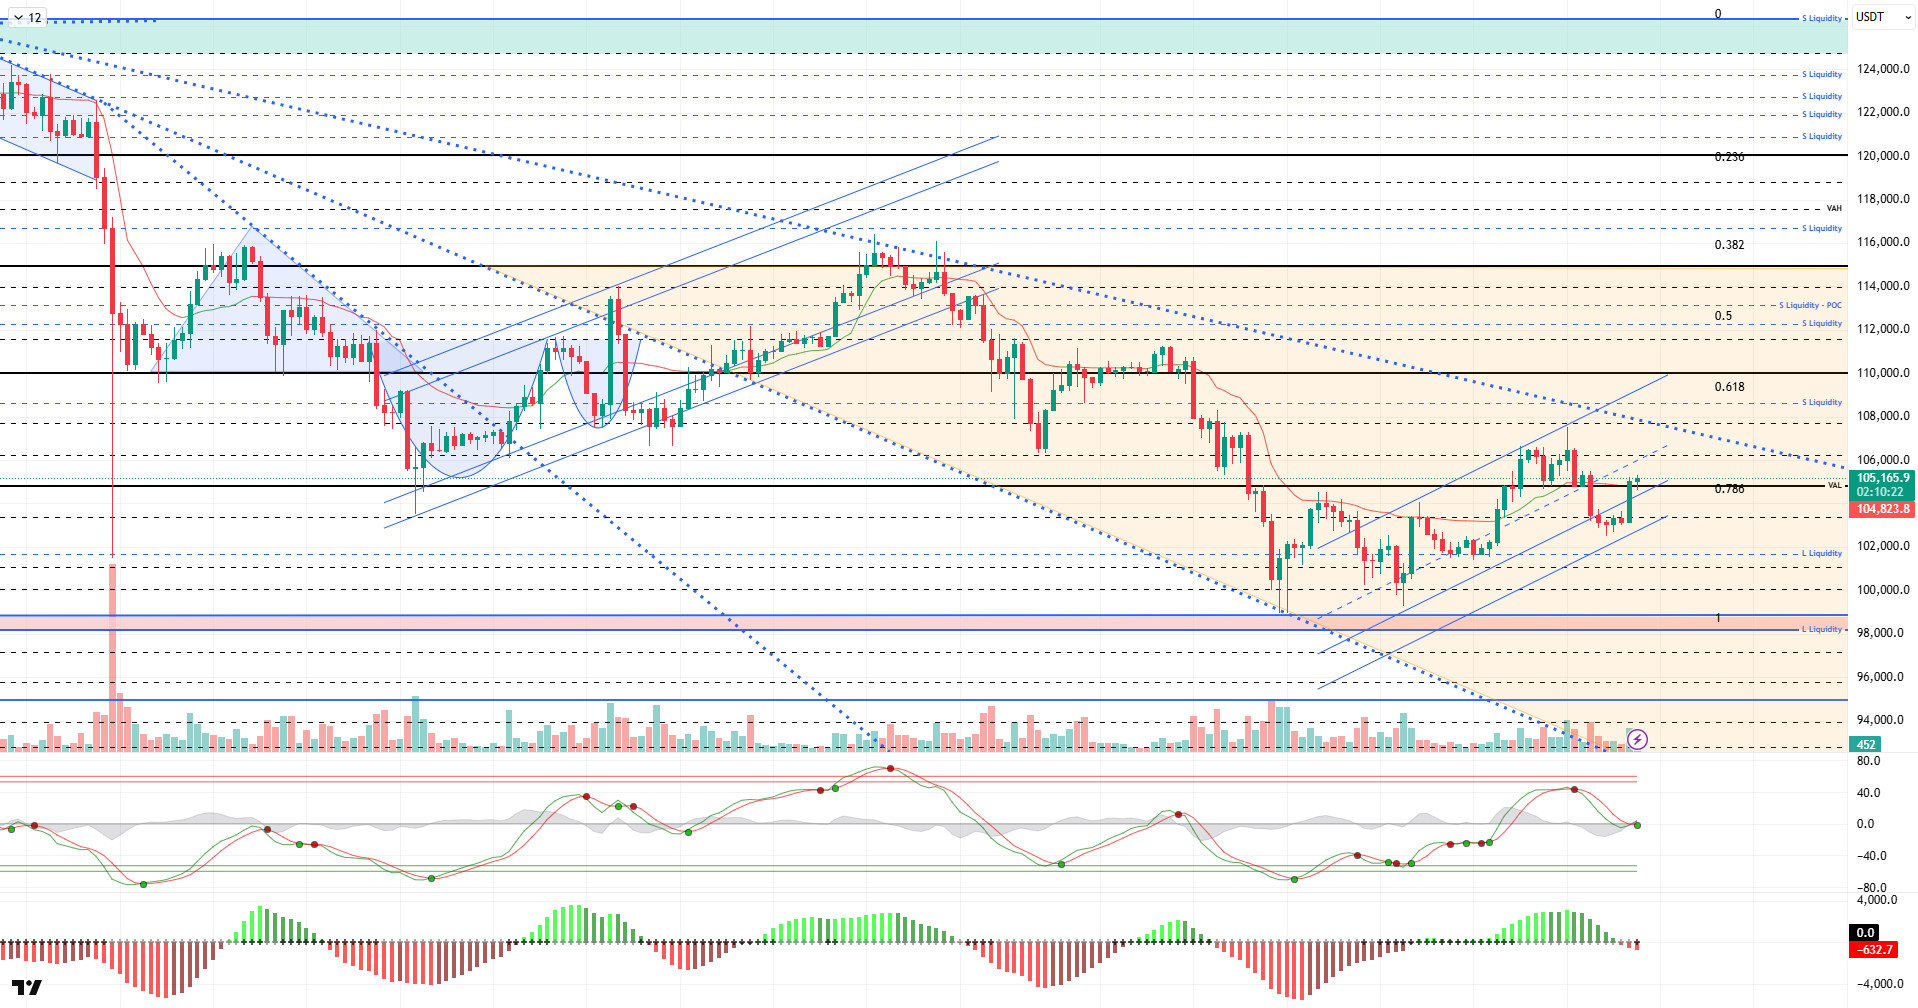
From a technical perspective, BTC tested resistance levels again in the previous analysis, first breaking through 103,300 and then 105,000. The price, which re-entered the trend from within the trend extension in the minor uptrend channel it formed, continues to trade at 105,100 at the time of writing.
Technical indicators produced a buy signal in the middle band of the parallel channel, parallel to the sell signal given by Wave Trend (WT) in the overbought zone. The histogram is in the negative zone on the Squeeze Momentum (SM) indicator. The Kaufman moving average (KAMA) is currently at $104,800, positioned just below the price.
According to liquidation data, the sell-off level formed at 107,400 with the recent rise has been liquidated. In a broader time frame, the 112,000 level appears as the point where accumulation is maintained. On the other hand, while the 104,000 band was liquidated in the buy level, it resulted in partial liquidation in the 102,000-104,000 range. With the latest decline, trading clusters formed at the 101,000–102,000 level. In a broader time frame, the buying level maintains its accumulation at the 98,000 level.
In summary, the Senate agreement on reopening the US government stood out as an optimistic development. While uncertainty persists regarding the Fed’s interest rate cuts, Trump’s statements on tariff revenues have reignited debate. In liquidity data, the dominance of the selling level was one of the main factors pushing the price up. Technically, the price continues to move within a minor upward channel for now, while the 105,000 reference level continues to be challenged. The price’s potential to regain the 105,000 area with a new catalyst will continue to be monitored as a top priority, and if it breaks through, the 107,400 resistance will be watched. On the other hand, the 101,800 support level comes into play in the event of potential selling pressure.
Supports: 101,800 – 100,000 – 98,000
Resistances: 103,300 – 105,000 – 106,600
ETH/USDT
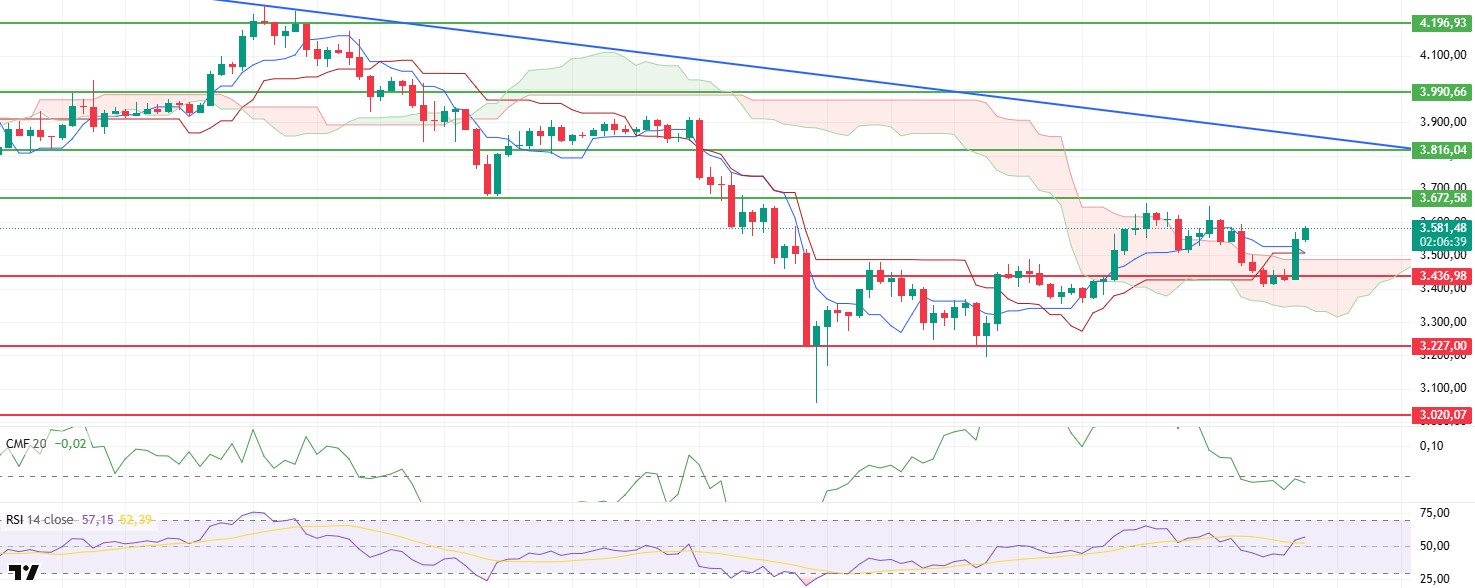
The ETH price rose throughout the day, climbing to $3,590 levels after rebounding from the $3,436 support level. While this intraday recovery indicates that buyers have regained strength in the support zone, some technical weaknesses regarding the sustainability of the uptrend are noteworthy. In particular, the lack of volume support as the price approaches the resistance zone creates a cautious outlook in the short term.
The Chaikin Money Flow (CMF) indicator did not accompany the price increase and remained in negative territory. This structure reveals that the upward movement was not supported by strong spot liquidity inflows and that purchases were more of a short-term reaction. This weakness in the CMF continues to pose a risk to the sustainability of the uptrend.
The Relative Strength Index (RSI) indicator breaking above both the base MA and the 50 level, however, signals strengthening momentum. This positive outlook in the RSI stands out as the most important factor supporting upward price movements in the short term.
According to the Ichimoku indicator, while the price breaking above the upper band of the Kumo cloud and rising above the Tenkan level is a supportive factor for the overall structure, the Tenkan line approaching a downward crossover with the Kijun level is noteworthy. If this crossover occurs, it could signal sharp downward movements in the short term.
Overall, there is a clear imbalance among the indicators. The CMF remaining in negative territory and the potential crossover risk in the Ichimoku indicator suggest that downward pressure could continue as long as the price fails to break above the $3,672 level. However, if the price manages to hold above this level, the negative outlook could weaken and the upward momentum could regain strength.
Supports: 3,436 – 3,227 – 3,020
Resistances: 3,672 – 3,816 – 3,990
XRP/USDT
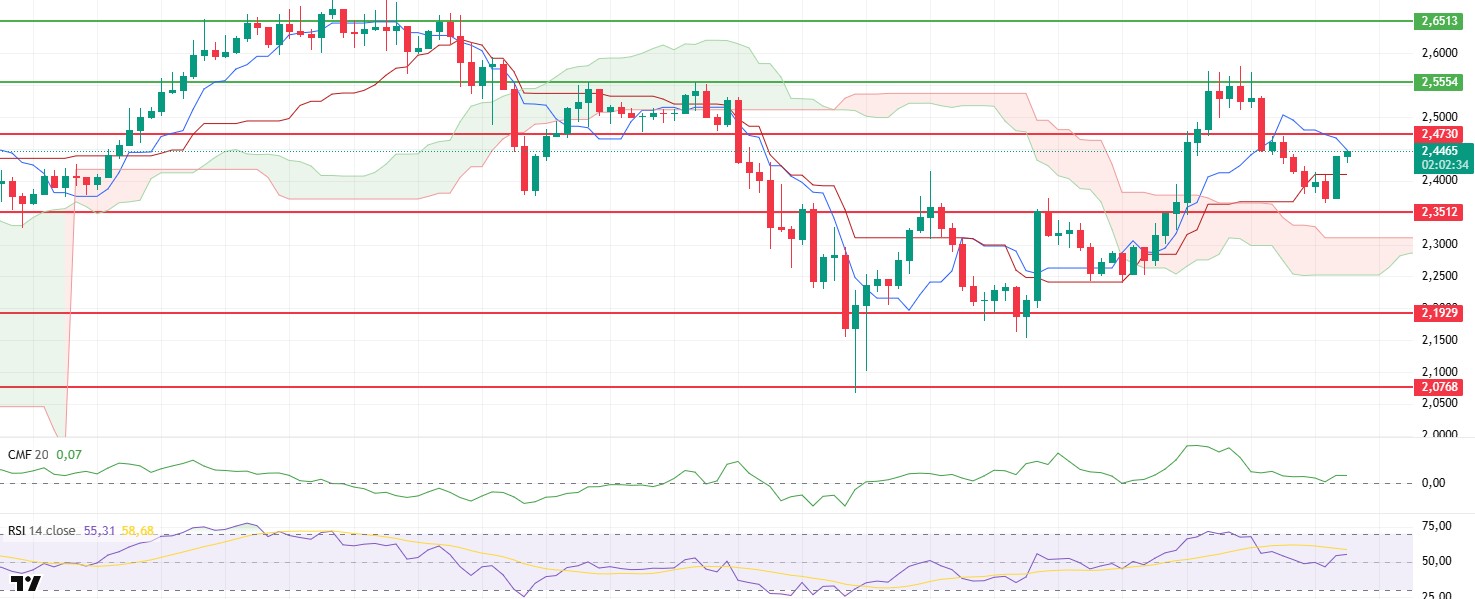
The XRP price rebounded from the $2.35 level during the day, rising to around $2.45. This intraday movement indicates that buyers have re-entered the market in the short term and reacted to selling pressure. However, the price’s failure to break above the $2.47 resistance level reveals that the market is still searching for direction.
The Chaikin Money Flow (CMF) and Relative Strength Index (RSI) indicators gaining strength and moving into positive territory support signals of a short-term recovery in the market. The liquidity inflows in the CMF and the momentum increase in the RSI stand out as important technical signals indicating that buyers are beginning to regain control.
The recovery of the Tenkan and Kijun levels in the Ichimoku indicator also reveals that the price is gaining strength from a technical perspective. The Kumo cloud maintaining its current structure indicates that the overall trend will remain positive in the medium term.
The overall outlook indicates that the $2.47 level will be monitored as critical resistance in the short term. If the price breaks above this level, upward momentum could gain strength and the upward trend could accelerate. However, if the $2.47 level cannot be broken, the possibility of renewed selling pressure and a pullback towards the $2.35 level will remain on the agenda.
Supports: 2.3512 – 2.1929 – 2.0768
Resistances: 2.4730 – 2.5554 – 2.6513
SOL/USDT
Alameda unlocked $30 million worth of tokens, equivalent to 193,000 SOL.
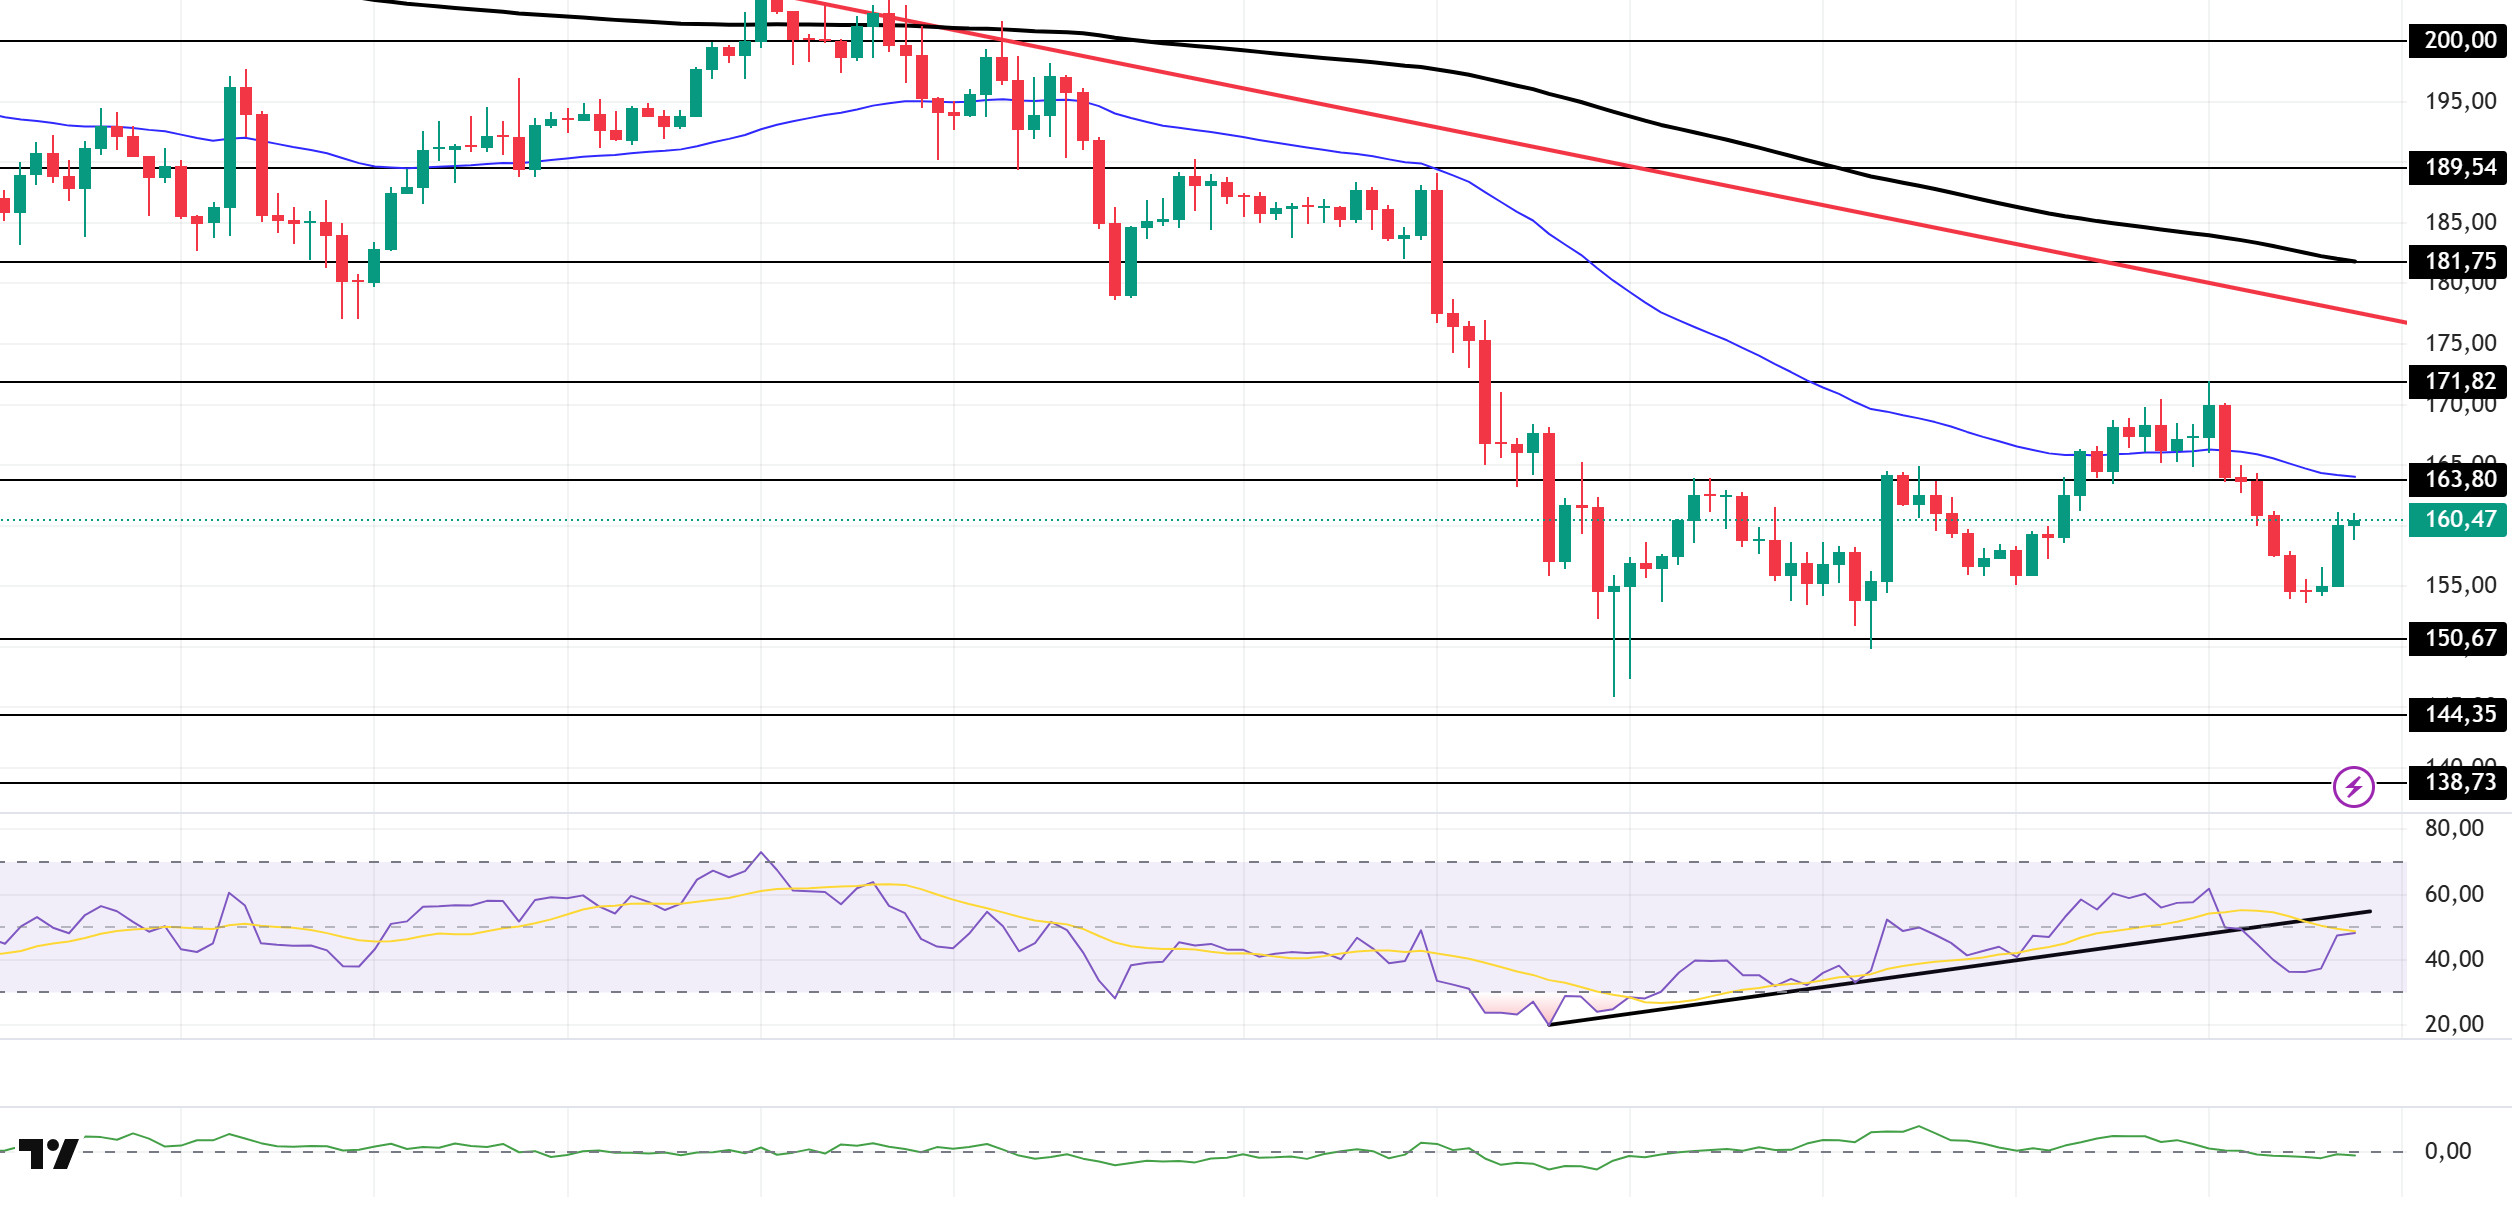
The SOL price experienced an uptick during the day. The asset remained in the lower region of the downtrend that began on October 6. The price deepened its decline by breaking below the 50 EMA (Blue Line) moving average. Currently, the price is poised to test the strong resistance level at $163.80 and the 50 EMA moving average. If the price closes above these levels, they could act as resistance in the downtrend. If the pullback deepens, the $150.67 level could act as support.
The price remained below the 50 EMA (Exponential Moving Average – Blue Line) and 200 EMA (Black Line) on the 4-hour chart. This indicates a potential downtrend in the medium term. Additionally, the price being below both moving averages suggests a downward trend in the short term. The Chaikin Money Flow (CMF-20) is at a neutral level. However, the decrease in money inflows could push the CMF into negative territory. The Relative Strength Index (RSI-14) showed a slight increase, rising to the upper level of the negative zone. At the same time, it remained below the upward trend that began on November 4. This indicated increased selling pressure. If there is an uptrend due to macroeconomic data or positive news related to the Solana ecosystem, the $171.82 level stands out as a strong resistance point. If this level is broken upwards, the uptrend is expected to continue. If there are pullbacks due to developments in the opposite direction or profit-taking, the $138.73 level could be tested. A decline to these support levels could increase buying momentum, presenting a potential opportunity for an upward move.
Supports: 150.67 – 144.35 – 138.73
Resistances: 163.80 – 171.82 – 181.75
DOGE/USDT
Poain BlockEnergy Inc. (“Poain”) has launched an AI Smart Staking program to help DOGE holders diversify their income streams.
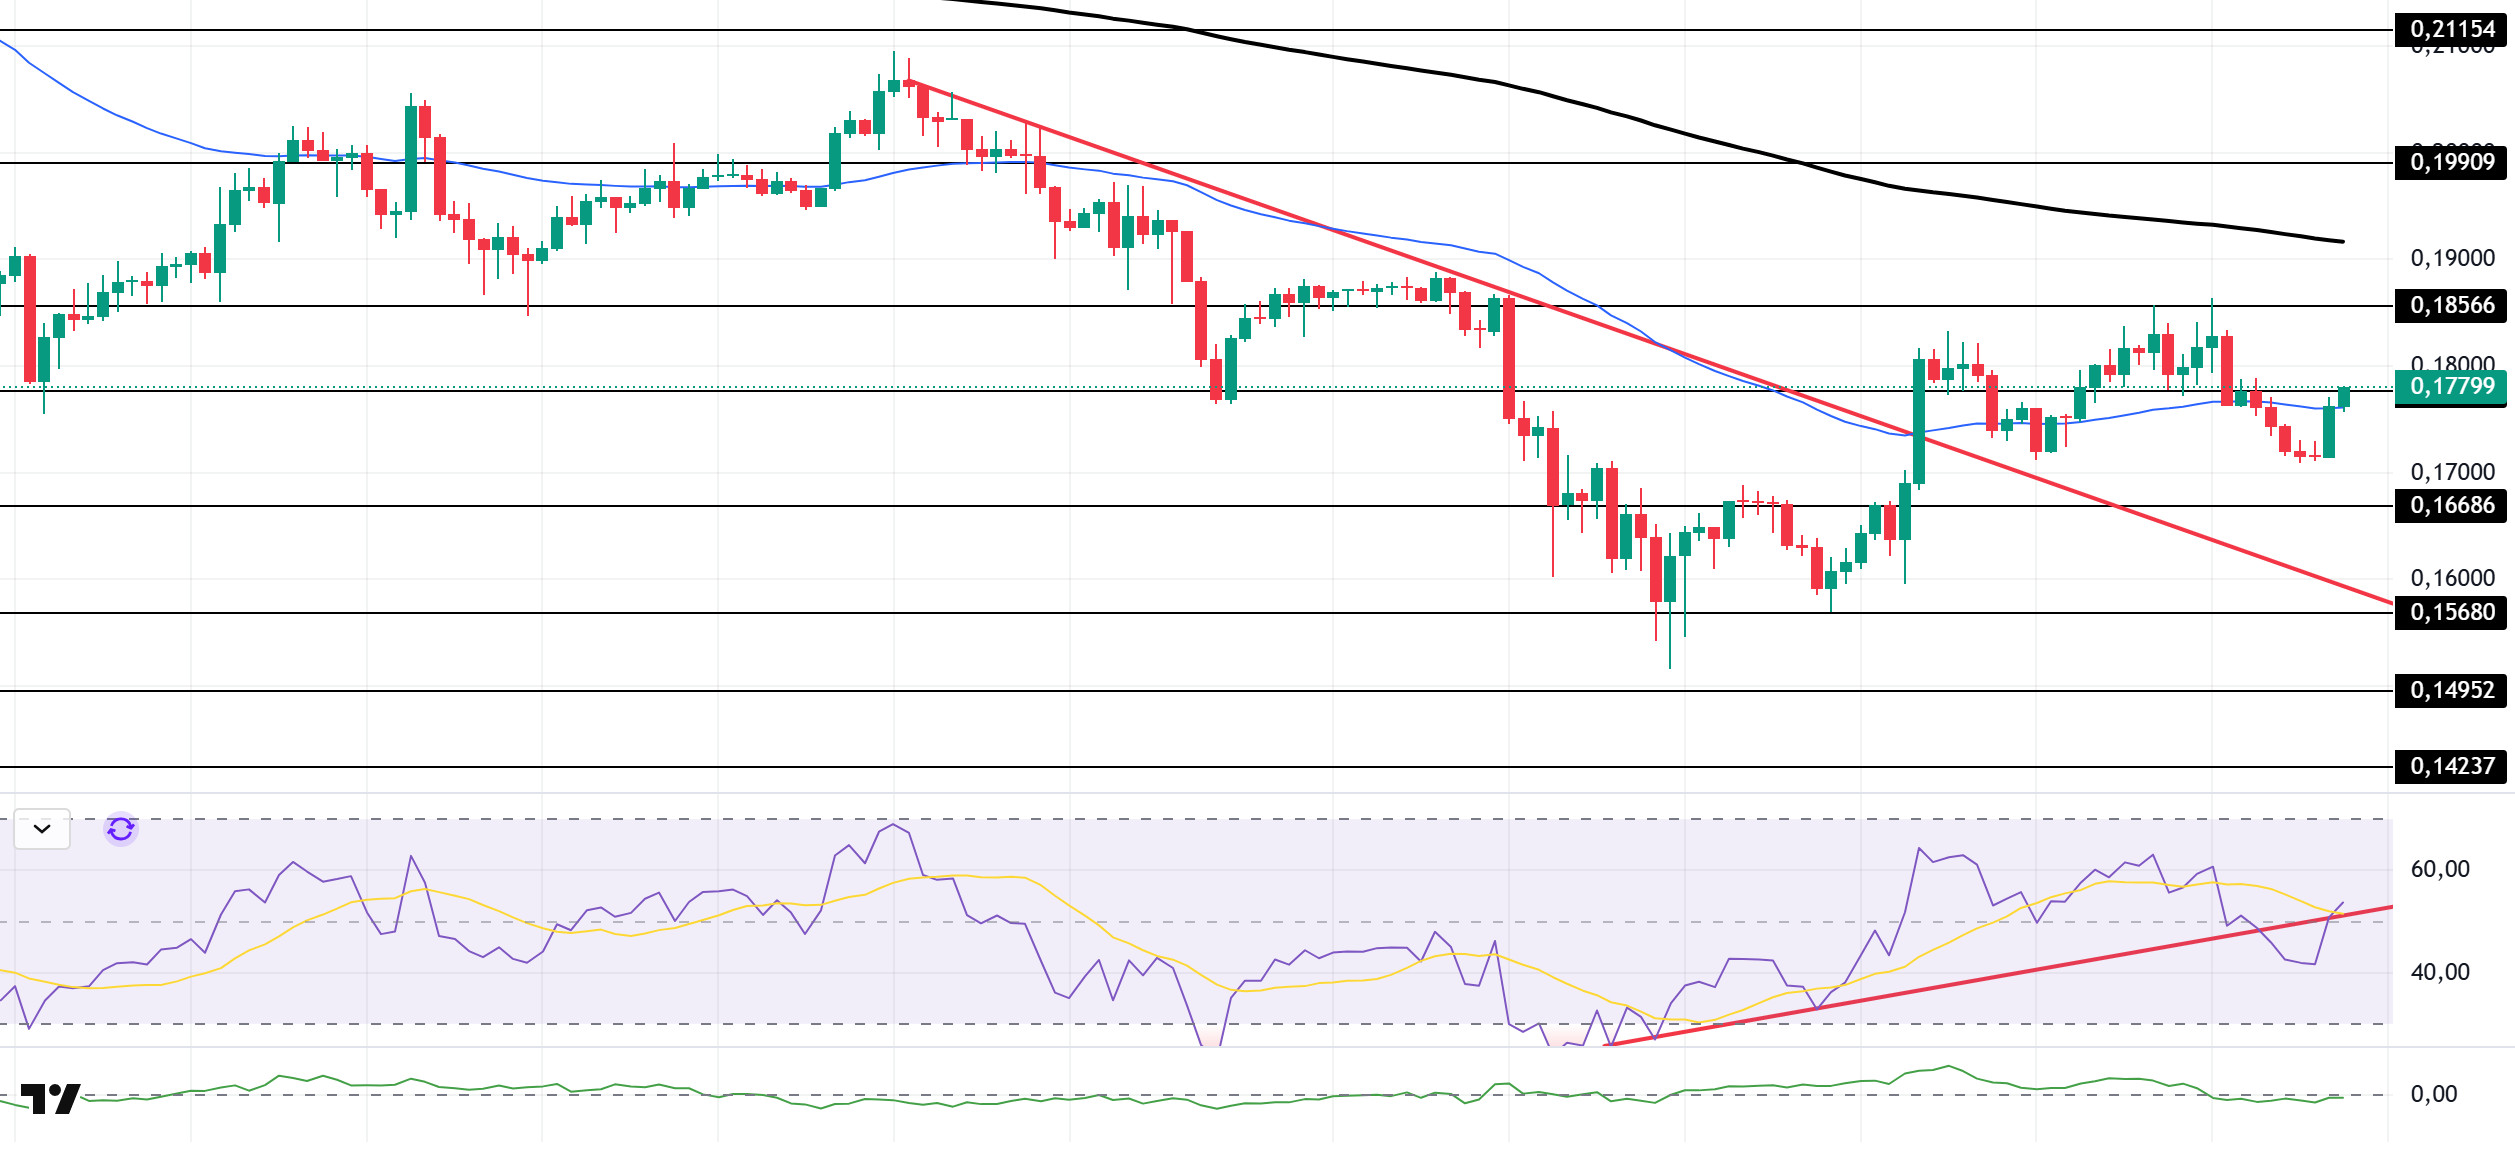
The DOGE price experienced an uptick during the day. The asset remained in the upper region of the downward trend that began on October 27. Testing the 50 EMA (Blue Line) moving average as support, the price broke below this level, deepening its decline. Currently, the asset continues its upward movement and is testing the 50 EMA moving average as resistance. If it closes above this level, it could test the $0.18566 level. If the pullback deepens, it could test the 200 EMA (Black Line) moving average as resistance.
On the 4-hour chart, the 50 EMA (Exponential Moving Average – Blue Line) remained below the 200 EMA (Black Line). This indicates that a downtrend may begin in the medium term. The price being below both moving averages shows that the price is trending downward in the short term. The Chaikin Money Flow (CMF-20) remained in the negative zone, close to the neutral zone. Additionally, an increase in money inflows could push the CMF into the positive zone. The Relative Strength Index (RSI-14) rose to the positive zone, close to the neutral zone. At the same time, it broke above the upward trend that began on November 3. This signaled increased buying pressure. In the event of potential increases driven by political developments, macroeconomic data, or positive news flow within the DOGE ecosystem, the $0.18566 level stands out as a strong resistance zone. Conversely, in the event of negative news flow, the $0.15680 level could be triggered. A decline to these levels could increase momentum and initiate a new wave of growth.
Supports: $0.16686 – $0.15680 – $0.14952
Resistances: 0.17766 – 0.18566 – 0.19909
LTC/USDT
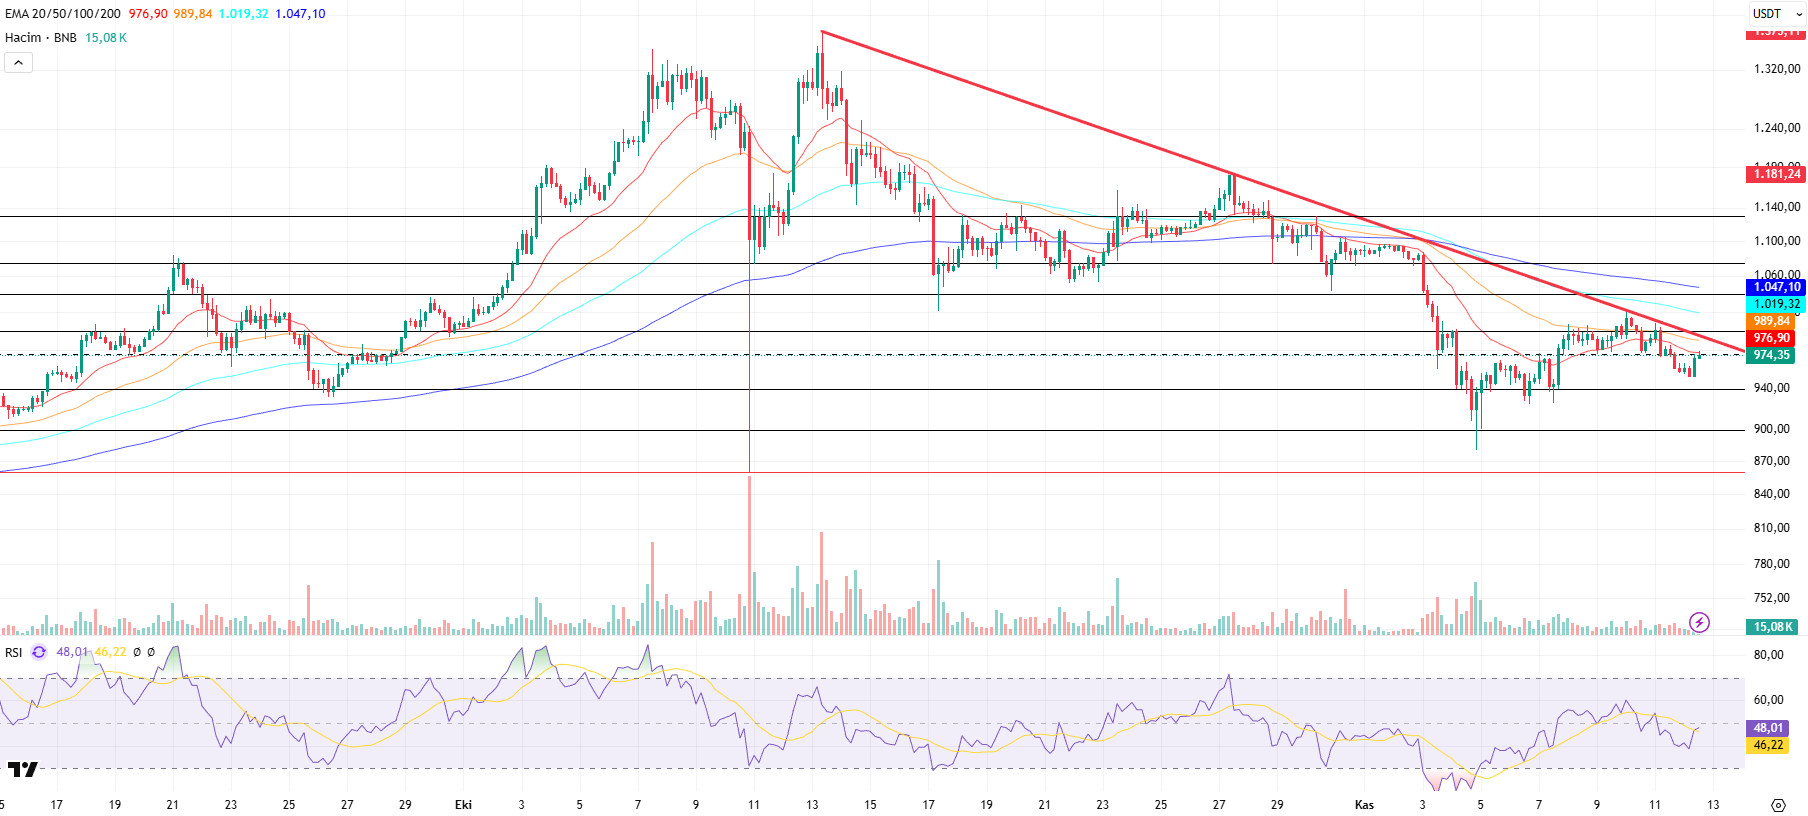
Litecoin (LTC) rose 3.88% against USDT in the first half of the day and recorded a 1.96% increase compared to Bitcoin. On the futures side, the long/short position ratio opened in the last 24 hours being at 0.9893 indicates that the downward movement expected by derivatives market participants in the first half of the day has decreased along with the rise. Funding rates were updated to neutral. This table shows that, contrary to the day’s rise, the possibility of a decline in the remainder of the day is still in high demand in the derivatives markets.
From a technical perspective, examining Litecoin’s (LTC) 4-hour USDT pair chart reveals that the price continues to trade above all moving averages but below the rising trend line. While this situation, combined with the partial weight of short positions in the derivatives market, partially strengthens expectations of a decline, it should not be forgotten that upward movements are also possible. If, contrary to expectations, an upward movement occurs, the first strong resistance level will be the horizontal resistance point at the current $106.25 level. Breaking through this level could be an important signal for the price to rise further. The next important resistance point will be the rising trend lower band at the $108.77 level. This level stands out as another critical zone where Litecoin’s price movement may pause. If breached, a potential rise to $110.35 could be expected, and it could also be considered a signal of change for short-heavy market conditions. However, at this point, the price is likely to encounter selling pressure and be rejected.
In line with expectations, if a decline occurs, the $100.38 level stands out as a stage where the price could find its first support and where short positions could be partially closed. If the price remains below this level, the 200-100-50 period moving averages (Purple-Yellow-Orange) located very close on the chart could support the price. However, if a single level must be specified, the lowest 200-period average at 96.39 could be considered the base support level. Finally, the support level that could be considered a threshold for potentially sharp movements is seen at 90.63. However, falling below all moving averages and reaching the last support level is expected only if there is a decline in the market as a whole.
Supports: 100.38 – 96.39 – 90.63
Resistances: 106.25 – 108.77 – 110.35
BNB/USDT
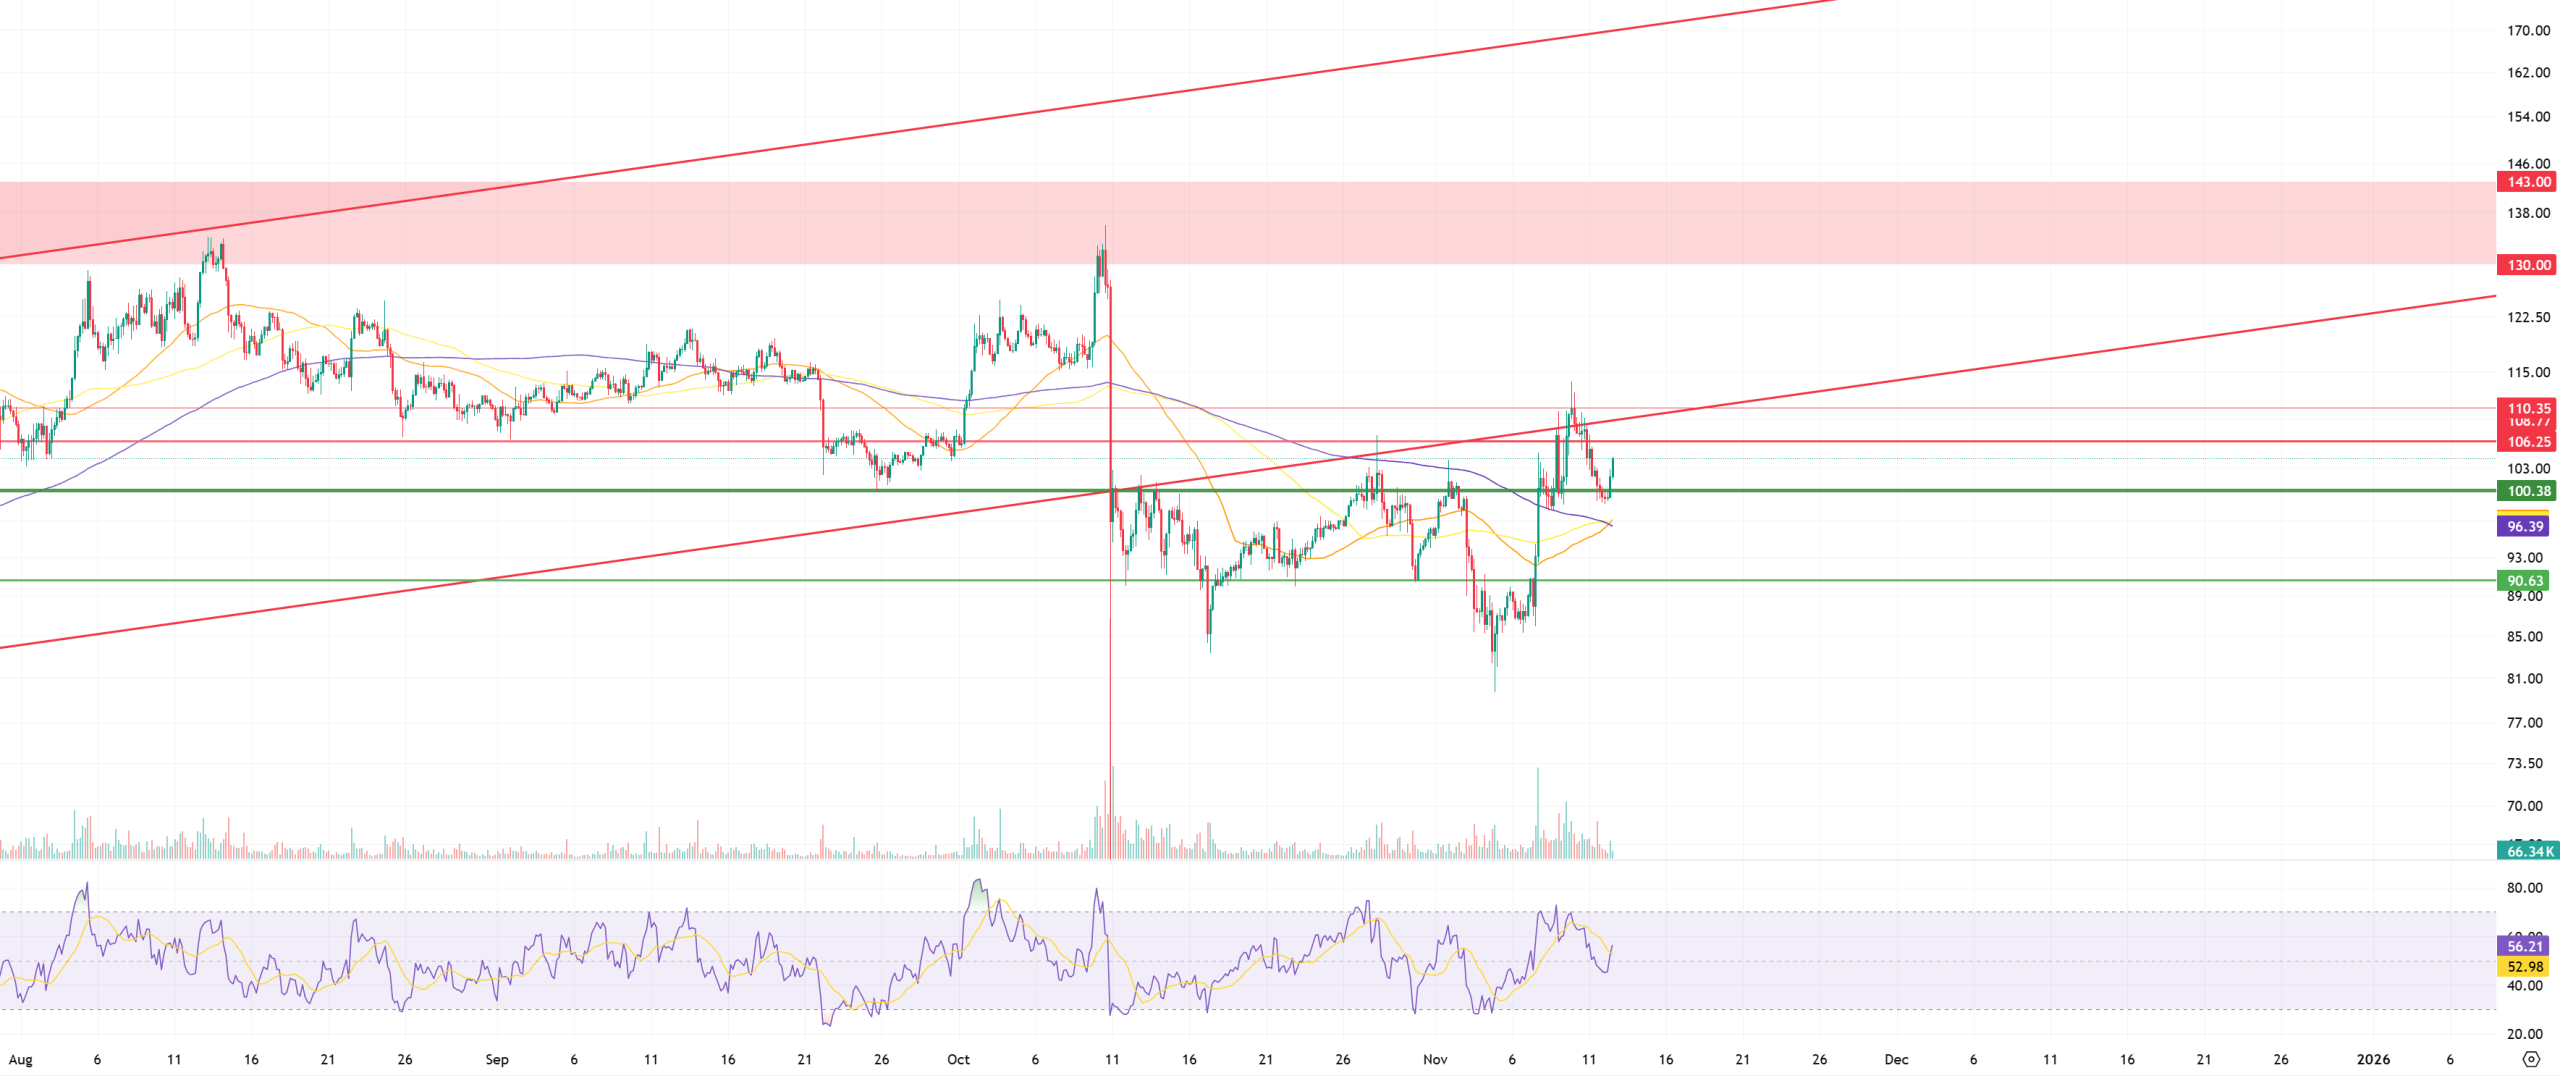
From a technical perspective, the pullback movement continuing under the downtrend in the BNB/USDT pair has reached the $900 support zone. After seeking support above these levels for a while, the asset ended its downward momentum with the new candles that formed and turned its direction upward again. With this rise, the price showed positive momentum up to the downtrend zone.
Current outlook The BNB/USDT pair has shown a positive outlook, but it has encountered resistance below the downward trend line and is now searching for direction.
Technical indicators for BNB, currently trading in the $940–1,000 range, suggest that the positive trading volume observed in recent rallies has supported the upward momentum. However, this volume has been insufficient to break the downward trend. Additionally, the Relative Strength Index (RSI) indicator, despite rising above the 50 level due to recent buying activity, has reversed direction back down due to the weakness of the positive momentum.
Based on the current technical picture, if buying appetite is maintained and market momentum recovers, BNB is likely to retest the $1,000 resistance level in the first stage. If this level is broken, the price is expected to rise above the downward trend line. If the downward trend is broken upward and sustainability is achieved at this level, it is technically possible for the price to rise towards the $1,040 and $1,075 levels, respectively.
On the other hand, if selling pressure increases, the price is expected to test the $940 support level. If this level is broken downward, the price may retreat to the $900 and $860 support zones, respectively.
Supports: 940 – 900 – 860
Resistances: 1,000 – 1,040 – 1,075
ADA/USDT
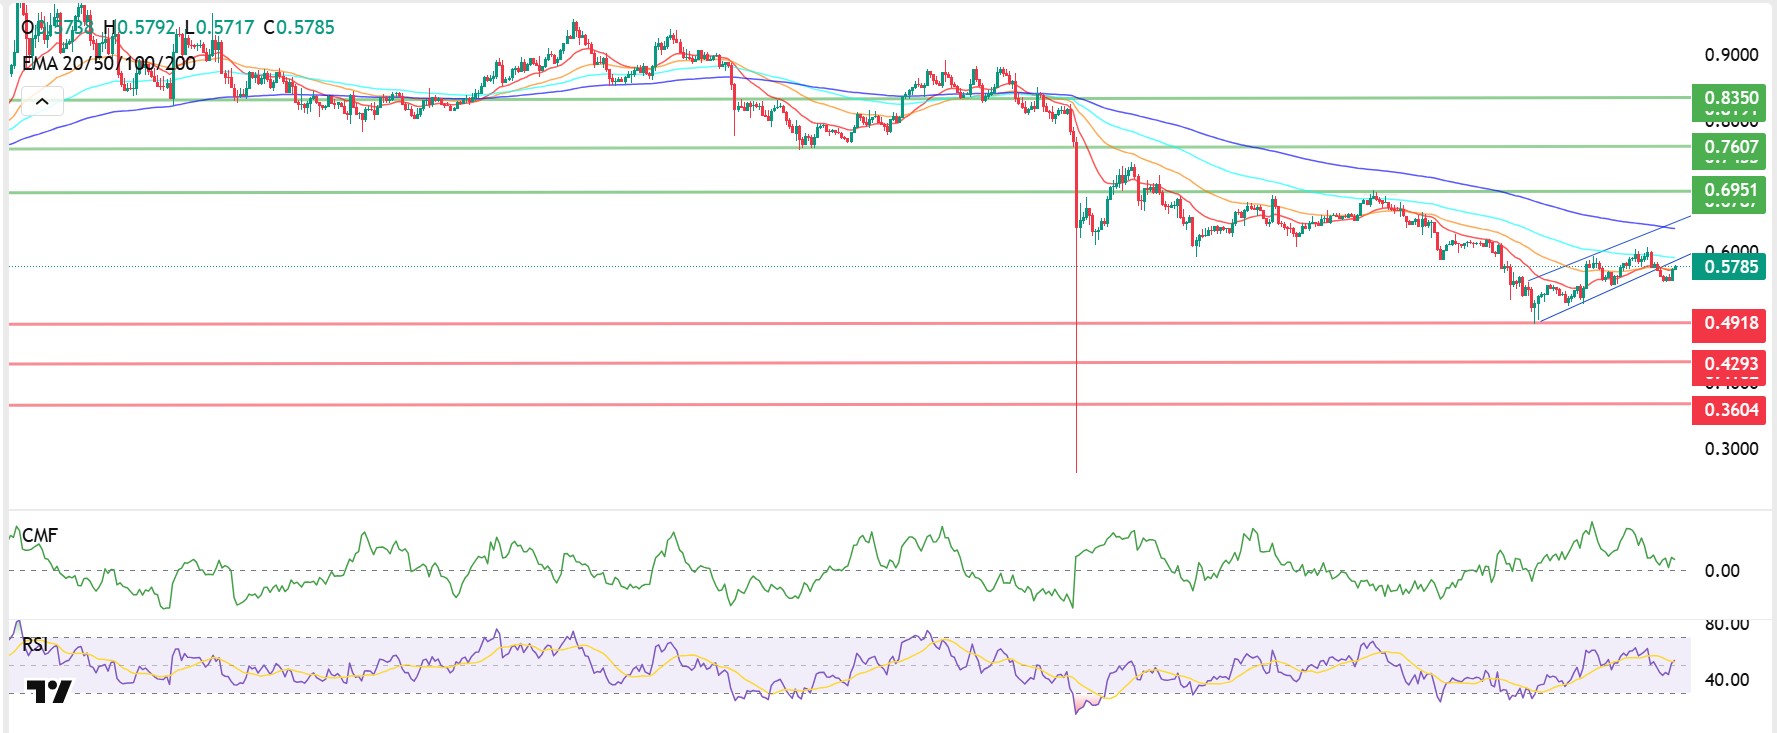
Grayscale Investments praised Cardano’s growing strength, highlighting its inclusion in the company’s GDLC ETF for the first time. The Grayscale CoinDesk Crypto 5 ETF (GDLC) began trading on the New York Stock Exchange in September. This fund offers US investors access to the performance of five major cryptocurrencies, including Cardano. Although ETF shares began trading in September, Grayscale recently reiterated that it has “brought GDLC into the real world,” making the fund accessible in traditional financial markets beyond the digital asset world.
Technically speaking, ADA rose over 3% in the second half of the day and is trading at $0.5778 as of today. Although ADA started the day on a bearish note, it approached the rising channel trend again with a retest movement. If it closes above $0.5887 for 4 hours, it is expected to enter the rising channel band. Although the Relative Strength Index (RSI-14) rose to 54 levels, the Chaikin Money Flow (CMF-20) is not giving a sufficiently positive signal for purchases. This correlation may indicate a limited increase in money inflows and could keep the CMF in negative territory. If the price approaches the $0.6414 level, the peak of the uptrend, during intraday rallies, the first resistance level we will monitor is around $0.6951. This could signal that the uptrend may continue in the short term. In the event of a decline due to the release of negative macroeconomic data or news related to the Cardano ecosystem, the $0.4918 level, which is the bottom of the upward trend, may emerge as our first support point. If this level is broken, the decline is expected to continue.
Supports: 0.3604 – 0.4293 – 0.4918
Resistances: 0.6414 – 0.6951 – 0.7607
Legal Notice
The investment information, comments, and recommendations contained herein do not constitute investment advice. Investment advisory services are provided individually by authorized institutions taking into account the risk and return preferences of individuals. The comments and recommendations contained herein are of a general nature. These recommendations may not be suitable for your financial situation and risk and return preferences. Therefore, making an investment decision based solely on the information contained herein may not produce results in line with your expectations.

