
Technical Analysis
BTC/USDT
With the House of Representatives approving the funding bill, the White House announced that the 49-day shutdown would officially end with Trump’s signature. Disagreements over the Fed’s interest rate path persist: Williams opens the door to short-term balance sheet expansion, while Bostic and Collins maintain a cautious stance. Meanwhile, Treasury Secretary Bessent announced plans to reduce tariffs on products such as bananas and coffee, while also stating that a $2,000 tax rebate plan for low-income households is under consideration. The SEC’s “token classification” plan strengthens the search for clarity in crypto regulations, while National Economic Council Director Kevin Hassett announced his candidacy for Fed chair.
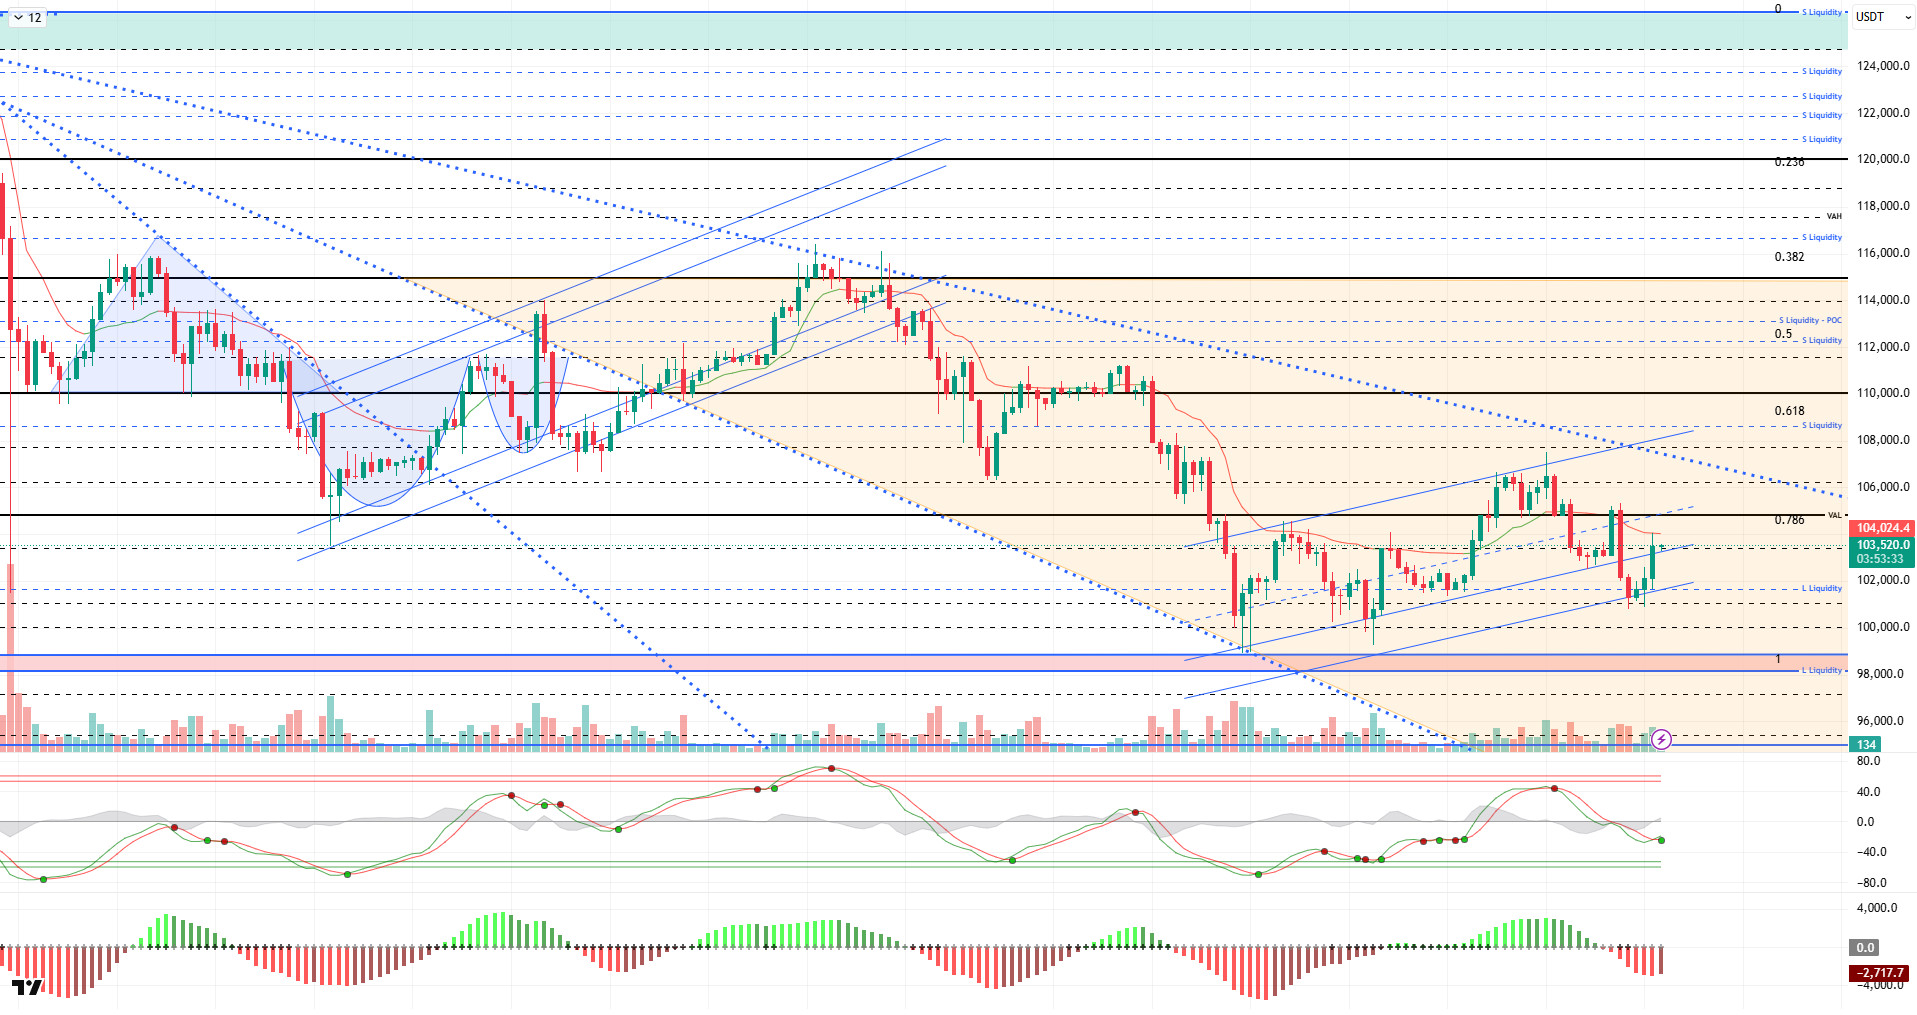
From a technical perspective, BTC tested the 105,000 level yesterday but faced selling pressure in the evening, breaking out of the minor uptrend again and testing the 100,800 level. The price, which rebounded again, first extended the trend and then reversed into an uptrend. With the latest decline, the rising trend structure appears to be shifting towards a horizontal-rising trend. At the time of writing, the price continues to test the 103,000 resistance level.
Technical indicators pulled back the buy signal given in the middle band of the parallel channel, parallel to the sell signal given by Wave Trend (WT) in the overbought zone, and came just above the oversold zone. The histogram in the Squeeze Momentum (SM) indicator continues its momentum within the negative area. The Kaufman moving average (KAMA) is currently at the $104,000 level, positioned above the price.
According to liquidation data, trading clusters at the 100,000–102,000 level were liquidated with the recent decline. In a broader time frame, the buying level is maintaining its accumulation at the 98,000 level. Selling levels are gaining intensity in the short term at the 105,000 level, while accumulation has formed at the 107,500 level in a broader time frame.
In summary, the 49-day shutdown officially ended following the Senate vote on the US government. While Fed members continue to disagree on interest rate cuts, the Treasury Secretary has also supported Trump’s statements on tariff revenues. In liquidity data, the selling level continues to dominate. Technically, the price continues to move within a minor upward channel for now, continuing to test the 103,300 resistance level. The price’s potential to regain the 105,000 area with a new catalyst will continue to be monitored as a top priority, and if it breaks through, the 107,400 resistance will be watched. On the other hand, in the event of a possible selling pressure, the first support level is 101,800, and if it breaks, the 100,000 reference point comes into play.
Supports: 101,800 – 100,000 – 98,000
Resistances: 103,300 – 105,000 – 106,600
ETH/USDT
The ETH price fell yesterday evening, breaking through the $3,436 support level and retreating to $3,370, due to the negative outlook in the CMF, which was also highlighted in the previous analysis. In the morning hours, the price rebounded from this area with buying activity and managed to rise above the $3,560 level. While this movement indicates that buyers have become active again in the support zone, a cautious outlook remains regarding the sustainability of the uptrend.
The Chaikin Money Flow (CMF) indicator continues to remain in negative territory, failing to accompany the upward movement. This structure reveals that the price increase is not supported by strong spot liquidity inflows and that the upward movement is progressing on weak ground. This weakness in the CMF keeps the risk of a pullback alive in the short term.
On the Relative Strength Index (RSI) front, a more positive picture is emerging. The RSI rising above the 50 level indicates that momentum is regaining strength and buyers are increasing their activity in the market.
According to the Ichimoku indicator, the price has risen above the kumo cloud again. However, the Tenkan level remaining below the Kijun level indicates that short-term risks persist. This structure shows that the market is in the process of finding direction and that a strong breakout is needed for a lasting trend to form.
Consequently, if the ETH price fails to surpass the $3,590 level, short-term selling pressure may reappear. However, if the price manages to hold above this level, it could lead to a retest of the $3,672 level and pave the way for the upward momentum to gain strength.
Below the Form
Supports: 3,436 – 3,227 – 3,020
Resistances: 3,672 – 3,816 – 3,990

XRP/USDT
After breaching the $2.35 support zone yesterday evening, the XRP price retreated to the upper band of the cloud. However, with strong buying pressure in the morning, the price quickly recovered and managed to rise above the $2.50 level. This rise indicates that buyers have regained strength and reacted to selling pressure in the short term.
The Chaikin Money Flow (CMF) indicator did not accompany this rise and remained flat around the zero line. This pattern indicates that the price increase was not supported by strong liquidity inflows and that caution should be exercised regarding the sustainability of the movement. This weak appearance in the CMF suggests that the rise is more of a technical reaction.
On the Relative Strength Index (RSI) side, a more positive picture is emerging. The RSI rising above the 50 level indicates that momentum is regaining strength and buyers are increasing their activity in the market. This signal stands out as one of the strongest indicators supporting upward price movement in the short term.
According to the Ichimoku indicator, the price remaining above the Kumo cloud, Tenkan, and Kijun levels indicates that the positive technical structure is maintained. Additionally, the Tenkan line crossing above the Kijun line signals that the short-term trend is strengthening and buyers are in control.
In the overall outlook, if the XRP price manages to stay above the $2.47 level, the upward trend is expected to gain momentum, with the $2.55 level becoming the target. However, the CMF indicator remaining weak indicates that this upward movement is not supported by strong volume, so caution is advised. If the price falls below the $2.47 level, a short-term correction towards the $2.41 range may be seen.
Supports: 2.4730 – 2.3512 – 2.1929
Resistances: 2.5554 – 2.6513 – 2.7306

SOL/USDT
The Bolivian government tested a blockchain solution on Solana during the second round of elections and created immutable, time-stamped records of ballot photos using TuVotoSeguro. Solana, a company listed on Nasdaq, plans to tokenize its shares through Superstate.
SOL experienced a price increase. The asset remained in the lower region of the downward trend that began on October 6. Additionally, it broke below the 50 EMA (Blue Line) moving average and continued to trade below this level. Currently, the price is gaining momentum from the strong support level of $150.67 and rising. If the rise continues, it may test the 50 EMA moving average. If the pullback deepens, the $144.35 level may act as support.
On the 4-hour chart, it remained below the 50 EMA (Exponential Moving Average – Blue Line) and 200 EMA (Black Line). This indicates a possible downtrend in the medium term. At the same time, the price being below both moving averages shows us that the asset is in a downward trend in the short term. The Chaikin Money Flow (CMF-20) is in negative territory. However, an increase in money inflows could push the CMF into positive territory. The Relative Strength Index (RSI-14) showed a slight increase, rising to the upper level of the negative zone. At the same time, it remained below the upward trend that began on November 4. This indicated increased selling pressure. If there is an uptrend due to macroeconomic data or positive news related to the Solana ecosystem, the $171.82 level stands out as a strong resistance point. If this level is broken upwards, the uptrend is expected to continue. If there are pullbacks due to developments in the opposite direction or profit-taking, the $138.73 level could be tested. A decline to these support levels could increase buying momentum, presenting a potential opportunity for an upward move.
Supports: 150.67 – 144.35 – 138.73
Resistances: 163.80 – 171.82 – 181.75
DOGE/USDT
The DOGE price experienced an uptrend. The asset continued to trade in the upper region of the rising line that began on November 4. The price, which tested this line, gained momentum and appreciated. Currently continuing its upward trend, the asset is testing the 50 EMA moving average as resistance. If it closes above this level, it could test the $0.18566 level. If the pullback deepens, it could test the 200 EMA (Black Line) moving average as resistance.
On the 4-hour chart, the 50 EMA (Exponential Moving Average – Blue Line) remained below the 200 EMA (Black Line). This indicates that a downtrend may begin in the medium term. The price being below both moving averages indicates a downward trend in the short term. The Chaikin Money Flow (CMF-20) remained in the negative zone, close to the neutral zone. Additionally, an increase in cash inflows could push the CMF into positive territory. The Relative Strength Index (RSI-14) rose to positive territory near the neutral level. It is currently testing the resistance level of the upward trend that began on November 3. A break above this level could increase buying pressure. In the event of an uptrend driven by political developments, macroeconomic data, or positive news flow in the DOGE ecosystem, the $0.18566 level stands out as a strong resistance zone. Conversely, in the event of negative news flow, the $0.15680 level could be triggered. A decline to these levels could increase momentum and initiate a new wave of growth.
Supports: 0.16686 – 0.15680 – 0.14952
Resistances: 0.17766 – 0.18566 – 0.19909

LTC/USDT
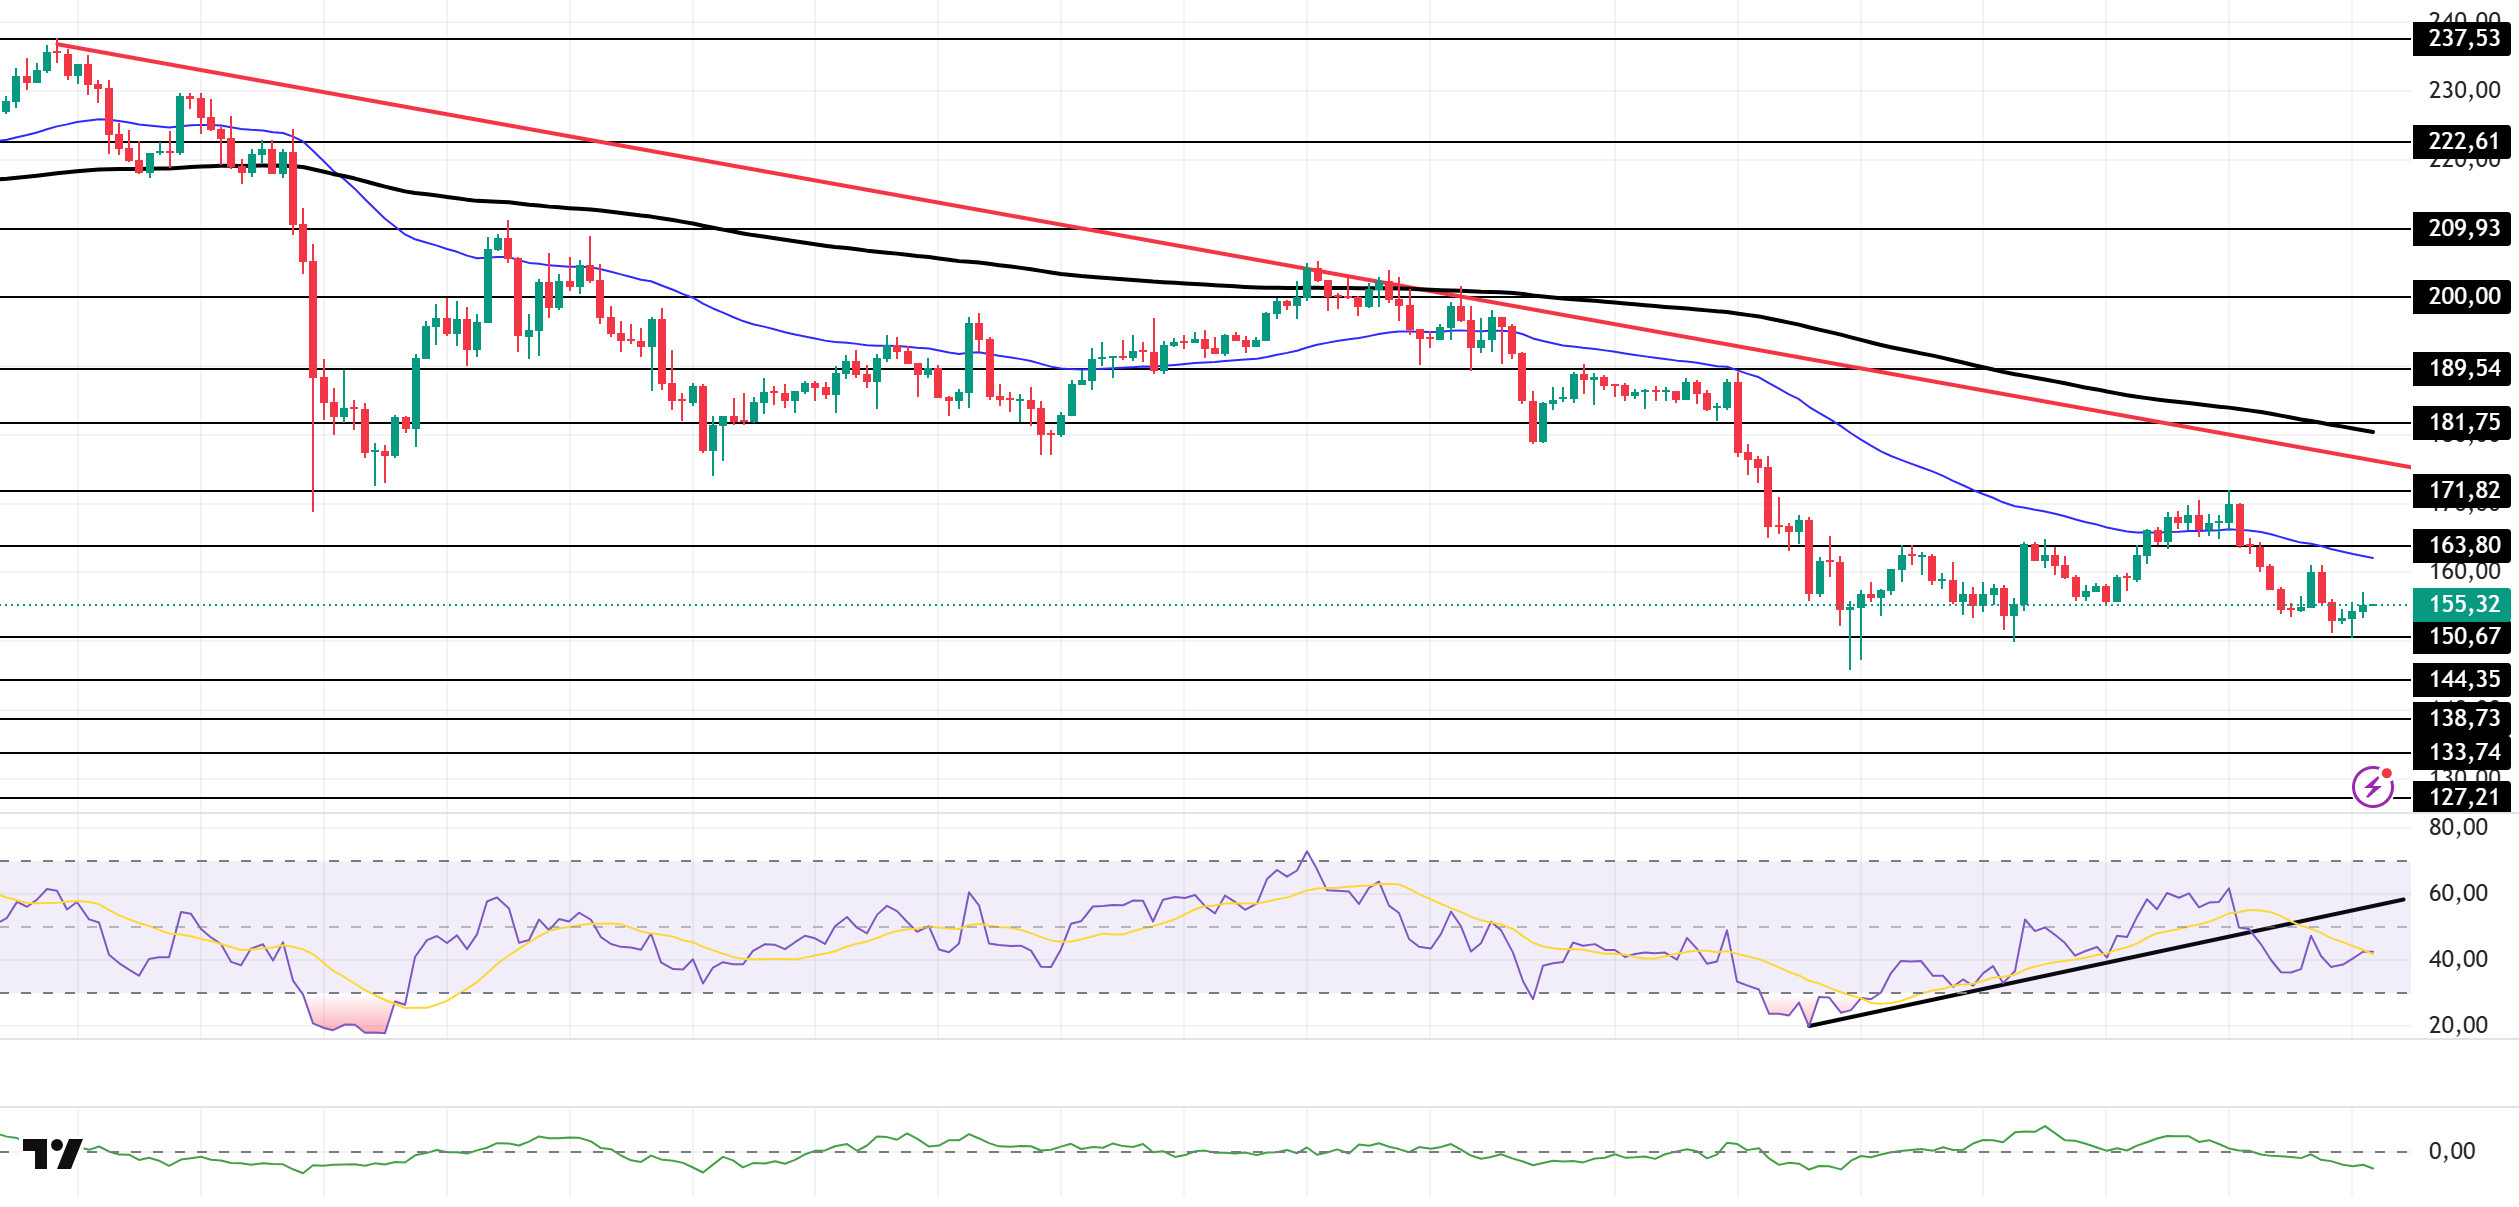
The price movements in the Litecoin (LTC) / USDT pair closed the previous day with a 2.1% loss in value. At the same time, LTC’s 0.62% loss compared to Bitcoin shows that Litecoin’s own value decreased even more than Bitcoin’s movement. On the futures side, the long/short position ratio opened in the last 24 hours being at 0.9623 reveals that derivative market participants’ downward expectations are slightly heavier. However, funding rates are positive.
From a technical perspective, examining Litecoin’s 4-hour USDT pair chart reveals that its price continues above all moving averages but below the rising trend. Considering the prevalence of short positions in the derivatives market, this indicates that yesterday’s anticipated downward movement occurred and this expectation continues to a lesser extent, although upward movements remain possible. If this possibility materializes, the first point where the upward movement could be suppressed is 106. 25 level, a significant level that will create selling pressure at the horizontal resistance position. Subsequently, the upward movement is expected to be halted at 109.00, the lower band of the rising trend. Finally, it should not be overlooked that short positions may increase partially if the price reaches the 110.35 level.
If a pullback occurs in line with expectations, the horizontal support at the 100.38 level is likely to hold for a while longer. However, the current technical outlook suggests that the possibility of a downward breakout is more likely. The 200, 100, and 50-period moving averages (purple, yellow, and orange), which are close to each other on the chart, may support the price in the short term. However, if a clear level must be specified, the 95.93 level, where the 200-period average passes, stands out as strong support. Closes below the moving averages could lead to a pullback towards the next support level at 90.63. Selling pressure is expected to ease in this region.
Supports: 100.38 – 95.93 – 90.63
Resistances: 106.25 – 109.00 – 110.35
BNB/USDT
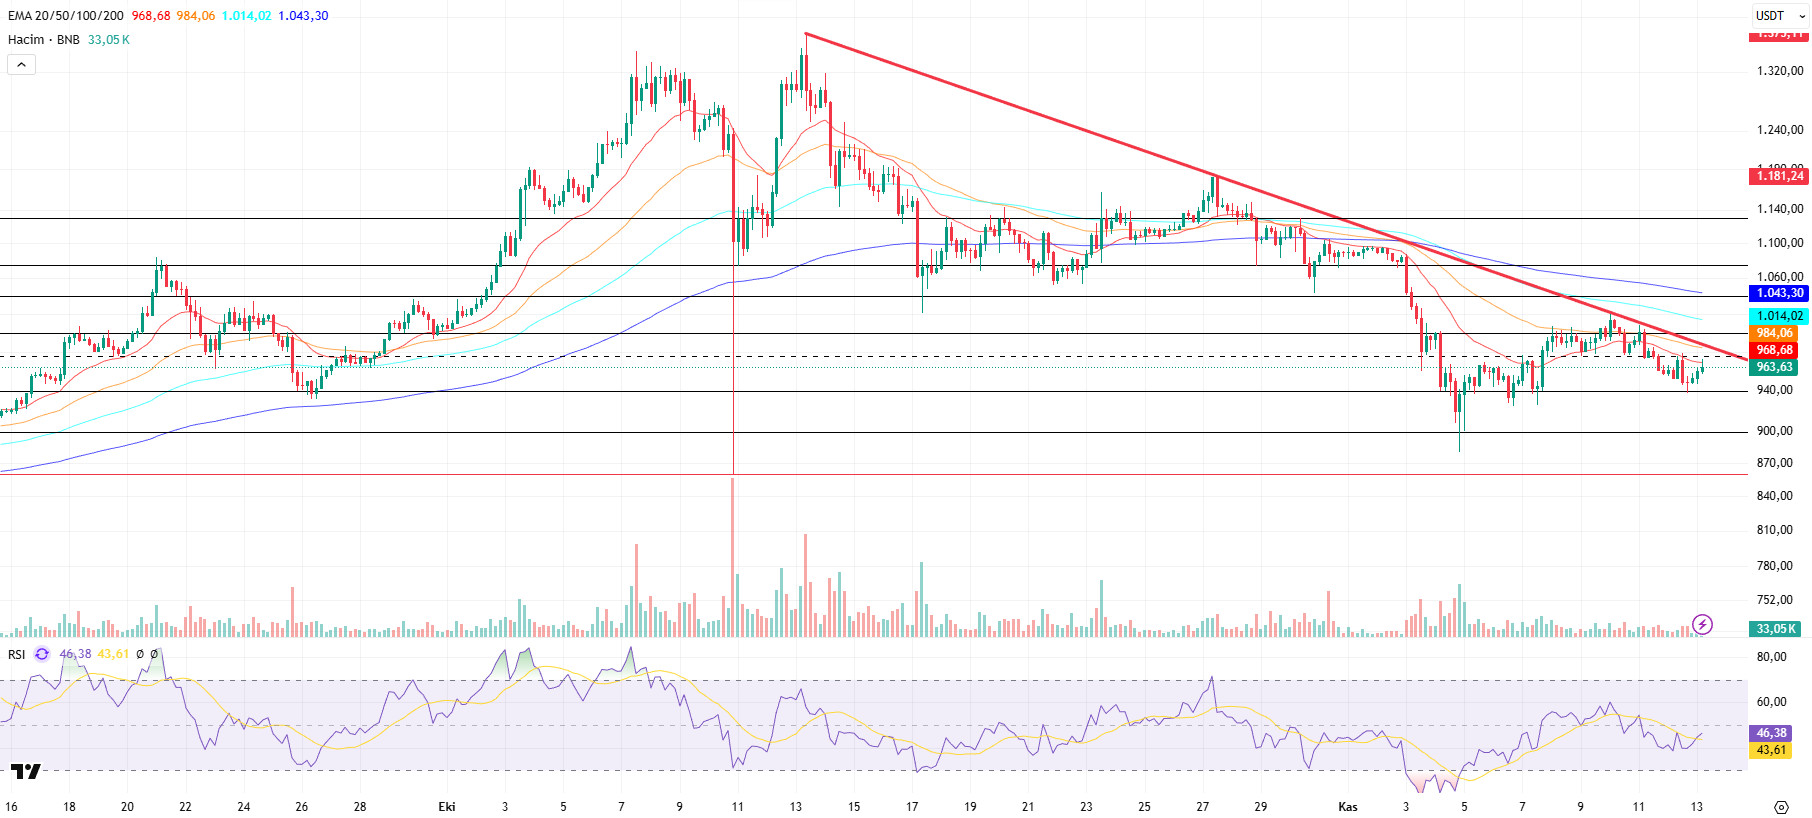
From a technical perspective, the pullback movement in the BNB/USDT pair, which continues within a downward trend, has deepened to the $900 support zone. After seeking equilibrium above these levels for a while, the asset eased the downward pressure with the new candlestick formations that followed and gradually turned upward. With this movement, the price has shown a recovery trend gaining strength up to the falling trend zone.
Based on the current outlook, although BNB/USDT presents a positive picture in the short term, it continues to search for direction due to selling reactions below the downward trend line.
Technical indicators for the pair, currently trading in the $940–975 range, show that the low trading volume in recent periods has limited the positive outlook. However, it is observed that the current volume levels do not have sufficient strength to break the downtrend. Furthermore, the Relative Strength Index (RSI) indicator, despite briefly rising above the 50 level due to recent buying, has shown a renewed downward trend due to weak momentum.
Based on the current technical picture, if buying appetite is maintained and market momentum recovers, BNB is likely to retest the $975 resistance level in the first stage. If this level is exceeded, the price is expected to rise above the downward trend line. If the downward trend is broken upward and sustainability is achieved at this level, it is technically possible for the price to rise towards the $1,000 and $1,040 levels, respectively.
On the other hand, if selling pressure increases, the price is expected to test the $940 support level. If this level is broken downward, the price may retreat to the $900 and $860 support zones, respectively.
Supports: 940 – 900 – 860
Resistances: 975 – 1,000 – 1,040
Legal Notice
The investment information, comments, and recommendations contained herein do not constitute investment advice. Investment advisory services are provided individually by authorized institutions taking into account the risk and return preferences of individuals. The comments and recommendations contained herein are of a general nature. These recommendations may not be suitable for your financial situation and risk and return preferences. Therefore, making an investment decision based solely on the information contained herein may not produce results in line with your expectations.


