
Technical Analysis
BTC/USDT
Kevin Hassett stated that the October employment report would not include the unemployment rate and that the shutdown was costing the economy $15 billion per week, while it was also reported that the release of CPI data was uncertain. Amidst the data confusion, Strategy’s massive transfer of 58,915 BTC sparked debate in the crypto markets; Saylor’s “HODL” post weakened the selling claims, while the move was likely assessed as a custody arrangement.
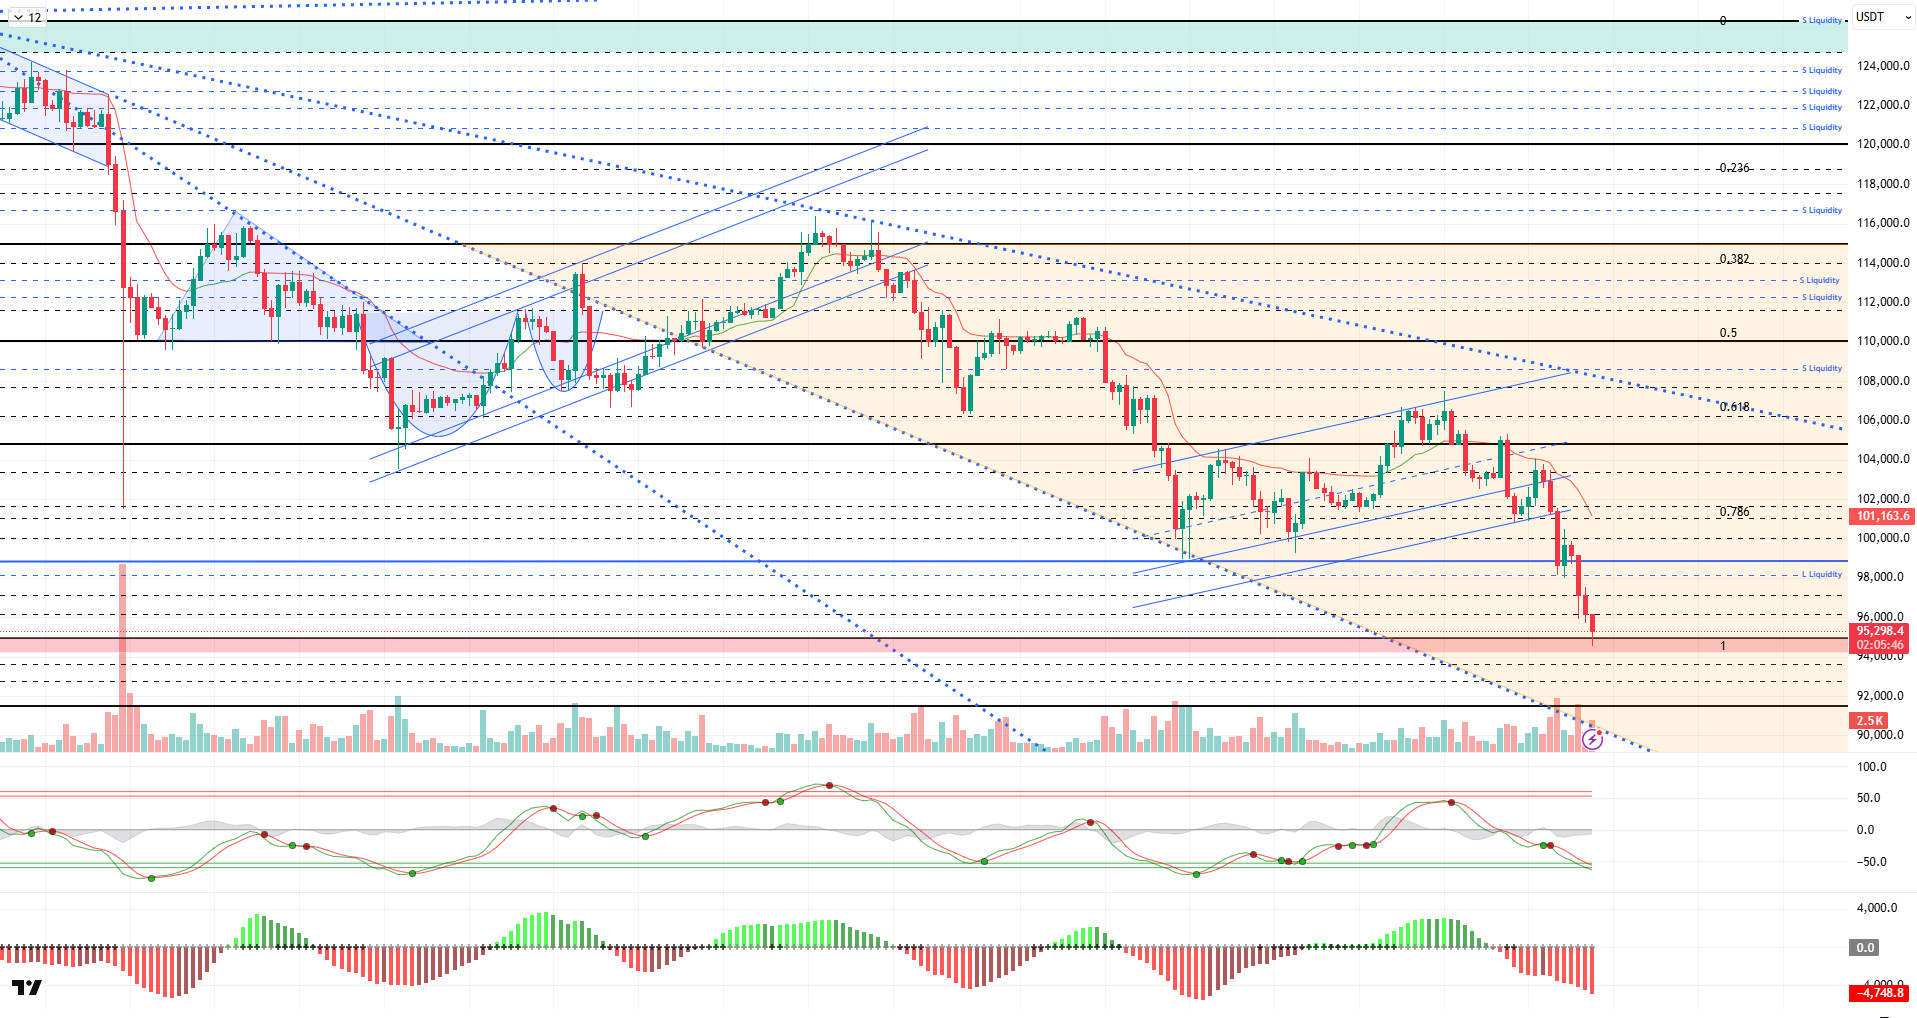
From a technical perspective, selling pressure on BTC continues, and efforts to stabilize the market remain insufficient for now. The price, which occasionally held above 97,000 during the day, fell below the critical reference level of 95,000. At the time of writing, it continues to trade just below this level at 94,900.
Technical indicators have reversed the buy signal given in the middle band of the Wave Trend (WT) channel back to a sell signal and have entered the oversold zone. The histogram in the Momentum (SM) indicator continues its momentum in the negative zone. The Kaufman moving average (KAMA) is currently at the $101,000 level, positioned above the price.
According to liquidation data, trading clusters at the 100,000 – 102,000 level were liquidated with the recent decline. In a broader time frame, the buy level resulted in liquidation at the 98,000 level. In the short term, the sell level is concentrated above the 98,000 and 100,000 levels, while in a broader time frame, the 104,000 – 105,000 band has become the liquidity zone.
In summary, following the Senate vote in the US government, the 49-day shutdown officially ended, and attention turned to the macro data set. While Fed members continued to disagree on interest rate cuts, Fed Chairman Powell pointed to the lack of data and maintained his cautious stance. From a technical perspective, the price first broke below the minor uptrend channel, then lost its reference levels and fell to 94,600. In the next phase, the price is expected to correct, with the first priority being to regain the 95,000 level, followed by the 97,200 resistance. On the other hand, if selling continues unabated, we will monitor the 93,700 support area.
Supports: 93,700 – 91,400 – 90,000
Resistances: 95,000 – 97,200 – 98,000
ETH/USDT
The ETH price clearly rejected the $3,227 resistance level during the day, continuing the expected downward movement and retreating to the $3,070 level. The intraday price behavior indicates that buyers are struggling to gain strength and that the market is still progressing under the control of sellers. In particular, the sharp decline following the reaction from the $3,227 region reveals that this level now acts as a strong resistance zone.
Although the Chaikin Money Flow (CMF) indicator remains in negative territory, it is showing signs of recovery that did not accompany the recent decline. The slowdown in liquidity outflows suggests that selling is not as aggressive as before. In addition, the decline in open interest reveals that long positions in the futures markets are being closed and investors are shying away from risk. In short, a cautious outlook prevails in the market, both in terms of liquidity and positioning.
The Relative Strength Index (RSI) indicator suggests that the loss of strength is continuing. The weak momentum reduces the likelihood of sustained upward price movements, even if prices attempt to rise. As there is no sign of a short-term accumulation signal yet, it appears difficult for buyers to take control.
The price remaining below the Tenkan Kijun and the Kumo cloud in the Ichimoku indicator confirms that the overall trend structure is still clearly negative. As long as the price remains below the cloud, upward attempts are expected to be limited. The absence of any positive structure in the trend reversal signals indicates that risk appetite remains low.
As the evening approaches, it seems likely that the price will experience another pullback towards the $3,020 level. A loss of the $3,020 support could lead to deeper selling and cause the price to move below $2,900. Conversely, if the $3,020 level holds, short-term rebound buying could re-enter the market, raising the possibility of a recovery toward the $3,227 region. However, as indicators have not yet shown any strengthening, such rebound movements are more likely to remain limited.
Supports: 3,020 – 2,760 – 2,550
Resistances: 3,227 – 3,436 – 3,672

XRP/USDT
The XRP price fell to the $2.23 level amid continued selling pressure during the day and is currently trying to hold on to the $2.27 region. Despite the rebound in the morning, the weak recovery shows that the market is still fragile.
The upward movement in the Chaikin Money Flow (CMF) indicator continues, but the price remains under pressure. Limited liquidity inflows indicate that rebound rallies are unable to gain strength. The Relative Strength Index (RSI) continues its downward movement, signaling a continued loss of momentum. This structure indicates that buyers have not yet entered the market strongly.
In the Ichimoku indicator, the price falling below the kumo cloud level has further weakened the technical outlook. The negative picture persists in terms of both the trend and short-term averages. As long as the price remains below the cloud, the likelihood of upward attempts remaining limited is high.
The overall outlook continues to be bearish during the day. Pullbacks below $2.27 could push the price back to the $2.23 support level. Losing this level could accelerate the decline. Although a potential recovery would require the price to first break above the $2.30 resistance level and then the $2.35 resistance level, indicators suggest this possibility is currently weak.
Supports: 2.1929 – 2.0768 – 1.9092
Resistances: 2.3512 – 2.4730 – 2.5554

SOL/USDT
The SOL price deepened its decline during the day. The asset remained in the lower region of the downward trend that began on October 6. It also continued its decline, encountering resistance at the strong resistance level of $144.35. Currently testing the strong support level of $138.73, the price could find support at the $127.21 level if the pullback deepens. In the event of an uptrend, the $150.67 level should be monitored.
The price remained below the 50 EMA (Exponential Moving Average – Blue Line) and 200 EMA (Black Line) on the 4-hour chart. This indicates a potential downtrend in the medium term. Additionally, the price being below both moving averages suggests a downward trend in the short term. The Chaikin Money Flow (CMF-20) is in negative territory. However, the decrease in money inflows could push the CMF deeper into negative territory. The Relative Strength Index (RSI-14) is in oversold territory. This could bring buying pressure. It also continued to trade below the downward trend line that began on November 11. This signaled increased selling pressure. There is also a bullish divergence. If there is an uptrend due to macroeconomic data or positive news related to the Solana ecosystem, the $150.67 level stands out as a strong resistance point. If this level is broken upwards, the uptrend is expected to continue. If pullbacks occur due to developments in the opposite direction or profit-taking, the $127.21 level could be tested. A decline to these support levels could increase buying momentum, presenting a potential upside opportunity.
Supports: 138.73 – 133.74 – 127.21
Resistances: 144.35 – 150.67 – 163.80

DOGE/USDT
The DOGE price continued to lose value during the day. The asset broke below the upward trend that began on November 4 with a strong bearish candle, continuing its decline and remaining below this trend. Facing resistance from the 50 EMA (Blue Line) moving average, the asset is currently testing the strong support level of $0.15680. If the candle closes below this level, the $0.14952 level should be monitored. If the uptrend begins, it may test the upward trend as resistance.
On the 4-hour chart, the 50 EMA (Exponential Moving Average – Blue Line) remained below the 200 EMA (Black Line). This indicates that a downtrend may begin in the medium term. The price being between both moving averages indicates that the price is in a decision phase in the short term. The Chaikin Money Flow (CMF-20) continued to remain in the negative zone near the neutral zone. Additionally, a decrease in cash inflows could push the CMF deeper into negative territory. The Relative Strength Index (RSI-14) retreated to the middle of the negative zone. It also remained below the upward trend that began on November 3, signaling continued selling pressure. In the event of potential increases driven by political developments, macroeconomic data, or positive news flow within the DOGE ecosystem, the $0.17766 level stands out as a strong resistance zone. Conversely, in the event of negative news flow, the $0.14237 level could be triggered. A decline to these levels could increase momentum and initiate a new wave of growth.
Supports: $0.15680 – $0.14952 – $0.14237
Resistances: 0.16686 – 0.17766 – 0.18566

LTC/USDT
Litecoin (LTC) gained 2.06% against USDT and 3.1% against Bitcoin in the first half of the day, drawing attention. On the futures side, the long/short position ratio opened in the last 24 hours standing at 0.9497 indicates that derivatives market participants generally maintained their downward expectations in addition to the morning’s movement. Although the update of funding rates to a positive range signals that buyers have gained some strength in the short term, the overall picture reveals that a downward movement in the derivatives markets is still predominantly expected for the remainder of the day.
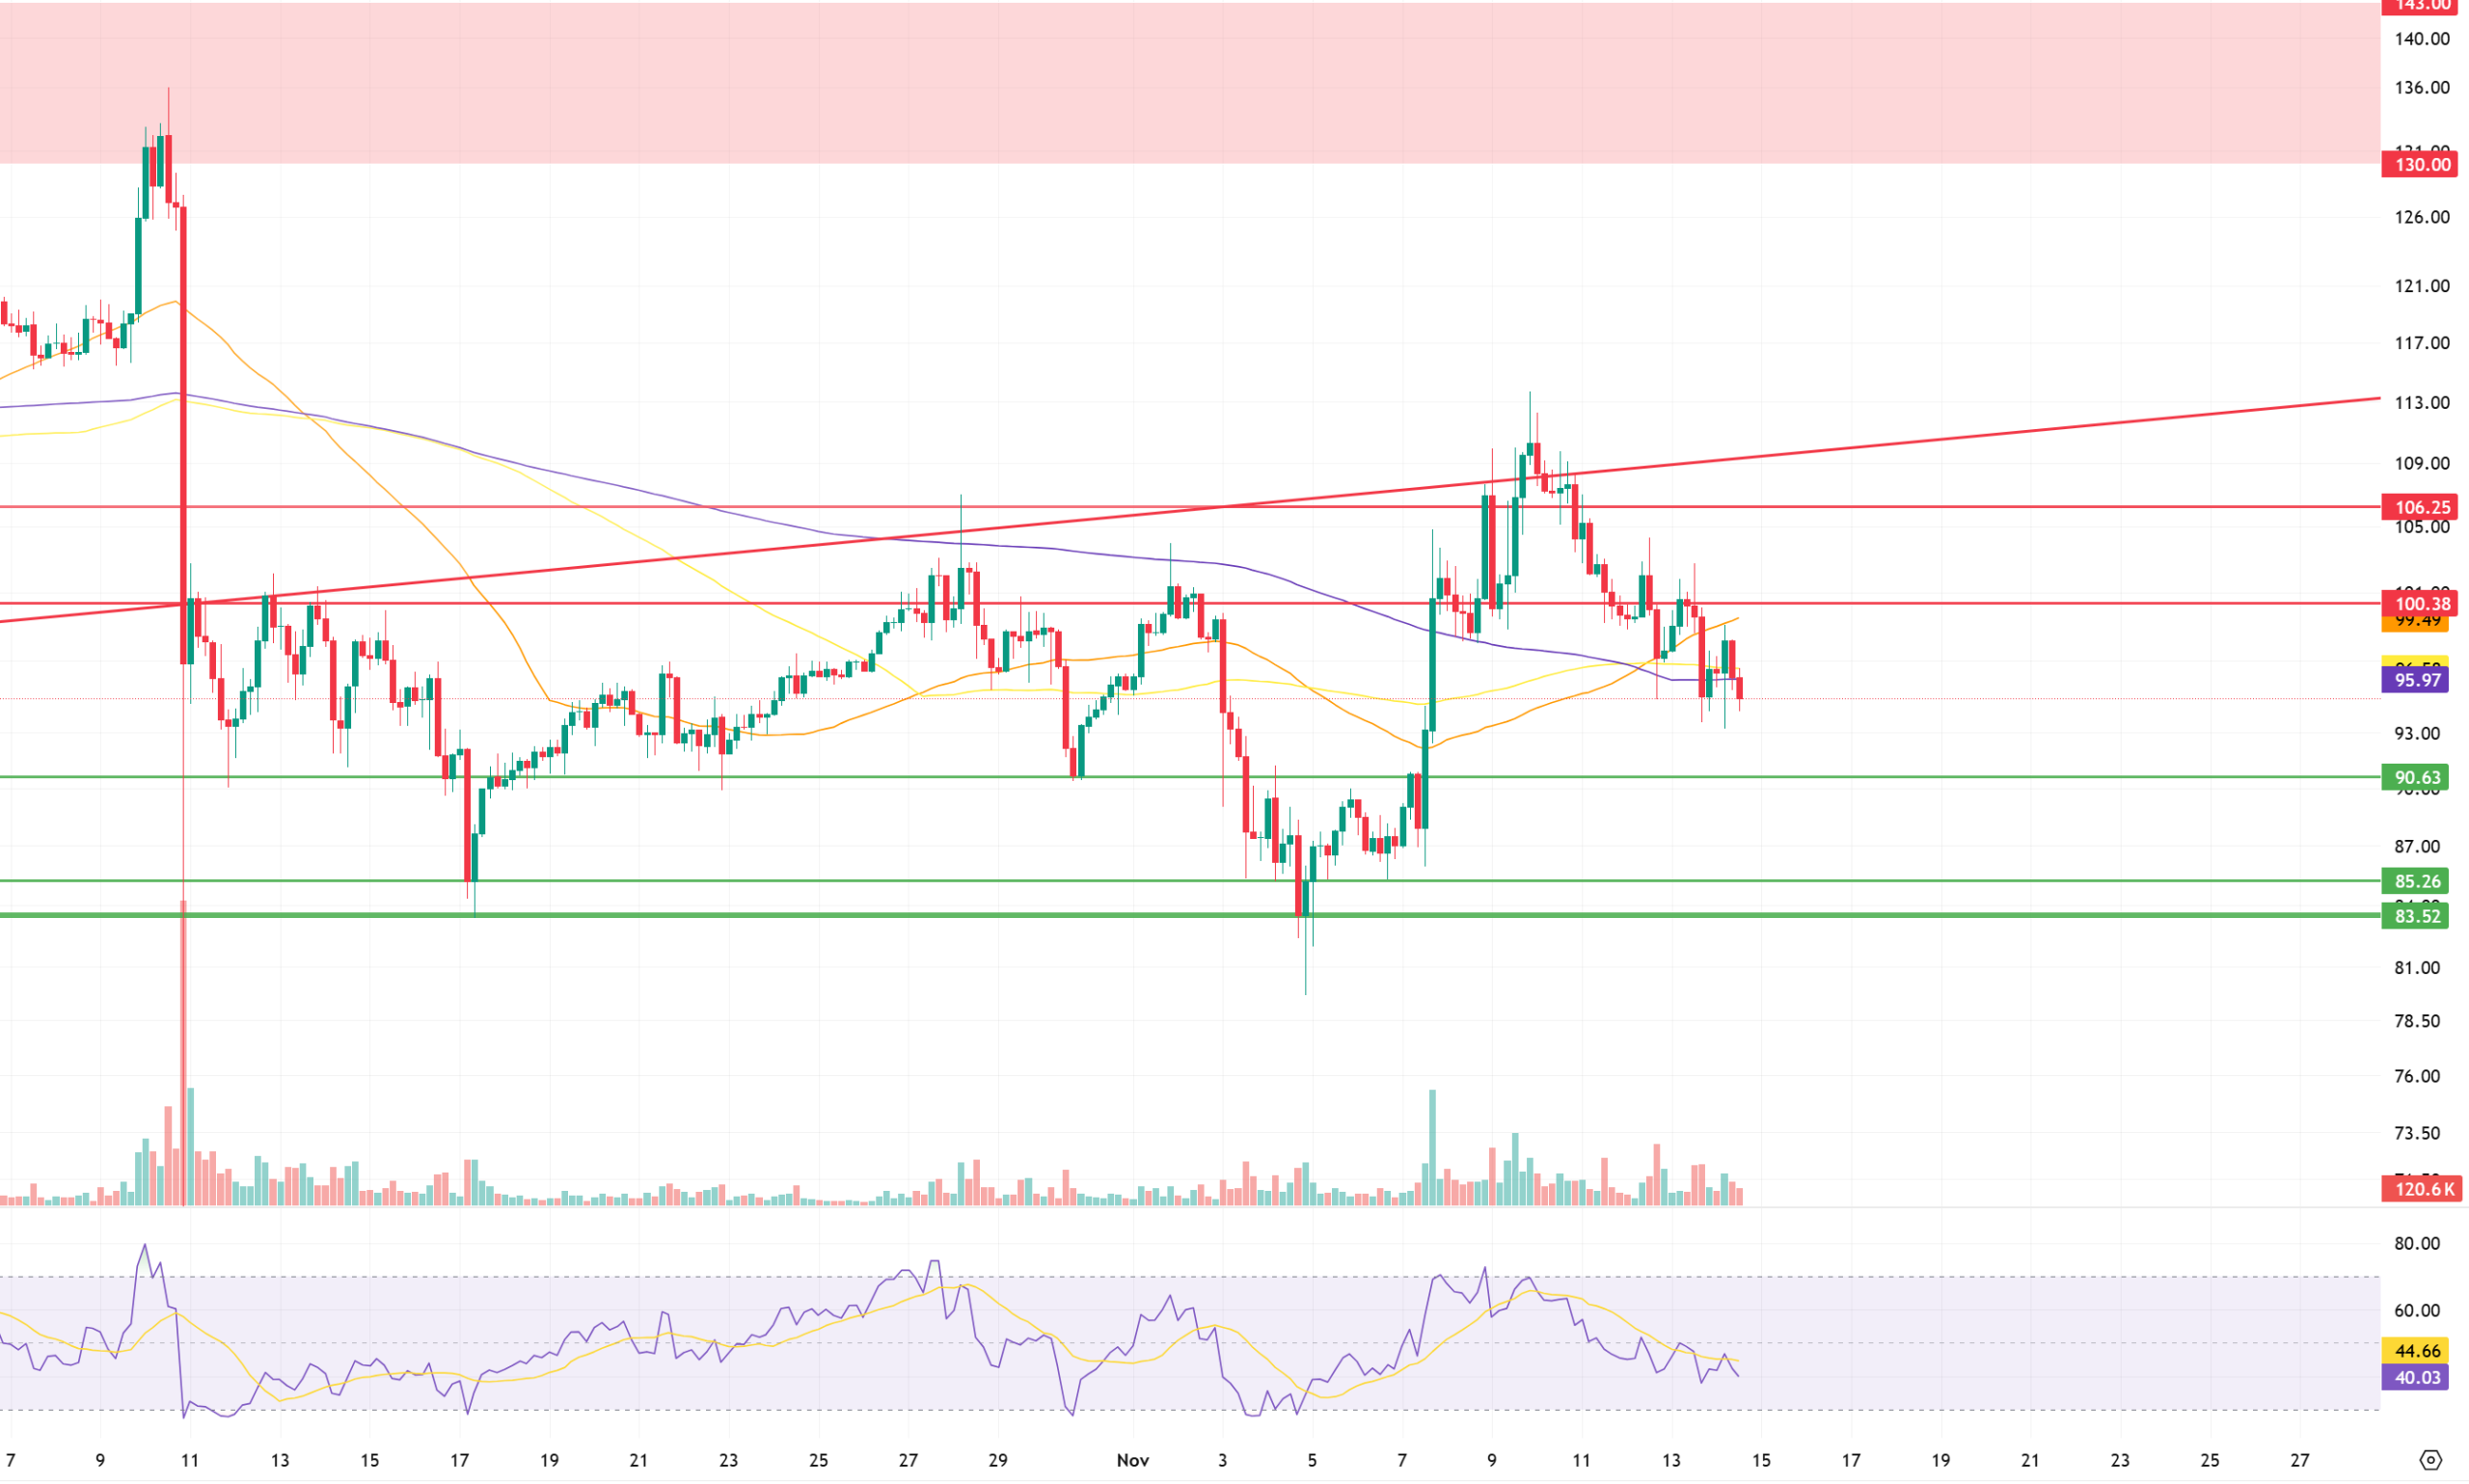
From a technical perspective, examining Litecoin’s (LTC) 4-hour USDT chart shows that the price continues to trade below all moving averages and the rising trend. This situation, combined with the partial weight of short positions in the derivatives market, strengthens expectations of a decline, but it should not be forgotten that upward movements are also possible, contrary to general expectations. In this context, if an upward movement occurs, the first strong resistance level can be expected at the newly broken 200-period moving average (purple line), which is currently at 95.97. Subsequently, the horizontal resistance at 100.38 could form a level where pressure may increase again. The most solid intraday resistance level is expected to be the horizontal resistance at 106.25.
In line with general expectations, if the ongoing decline continues, the 90.63 level stands out as an area where the price could find initial support and short positions could be partially closed. If it fails to hold, the 85.26 level is a critical support level. Below that, the threshold support level of 83.52 is positioned, which could potentially create a tougher ground. However, since the main reason for this movement appears to be the decline in Bitcoin, the strong performance of the LTC/BTC pair despite the weakening of the USDT pair suggests that the downward movement in LTC/USDT may slow down or end once the current movement on BTC is completed.
Supports: 90.63 – 85.26 – 83.52
Resistances: 95.97 – 100.38 – 106.25
BNB/USDT
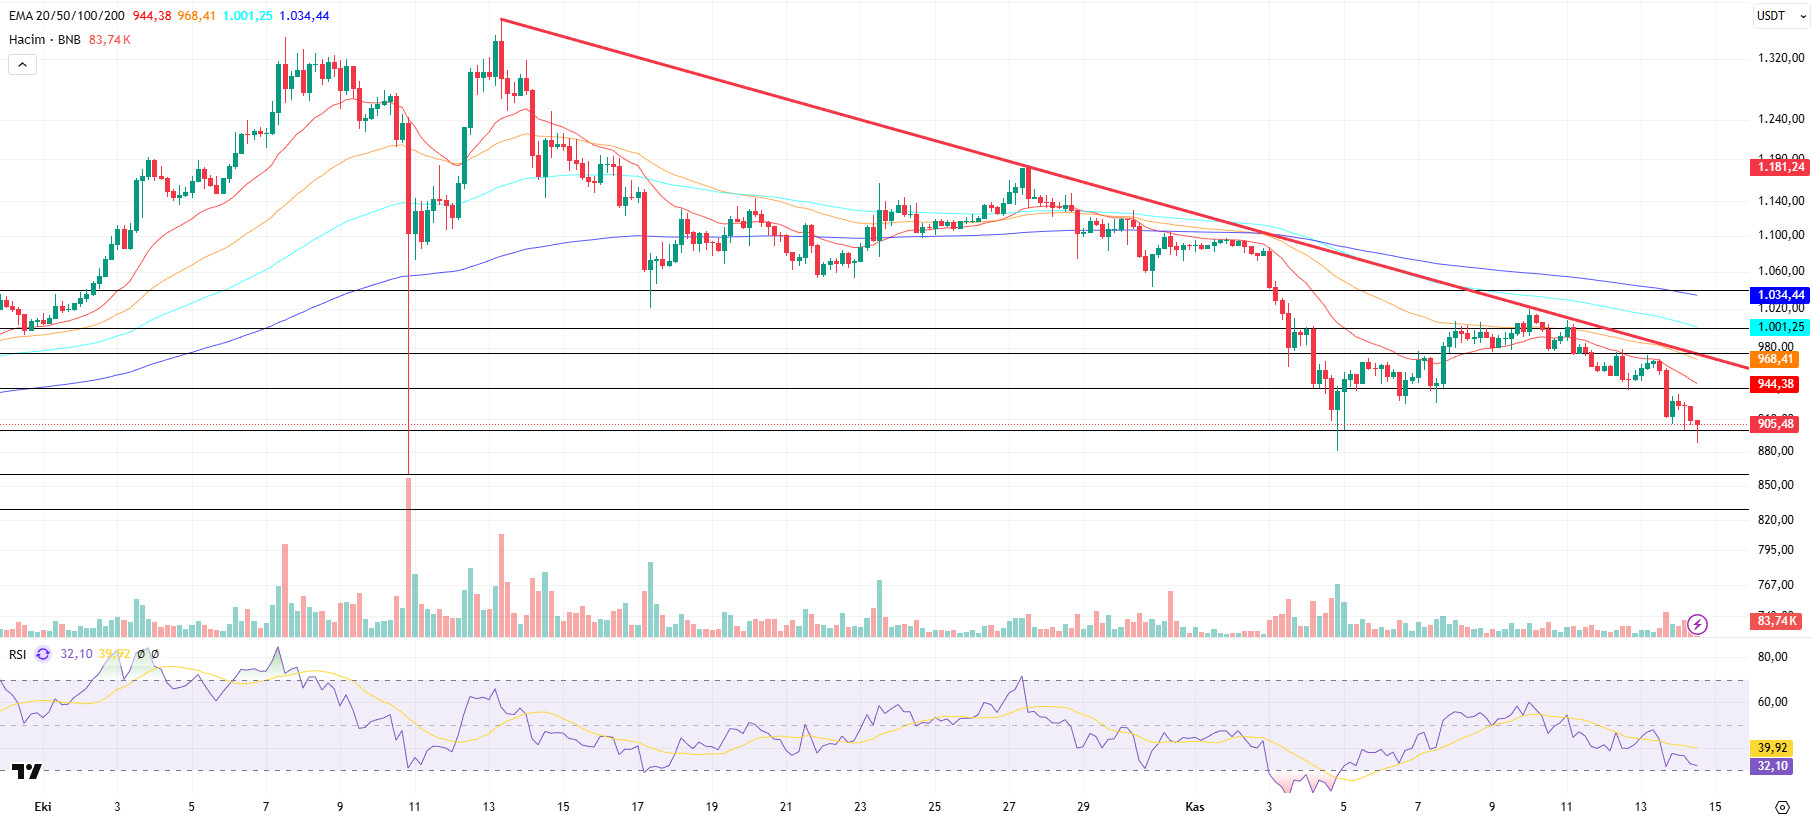
From a technical perspective, the pullback movement in the BNB/USDT pair, which continues within a downward trend, has been driven by selling pressure encountered below the falling trend line, causing the price to retreat to the $900 level.
This pressure has increased due to the widespread pullbacks seen in today’s markets, and the price has fallen below the $900 level again. Although BNB rebounded from these levels and briefly rose above $900, it maintains a short-term negative outlook. In this context, the BNB/USDT pair continues its downward trend in the short term due to selling pressure below the current downward trend line.
Technical indicators for BNB, currently trading in the $900–940 range, show that the low trading volume in recent periods has limited the positive outlook. Current volume levels are not considered strong enough to break the downward trend. Additionally, the Relative Strength Index (RSI) indicator is showing a renewed downward trend due to weak momentum.
Given the current technical outlook, if selling pressure increases, the price is expected to retest the $900 support level. If this level is broken downward, the price may retreat to the $860 and $830 support zones, respectively.
On the other hand, if buying appetite is maintained and market momentum recovers, BNB is likely to retest the $940 resistance level in the first stage. If this level is exceeded, the price is expected to rise above the downtrend line. If the downward trend breaks upward and sustainability is achieved in this region, it is technically possible for the price to rise towards the $975 and $1,000 levels, respectively.
Supports: 900 – 860 – 830
Resistances: 940 – 975 – 1,000
Legal Notice
The investment information, comments, and recommendations contained herein do not constitute investment advice. Investment advisory services are provided individually by authorized institutions taking into account the risk and return preferences of individuals. The comments and recommendations contained herein are of a general nature. These recommendations may not be suitable for your financial situation and risk and return preferences. Therefore, making an investment decision based solely on the information contained herein may not produce results in line with your expectations.


