Technical Analysis
BTC/USDT
As attention in the markets shifts back to the policy front today, crypto regulations are accelerating in Washington, and the Senate’s preparation to vote on the CLARITY Act next month is strengthening expectations for clarity in the sector. Meanwhile, President Trump announced he will name the new Fed Chair before Christmas. Abu Dhabi funds significantly increasing their Bitcoin ETF positions indicates sustained long-term demand for digital assets from the institutional side.
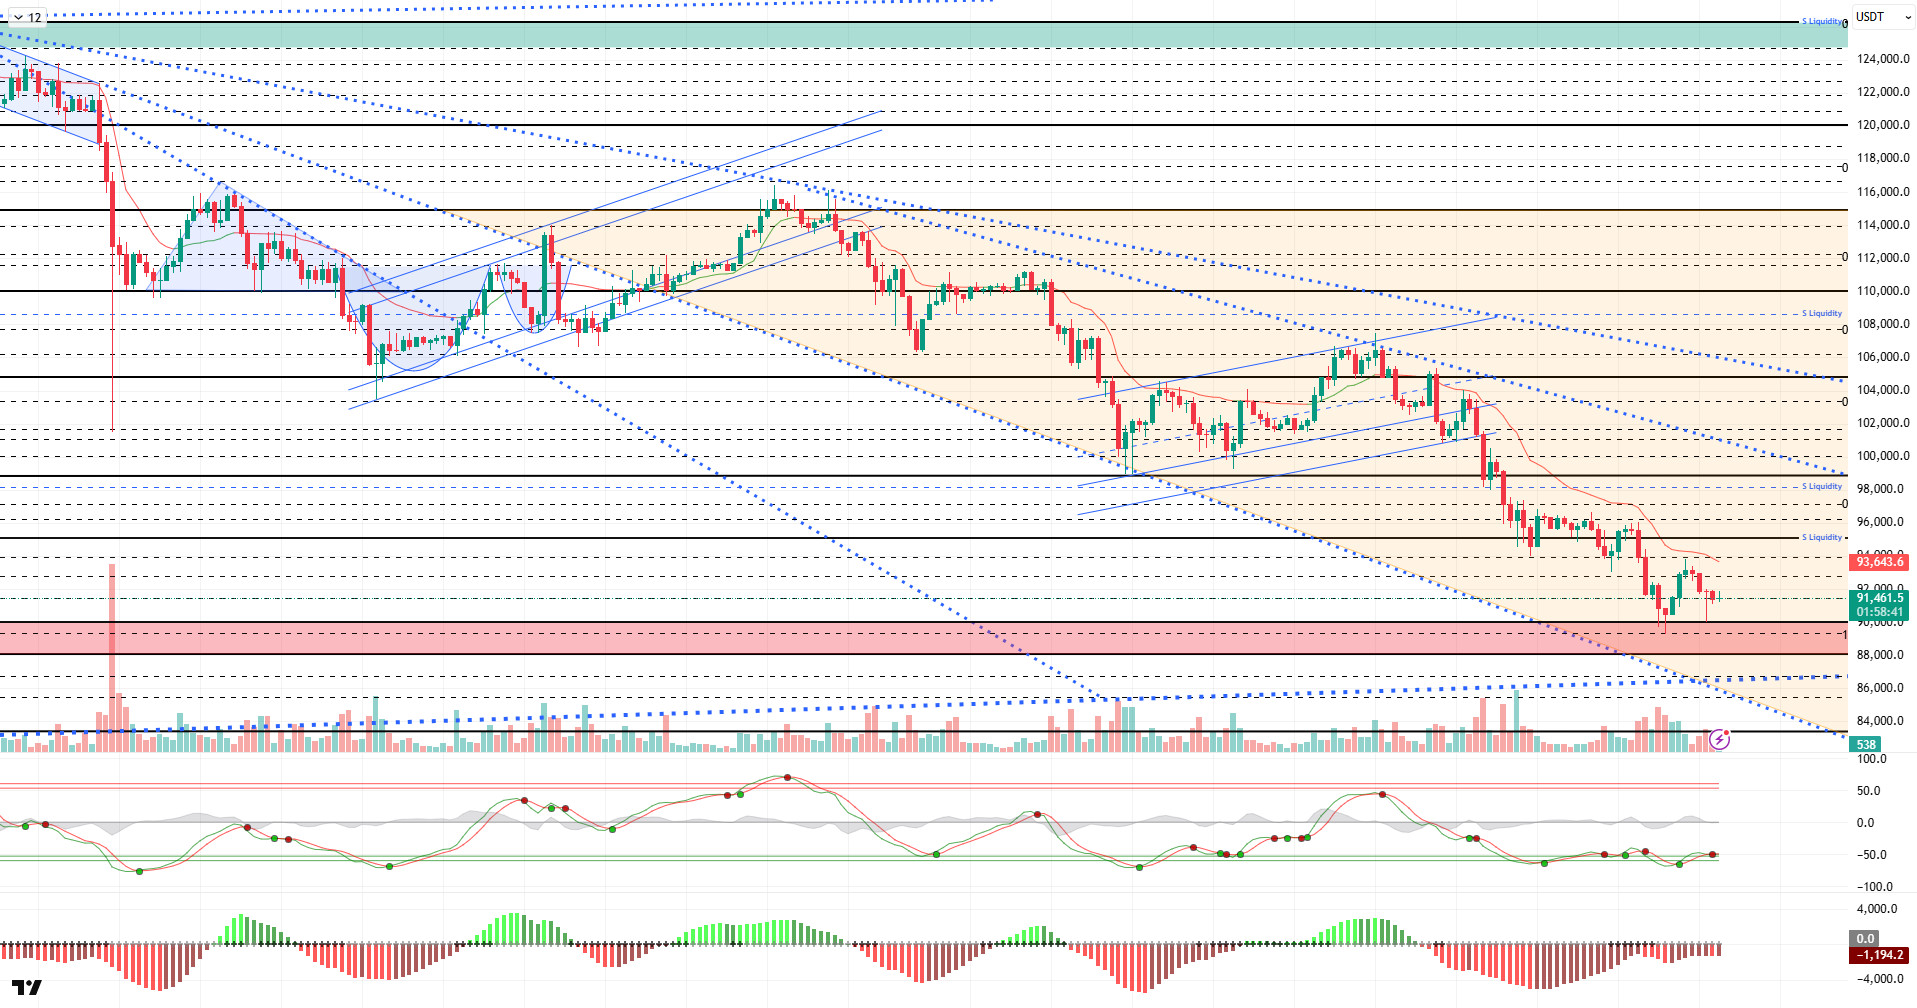
Technically speaking, BTC is moving sideways today after yesterday’s rebound. The price, which recorded a weak rebound within the downtrend structure, continues to look bearish, trading at $91,400 at the time of writing.
Technical indicators reflect uncertainty, with the Wave Trend (WT) oscillator generating a buy signal in the oversold zone, while the histogram on the Momentum (SM) indicator is attempting to regain strength after reaching maximum weakness in the negative zone. The Kaufman Moving Average (KAMA) is currently positioned above the price at the $93,600 level.
According to liquidation data, the recent decline has largely liquidated short- and medium-term buy levels, while annual buy levels appear to be targeted. However, the weight of sell levels continues to be evident. As the selling pressure increases, the short-term level at $93,000 is being liquidated, while the next selling level is concentrated at $94,000. Accumulation continues within the $97,000–$98,000 range over a broader time frame.
In summary, the weakening of expectations for Fed interest rate cuts, profit-taking by long-term investors, value losses in technology stocks in global markets, and increasing geopolitical risks are significantly increasing selling pressure in the market. On the technical side, while the price continues to sustain its reaction from the 89,000 level, the weight of sell-side positions continues in liquidity data. Moving forward, closing above the 90,000 level again will be critical for the price to gain momentum, and the 93,700 resistance level will be monitored once more in an upward movement. In the event of potential selling pressure, the 90,000 level emerges as a critical reference point.
Supports: 90,000 – 89,000 – 88,100
Resistances: 91,400 – 92,600 – 93,700
ETH/USDT
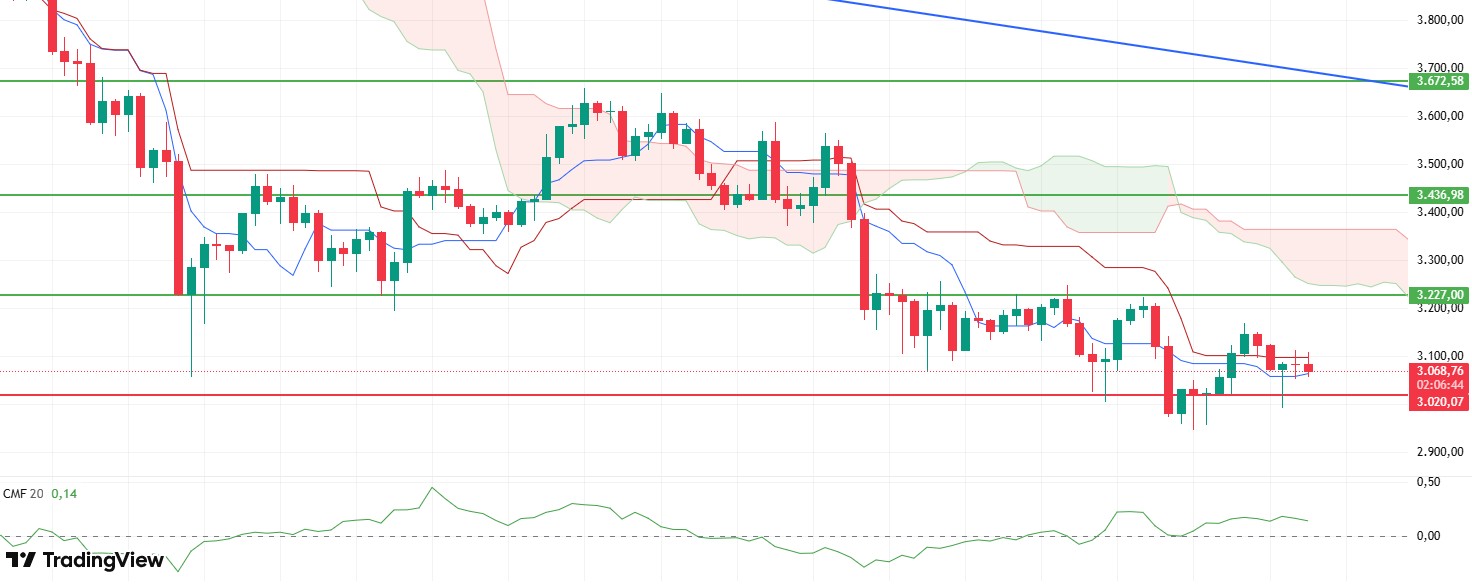
ETH rose to around $3,110 during the day following this morning’s rally, but then fell back on profit-taking and is currently trading at around $3,080. Although the price movement is volatile in the short term, buyers’ willingness to respond remains intact, and the importance of the key support level around $3,020 remains.
The liquidity picture is showing positive signals. The Chaikin Money Flow (CMF) indicator continued its upward trend in positive territory, and despite the morning decline, there was no sharp break in liquidity flow. This structure suggests that the downward pressure is largely coming from position closings in the futures markets, while buying interest persists on the spot side. This ongoing positivity in the CMF contributed to the price quickly recovering from below $3,000.
Caution is advised on the momentum front. The Relative Strength Index (RSI) or other momentum indicators have yet to confirm a strong trend reversal, and short-term momentum is showing signs of weakening at times. Therefore, even if there are upward attempts, volume and momentum support are needed for these to become sustainable.
An interesting squeeze is observed in the Ichimoku chart. The price has squeezed between Tenkan and Kijun and is seeking equilibrium within this range. While this structure indicates short-term horizontal or wavy movements, for a sustained rise, the price must first settle above Kijun and then move towards the kumo cloud. Otherwise, the squeeze between Tenkan and Kijun could increase volatility until the market establishes a new direction.
The most critical technical level during the day is $3,020. If the price can hold this support, a new attempt towards the $3,227 resistance zone is possible with CMF and spot-side buying support. However, if daily closes form below $3,020, selling pressure could accelerate and trigger a deeper pullback towards lower support levels. Therefore, whether $3,020 holds should be closely monitored for the short-term direction.
Supports: 3,020 – 2,760 – 2,550
Resistances: 3,227 – 3,436 – 3,672
XRP/USDT
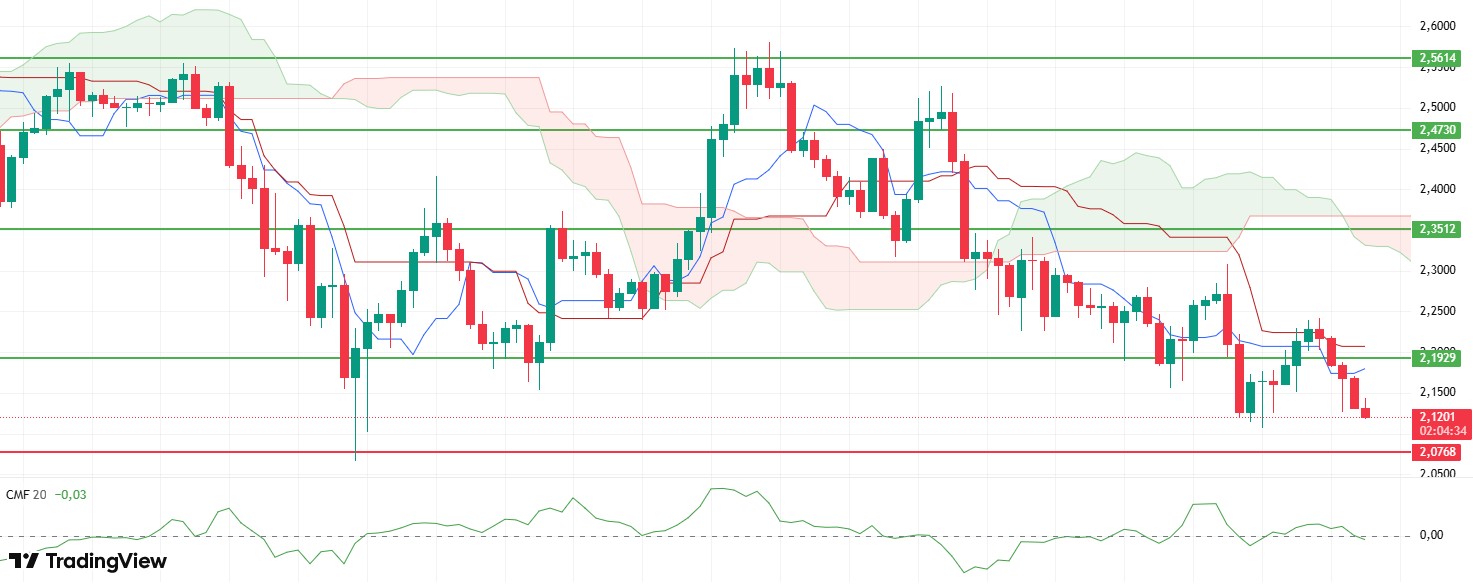
XRP continued to face selling pressure during the day, falling to around $2.12 and currently attempting to stabilize around $2.17. This movement indicates that the morning’s upward attempt was met with continued selling pressure and that buyers have not yet gained control in the short term.
The Chaikin Money Flow (CMF) indicator has fallen into negative territory. Limited liquidity outflows appear to have begun.
The Relative Strength Index (RSI) continues its weak trend. As the indicator moves sideways at low levels, the lack of momentum is striking. This structure shows that short-term upward attempts are not supported by volume and momentum and may therefore remain limited.
The technical structure in the Ichimoku indicator remains weak. The price continues to stay below the kumo cloud, and the failure to remain above the Tenkan and Kijun levels indicates that pressure will continue in the medium term. The movement below the kumo cloud reduces the likelihood of incoming reactions turning into a strong trend reversal.
The levels to watch for intraday scenarios are clear. A return above $2.19 would reinforce short-term positive expectations and could bring about a recovery attempt towards the $2.35 level. On the other hand, a drop below $2.07 could bring about steeper declines. For technical confirmation, the CMF needs to remain positive and the RSI needs to show signs of recovery.
Supports: 2.0768 – 1.9092 – 1.7729
Resistances: 2.1929 – 2.3512 – 2.4730
SOL/USDT
21Shares launched its Spot Solana ETF.
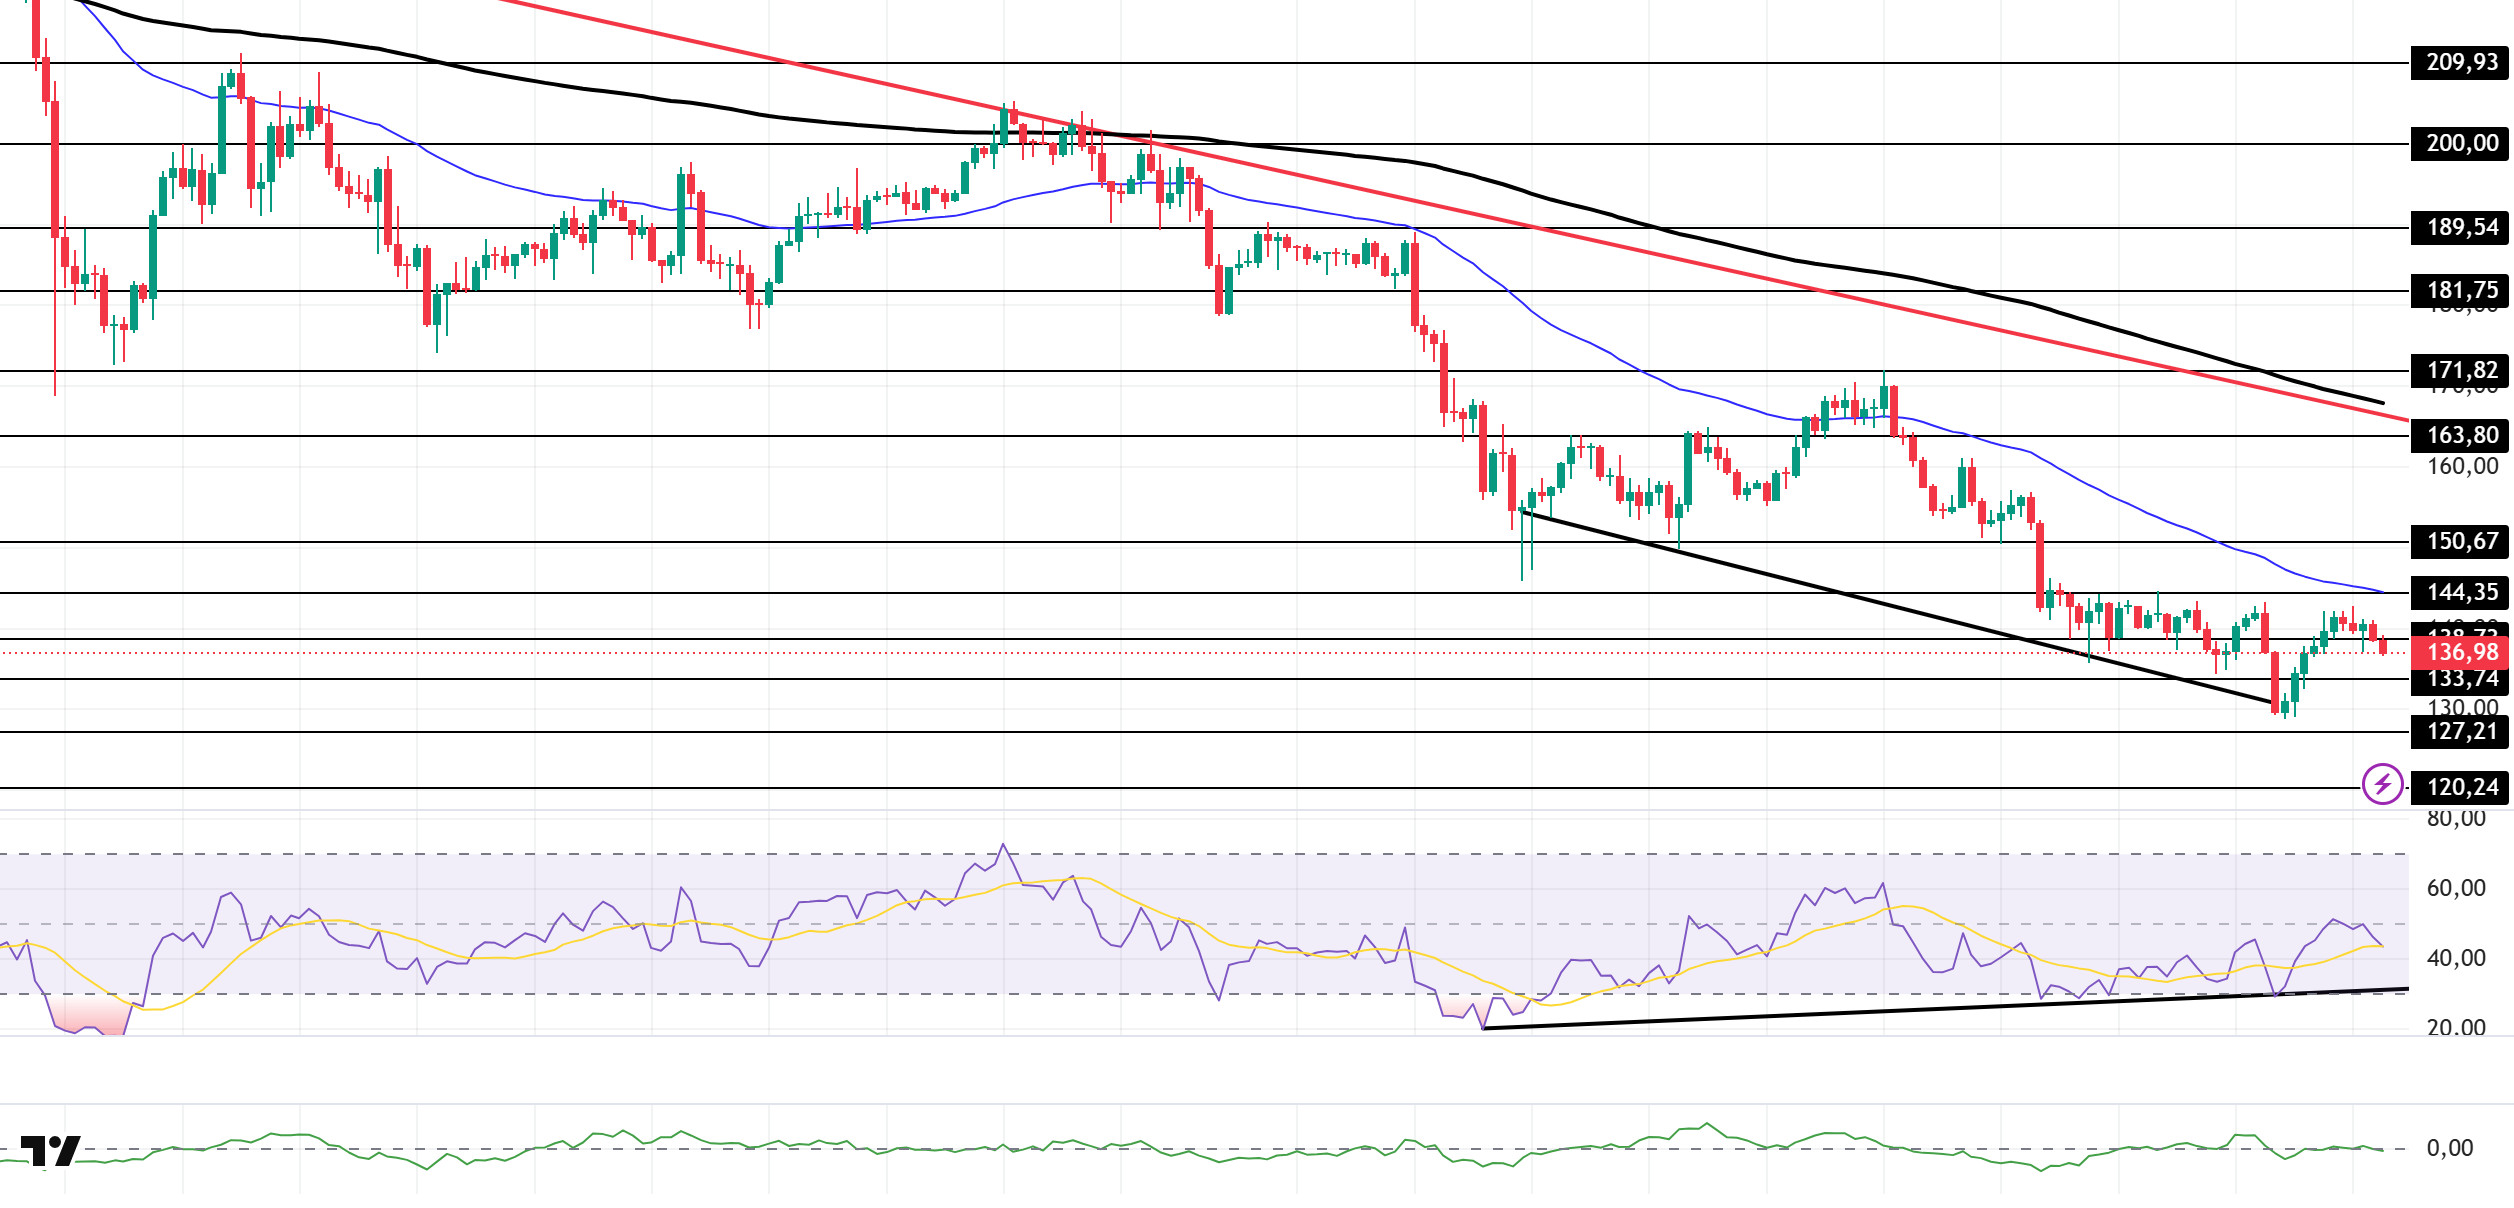
The SOL price continued its sideways movement during the day. The asset remained in the lower region of the downward trend that began on October 6. The price, which continues to stay above the strong support level of $133.74, is currently testing the $138.73 level as support. If the uptrend continues, it could test the 50 EMA (Blue Line) moving average. If the downtrend persists, the $127.21 level could act as support.
The price continued to remain below the 50 EMA (Exponential Moving Average – Blue Line) and 200 EMA (Black Line) on the 4-hour chart. This indicates a potential downtrend in the medium term. Additionally, the price being below both moving averages suggests a downward trend in the short term. On the other hand, the gap between the two moving averages shows that the asset may experience a horizontal or upward movement. Chaikin Money Flow (CMF-20) is at a neutral level. However, the balance in cash inflows may continue to keep the CMF at a neutral level. The Relative Strength Index (RSI-14) remained in negative territory. It is also above the rising line that began on November 4. This indicates increased buying pressure. At the same time, the bullish divergence remains valid. If there is an uptrend due to macroeconomic data or positive news related to the Solana ecosystem, the $150.67 level stands out as a strong resistance point. If this level is broken upwards, the uptrend is expected to continue. If pullbacks occur due to developments in the opposite direction or profit-taking, the $120.24 level could be tested. A decline to these support levels could increase buying momentum, presenting a potential upside opportunity.
Supports: 138.73 – 133.74 – 127.21
Resistances: 144.35 – 150.67 – 163.80
DOGE/USDT
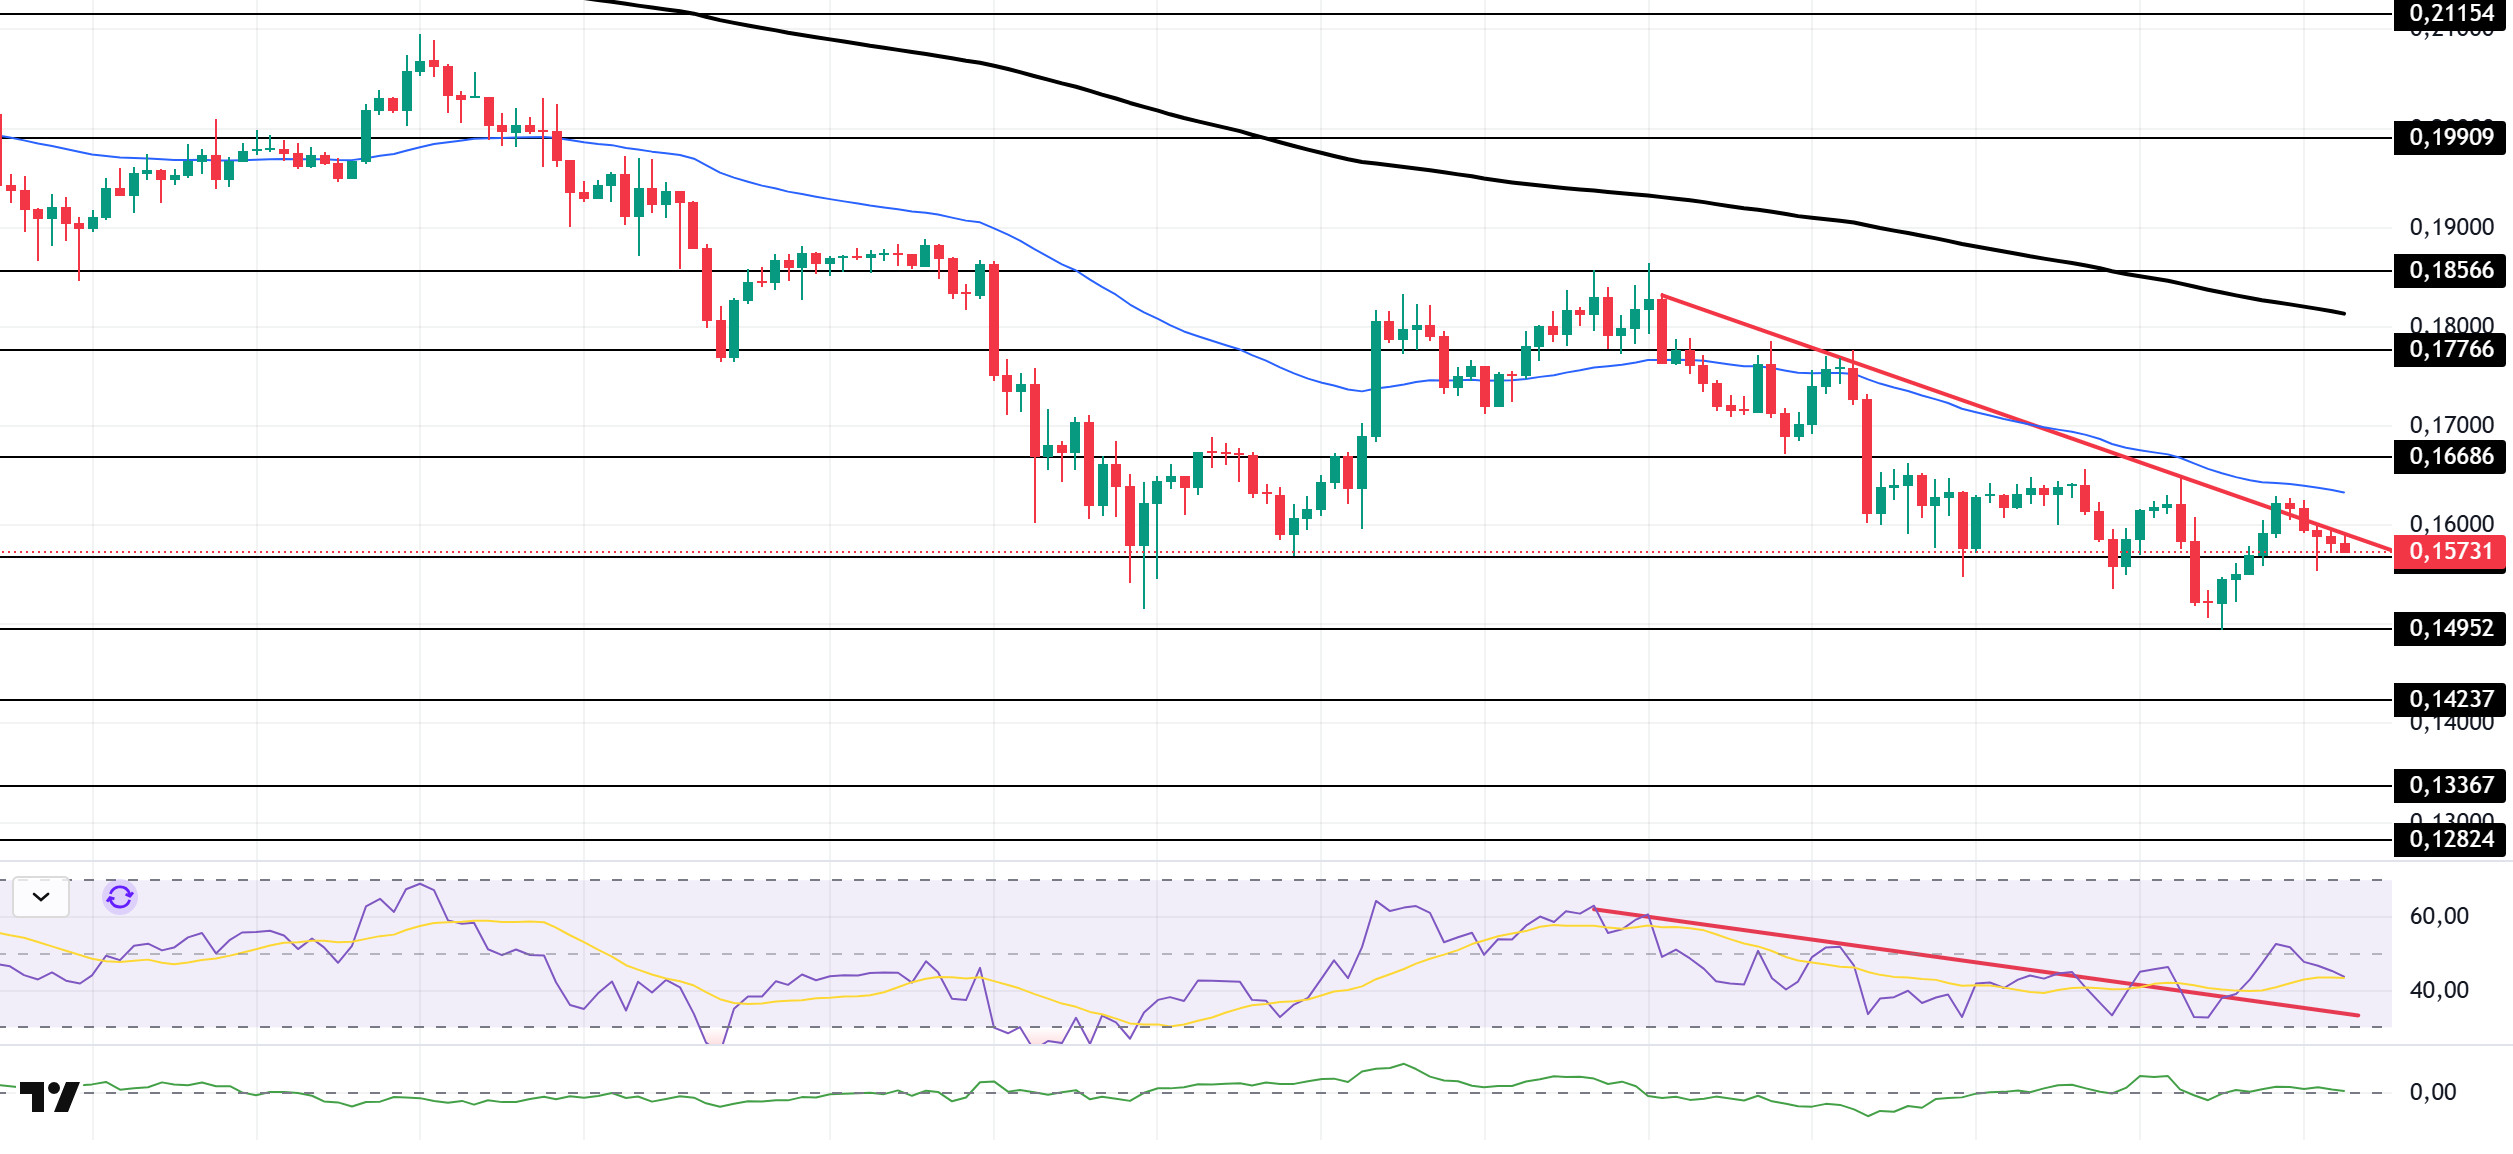
The DOGE price continued to lose value within a narrow range during the day. The asset remained in the lower region of the downward trend that began on November 11. Currently testing the downward trend line and the 50 EMA (Blue Line) moving average as resistance, the price could test the $0.16686 level as resistance if the uptrend continues. In case of a pullback, it could retest the $0.14952 level.
On the 4-hour chart, the 50 EMA (Exponential Moving Average – Blue Line) remained below the 200 EMA (Black Line). This indicates that a downtrend may begin in the medium term. The price being between the two moving averages indicates that the price is in a decision phase in the short term. On the other hand, the large difference between the two moving averages increases the potential for the asset to experience a horizontal or upward movement. The Chaikin Money Flow (CMF-20) is at a neutral level. Additionally, balanced cash inflows and outflows may cause the CMF to remain at a neutral level. The Relative Strength Index (RSI-14) is in the middle of the negative zone. It also continued to remain above the downward trend that began on November 10. This indicated that buying pressure was forming. In the event of potential increases driven by political developments, macroeconomic data, or positive news flow within the DOGE ecosystem, the $0.17766 level stands out as a strong resistance zone. Conversely, in the event of negative news flow, the $0.14237 level could be triggered. A decline to these levels could increase momentum and initiate a new wave of growth.
Supports: 0.15680 – $0.14952 – $0.14237
Resistances: 0.16686 – 0.17766 – 0.18566
SHIB/USDT
The most notable recent development in the Shiba Inu ecosystem is the new wallet-focused project announced by the Shib team on X. In an X post addressing the community with the statement, “Something new is coming for the ShibArmy… Wallet friendly Useful And unmistakably SHIB,” the team emphasized that they are working on a new product for ShibArmy that is wallet-friendly, practical, and completely synonymous with the SHIB brand. This announcement has heightened expectations for a new layer of functionality within the Shiba Inu ecosystem, particularly in the wallet and payment sectors. Investors are now focused on how the project will impact both the Shibarium infrastructure and the daily use cases of the tokens.
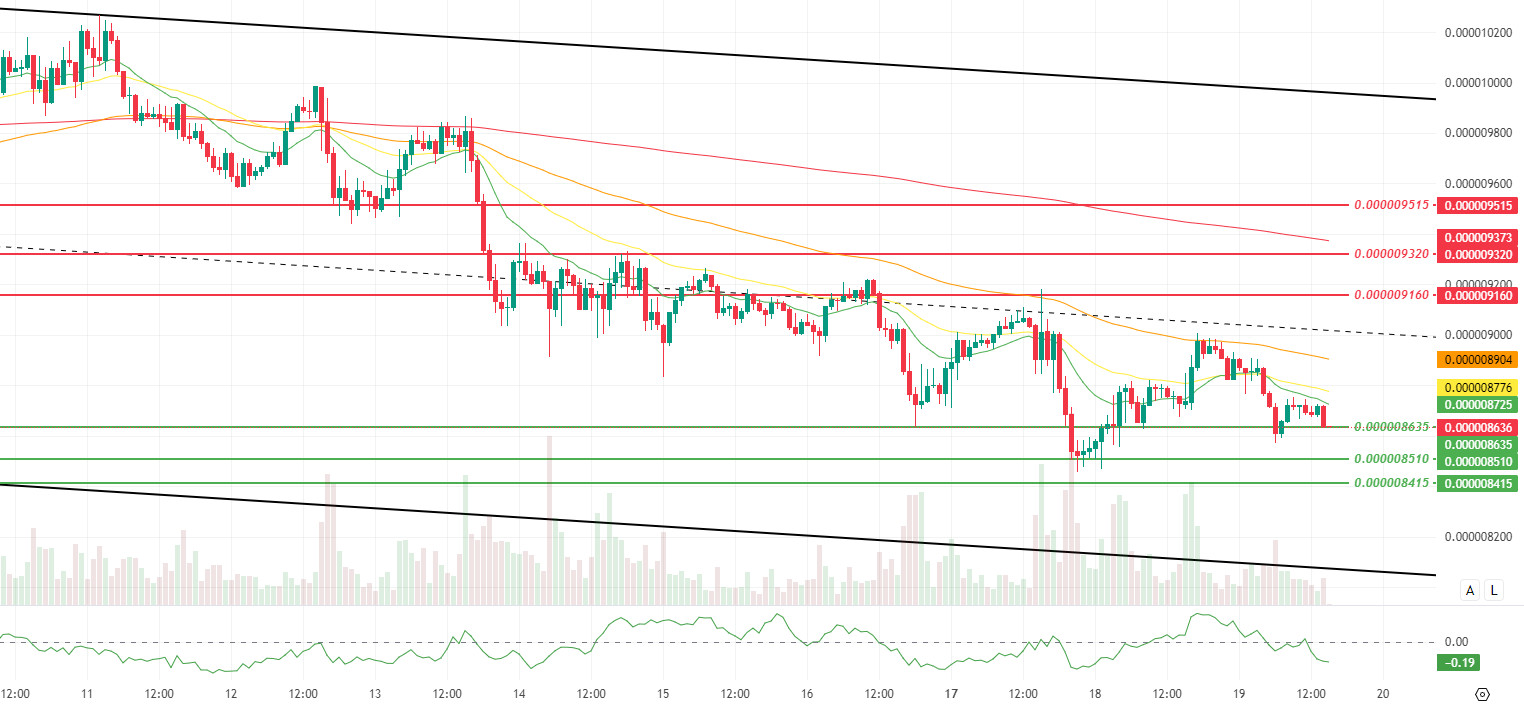
The technical chart, along with new data, shows that the consolidation process in the bottom region highlighted in our previous analysis is continuing, but that this is occurring within an increasingly narrow band. The significant decline in volatility pushes price action into a more horizontal and compressed appearance, while the relatively limited pullback in volume and momentum indicates that selling pressure is progressing in a wait-and-see mode with gradual profit-taking rather than becoming aggressive. The price’s continued trading below the Smoothed Moving Average (SMMA) 9, SMMA 21, SMMA 50, and SMMA 200 periods confirms that the pressure on the main trend has not yet been broken, while the Chaikin Money Flow (CMF) indicator remaining in negative territory suggests that new capital inflows have slowed and that current attempts at a rebound are struggling to evolve into a strong trend reversal for now.
In the short term, the $0.000008635, $0.000008510, and $0.000008415 bands remain the closest and most critical support areas. As long as the price manages to hold above this region, the $0.000008660 level will remain the first short-term threshold. If sustainability is achieved above this level, attempts to react towards the $0.000008738, $0.000008783, and $0.000008911 levels may come back on the agenda. If these intermediate resistances are overcome with increasing volume, a more meaningful recovery scenario towards the $0.000009160, $0.000009320, and 0.000009515. Conversely, if the price continues to remain below the SMMA periods, the CMF indicator deepens into negative territory, and the 0.000008635 support level is broken downward, the movement may slide toward the 0.000008510 and 0.000008415.
(SMMA9: Green Line, SMMA21: Yellow Line, SMMA50: Orange Line, SMMA 200: Red Line)
Supports: 0.000008635 – 0.000008510 – 0.000008415
Resistances: 0.000009160 – 0.000009320 – 0.000009515
Legal Notice
The investment information, comments, and recommendations contained herein do not constitute investment advice. Investment advisory services are provided individually by authorized institutions taking into account the risk and return preferences of individuals. The comments and recommendations contained herein are of a general nature. These recommendations may not be suitable for your financial situation and risk and return preferences. Therefore, making an investment decision based solely on the information contained herein may not produce results in line with your expectations.