
Technical Analysis
BTC/USDT
Recent statements from Fed members deepened the division in the policy outlook ahead of the December meeting. Collins defended a cautious stance due to inflation risks, while Williams noted that the weakening labor market opened the door for another cut; Miran emphasized that despite incomplete data, the Fed had sufficient indicators in its trend analysis. Futures pushed the probability of a December rate cut to 71%, while discussions about the upcoming Fed chair transition gained momentum in Washington. Hassett, one of the strongest candidates to succeed Powell, continued his aggressive easing stance.
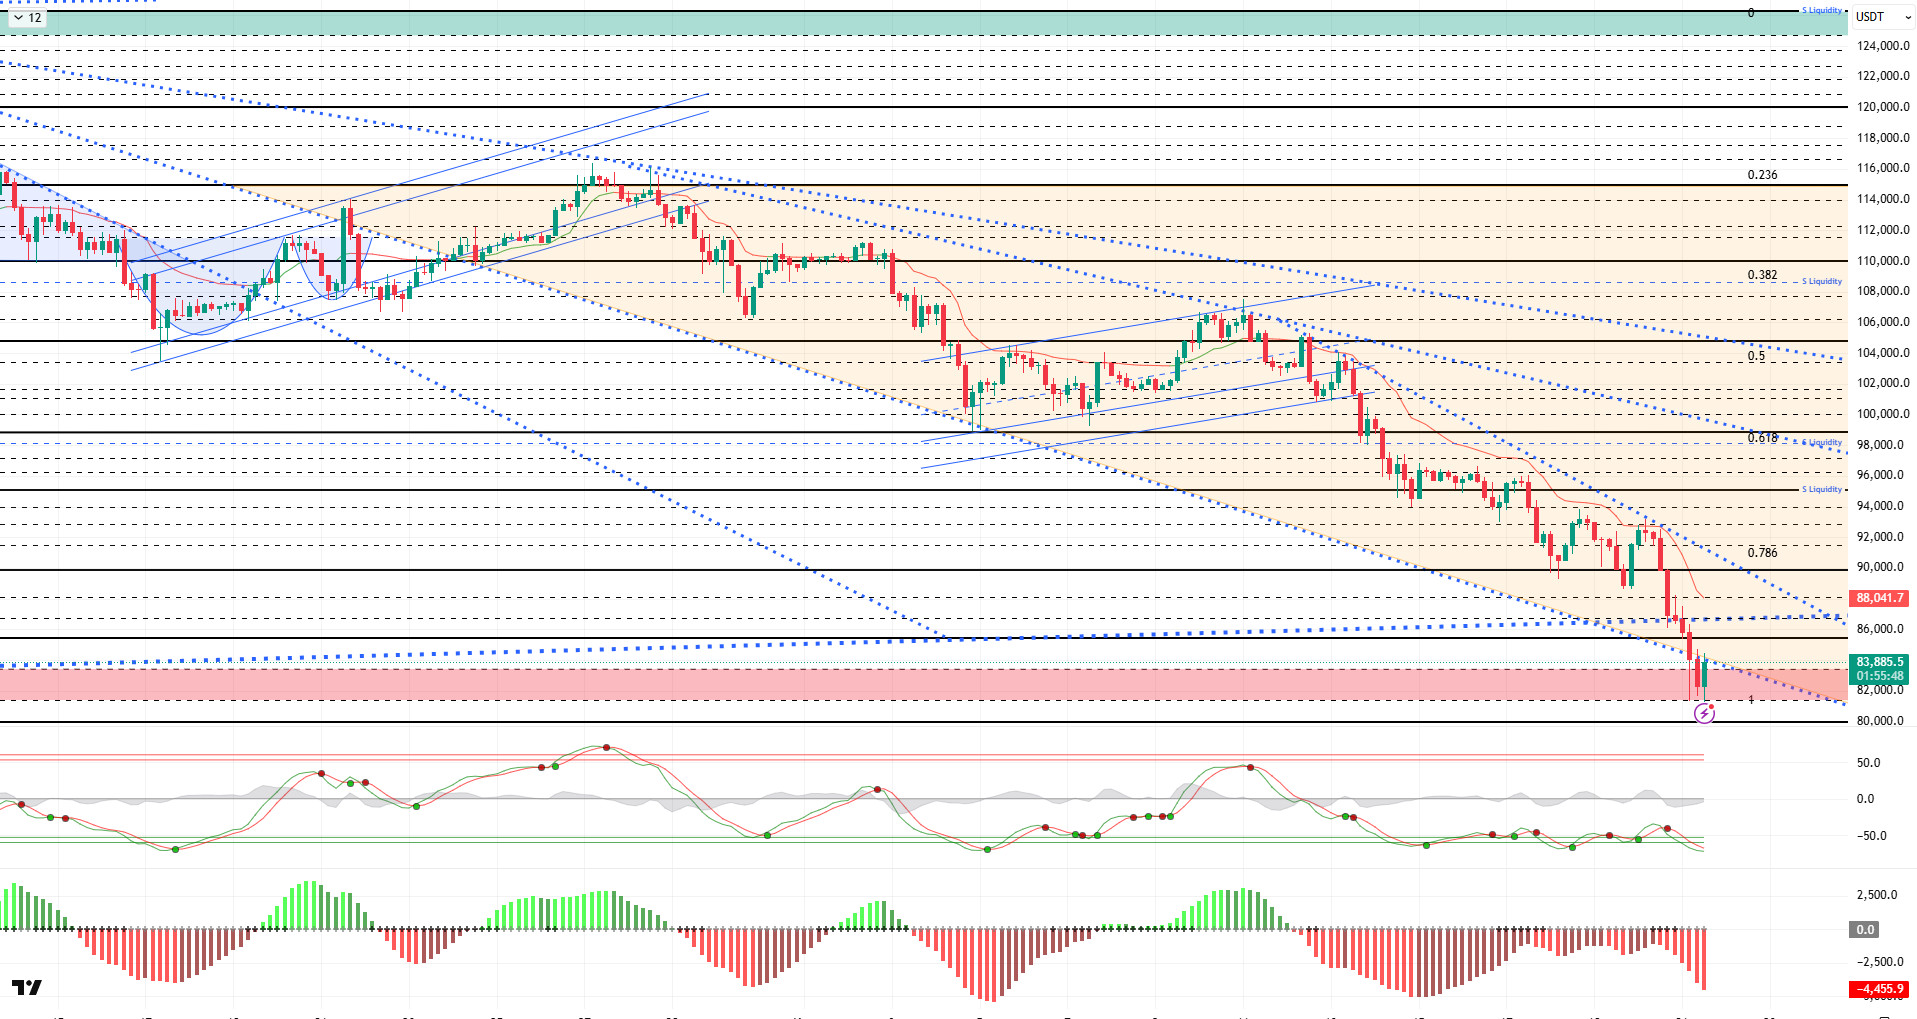
From a technical perspective, BTC faced another wave of selling during the day after a relentless decline and fell back to the 80,500 level. Then, recovering rapidly from the reaction zone due to the above developments, the price turned upward and reached 84,000.
Technical indicators show the Wave Trend (WT) oscillator giving a weak sell signal in the oversold zone after an indecisive buy/sell signal. The histogram on the Momentum (SM) indicator is attempting to regain strength after reaching maximum weakness in the negative zone. The Kaufman Moving Average (KAMA) is currently at $88,100, positioned above the price.
According to liquidation data, trades opened last year in the buy zone are being targeted, with the entire 80,000 band resulting in liquidation. In contrast, selling levels remain concentrated at 88,000 and 94,000, while accumulation continues within the 97,000–98,000 band over a broader timeframe.
In summary, the pullback in BTC was driven by factors such as changing expectations for interest rate cuts, profit-taking by whales, the decline in technology stocks, retail outflows from ETFs, and the US government shutdown. On the technical side, the price continued its downward momentum, setting a new low at 80,500. Liquidity data indicates that sell-heavy positions continue to dominate. For a rebound to occur in the coming period, the price must gain the 85,000 area, after which the major trend line will be followed again. Otherwise, selling pressure will continue to increase, and if the 83,300 support level is broken, the 81,400 point will be monitored.
Supports: 83,300 – 81,400 – 80,000
Resistances: 85,400 – 86,700 – 88,000
ETH/USDT
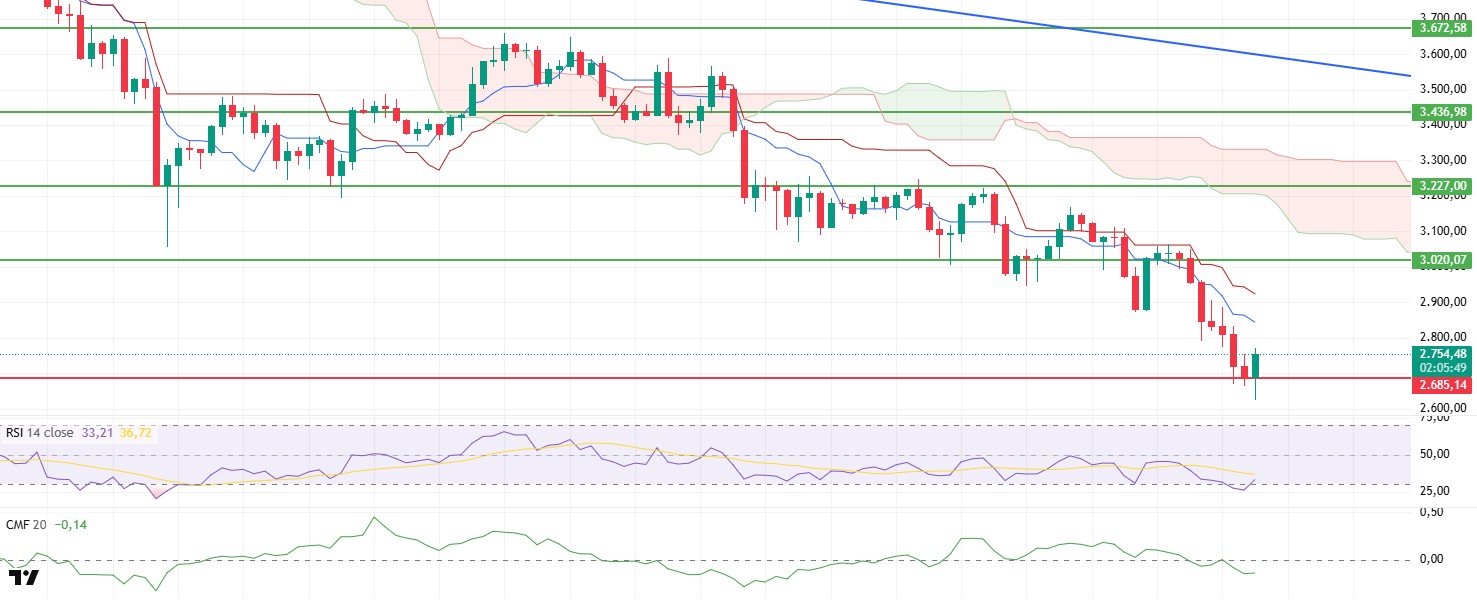
The ETH price dropped to $2,625 during the day, confirming the weak outlook seen in the morning. However, it rebounded from this level, regained the $2,685 support, and managed to climb to the $2,760 level. Staying above the support level indicates that selling pressure has eased somewhat in the short term.
The Chaikin Money Flow (CMF) indicator remains in negative territory despite the price recovery and continues its downward trend. The continued high level of liquidity outflows indicates that buyers have not yet returned to the market in force. Analysis of the CVD indicator shows that selling persists on the spot side, supporting the weakness seen in the CMF.
The Relative Strength Index (RSI) fell to the oversold zone but then moved up from this zone. The indicator shows that momentum has started to recover and that reaction buying could find support in the short term.
The Ichimoku indicator continues to show weakness. The price being below both the Kijun level and the kumo cloud indicates that the trend has not yet turned positive. This structure shows that downward pressure has not completely ended.
In the overall outlook, if the $2,685 level is maintained, the likelihood of upward movements continuing has increased somewhat compared to the morning analysis. However, if the price falls below this level, the downward trend is expected to regain strength. Although technical indicators are showing signs of recovery, there is still insufficient support for a strong trend reversal.
Supports: 2,685 – 2,550 – 2,331
Resistances: 3,020 – 3,227 – 3,436
XRP/USDT
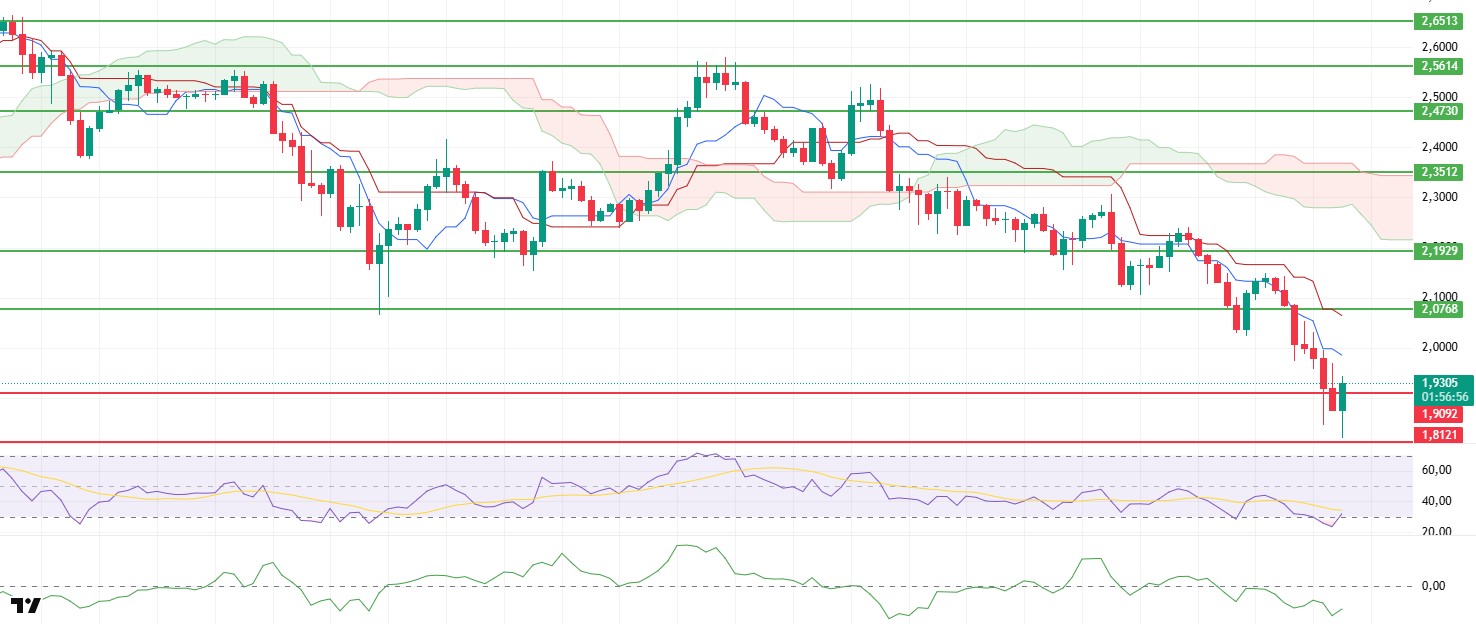
After falling to the $1.81 support level during the day, the XRP price rebounded strongly from this level and rose back to $1.93. In the short term, selling pressure appears to be weakening, and the price is attempting to recover from the support zone.
Although the Chaikin Money Flow (CMF) indicator remains in negative territory, it has turned upward. This movement indicates that liquidity inflows have begun, albeit limited, and that selling pressure has eased somewhat.
The Relative Strength Index (RSI) continues its upward movement with a rebound from the oversold zone. The recovery in momentum indicates that buyers are regaining strength in the short term. This structure suggests that rebound rallies may continue for a while longer.
The Ichimoku indicator generally maintains its weak outlook. The price trading below the cloud and the failure to sustain above short-term resistance levels indicate that the trend has not yet turned positive. The technical outlook suggests that the seller-dominated structure has not completely dissolved.
In the overall assessment, as long as the XRP price remains above $1.90, upward attempts may continue. If it falls below this level, selling pressure may intensify again, and more severe pullbacks may come into play.
Supports: 1.9092 – 1.8121 – 1.6224
Resistances: 2.0768 – 2.1929 – 2.3512
SOL/USDT
The SOL price continued to pull back during the day. The asset remained in the lower region of the downtrend that began on October 6. It tested the strong resistance level of $144.35 and the 50 EMA (Blue Line) moving average but failed to break through and experienced a pullback. Currently testing the $127.21 level as resistance, the price could test the $120.24 level as support if the decline continues. If the uptrend begins, it could retest the 50 EMA moving average.
The price remained below the 50 EMA (Exponential Moving Average – Blue Line) and 200 EMA (Black Line) on the 4-hour chart. This indicates a possible downtrend in the medium term. At the same time, the price being below both moving averages shows us that the asset is trending downward in the short term. On the other hand, the gap between the two moving averages shows us that the asset may experience a horizontal or upward movement. Chaikin Money Flow (CMF-20) fell back into negative territory. However, the decrease in cash inflows could push CMF deeper into negative territory. The Relative Strength Index (RSI-14) fell back to the middle of negative territory. At the same time, it tested the rising trend that began on November 4 as support and rose by gaining momentum. This signaled that buying pressure continued. If there is an uptrend due to macroeconomic data or positive news related to the Solana ecosystem, the $144.35 level stands out as a strong resistance point. If this level is broken upwards, the rise is expected to continue. If there are pullbacks due to developments in the opposite direction or profit-taking, the $112.26 level could be tested. If it falls back to these support levels, an increase in buying momentum could present a potential upside opportunity.
Supports: 120.24 – 112.26 – 100.34
Resistances: 127.21 – 133.74 – 138.73

DOGE/USDT
The DOGE price continued to experience pullbacks during the day. The asset remained in the lower region of the downtrend that began on November 11. Testing the downtrend as resistance, the price failed to break through and experienced a pullback, moving to the lower region of the strong support level at $0.14952. Currently, the asset is gaining momentum from the support level of $0.13367. If it experiences an uptrend, it may test the descending trend line and the $0.14952 level as resistance. If the pullback continues, it may retest the $0.13367 level.
On the 4-hour chart, the 50 EMA (Exponential Moving Average – Blue Line) remained below the 200 EMA (Black Line). This indicates that a downtrend may begin in the medium term. The price being below both moving averages indicates a downward trend in the short term. On the other hand, the large difference between the two moving averages increases the potential for the asset to move sideways or upward. The Chaikin Money Flow (CMF-20) is at a neutral level. Additionally, a decrease in cash inflows could push the CMF into negative territory. The Relative Strength Index (RSI-14) is in the oversold region of the negative zone. It also continued to remain below the downward trend line that began on November 10. In the event of a potential rise driven by political developments, macroeconomic data, or positive news flow within the DOGE ecosystem, the $0.15680 level stands out as a strong resistance zone. Conversely, in the event of negative news flow, the $0.12824 level could be triggered. A decline to these levels could increase momentum and initiate a new wave of growth.
Supports: 0.13367 – 0.12824 – 0.12282
Resistances: 0.14237 – 0.14952 – 0.15680

SUI/USDT
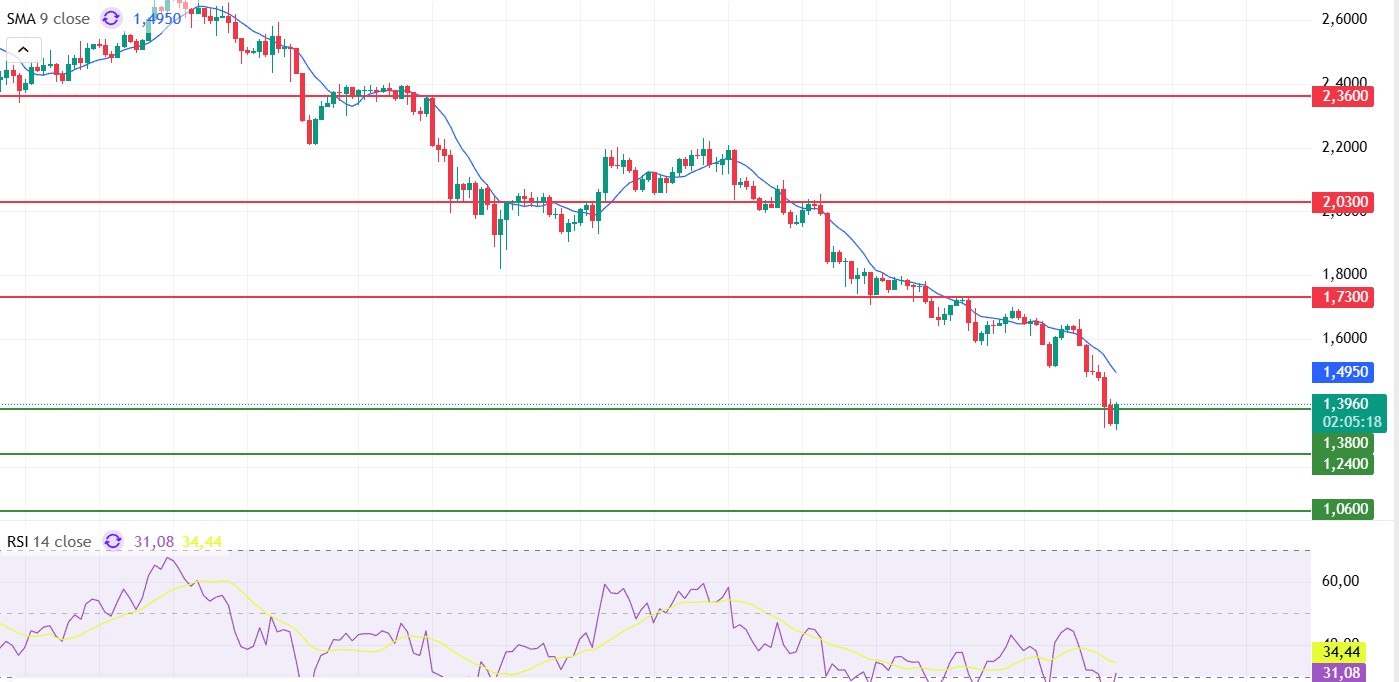
Looking at Sui’s technical outlook, we see that the price has been moving sideways around the $1.39 level on a 4-hour basis, influenced by fundamental developments. The Relative Strength Index (RSI) is currently in the range of 34.44 – 31.08. This range indicates that the market is trading close to the buy zone; a drop in the RSI to the 35.00 – 25.00 range could signal a potential buying point. If the price moves upward, the resistance levels of $1.73, $2.03, and $2.36 can be monitored. However, if the price falls to new lows, it could indicate that selling pressure is intensifying. In this case, the support levels of $1.36, $1.24, and $1.06 come to the fore. Based on the trend line, a pullback to $1.06 appears technically possible. According to Simple Moving Averages (SMA) data, Sui’s average price is currently at $1.49. If the price remains below this level, it could signal that the current uptrend may not continue technically.
Supports: 1.06 – 1.24 – 1.38
Resistances: 1.73 – 2.03 – 2.36
Legal Notice
The investment information, comments, and recommendations contained herein do not constitute investment advice. Investment advisory services are provided individually by authorized institutions taking into account the risk and return preferences of individuals. The comments and recommendations contained herein are of a general nature. These recommendations may not be suitable for your financial situation and risk and return preferences. Therefore, making an investment decision based solely on the information contained herein may not produce results in line with your expectations.


