
Weekly Technical Analysis Report December 01 – 08, 2025
BTC/USDT
While Fed members’ divergent interest rate messages kept the possibility of a 25 bp cut on the table ahead of the December meeting, the Beige Book provided a supportive backdrop for policy with signals of flat economic activity and softening labor demand. Negotiations between Russia and Ukraine continued, keeping uncertainty risk premiums elevated at a limited level. Lower-than-expected US jobless claims showed that the labor market remains resilient. On the Asian front, diplomatic tensions between Japan and China, particularly regarding Taiwan and regional security issues, remained a critical factor to watch.
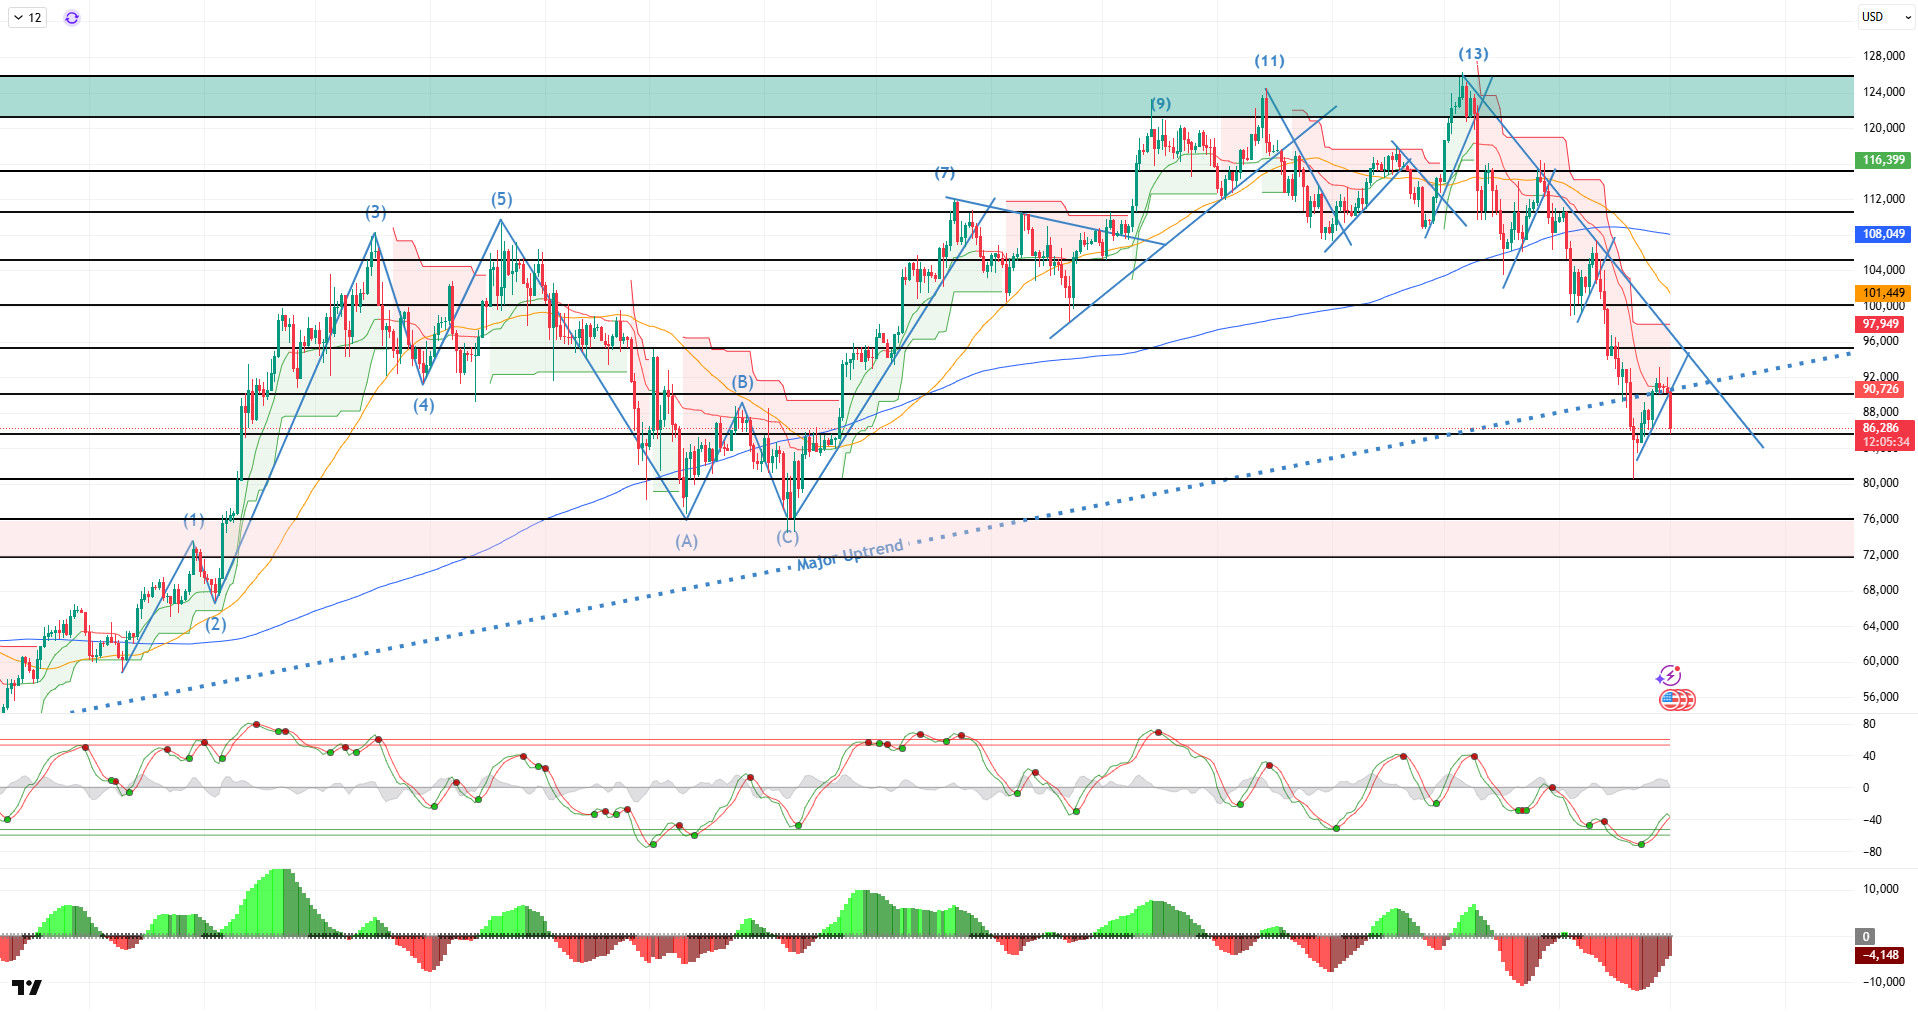
Looking at the daily technical picture after all these developments, BTC deepened its downtrend, which started from the ATH level of 126,200 points, falling to 80,500 points, along with the 13th point it reached with its golden cross formation. The price then recovered from this level, tested the 93,000 level, and moved back above the major uptrend. Unable to hold here, the price reversed direction again and returned to the 85,000 range. The price closed November with a 17.67% decline and started December with a 3.90% decline.
Looking at the technical indicators, the Wave Trend (WT) oscillator confirmed the rise in parallel with the buy signal it gave in the oversold zone on a daily basis. The Squeeze Momentum indicator (SM) continues to try to move into positive territory after maximum weakness in the negative zone. In moving averages, the golden cross pattern that began on May 17, with the 50-day SMA crossing above the 200-day SMA, appears to have been lost.
Looking at weekly liquidation data, the buy level was liquidated above 86,000 with the recent decline, while the fragmented buy level continues to maintain its accumulation within the 83,000-85,000 band. In contrast, the sell level regained intensity at 92,000-94,000.
In summary, the momentum captured in BTC with expectations of a Fed interest rate cut has come to an end. While the Bank of Japan’s messages of tightening monetary policy are putting pressure on the markets, it has been reported that Trump has nominated his candidate for Fed chair. On the technical side, the price rebounded from a new low of 80,500 and tested the 93,000 level. Liquidity data shows that buy and sell orders have become the target again. In the coming period, it will be monitored whether the price will recover after the recent decline and regain momentum by breaking above the major uptrend. If this area is regained, the price is expected to head towards six-digit levels, while in the event of potential selling pressure, the 85,000 level will be monitored as the last reference point before the price tests the double bottom at 80,000.
Supports: 85,000 – 83,800 – 80,000
Resistances: 90,000 – 95,000 – 100,000
ETH/USDT
The Ethereum ecosystem is undergoing a critical process this week in terms of both on-chain developments and price movements. The Fusaka upgrade, which will be activated on the mainnet on December 3, 2025, will be the second major hard fork of the year after Pectra in May. This update includes significant improvements in performance and security, and contains steps specifically aimed at enhancing the developer experience. Therefore, it creates positive expectations for the network’s long-term growth potential.
Looking at the data on the chain, investor confidence still appears to be strong. The Ethereum Total Value Staked amount, which was 36.05 million at the start of the week, rose to 36.11 million. This increase shows that investors maintain their faith in the network’s future with the PoS model and that long-term staking behavior continues. This can be considered one of the strongest indicators that ecosystem activity is ongoing.
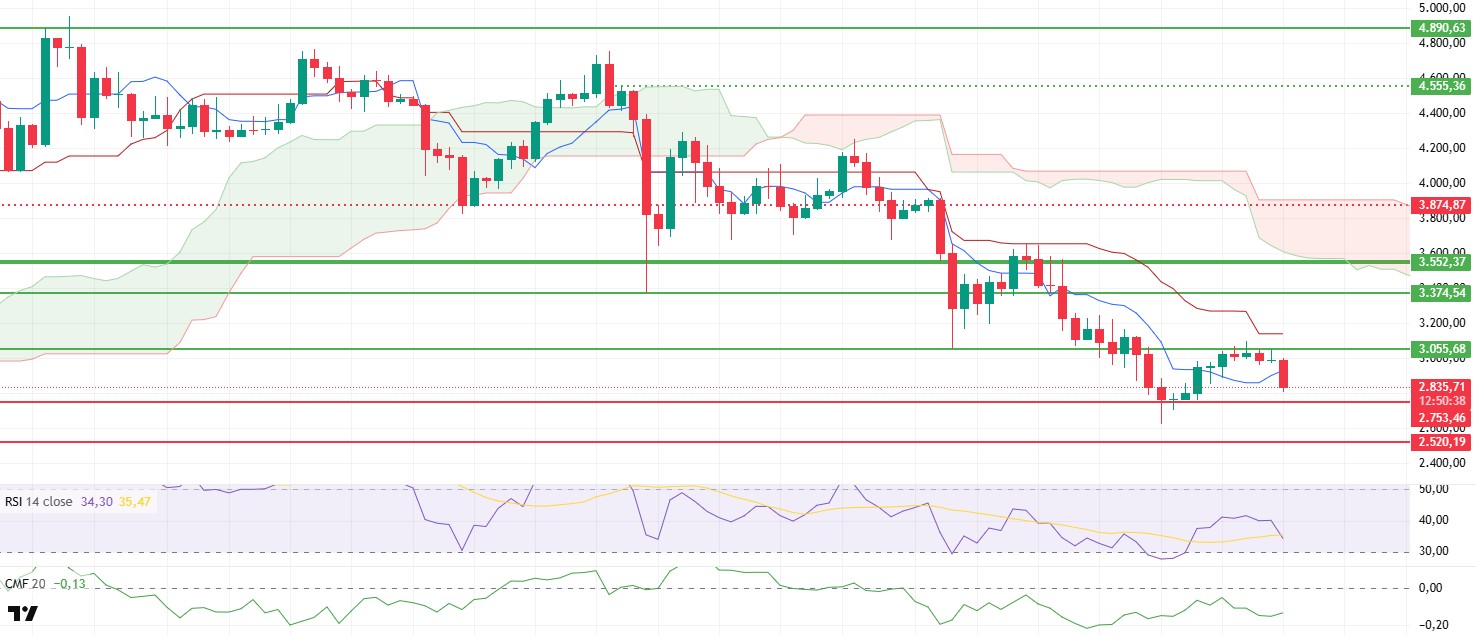
However, the outlook on the price side is much more volatile and fragile. Ethereum surpassed the $3,055 level last week and rose to the $3,100 range. However, with the weekly close, the market structure completely collapsed, and sharp sell-offs pushed the price back down to the $2,806 level. This decline reveals that attempts to rise have failed to gain traction and that there is still strong selling pressure in the market.
Liquidity indicators also confirm the background of this decline. While the Cumulative Volume Delta (CVD) data shows that sales are dominant on the spot side, the Chaikin Money Flow indicator remaining in negative territory indicates that there has been no strong capital inflow into the market. The weakness of the buyer side and low risk appetite for the market are the most important factors negatively affecting short-term pricing.
There is also a clear weakness on the momentum side. The Relative Strength Index (RSI) indicator fell sharply below the 35 level, indicating that downward pressure continues and that the price is positioned in a dangerous decision zone. The fact that momentum has not yet shown signs of recovery weakens the possibility of a strong reversal in the short term.
The Ichimoku indicator confirms that the negative trend is continuing, as the price is trading below the kumo cloud and the tenkan level has been lost again. This outlook indicates that the possibility of a downward movement in the short term remains strong.
Overall, while on-chain confidence remains strong on the Ethereum side, fragility dominates the price structure. If the price breaks below the $2,753 level and closes below it, a deeper pullback towards the $2,500 level is possible. On the other hand, if the $3,055 level is strongly surpassed again, the weak outlook could be disrupted and the way could be paved for rapid rises. For now, it seems more likely that the market will follow a flat and cautious path. The Fusaka update and macro developments appear to be decisive in determining the short-term direction.
Support levels: 2,753 – 2,520 – 2,375
Resistances: 3,055 – 3,374 – 3,552
XRP/USDT
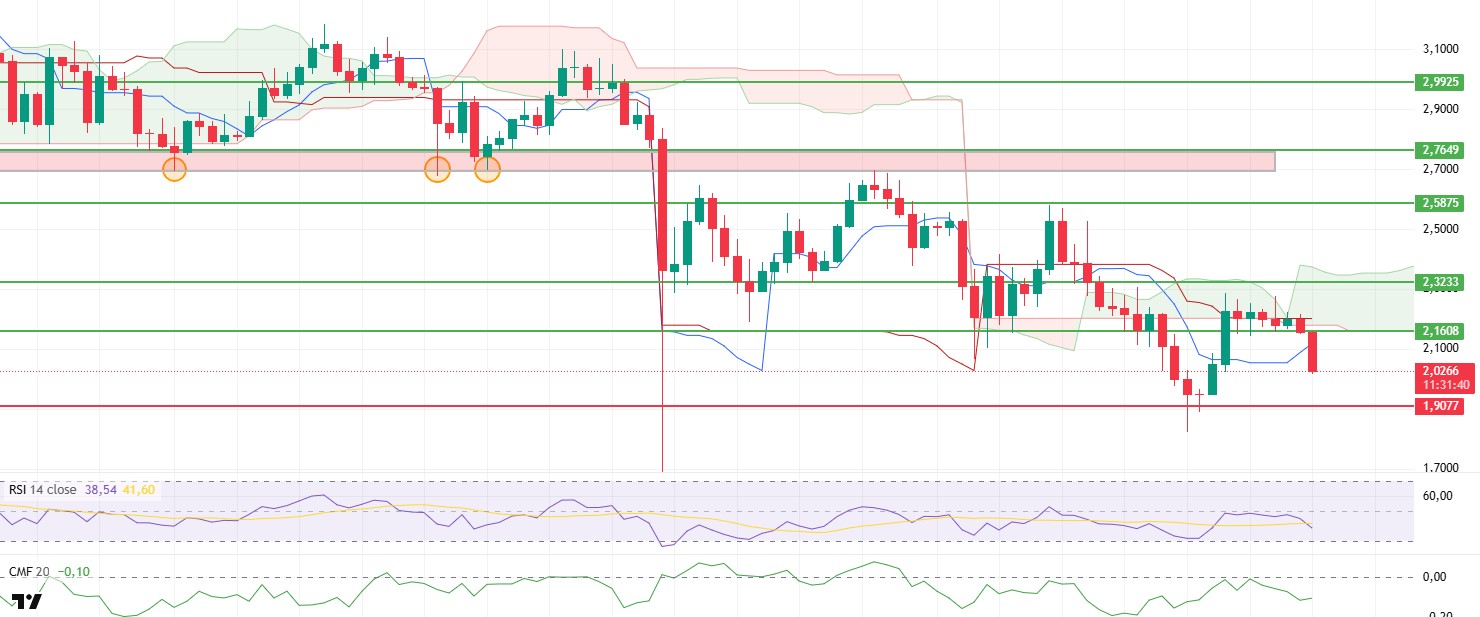
The XRP market is showing a weak outlook this week. Although the price remained flat above the $2.16 level throughout last week, selling pressure after the weekly close broke this support level downward, and the price fell to the $2.05 level. This pullback indicates that buyers are losing strength and uncertainty in the market is increasing again.
The picture is also negative on the momentum side. The RSI indicator continuing its downward trend and remaining below the midline confirms that upward movements are still weak. The dominance of seller-heavy transactions is creating an obstacle to a strong recovery.
On the CMF side, which shows liquidity flows, the persistence in the negative zone is noteworthy. The weakening of capital entering the market indicates that the recent rises have not formed a lasting trend and that selling pressure may continue.
The technical trend outlook has deteriorated significantly on the Ichimoku side. The price remaining below the kumo cloud indicates that the short- and medium-term trend has turned negative again. Additionally, the loss of the Tenkan level stands out as another significant weakness limiting upward moves in the short term.
In this context, critical levels for XRP have become clear. The $1.96 support level is the most important reference point. If this level is lost, selling pressure is likely to increase sharply, and the price could rapidly retreat towards the $1.90–$1.85 range. Below this region, the decline could spread to a wider area and the market could be driven into panic. For the possibility of a rebound to come back on the agenda, the price must first stabilize above $2.05 and then strongly break through the $2.16 level. A substantial move above this level could reverse the negative outlook and enable the price to advance towards the $2.24 and $2.30 targets. Overall, seller pressure is evident in the market, and weak liquidity is negatively affecting the price. The critical breakout thresholds that will determine XRP’s direction should be closely monitored. In particular, the $1.96 support and $2.16 resistance levels stand out as the main levels that will determine the price’s fate in the coming weeks.
Supports: 1.9077 – 1.6189 – 1.2195
Resistances: 2.1608 – 2.3233 – 2.5875
SOL/USDT
In the Solana ecosystem;
- Circle minted an additional 500 million USDC on the Solana network.
- Franklin Templeton submitted its spot ETF prospectus to the SEC. The prospectus states that the fee will be set at 0.19%, the lowest among Solana spot ETFs, and that no fees will be charged for the first $5 billion in assets under management.
- A South Korean-based centralized exchange suffered a $37 million hack attack on its Solana assets.
- CoinShares withdrew its SEC application for a Solana ETF.
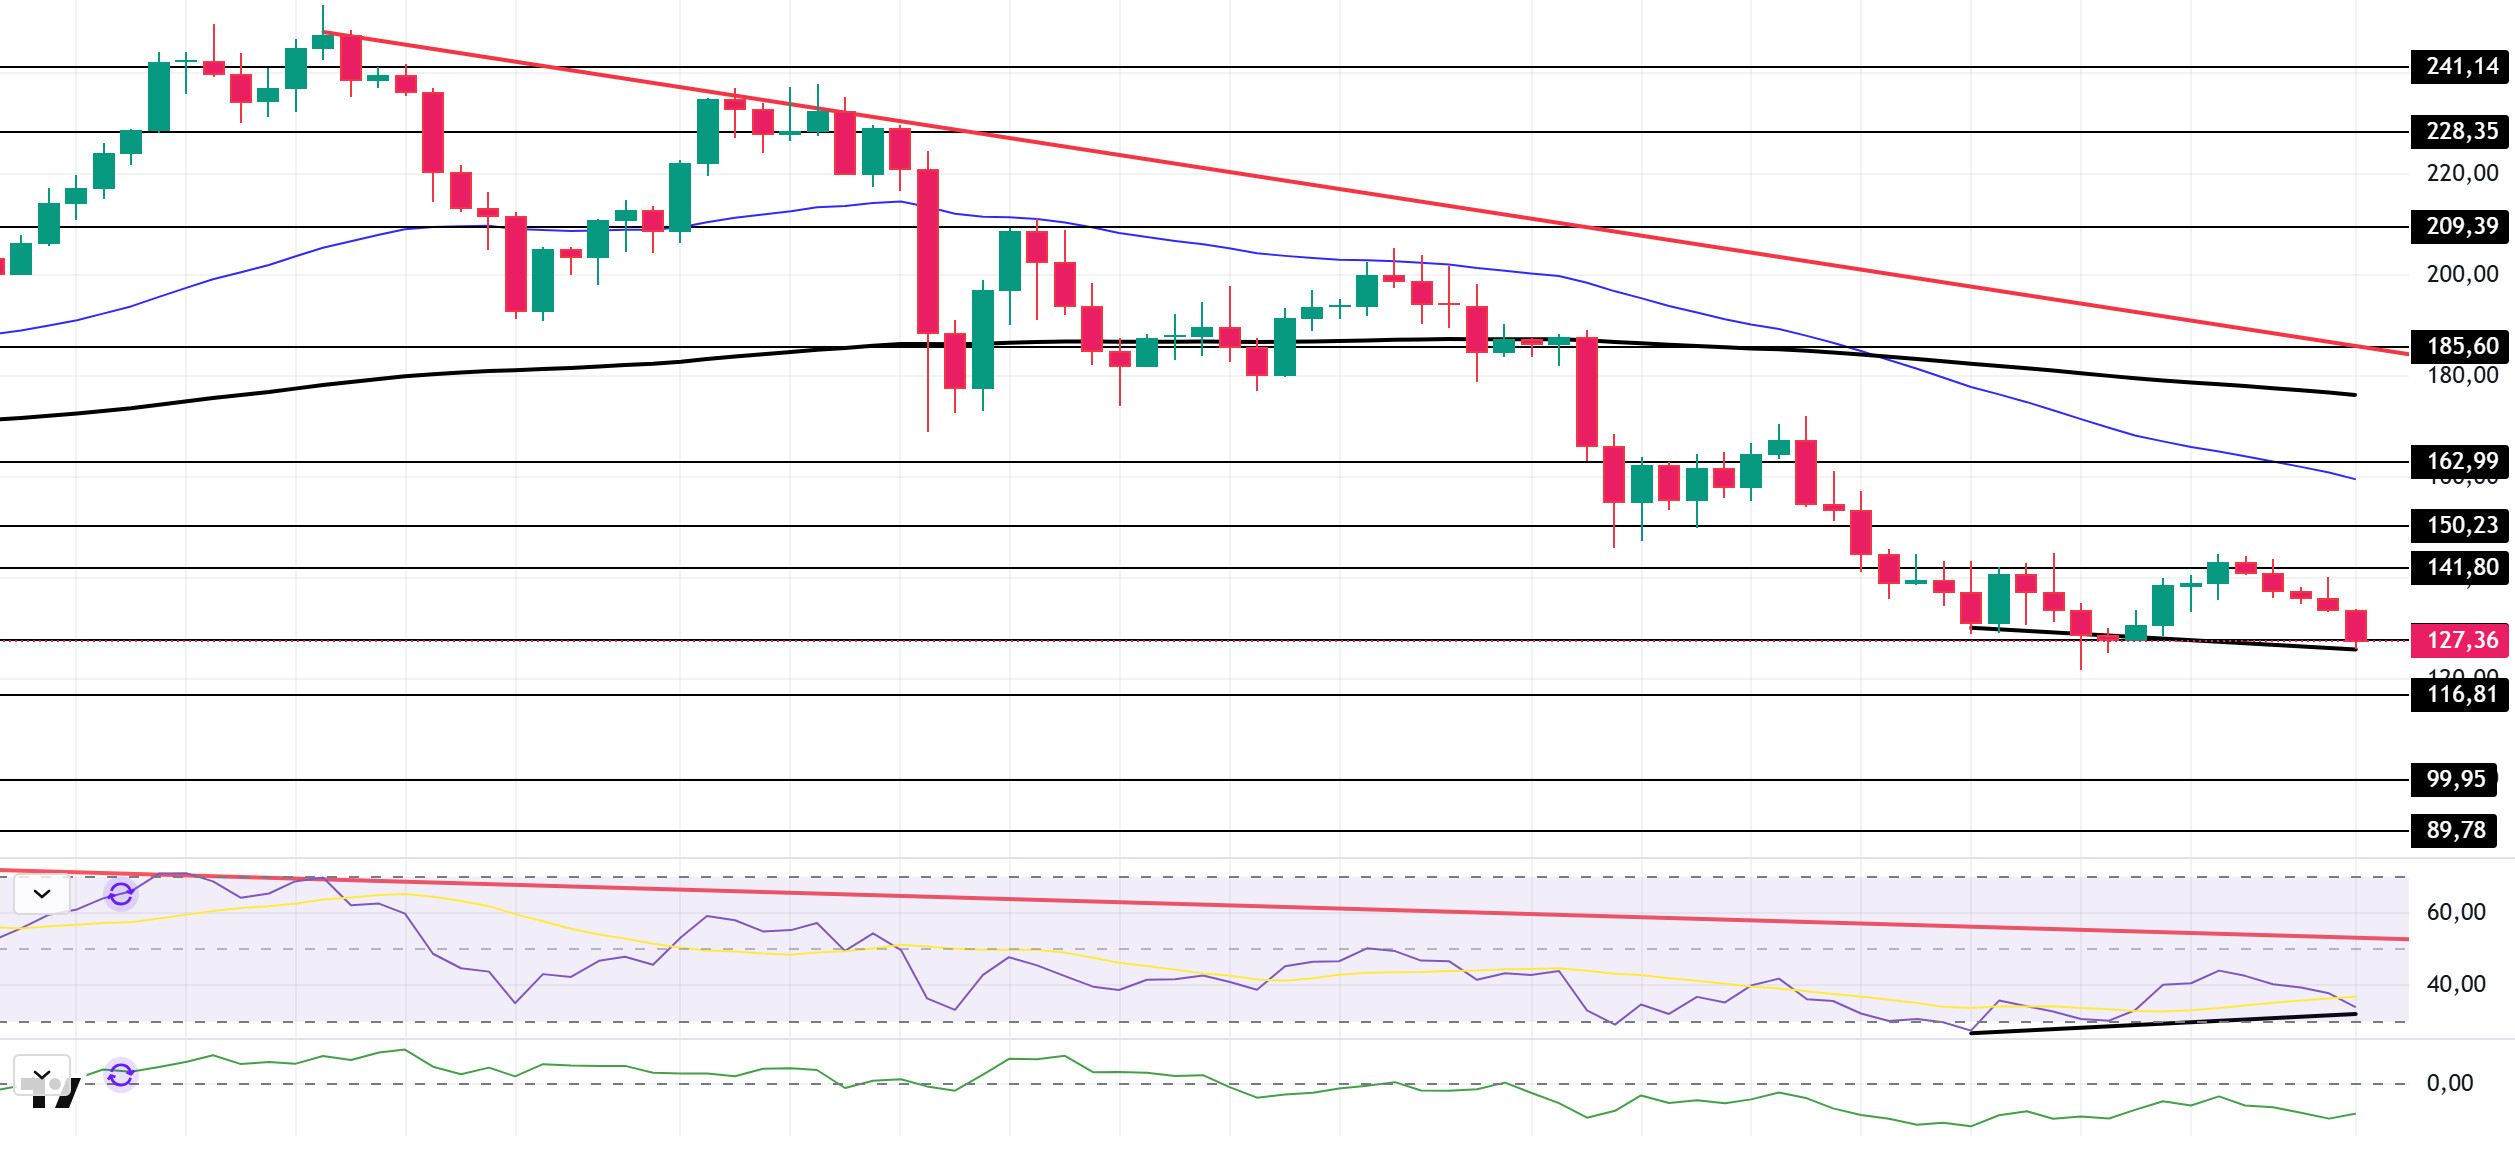
The SOL price experienced a pullback on the daily chart this week. The asset remained in the lower region of the downtrend that began on September 18. Testing the strong resistance level of $141.80, the price failed to hold there and deepened its decline. Currently testing the $127.62 level as support, the price could test the 50 EMA (Blue Line) moving average as resistance if an uptrend begins. If the pullback continues, the $99.95 level should be monitored.
The asset is trading below its 50 EMA (Exponential Moving Average – Blue Line) and 200 EMA (Black Line) moving averages, indicating that the asset is trending downward. Additionally, the 50 EMA has crossed below the 200 EMA. This signals the continuation of a technical “dead cross” formation, indicating increased downside potential in the medium term. The RSI (14) is hovering near the oversold zone. At the same time, the indicator remained below the downward trend line that began on July 22. These factors indicate increased selling pressure. The Chaikin Money Flow (CMF-20) remained in negative territory. Furthermore, increased outflows could push the CMF-20 indicator deeper into negative territory. On the other hand, there is a positive divergence. If macroeconomic data remains positive and developments in the ecosystem continue to be favorable, the first major resistance level at $162.99 could be retested. Conversely, in the event of potential negative news flow or deterioration in macro data, the $99.95 level could be monitored as a potential buying opportunity.
Supports: 127.62 – 116.81 – 99.95
Resistances: 141.80 – 150.23 – 162.99
DOGE/USDT
- NYSE Arca announced that it has approved the Bitwise Dogecoin ETF, which will be launched soon.
- Bitwise is launching the Dogecoin ETF (BWOW) on the New York Stock Exchange.
- Buenos Aires has approved a new law allowing tax payments to be made with Dogecoin.
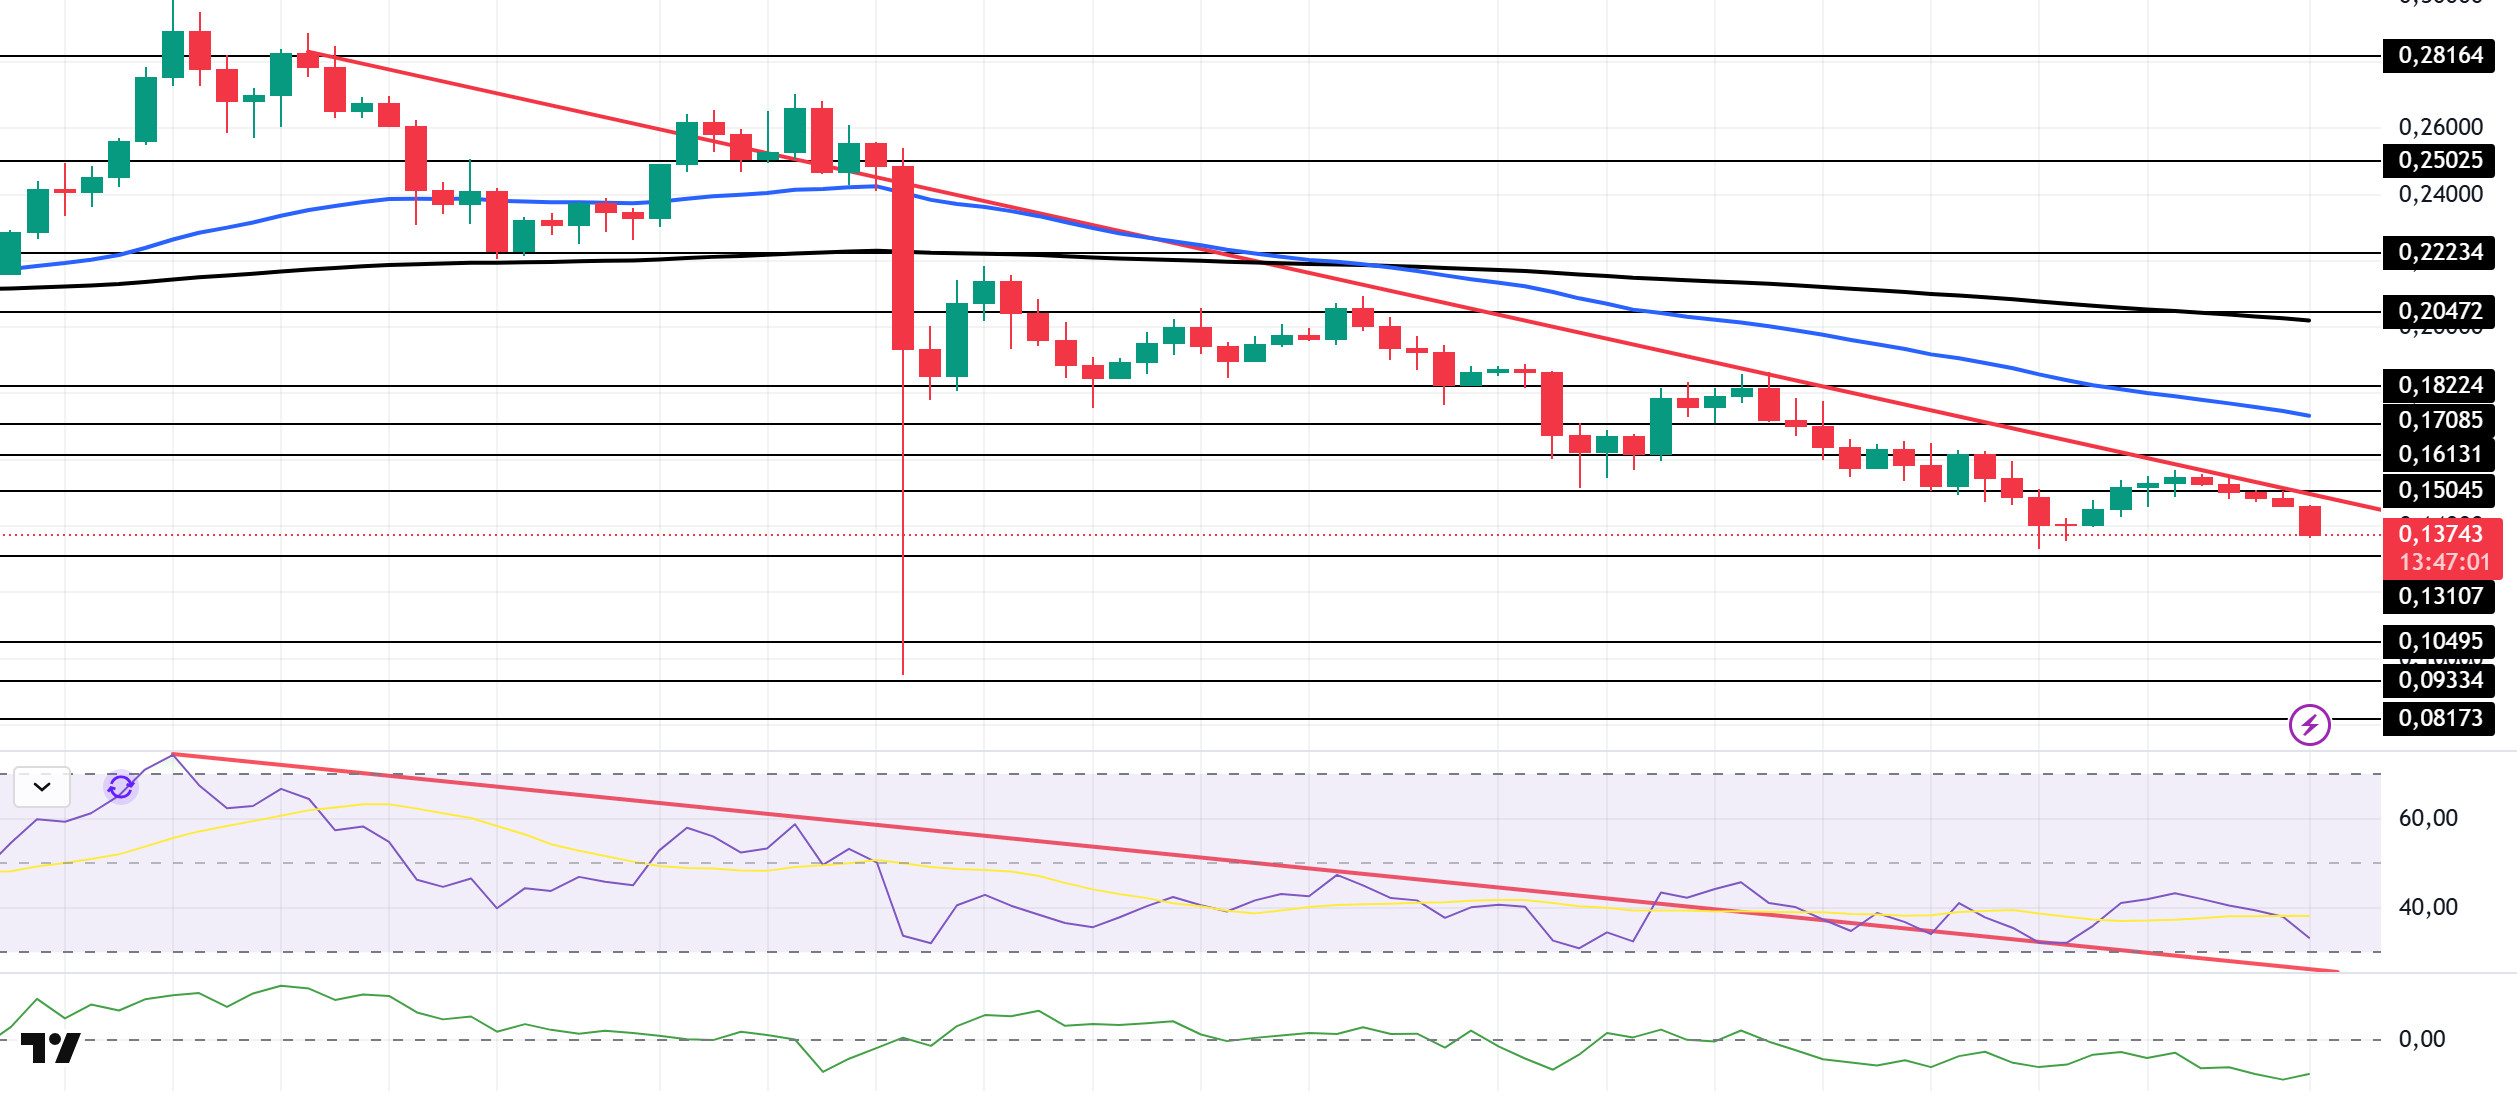
DOGE has been declining on the daily chart since last week. The asset remained in the lower region of the downtrend that began on September 18. Testing the downtrend, which is a strong resistance level, the price failed to break through this level and deepened its pullback. Currently preparing to test the $0.13107 level, the price could test the $0.10495 level as support in the event of candle closes below this level. If an uptrend begins, it could test the 50 EMA (Blue Line) moving average as resistance.
The asset continued to trade below the 50 EMA (Blue Line) and 200 EMA (Exponential Moving Average – Black Line) moving averages. This indicates that the asset is in a downward trend. On the other hand, the 50 EMA moving average being below the 200 EMA moving average shows us that the “dead cross” formation is continuing. This also indicates that the asset has the potential to lose value at this moment. The Chaikin Money Flow (CMF–20) indicator remained in negative territory. Money inflows continue to decline. This could push the CMF-20 deeper into negative territory. Looking at the Relative Strength Index (RSI-14) indicator, it has fallen close to the oversold zone. At the same time, it has remained in the upper region of the downward trend that has continued since September 13. This indicates that buying pressure could build. In the event of macroeconomic risks or negative news from the ecosystem, the $0.10495 level can be monitored as strong support. On the other hand, if the upward movement gains strength, the $0.17085 level comes to the fore as the first strong resistance level.
Supports: 0.13107 – 0.10495 – 0.09334
Resistances: 0.15045 – 0.16131 – 0.17085
TRX/USDT
Last week, the TRON network generated a total of $40.5 million in revenue, continuing to be the highest-earning ecosystem among all blockchain networks. The continuity of TRON’s revenue generation is a critical factor that strengthens the network’s competitive advantage in the DeFi and stablecoin sectors.
During the week of November 24-30, 2025, a total of 23.7 million TRX were burned on the TRON network. Despite this, the circulating supply increased by 3.8 million. The increase in circulating supply creates an inflationary effect on TRX. This development may create slight supply pressure on the TRX price in the short term, but if the burn trend continues, a balance may be seen in the medium term. Additionally, the total number of addresses also increased by 1.8 million to 349.4 million during the same week.
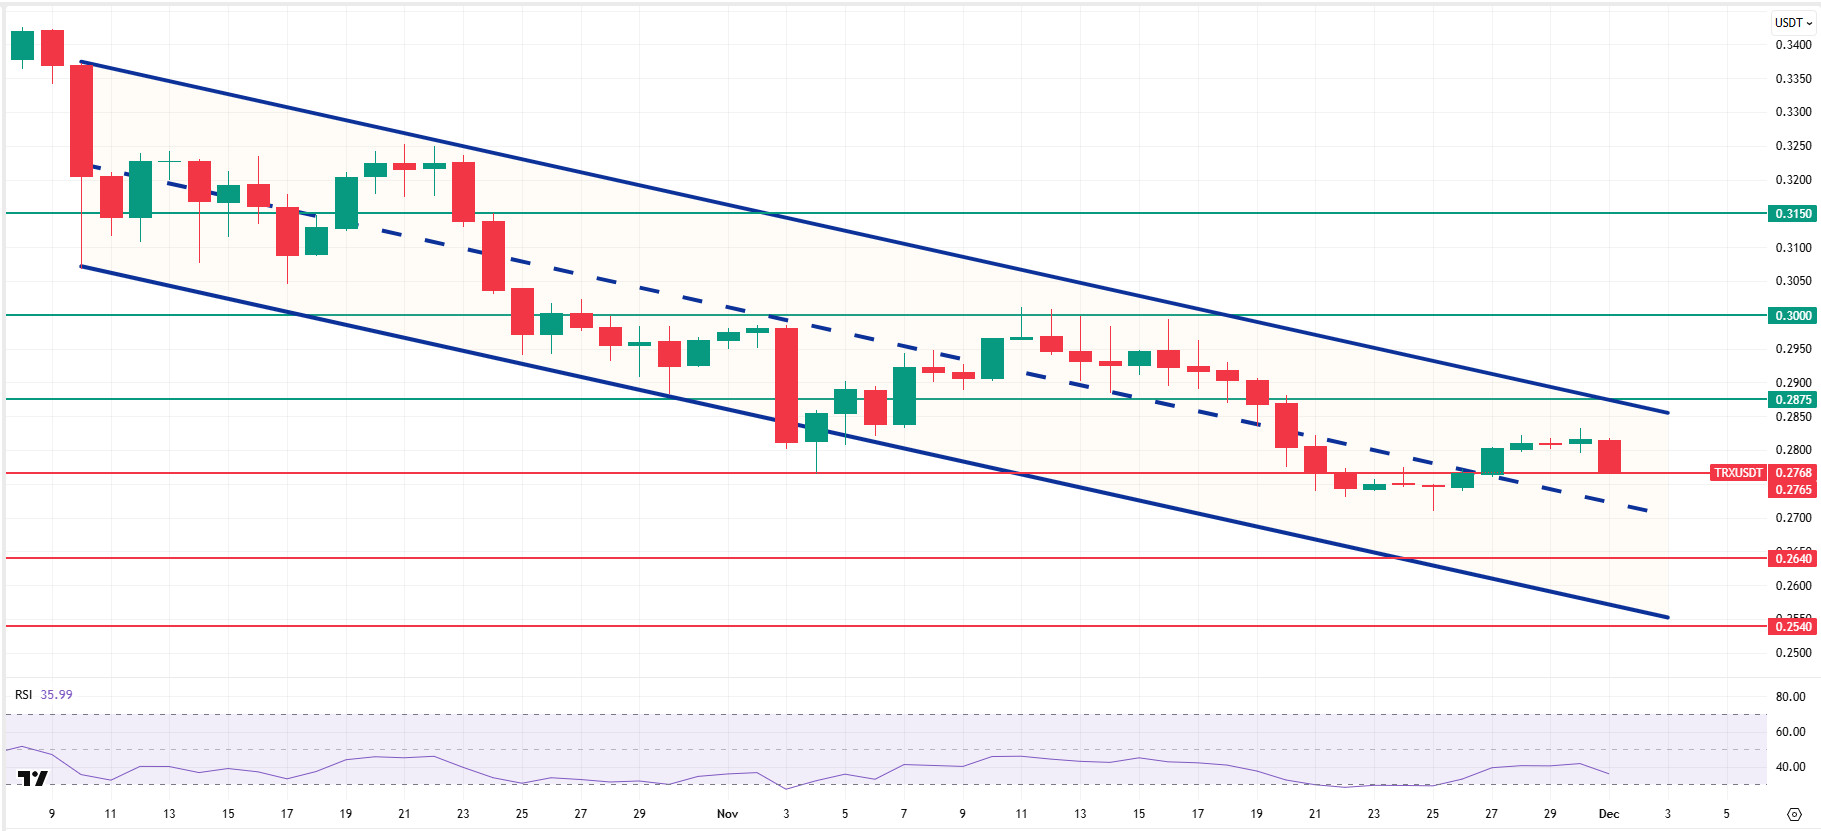
Technically speaking, TRX started last week at 0.2751 and gained approximately 2.5% in value throughout the week, closing at 0.2816. Thus, TRON ended last week with an increase, bringing its market value to $26.6 billion. Currently trading at 0.2768, TRX is in the middle band of the bearish channel on the daily chart and is attempting to break below the 0.2765 support level. The Relative Strength Index (RSI) value is observed to be very close to the oversold zone at 35. Considering its position within the bearish channel and the RSI indicator, the TRX price may be expected to rise. This indicates that it may want to move towards the upper band of the channel. In such a case, it may test the 0.2875 resistance. If it closes above the 0.2875 resistance level on a daily basis, it may test the 0.3000 resistance level. If it fails to close above the 0.2875 resistance level on a daily basis and selling pressure increases in the market, it may decline due to potential selling from this area. In such a case, it may test the 0.2640 support level. The 0.2540 level is being monitored as a critical support point on the daily chart. Staying above this level could maintain the upward trend, while closes below it could lead to increased selling pressure and deeper downward price movements.
Supports: 0.2765 – 0.2640 – 0.2540
Resistances: 0.2875 – 0.3000 – 0.3150
AVAX/USDT
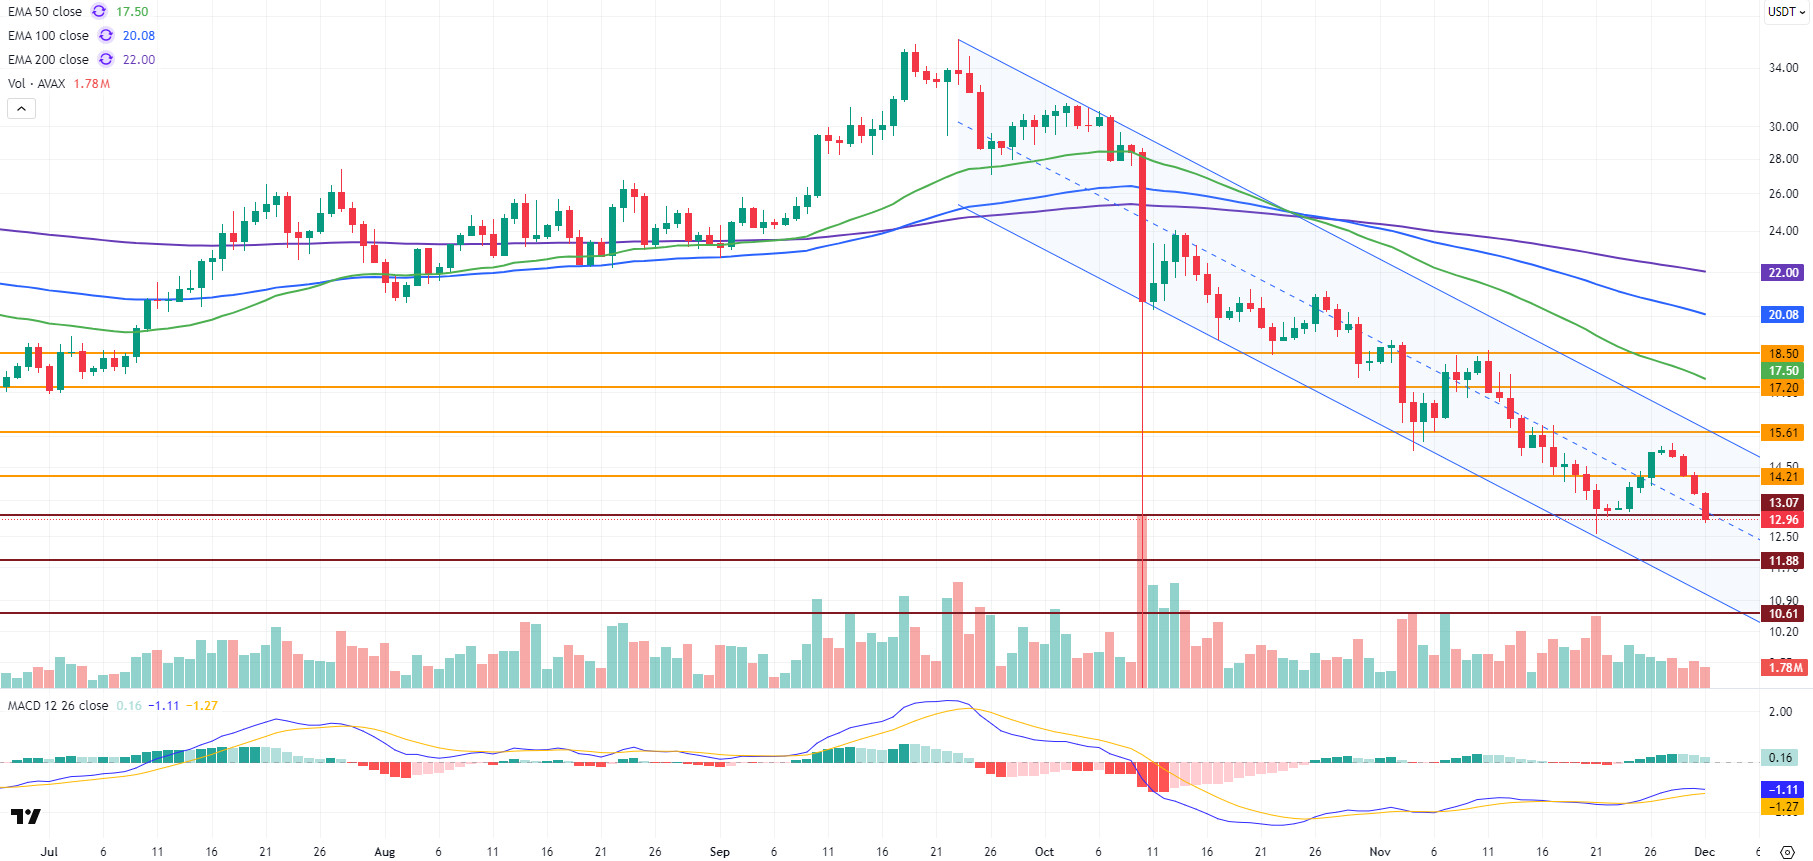
AVAX started last week at $13.28 and rose to $15.27 during the week, influenced by the recovery seen in the crypto market. During this rise, AVAX broke through the $14.21 resistance level and rose above the middle band of the bearish channel but failed to maintain its position in this area. With the incoming selling pressure, the price fell back below $14.21 and retreated towards the middle band of the bearish channel at $ . The weekly close was at $13.71, with AVAX losing approximately 3.32% on a weekly basis. Although expectations of interest rate cuts by the Fed triggered a short-term rise in the crypto market, weak volume limited AVAX’s upward movement. Positive developments in the Avalanche ecosystem and ETF news flow provided fundamental support, but no lasting positive impact on the price materialized under current market conditions. AVAX started the new week with a decline, falling below $13 and trading below both the $13.07 support level and the bearish channel mid-band. Closings below these levels could increase selling pressure.
On the daily chart, the Moving Average Convergence/Divergence (MACD) line remains in negative territory despite being above the signal line. This indicates that momentum has not yet gained strength. The MACD line and signal line moving very close to each other could lead to a potential breakout in the short term. For momentum to strengthen, it is critical for the MACD to move into positive territory. Otherwise, selling pressure encountered at resistance levels could limit gains, and AVAX could continue its downward movement within the bearish channel. AVAX continues to trade below all critical Exponential Moving Average (EMA) levels. These levels forming above the price create a strong resistance band and confirm that the overall trend remains in negative territory. Furthermore, AVAX continues to trade within a bearish channel, and a sustained break above the channel’s mid-band has not yet occurred. For AVAX’s upward movement to be sustainable, both increased volume and strengthened momentum are required.
From a technical perspective, AVAX started the new week with a decline and is testing the $13.07 support level. Closings below this level could increase selling pressure and cause AVAX to fall towards the $11.88 and $10.61 support zones. Conversely, if it closes above this level and AVAX resumes its upward trend, the $14.21 level is the first important resistance in the short term. If this level is broken and sustainability is achieved above it, it could test the resistance zones of $15.61 and $17.20, respectively. The $18.50 level stands out as a major resistance in the short term. A close above $18.50 is critical for a trend reversal. Overall, the MACD being in negative territory and the price trading below EMA levels indicates that AVAX is under pressure in the short term. Therefore, recovery attempts are likely to be limited unless there are closes above resistance levels.
(EMA50: Green Line, EMA100: Blue Line, EMA200: Purple Line)
Supports: 13.07 – 11.88 – 10.61
Resistances: 14.21 – 15.61 – 17.20
SHIB/USDT
This week, the Shiba Inu ecosystem saw a busy agenda with forward-looking topics emerging in both infrastructure and market dynamics. With information shared by the team and official channels, the roadmap for Shibarium to become a privacy layer based on Fully Homomorphic Encryption, as part of its collaboration with Zama, became clear. In this context, Shibarium aims to position itself as a solution offering private transaction pools, quantum-resistant signature structures, and special transactions with additional gas costs payable only with BONE in the coming period. Within the same week, the partnership with TokenPlay AI materialized into a tangible product, and a Shiba-themed mini-app was launched on the platform, opening a new channel where SHIB can be used directly as a reward and in-app currency within gaming and AI-focused mini-apps.
Looking at market and on-chain data, despite the long-standing selling pressure accompanied by approximately 600 billion SHIB exiting exchanges, a significant accumulation process was observed, with a substantial amount of tokens being moved to cold wallets and exchange reserves continuing to decline. Burning statistics also showed that approximately 61.8 million SHIB were burned daily during the week, with a parallel jump in the burn rate of approximately 676% in a single day. Market notes published towards the end of the week also highlighted catalysts for December: SHIB’s inclusion in the T Rowe Price Active Crypto ETF application and Coinbase’s planned launch of SHIB perpetual futures on December 12, when evaluated alongside Shibarium’s privacy-focused roadmap, emerged as factors that could support the ecosystem in terms of both news flow and liquidity in the coming period.
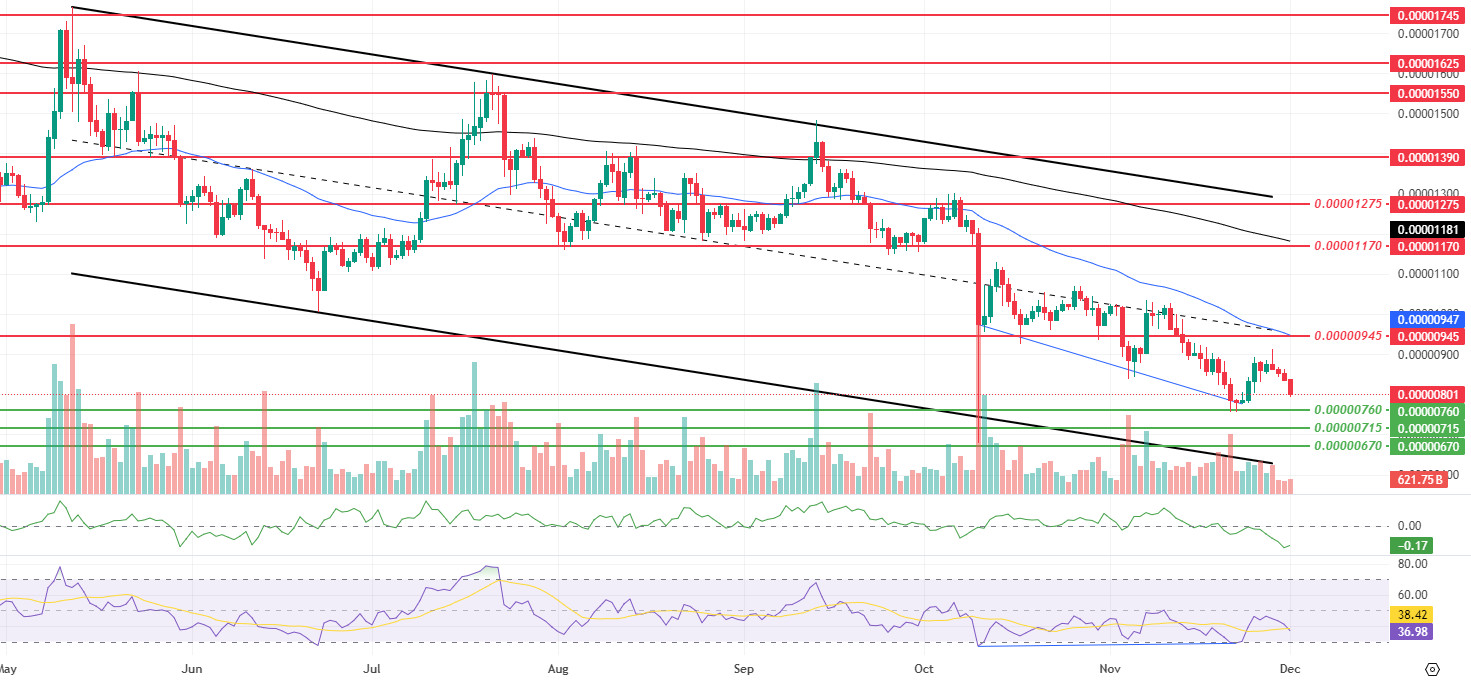
This week’s technical outlook indicates that the weakening trend structure revealed in the previous report remains intact and that pressure is still in favor of sellers. Despite the rebound from the $0.00000760 level after losing the $0.00000860 and $0.00000835 levels, the price continues to trade below the 50-period and 200-period Exponential Moving Averages (EMA), indicating that a clear reversal signal has not yet formed in the main trend. Decreases observed in momentum, volume, and volatility indicate that sales are progressing in a “drift” pattern rather than becoming aggressive, and that rebound attempts have remained limited for now. The rebound that followed the positive divergence (Blue Line) between the price and the Relative Strength Index (RSI) oscillator was met with increasing selling pressure as it approached the middle band of the descending channel, causing it to retreat again. The Chaikin Money Flow (CMF) indicator remaining in negative territory indicates that liquidity conditions on the chain and spot sides have not gained significant strength and that the current structure is still progressing on a weak demand base.
In terms of upward attempts, the $0.00000945 level remains the first critical threshold. If there are sustained closes above this level, followed by a retest of the $0.00001170 and $0.00001275 resistance levels with increasing volume, the rebound could shift towards the upper band of the descending channel, bringing a more meaningful recovery scenario closer to the EMA 50 and EMA 200 periods. In such a scenario, the nature of the movement could evolve from merely a short-term short squeeze into a more robust correction structure. On the downside, the $0.00000760 level continues to stand out as the first significant support. A drop below this support could accelerate the decline, paving the way for tests of the $0.00000715 and $0.00000670 levels. Particularly if the CMF indicator deepens into negative territory and the price remains below these supports, the current picture will be interpreted as a continuation of the decline phase within the main downtrend. Conversely, if the positive divergence on the RSI side is maintained and the price manages to hold above the $0.00000760 support, a gradual rebound process between the lower and middle bands of the descending channel can be expected to remain on the agenda. (EMA200: Black line, EMA50: Blue line)
Supports: 0.00000760 – 0.00000715 – 0.00000670
Resistances: 0.00000945 – 0.00001170 – 0.00001275
LTC/USDT
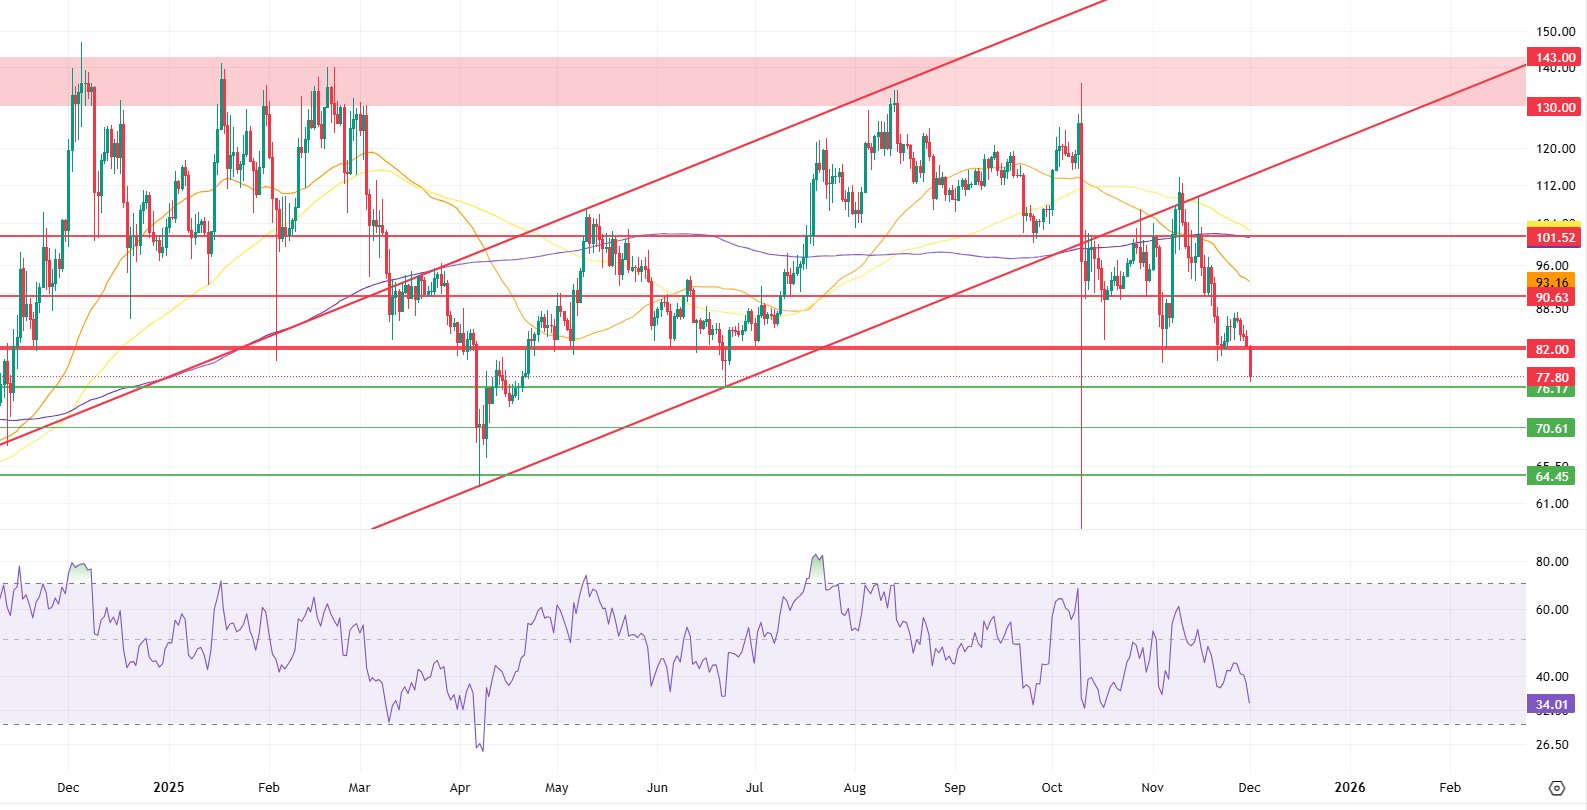
Litecoin (LTC) closed the past week with a 0.85% decline against USDT, entering the new week at $83.37. During the same period, LTC also fell 4.81% against Bitcoin, experiencing a negative period in terms of market value, with its total market value falling to approximately $5.96 billion . Despite this decline, Litecoin managed to maintain its 19th position in the global cryptocurrency market rankings. On the futures side, the total open interest remained nearly stable, showing less than a 1% change on a weekly basis. However, the long/short ratio of 0.87 in new positions opened at the beginning of the week indicates that derivatives market participants have strong downward expectations. Additionally, the turn of funding rates to negative also supports this downward sentiment.
From a technical perspective, the Litecoin price continues to trade below the 100-period (yellow), 50-period (orange), and 200-period (purple) moving averages. This outlook confirms that selling pressure persists in both the short and long term. Last week’s sideways and pullback-heavy trend, combined with market-wide jitters, is causing buyers to take a back seat and sell positions to gain ground.
If buying reactions occur, the initial rise is expected to be limited by the horizontal resistance at the $82.00 level. This area is a critical threshold where the movement could lose momentum from a technical perspective. If the price closes above this level consistently, Litecoin’s short-term outlook could shift from negative to neutral, and the price could potentially form a range-bound movement between $82.00 and $90.63. A break above the $90.63 level could trigger a structure targeting $101.52, turning the outlook positive. As moving averages are also expected to be surpassed, faster attempts towards the rising trend’s lower band may be observed after 101.52.
If the downward price movement continues, the $76.17 level emerges as the first important support. The fact that the price has reacted many times from this region in the past creates the first line of defense where short-term buyers could re-enter. If this level is broken downward, the $70.61 level comes into play as additional support that could limit the decline. In a deeper pullback scenario, the $64.45 level, which acts as the last line of defense, remains a critical stopping point.
Supports: $76.17 – $70.61 – $64.45
Resistances 82.00 – 90.63 – 101.52
BNB/USDT
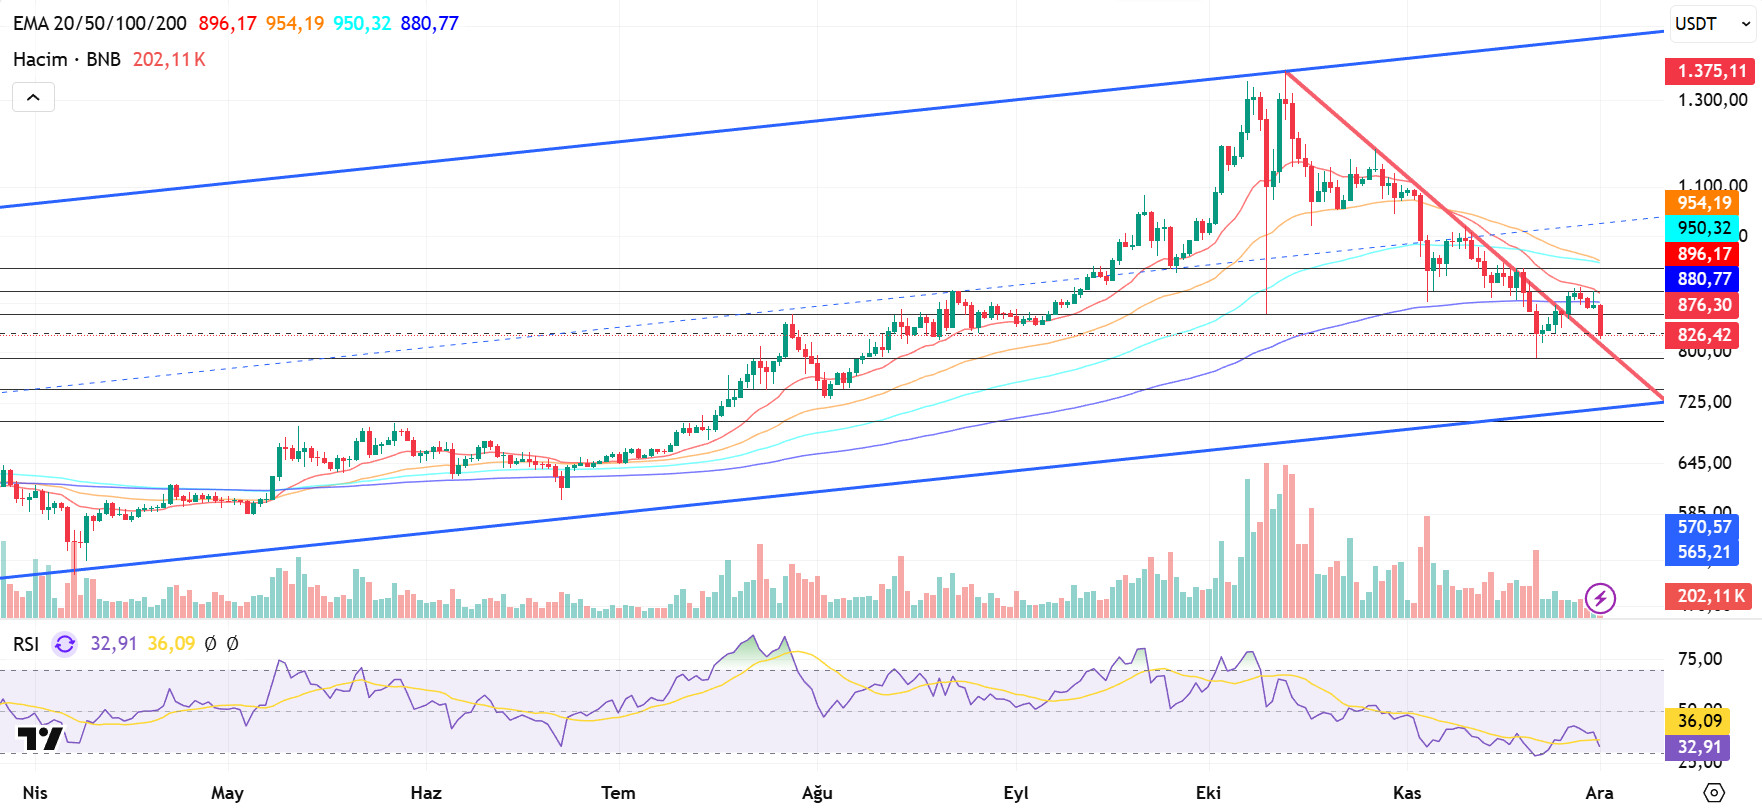
BNB Chain data for the period of November 20–26 indicates weaker performance compared to the previous week. The number of daily active users on BSC declined from 2,529,913 to 2,499,709, while on opBNB it fell from 2,191,071 to 1,992,874, indicating a significant drop in users. Similarly, total transactions decreased by approximately 10.5% on BSC and 11.5% on opBNB. However, the increase in total transaction volume from $62.8 billion to $66.4 billion reveals that high-value transfers have increased despite the decline in users and transaction numbers. On the other hand, the decline in TVL from $11.6 billion to $11.12 billion indicates that liquidity outflows continue on the DeFi side. Overall, while user and transaction activity in the ecosystem weakened, the increase in transaction volume and the decline in TVL indicate that the market has entered a short-term consolidation phase.
From a technical perspective, the correction that began after the all-time high (ATH) retreated to the $790 support zone identified in previous analyses. After seeking support at these levels for a while, BNB ended its downward momentum with the candlestick formations that formed and turned its direction upward again. With this recovery, the price gained positive momentum towards the descending trend line and, with the support of new candles, broke the trend upwards, rising to the $900 level. Although some pressure was seen in this region depending on market conditions, the overall positive outlook was maintained.
While the current outlook for the BNB/USDT pair is positive, the price’s correction towards the descending trend line raises the question of whether confirmation will be received from this region. A positive confirmation is expected to reinforce the current positive outlook.
Technical indicators for BNB, currently trading in the $790–860 range, show that low trading volumes are limiting the upward momentum. Additionally, the RSI indicator appears to be hovering at relatively low levels due to weak momentum.
According to the technical picture, if selling pressure increases, the price is expected to retest the $790 support level. If this level is broken, a pullback towards the $745 and $700 support zones will be on the agenda.
Conversely, if buying appetite is maintained and market momentum strengthens, BNB is expected to retest the $860 resistance level in the first stage. If this level is exceeded, it is likely that the falling trend line will be broken, and if the trend is broken and the price remains above this level, a rise towards the $900 and $940 levels appears technically possible.
Supports: 790 – 745 – 700
Resistances: 860 – 900 – 940
LINK/USDT
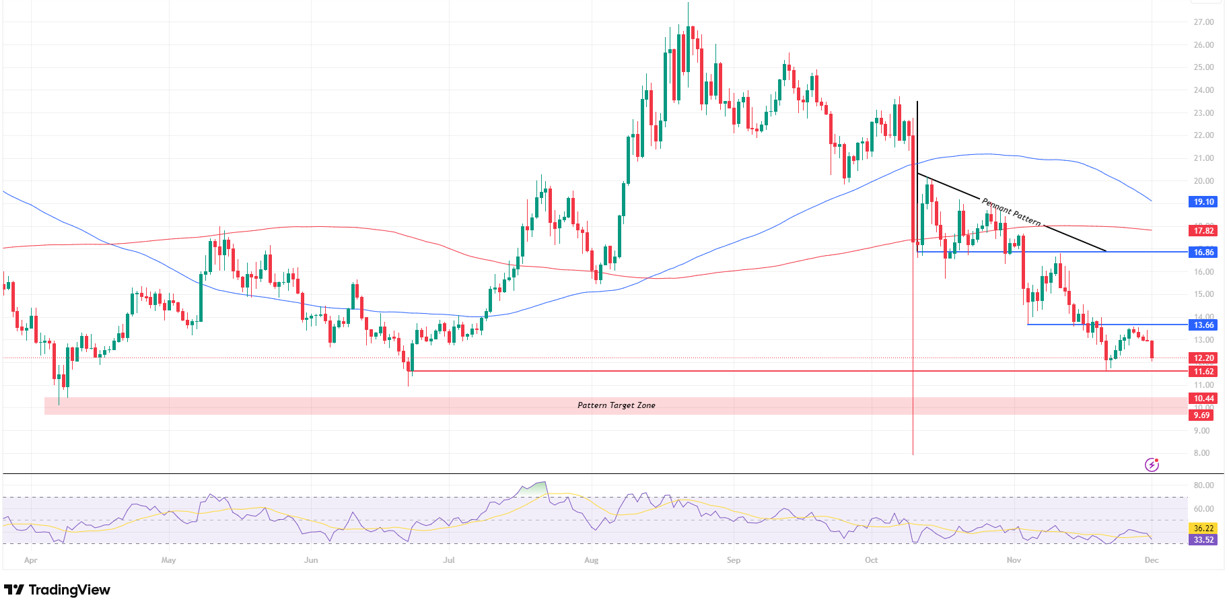
Grayscale is preparing to launch the first spot Chainlink (LINK) ETF in the US this week. Nate Geraci, co-founder of the ETF Institute, stated on X that the long-standing Grayscale Chainlink Trust will be officially listed and converted into an ETF, making it the first product to offer direct access to LINK in the US markets. Additionally, Senior ETF Analyst Eric Balchunas indicated that the ETF is expected to launch on December 2.
Looking at Link’s current technical outlook, we see that the reaction to the critical threshold of $13.66, which we highlighted last week, was quite limited, and the price failed to maintain stability above this level. We also noted that the price reaction in this region would be decisive in determining the direction. The current chart pattern shows that the weak reaction from resistance and the price regaining downward momentum indicate that buyers are still unable to defend this region strongly.
In particular, the failure of the short-term support area at the 11.62 band to produce a strong reaction suggests that the downward structure is still dominant and that upward movements are being viewed as selling opportunities. This outlook supports the validity of the possibility of a pullback towards the red shaded area, which is the technically targeted area following the breakout of the flag formation. If the price fails to settle above the $13.66 region, it is highly likely that the rallies will remain limited and the current downward structure will be preserved. In such a scenario, the price may increase the possibility of a deeper correction movement towards the formation target of $10.44 – $9.69.
In upward scenarios, we can say that the $13.66 level is the most critical first threshold. Sustained movement above this level could strengthen the trend, increasing buy positions and potentially pushing the price up to our next target at $16.86. However, for the positive upward scenario to gain strength, the formation structure must break down, and we need to see the price trading above the $16.86 level. Additionally, looking at trend indicators, we see that the price is below both the 100-day moving average and the 200-day moving average. Therefore, we can say that the medium and long-term trend is still downward.
On the momentum side, the Relative Strength Index (RSI) trading below the neutral zone is causing upward reaction movements to remain weak. The RSI’s inability to rise above the 45–50 band indicates that buyers are not gaining strength in the short term and that selling pressure increases as resistance levels are approached. When we evaluate the overall technical outlook and the RSI, the current position indicates that it is too early to talk about a trend reversal.
Supports: 11.62 – 10.44 – 9.69
Resistances: 13.66 – 16.86 – 17.82
SUI/USDT
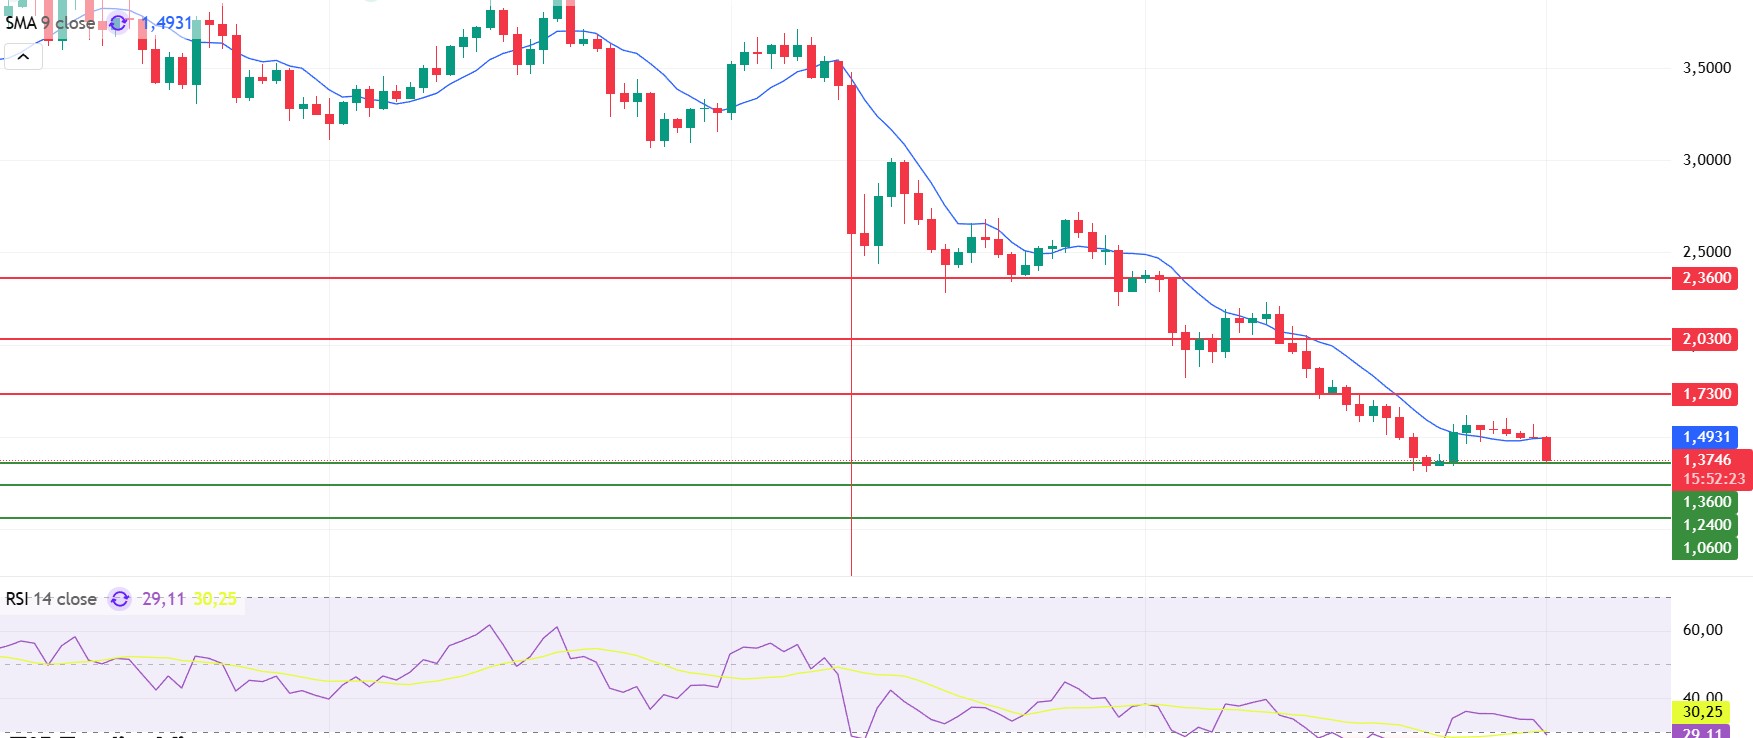
This week, there were significant and noteworthy developments in the Sui (SUI) ecosystem. In particular, the steps taken on the stablecoin side and the increase in liquidity on the network are noteworthy. The announcement of USDsui, Sui’s own native stablecoin, is seen as a move that expands both the transaction volume and the areas of use on the chain. The strengthening of the stablecoin infrastructure plays a critical role in the growth of DeFi projects on the Sui network.
In addition, the announcement of a new $10 million security and innovation fund by the Sui Foundation marked another significant development in the ecosystem. Under this fund, support will be provided to various projects aimed at enhancing network security, detecting malicious applications, and reducing risks on the chain. The fund also aims to help developers build more robust infrastructures.
Following recent developments, when we look at Sui’s technical outlook, we see that the price has been moving sideways at around $1.37 on a weekly basis, influenced by fundamental developments. The Relative Strength Index (RSI) is currently in the range of 30.25 – 29.11. This range indicates that the market is trading close to the sell zone; however, if the RSI weakens and falls to the 35.00 – 40.00 range, it could signal a potential buying point. If the price moves upward, the resistance levels of $1.73, $2.03, and $2.36 can be monitored. However, if the price falls to new lows, it could indicate that selling pressure is intensifying. In this case, the support levels of $1.36, $1.24, and $1.06 come to the fore. Based on the trend line, a pullback to $1.06 appears technically possible. According to Simple Moving Averages (SMA) data, Sui’s average price is currently at $1.49. The price remaining above this level indicates that the current uptrend could technically continue.
Supports: 1.06 – 1.24 – 1.36
Resistances: 1.73 – 2.03 – 2.36
ADA/USDT
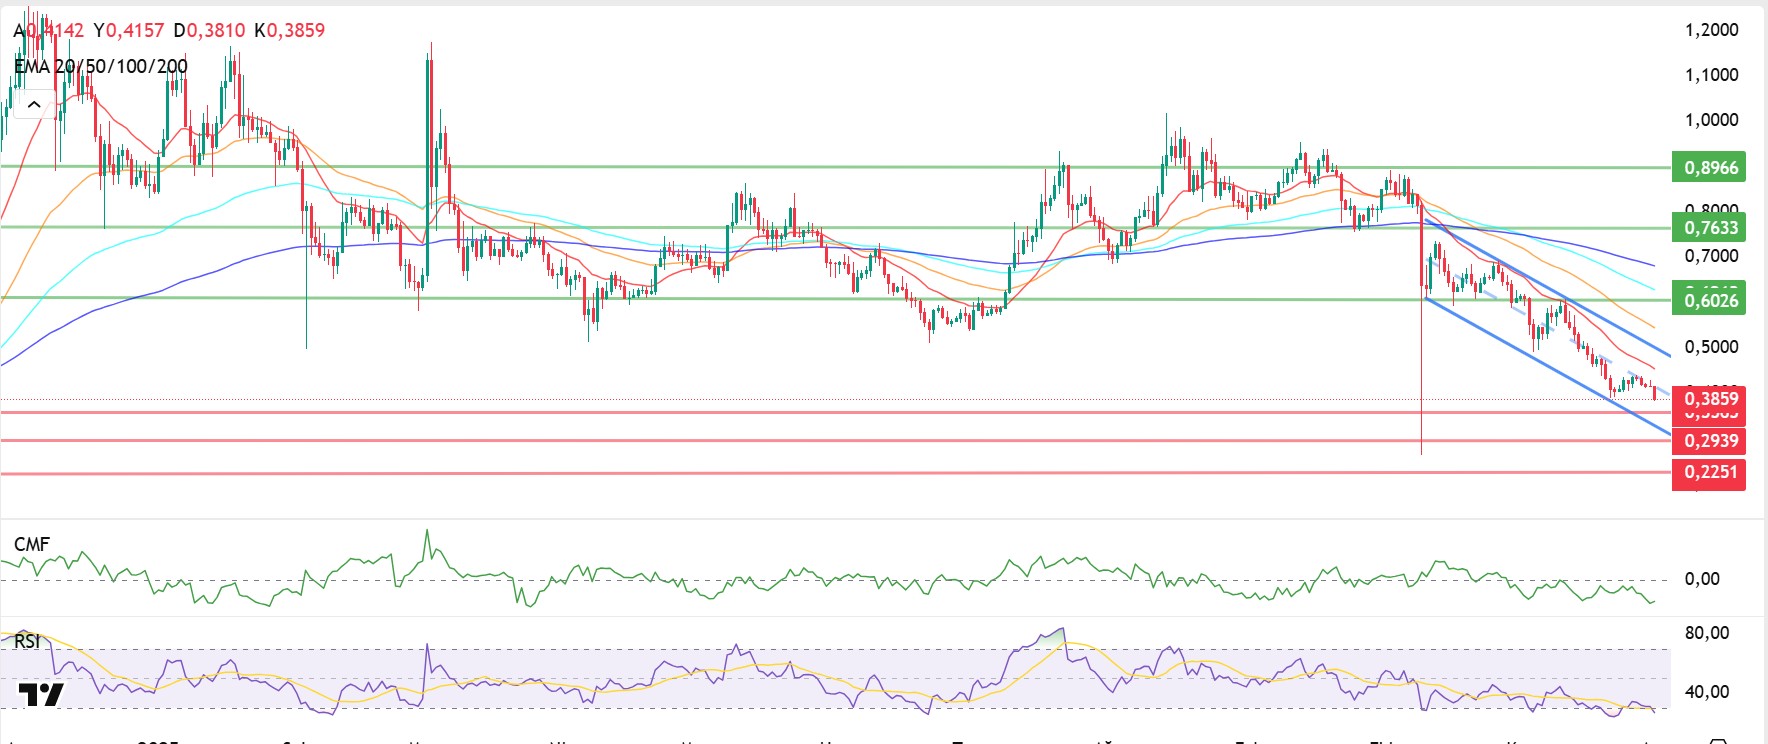
Since last week, the ADA price has fallen by 5% to $0.3862. It has fallen back to its 2021 price, recording a drop of over 85% from its all-time high.
In addition to the decline in its price, Cardano’s potential continues. It has a large community and a solid mission. The SEC may soon approve the first Cardano exchange-traded fund, which could lead to an increase in institutional investments. Cardano is also pursuing RealFi, a method of utilizing decentralized finance. Following a developer exploiting an AI-generated deserialization error last week, Cardano experienced a blockchain split on November 21. The split lasted approximately 24 hours and caused exchanges like Coinbase to halt ADA trading. This situation caused a loss of prestige on the ADA network and led to confusion on exchanges. The privacy-focused Midnight sidechain could change the outcome of this loss. Midnight combines Cardano’s reliability, the transparency of many blockchains, and the privacy that individuals and businesses may need. Hoskinson believes this will increase Cardano’s adoption and add value to decentralized finance applications. The Midnight NIGHT token is scheduled to launch on December 8. During this period, the ADA price broke below the first strong support level of 0.4095 and tested the 0.3840 level. It continues within the downtrend channel with the pullback movement it received from this level.
Technically speaking, the ADA price is trading quite far from the 20-day and 50-day Exponential Moving Averages (EMA 20 – Red Line) (EMA 50 – Orange Line). If the price rises to the resistance point of the downtrend at the $0.5270 level, it indicates that buyers are willing to buy at higher prices and that buying pressure is increasing over time. A retest of this area could play a critical role in completing the downtrend channel. If the price breaks above the 20-day Exponential Moving Average (EMA 20 – Red Line), it is expected to close above the 50-day Exponential Moving Average (EMA 50 – Blue Line). If it closes in this region, the major resistance point at the $0.6151 level could be targeted. The Relative Strength Index (RSI) continues in the oversold zone at 24 levels, while the Chaikin Money Flow (CMF-20) remains at -0.06 levels, indicating that the price is trading in the sell zone. If the price falls as a result of the macroeconomic data expected to be announced this week and the statements to be made by US President Trump, the important levels we will follow are $0.2978 and $0.2297.
Supports: 0.3692 – 0.2939 – 0.2251
Resistances: 0.8966 – 0.7633 – 0.6026
Legal Notice
The investment information, comments, and recommendations contained in this document do not constitute investment advisory services. Investment advisory services are provided by authorized institutions on a personal basis, taking into account the risk and return preferences of individuals. The comments and recommendations contained in this document are of a general nature. These recommendations may not be suitable for your financial situation and risk and return preferences. Therefore, making an investment decision based solely on the information contained in this document may not result in outcomes that align with your expectations.