
Technical Analysis
BTC/USDT
While Kevin Hassett argues that the Fed should cut rates by 25 basis points at next week’s meeting, markets are focused on the size and start date of the Reserve Management Purchase (RMP) program expected to be announced at the FOMC meeting. The SEC discussed tokenization regulations with executives from Citadel, Coinbase, and Galaxy, addressing non-custodial transaction protocols, DeFi compliance, and regulatory obligations. The Bank of Japan is reportedly poised to raise its policy rate to its highest level since 1995 at its December meeting, barring any major surprises.
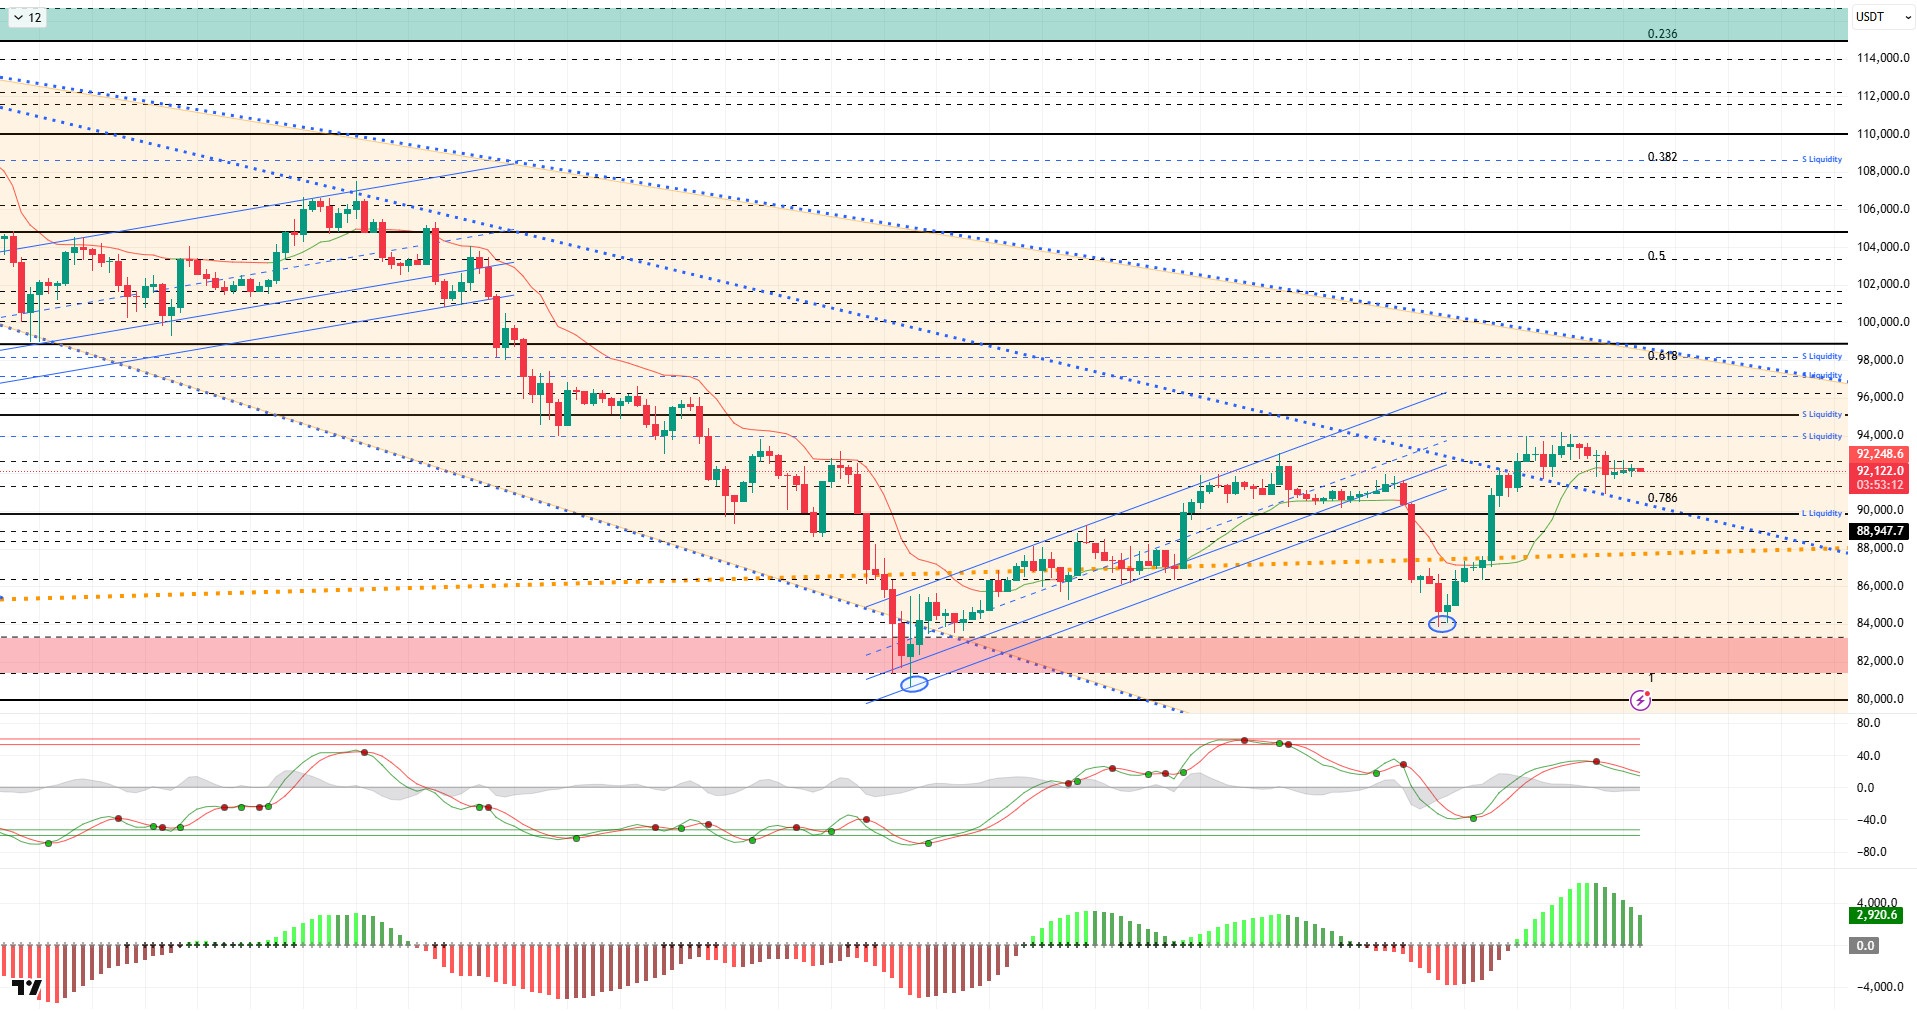
From a technical perspective, BTC is managing to stay above the falling second trend line, despite testing it from time to time. Following a high-volume candle, BTC has been moving sideways, and the lack of catalysts is seen as an obstacle to regaining momentum. While the appearance of doji candles in the last three candles indicates difficulty in moving upward, the absence of a reason for a downward pull is causing a squeeze. At the time of writing, it continues to trade at the 92,300 level.
Technical indicators show the Wave Trend (WT) oscillator giving a sell signal just below the overbought zone, while the Squeeze Momentum (SM) indicator’s histogram has lost momentum in the positive zone. The Kaufman Moving Average (KAMA) has now crossed above the price at the $92,250 level.
According to liquidation data, with the recent rise, buy-side transactions within the 91,000-92,000 band have been liquidated, while the 90,000 level remains a dense accumulation zone. Sell-side transactions are gaining momentum at the $94,500 level, while the monthly outlook continues to maintain its intensity within the $97,000–$98,000 range.
In summary, Vanguard’s announcement that it will offer ETF services to its customers has had a significant impact on BTC’s momentum, while ADP private sector employment coming in well below expectations has pushed December interest rate cut expectations to 90% ahead of the FOMC meeting. Jobless claims came in below expectations, presenting a mixed picture. The Bank of Japan is preparing for an interest rate hike. Technically, the price is attempting to consolidate above the downtrend line following the recent rally, while liquidity data indicates that target zones are regaining importance and the market continues to seek equilibrium. At this stage, 90,000 has become a critical level for the price to maintain its momentum. Closes and pricing above this level are an important indicator for regaining momentum. In this context, 95,000 stands out as the next target area, and if it is passed, liquidity areas will be monitored again, with 90,000 once again coming to the fore as both a reference and liquidity area in the event of possible selling pressure.
Supports: 92,600 – 91,400 – 90,000
Resistances: 94,000 – 95,000 – 96,200
ETH/USDT
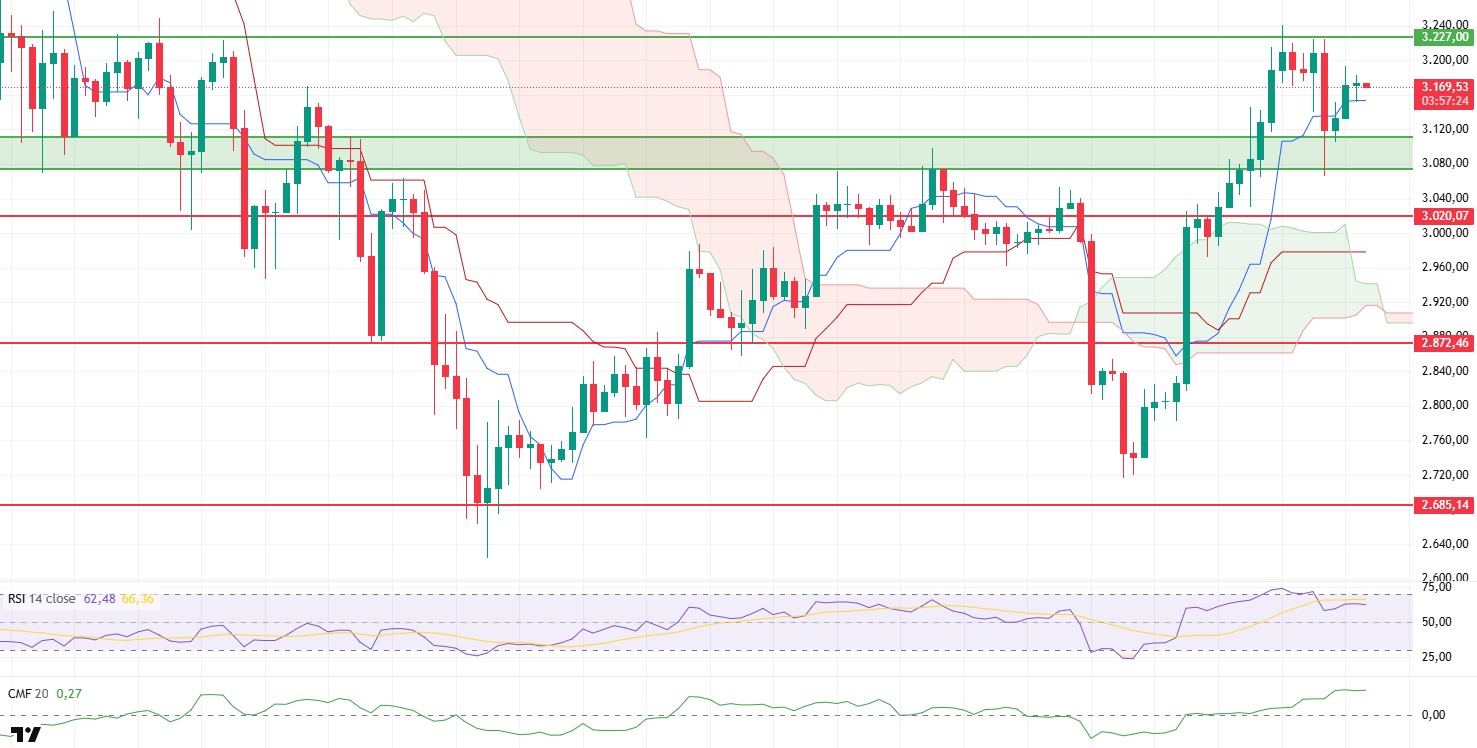
The ETH price was rejected once again from the $3,227 resistance level yesterday evening and retreated to the support zone marked by the green rectangle on the chart. Thanks to the buying pressure from this zone, the price recovered again in the morning hours and is currently balanced above the $3,170 level. This outlook shows that buyers have not given up yet and are still trying to maintain the uptrend.
The Chaikin Money Flow (CMF) continues its upward movement in positive territory, confirming that capital inflows into the market are continuing. This picture shows that buyers have high potential to step in during price pullbacks.
The Relative Strength Index (RSI) rose again after exiting the overbought zone yesterday, signaling that momentum remains strong. The RSI regaining strength increases the likelihood of the price making new attempts towards resistance zones.
There is no deterioration in the Ichimoku structure. The price remaining above the kumo cloud and the Tenkan and Kijun lines strongly supporting the price indicate that the uptrend is technically sound.
The overall outlook remains positive. In the short term, the $3,227 resistance level may be retested. If prices close above this level, stronger momentum towards the $3,285 and $3,350 targets could be seen. In a downside scenario, $3,110 is the first important support level, and if the price falls below this level, it could retreat back towards the $3,070 – $3,020 range. In summary, the appetite for growth on the Ethereum side remains strong. Both liquidity and momentum indicators continue to produce positive signals. For the trend direction to be maintained, it will be critical for the price to continue to hold above the support zone.
Below the Form
Supports: 3,070 – 3,020 – 2,872
Resistances: 3,227 – 3,436 – 3,672
XRP/USDT
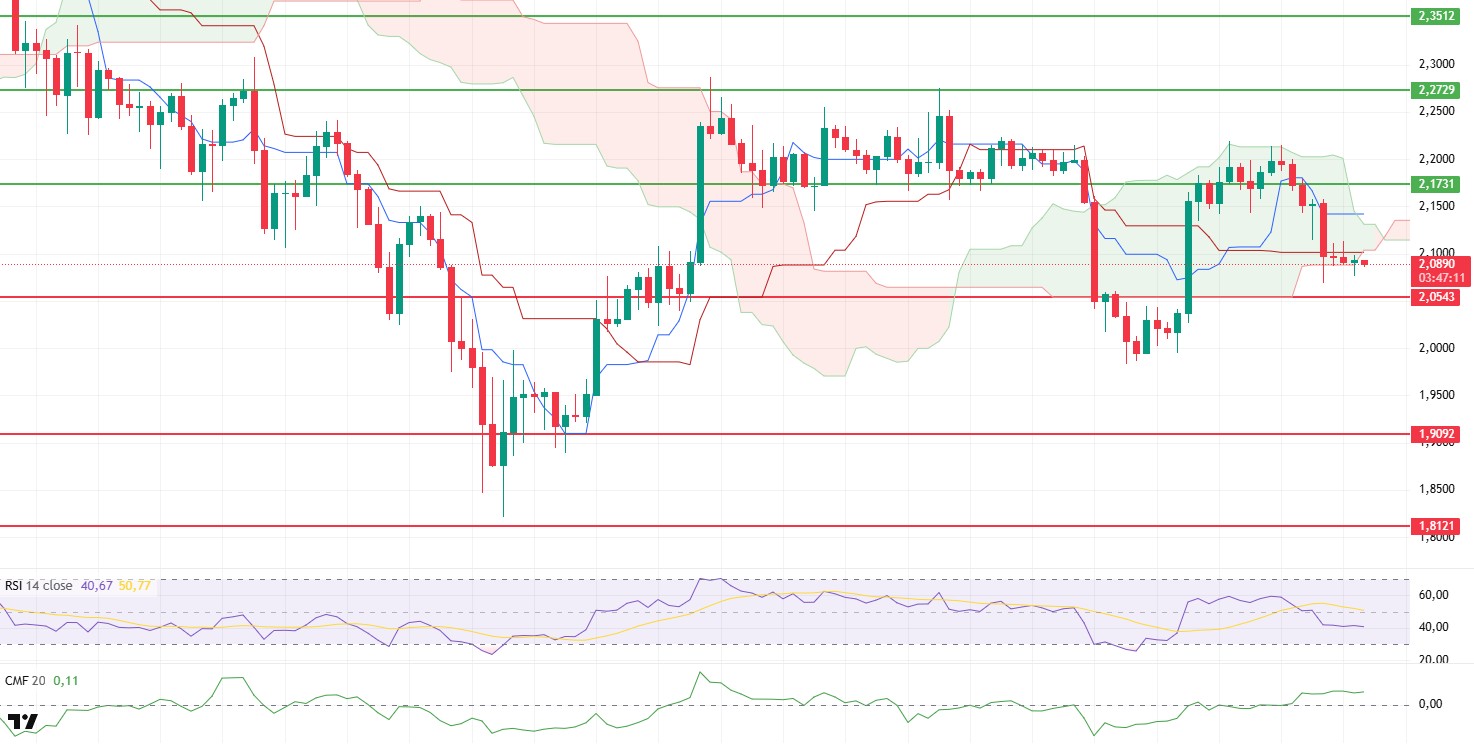
After losing the $2.17 support yesterday, the XRP price saw increased selling pressure, and the pullback deepened to the $2.08 level. This weak price action indicates that buyers have lost control in the short term and sellers have gained dominance in the market.
On the liquidity side, an interesting divergence is occurring. The Chaikin Money Flow (CMF) indicator remaining in positive territory indicates that capital entering the market despite the sell-off has not completely disappeared. This strong stance of the CMF keeps the possibility of a rapid recovery from low levels on the table.
On the momentum side, however, weakness continues for buyers. The downward movement of the Relative Strength Index (RSI) value indicates that momentum is shifting to sellers, while also signaling that sufficient momentum for a strong rally has not yet formed.
The Ichimoku structure has also turned in favor of sellers. The price losing the lower band of the kumo cloud provides a strong signal that the short- and medium-term trend has changed negatively. Furthermore, the downward break of the Tenkan and Kijun levels confirms the downward trend from a technical perspective.
The overall outlook remains weak in the short term. The probability of a dip towards the $2.05 level during the day is quite high. This area is the most critical support level, both psychologically and technically. The positivity seen in the CMF indicates that a rebound from this level is not out of the question. However, if there is a close below the $2.05 support, a more aggressive pullback towards the $1.98–$1.95 range could begin. In summary, seller pressure persists, but liquidity support has not completely disappeared. The $2.05 level continues to be the line of destiny for XRP in the short term. A rebound scenario from here could bring the uptrend back into focus, while a break below this level could intensify the selling wave.
Supports: 2.0543 – 1.9092 – 1.8121
Resistances: 2.1731 – 2.2729 – 2.3512
SOL/USDT
Solmate will acquire RockawayX to create a $2 billion institutional Solana giant.
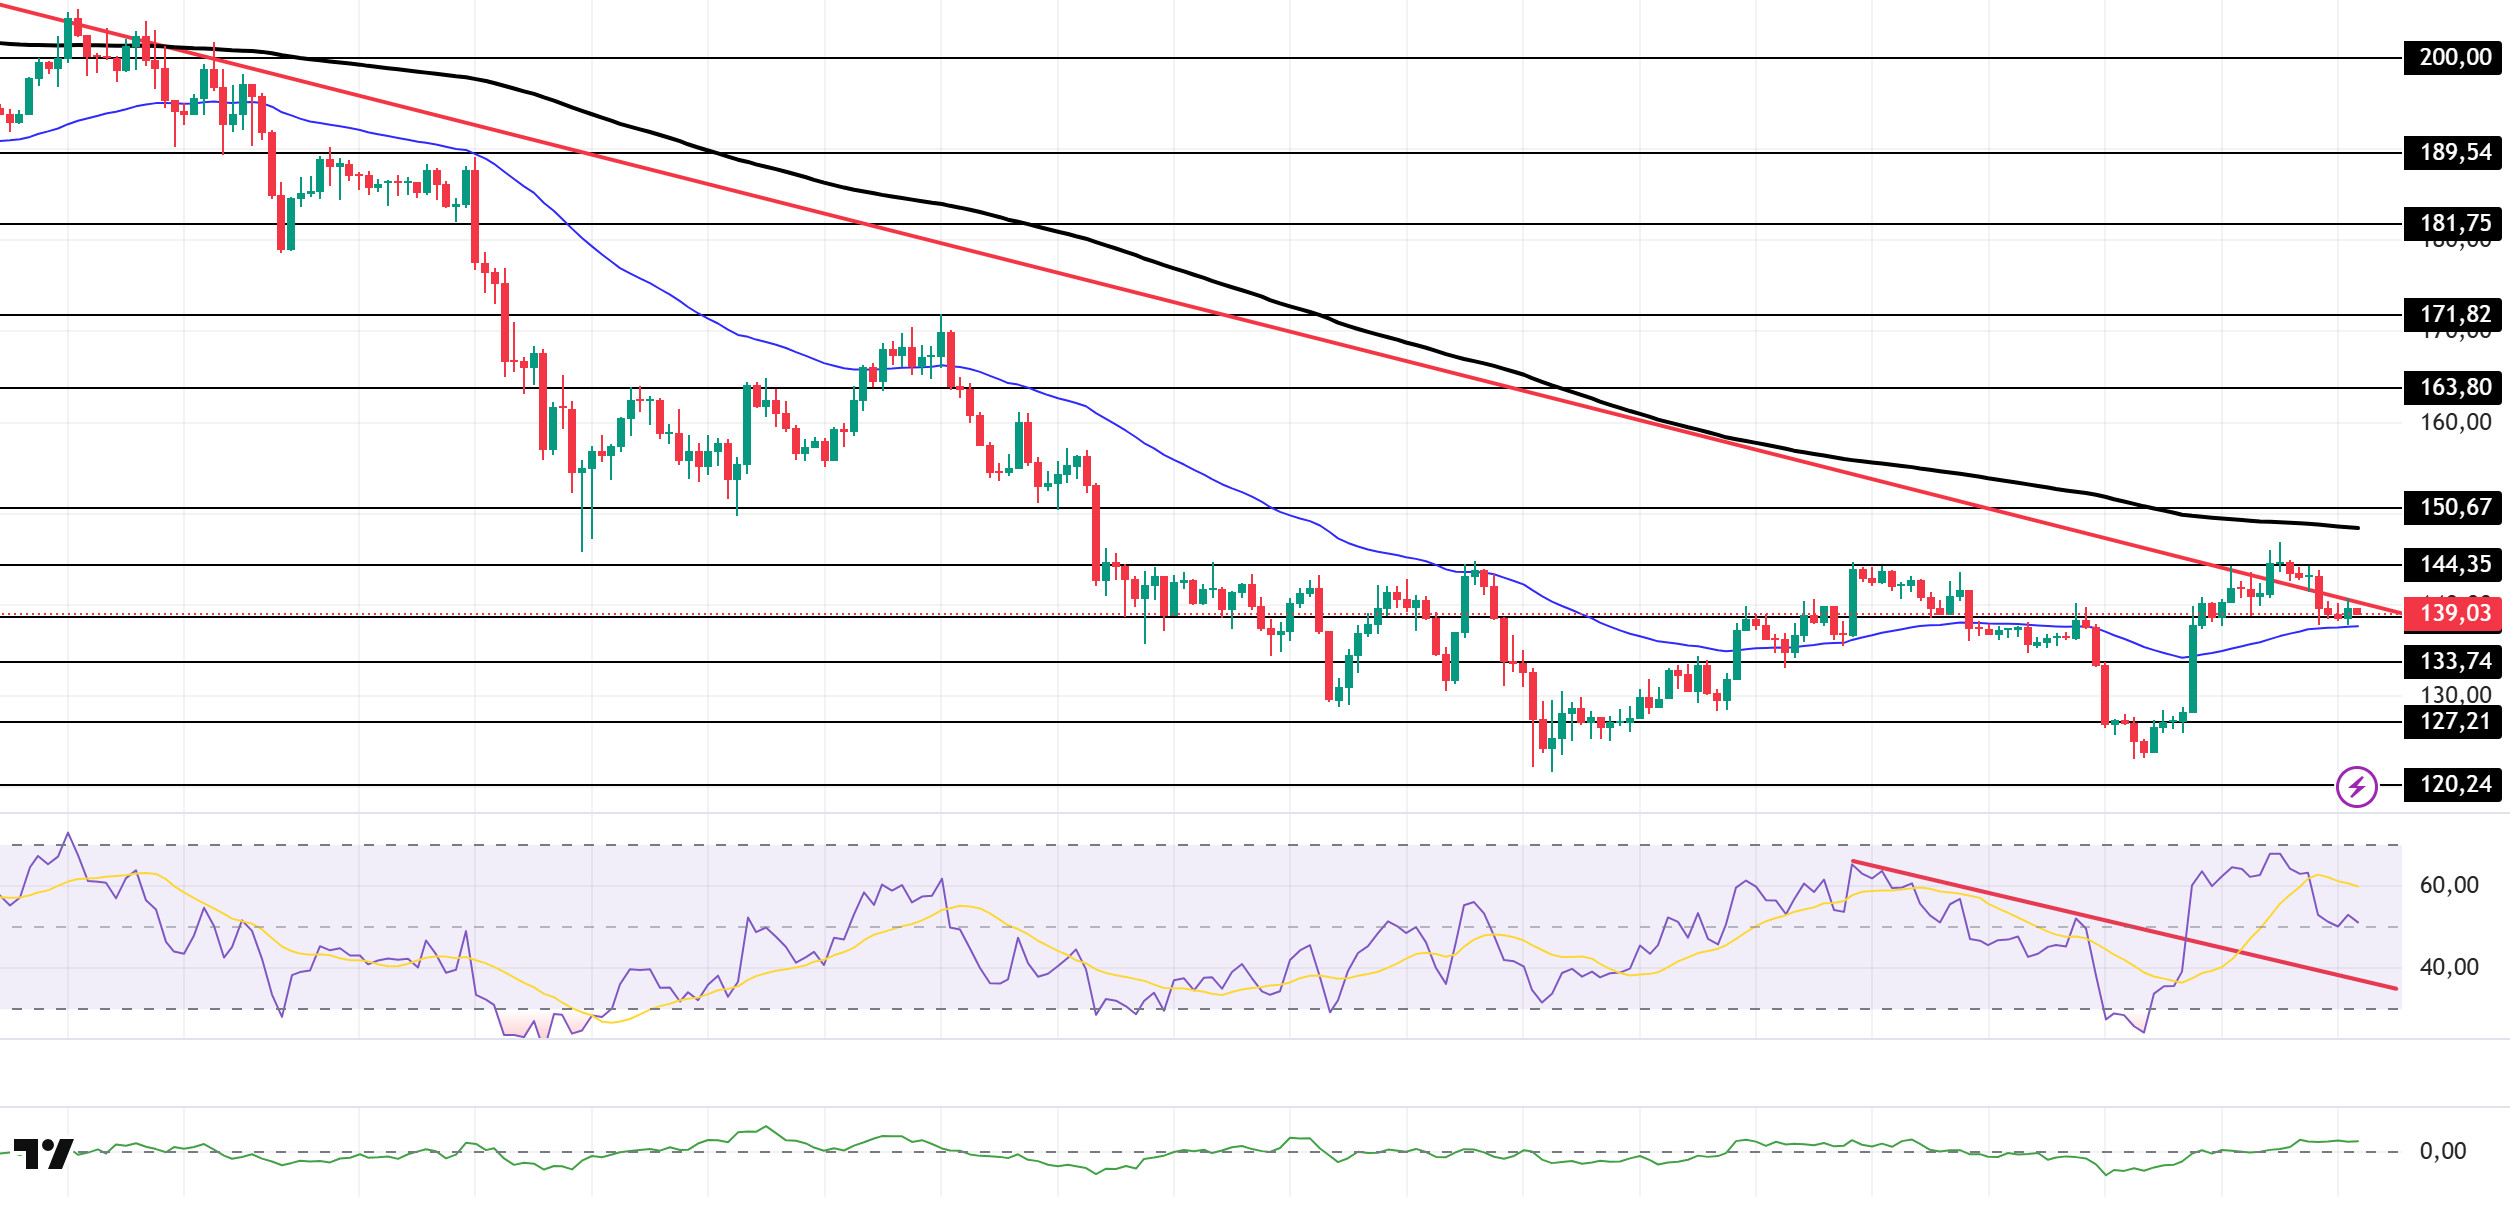
The SOL price has been declining. The asset moved into the lower region of the downtrend that began on October 6. The price, which broke above the downtrend line, a strong resistance level, encountered resistance at the 200 EMA (Black Line) moving average and retreated after failing to break through. Currently testing the 50 EMA (Blue Line) moving average as support, the price could retest the $127.21 level if the decline continues. If it experiences an uptrend, the 200 EMA (Black Line) moving average should be monitored.
On the 4-hour chart, it remained below the 50 EMA (Exponential Moving Average – Blue Line) and 200 EMA (Black Line). This indicates a possible downtrend in the medium term. At the same time, the price being between the two moving averages shows us that the asset is in a decision phase in the short term. The Chaikin Money Flow (CMF-20) remained at a positive level. However, an increase in money outflows could push the CMF into negative territory. The Relative Strength Index (RSI-14) retreated from the overbought zone to a neutral level. It also continued to hold above the upper region of the downtrend that began on November 26. This signaled that buying pressure continued. If there is an uptrend due to macroeconomic data or positive news related to the Solana ecosystem, the $163.80 level stands out as a strong resistance point. If this level is broken upwards, the uptrend is expected to continue. In the event of pullbacks due to developments in the opposite direction or profit-taking, the $120.24 level could be tested. A decline to these support levels could increase buying momentum, presenting a potential upside opportunity.
Supports: 133.74 – 127.21 – 120.24
Resistances: 138.73 – 144.35 – 150.67
DOGE/USDT
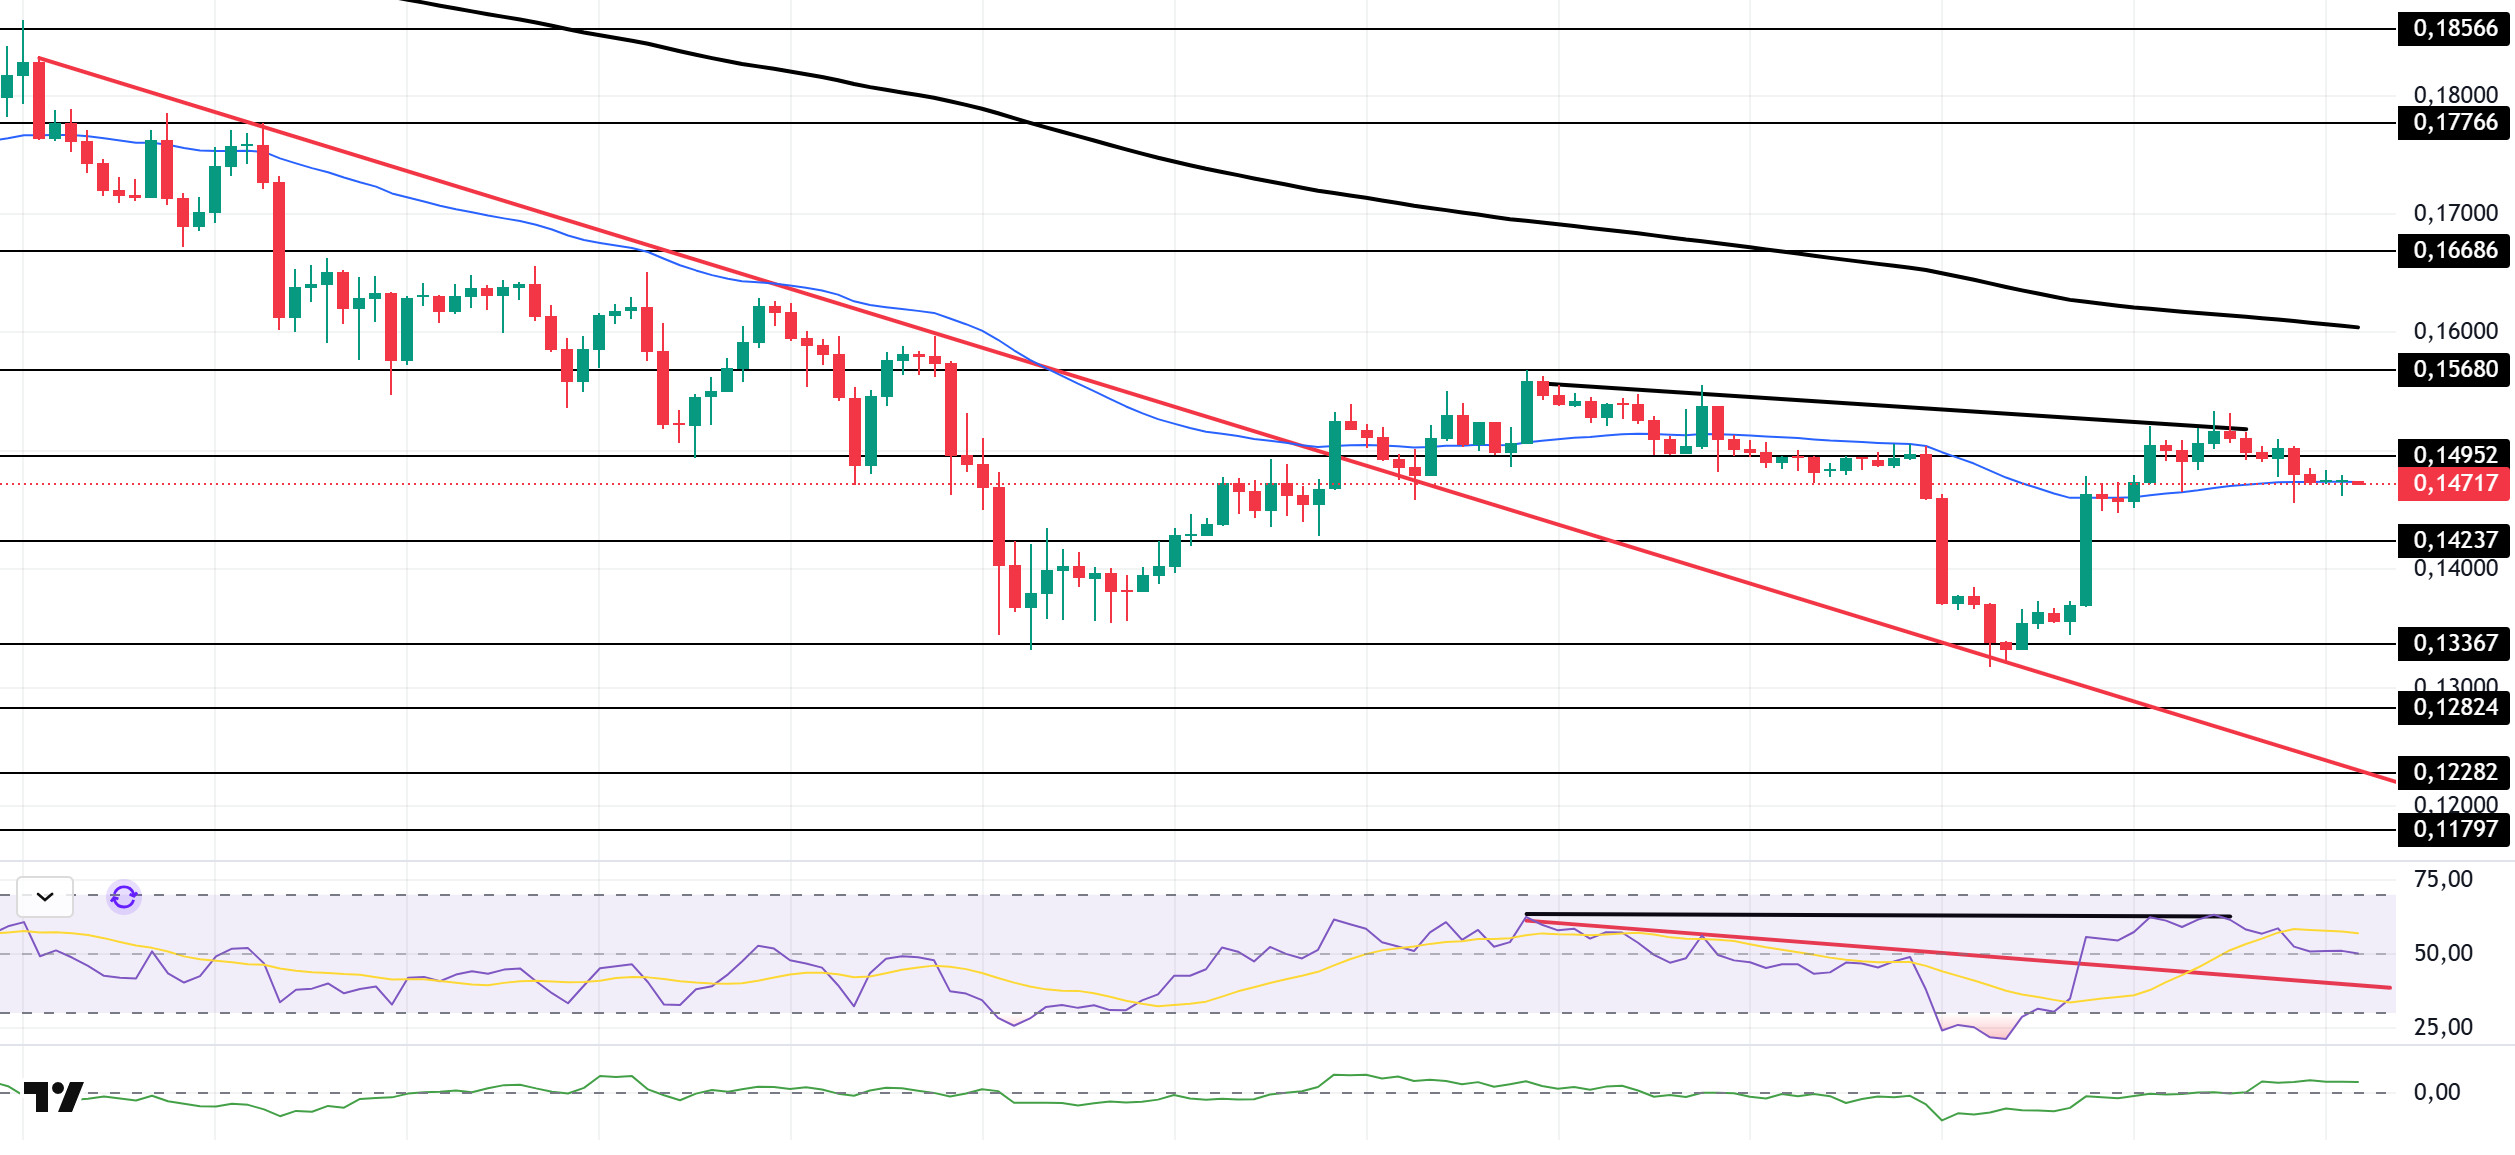
The DOGE price experienced a slight pullback. The asset gained value by gaining downward momentum starting on November 11 and broke above the 50 EMA (Blue Line) moving average. Testing the $0.14952 level as resistance, the price failed to break through and experienced a pullback. As of now, it is testing the 50 EMA (Blue Line) moving average as support. If the upward trend continues, it may test the 200 EMA (Black Line) moving average. If the pullback deepens, the $0.14237 level may act as support again.
On the 4-hour chart, the 50 EMA (Exponential Moving Average – Blue Line) remained below the 200 EMA (Black Line). This indicates that the downtrend could continue in the medium term. The price being between the two moving averages indicates that the price is in a decision phase in the short term. The Chaikin Money Flow (CMF-20) remained in positive territory. Additionally, a decrease in money inflows could push the CMF into negative territory. The Relative Strength Index (RSI-14) retreated from the middle of the positive zone to a neutral level. At the same time, it remained in the upper region of the downward trend that began on November 26. This signaled the formation of buying pressure. However, negative divergence could deepen the pullback. In the event of an uptrend driven by political developments, macroeconomic data, or positive news flow in the DOGE ecosystem, the $0.16686 level stands out as a strong resistance zone. Conversely, in the event of negative news flow, the $0.13367 level could be triggered. A decline to these levels could increase momentum and initiate a new wave of growth.
Supports: 0.14237 – 0.13367 – 0.12824
Resistances: 0.14952 – 0.15680 – 0.16686
AVAX/USDT
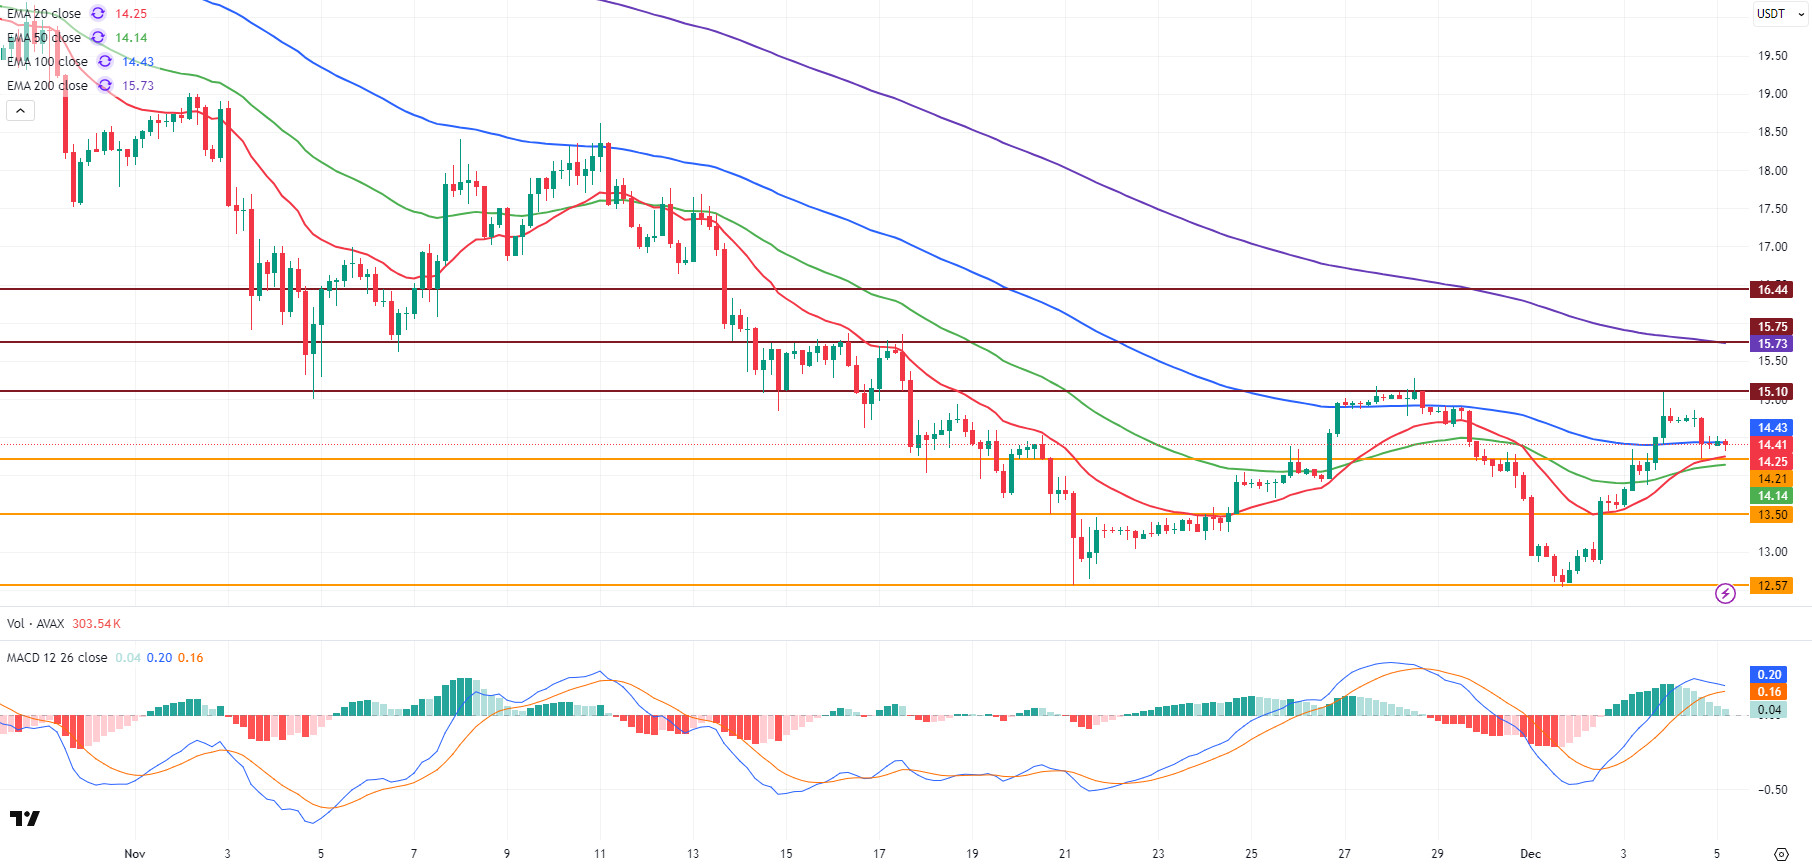
AVAX started yesterday at $14.78, showed a weak performance during the day, and closed at $14.41, losing approximately 2.5% in value. Increased selling pressure towards the close was particularly effective in this pullback, and AVAX fell below the EMA100 level again. Starting the new day at $14.41, AVAX is currently trading within a horizontal band at the opening level. Following the strong recovery over the past two days, the price’s calm movement today indicates that short-term profit-taking is in play. While positive expectations for the Avalanche ecosystem remain intact, AVAX continues to show a cautious outlook in line with the market.
On the 4-hour chart, the Moving Average Convergence/Divergence (MACD) line is still above the signal line but has turned downward. The decline towards yesterday’s close weakened momentum on the MACD, and the decrease in the histogram supported this pullback. Although the MACD being in positive territory and above the signal line does not make the picture entirely negative, if the MACD continues its downward trend and crosses below the signal line, selling pressure on AVAX is likely to increase and the decline to deepen. On the EMA side, AVAX fell below EMA100 with yesterday’s decline. AVAX is currently trading above EMA20 and EMA50 but below EMA100. Although EMA100 was tested during an intraday rally attempt, selling pressure returned from this area and a breakout did not occur.
In the technical outlook, the $14.21 level stands out as the first important short-term support. Closings below this level could cause AVAX to retreat towards the $13.50 support again. If the $13.50 level is lost, selling pressure could increase, causing a decline to the $12.57 region. In an upward scenario, AVAX needs to first break through the EMA100 and then the $15.10 resistance level to regain strength. If the $15.10 breakout is achieved, it is technically possible for AVAX to initiate an upward movement towards the $15.75 and $16.44 levels. However, this requires an increase in trading volume and the MACD to resume its upward trend. Overall, the MACD still trading in positive territory and AVAX remaining above the EMA20 and EMA50 continue to support the short-term bullish scenario. However, AVAX trading below the EMA100 ( ) and the MACD line turning downward indicate that the upward momentum is weakening.
(EMA20: Red Line, EMA50: Green Line, EMA100: Blue Line, EMA200: Purple Line)
Supports: 14.21 – 13.50 – 12.57
Resistances: 15.10 – 15.75 – 16.44
Legal Notice
The investment information, comments, and recommendations contained herein do not constitute investment advice. Investment advisory services are provided individually by authorized institutions taking into account the risk and return preferences of individuals. The comments and recommendations contained herein are of a general nature. These recommendations may not be suitable for your financial situation and risk and return preferences. Therefore, making an investment decision based solely on the information contained herein may not produce results in line with your expectations.

