
BTC/USDT
Last week, while monetary policy, labor market data, and international diplomacy dominated the agenda in the US, Trump’s decision to delay naming and announcing his Fed chair nominee drew market attention. Bank of Japan Governor Ueda’s message clarifying the path of interest rate hikes intensified global monetary policy discussions, while the Fed ending its three-year loss period stood out as a significant development in the economic outlook. Forecasts now expect a monthly injection of $40 billion in liquidity in line with a transition to QE in 2026.Progress in the peace plan between the US and Ukraine remained on the geopolitical agenda. On the crypto front, the SEC’s innovation exemption, which will come into effect in 2026, is shaping the regulatory process for the crypto sector. Meanwhile, Bitcoin treasury company Strategy’s move to strengthen its reserves drew attention to the company’s financial position.
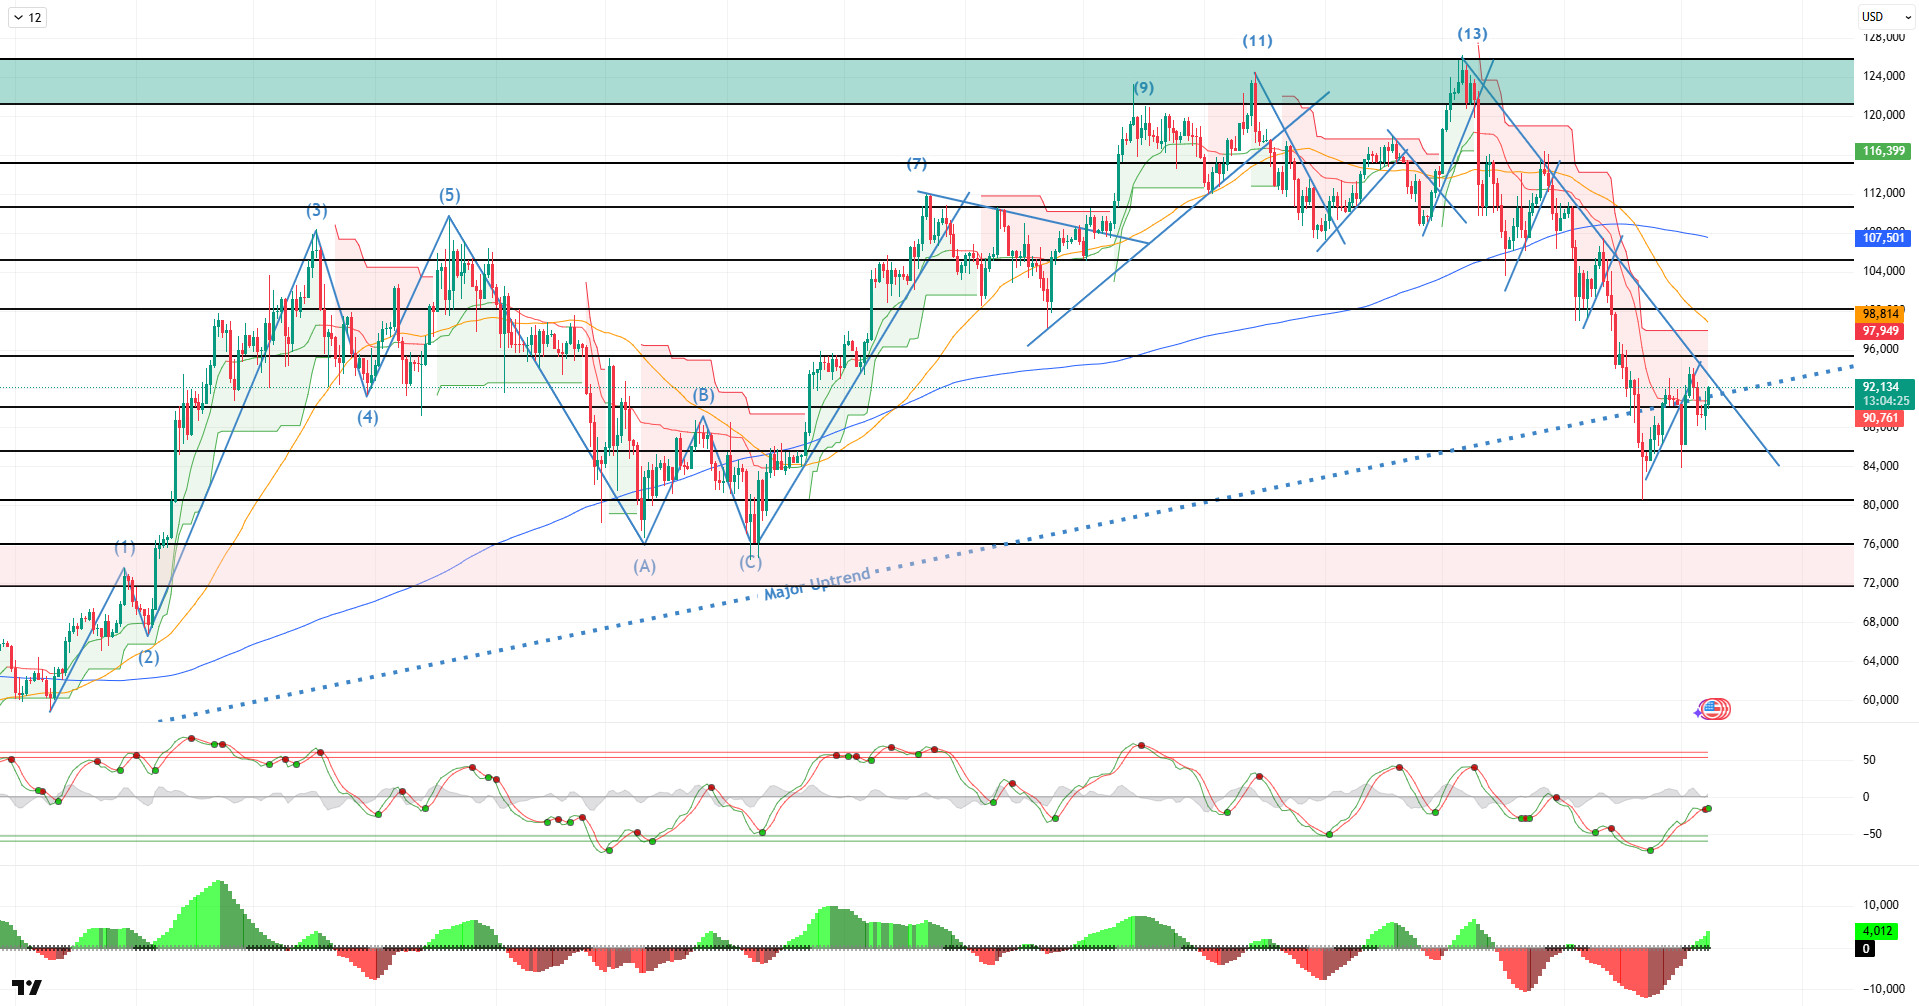
Looking at the daily technical picture after all these developments, BTC deepened its downtrend from the ATH level of 126,200 points, reaching 13 points, and fell to 80,500 points. The price, which bottomed out here, rose above the 90,000 level again. The price closed November with a 17.67% decline and started December with a 3.90% decline, but reversed the situation and has now gained 1.81%.
Looking at technical indicators, the Wave Trend (WT) oscillator recorded an upward movement parallel to the buy signal it gave in the oversold zone on a daily basis. Although it briefly signaled a decline in the middle band of the channel, it produced a buy signal again. The Squeeze Momentum (SM) histogram is gaining momentum within the positive zone.In moving averages, the golden cross structure that began on May 17 was lost when the 50-day SMA crossed above the 200-day SMA. The Supertrend structure continues to maintain its bearish outlook.
Looking at weekly liquidation data, with the recent decline, the buy level was liquidated above 88,000, while the fragmented buy level continues to maintain its accumulation within the 83,000-85,000 band. In contrast, the selling level has formed a fairly intense accumulation in the 92,000–94,000 and 97,000–98,000 bands.
In summary, as we enter Fed week, markets appear to be pricing in an 87% probability of an interest rate cut.
It is also reported that Trump has selected his nominee for Fed chair but has yet to make the announcement. During this process, the Bank of Japan’s (BOJ) statements regarding a possible interest rate hike have also begun to attract the markets’ attention. On the technical side, the price rebounded from a new low of 80,500 and tested the 93,800 level. Liquidity data indicates that the buy-sell levels have become the new target. Following the recent decline, the price could potentially rebound if it breaks above the falling trend line. In this context, if the 93,000 level is breached, the 98,000 level will be targeted. If the Fed uses a hawkish tone in its statements, the 85,000 level will be monitored as the last reference point before the price tests the double bottom at 80,000.
Supports: 90,000 – 85,000 – 83,800
Resistances: 95,000 – 98,000 – 100,000
ETH/USDT
The controlled pullback experienced by Ethereum last week provided an opportunity to reposition in the market. Short-term dip reactions driven by retail sources often bring about a final liquidity test and cause late buyers to be weeded out before a stronger rally begins. From this perspective, the current pricing can be seen as preparation for a healthier and more sustainable upward trend.
On-chain data also supports this soft reset process. The Net Unrealized Profit/Loss (NUPL) indicator hovering around 0.22 suggests that profit-taking in the market is continuing at a moderate pace and that no excesses have yet formed. Furthermore, the fact that NUPL has not dipped into negative territory indicates that investors are still structurally in a strong position. This structure is one of the most important factors limiting the possibility of large-scale selling pressure.
Last week’s Fusaka update, activated on the mainnet, is seen as the beginning of a significant transformation in Ethereum’s development model. It has been concretely demonstrated that, instead of large, long-cycle updates, more targeted upgrades can be delivered at shorter intervals. This approach offers significant advantages in terms of speed and flexibility, particularly for the developer ecosystem.
However, there was a slight pullback in staking data. The number of staked ETH falling to 35.95 million indicates that investors are maintaining a cautious stance despite the overall upward trend. However, this pullback does not appear to be a major panic sell-off.
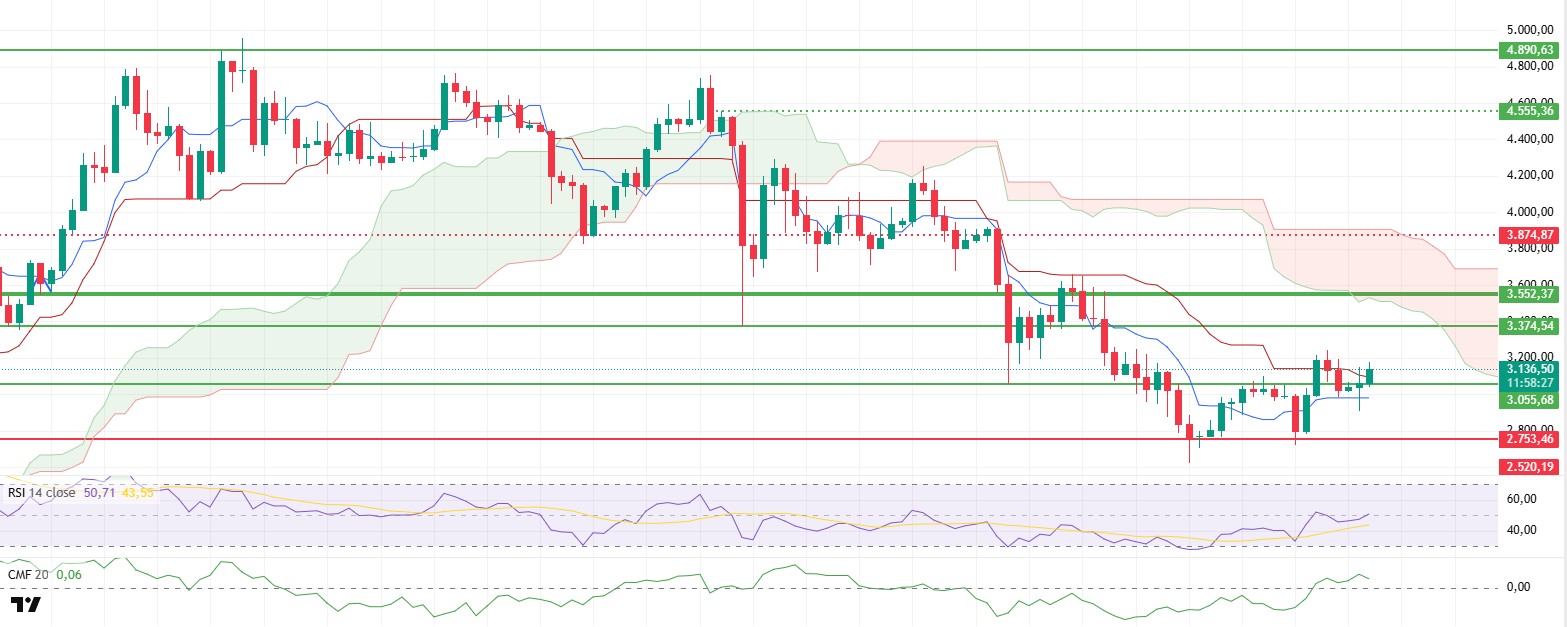
On the market side, the picture is more positive. The Ethereum price rose above the $3,100 level again, strengthening the short-term positive structure. At the same time, the open interest reaching $18 billion with an increase of $3 billion clearly shows that traders continue to take bullish positions.
On the liquidity side, the long-awaited appetite has started to return. The Chaikin Money Flow (CMF) indicator gaining strength in positive territory confirms that the rise is supported by fund inflows.
The picture is also strong on the momentum front. The Relative Strength Index (RSI) rising above the 50 level indicates a significant increase in buying pressure and supports price movements.
In the technical trend outlook, the short-term improvement is more pronounced. The price settling above the Tenkan and Kijun lines indicates that an uptrend has begun. However, as the price is trading below the kumo cloud, the medium-term main direction change has not yet been confirmed.
The overall picture shows that a buyer-dominated market is beginning to re-emerge. For the uptrend to continue in the short term, the price is likely to test the $3,374 resistance level. If this level is broken to the upside, the positive trend could extend to a wider area. In downward movements, $3,055 is a strong support zone, and maintaining this level is critical for the upside scenario. Ethereum is moving towards a more balanced uptrend, supported by both on-chain strength and risk appetite in the exchanges. Although short-term pricing is still volatile, the medium-term upside potential is much stronger than in the previous week.
Supports: 3,055 – 2,753 – 2,520
Resistances: 3,374 – 3,552 – 3,874
XRP/USDT
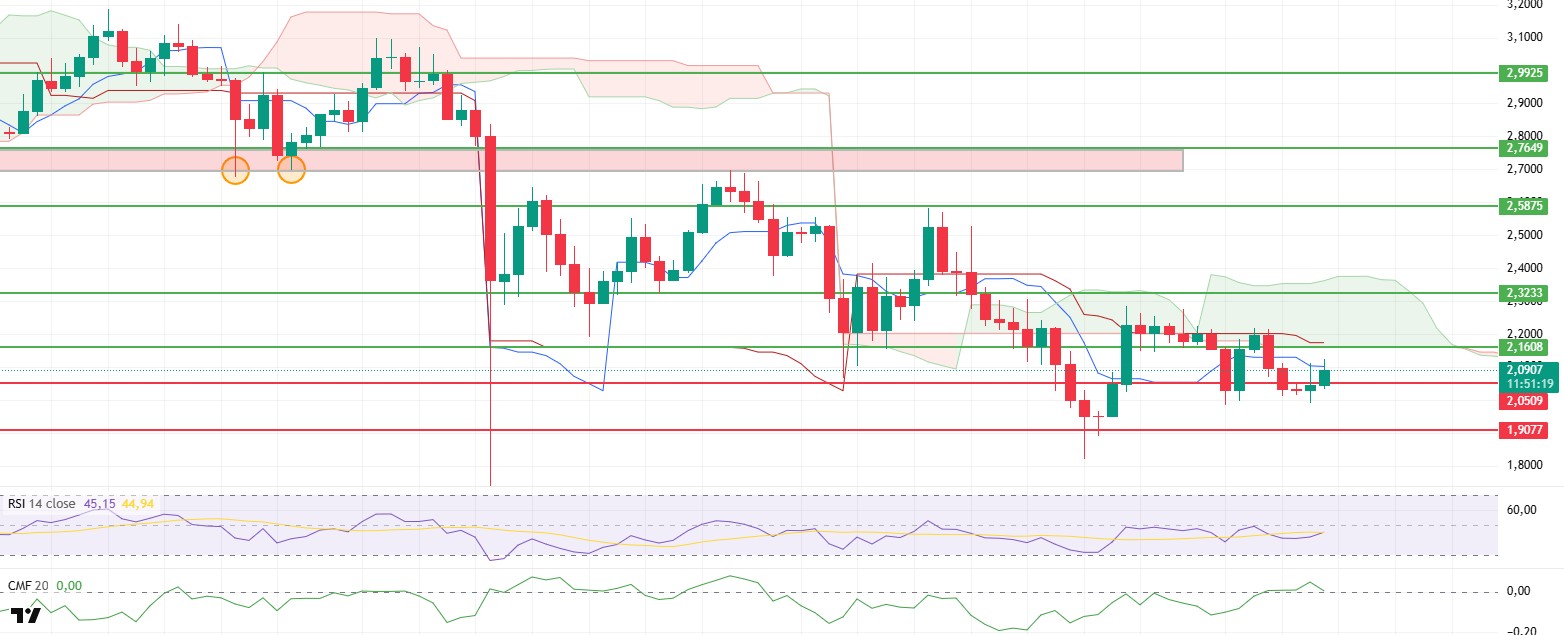
Last week’s price movement on the XRP side clearly showed that uncertainty continues in the market. The breaking of the $2.17 resistance during the week and the price rising to the $2.23 level was the first positive sign that buyers were regaining strength. However, the fact that this rise was not sustained and the price fell back to the $2.05 level showed that the market is still struggling to inspire confidence.
Although there are signs of recovery in momentum, the picture is not fully strengthened. The RSI indicator gained some momentum compared to last week but has not yet reached levels that would confirm a strong bullish structure. The need for buyers to act more aggressively is still at the forefront.
The CMF indicator, which we use to track liquidity flows, continues to move upward. However, limited capital inflows make it difficult for the price to sustain its upward attempts. In other words, there are purchases, but their effects are still fragile in higher time frames.
On the trend side, a mixed structure prevails. As the price continues to trade below the Ichimoku kumo cloud, the medium-term trend is broken. The fact that the Tenkan and Kijun levels have not yet fully turned supportive indicates a lack of technical confirmation. Every sell-off encountered in resistance areas reminds us that buyers have not yet dominated the market.
The focus of monitoring in the coming week will be on critical levels. For downside risks not to increase again, XRP needs to maintain stability above the $2.05 level. If it can gather strength above this support, it could target the $2.12 level first, followed by the $2.17–$2.23 range. On the other hand, closes below $2.05 could accelerate selling pressure and trigger the $1.98–$1.95 support band to come back into play. The market’s current stance remains cautious and uncertainty-heavy. Despite improvements in liquidity, the technical outlook has not fully shifted in favor of buyers. The main battle that will determine the price’s short-term direction will take place between the $2.05 support and the $2.23 resistance. Buyers’ reaction in this area will determine XRP’s roadmap for the coming week.
Supports: 2.0500 – 1.9077 – 1.6189
Resistances: 2.1608 – 2.3233 – 2.5875
SOL/USDT
In the Solana ecosystem;
- Kalshi launched tokenized event contracts on Solana.
- DeFi Development Corp partnered with Harmonic to increase Solana Validator revenue.
- Franklin Templeton launched the Solana Spot ETF, known as SOEZ.
- Revolut has started supporting the Solana network.
- Solana Mobile will launch the SKR token with a 10 billion token supply in January.
- Solmate will acquire RockawayX to create a $2 billion corporate Solana giant.
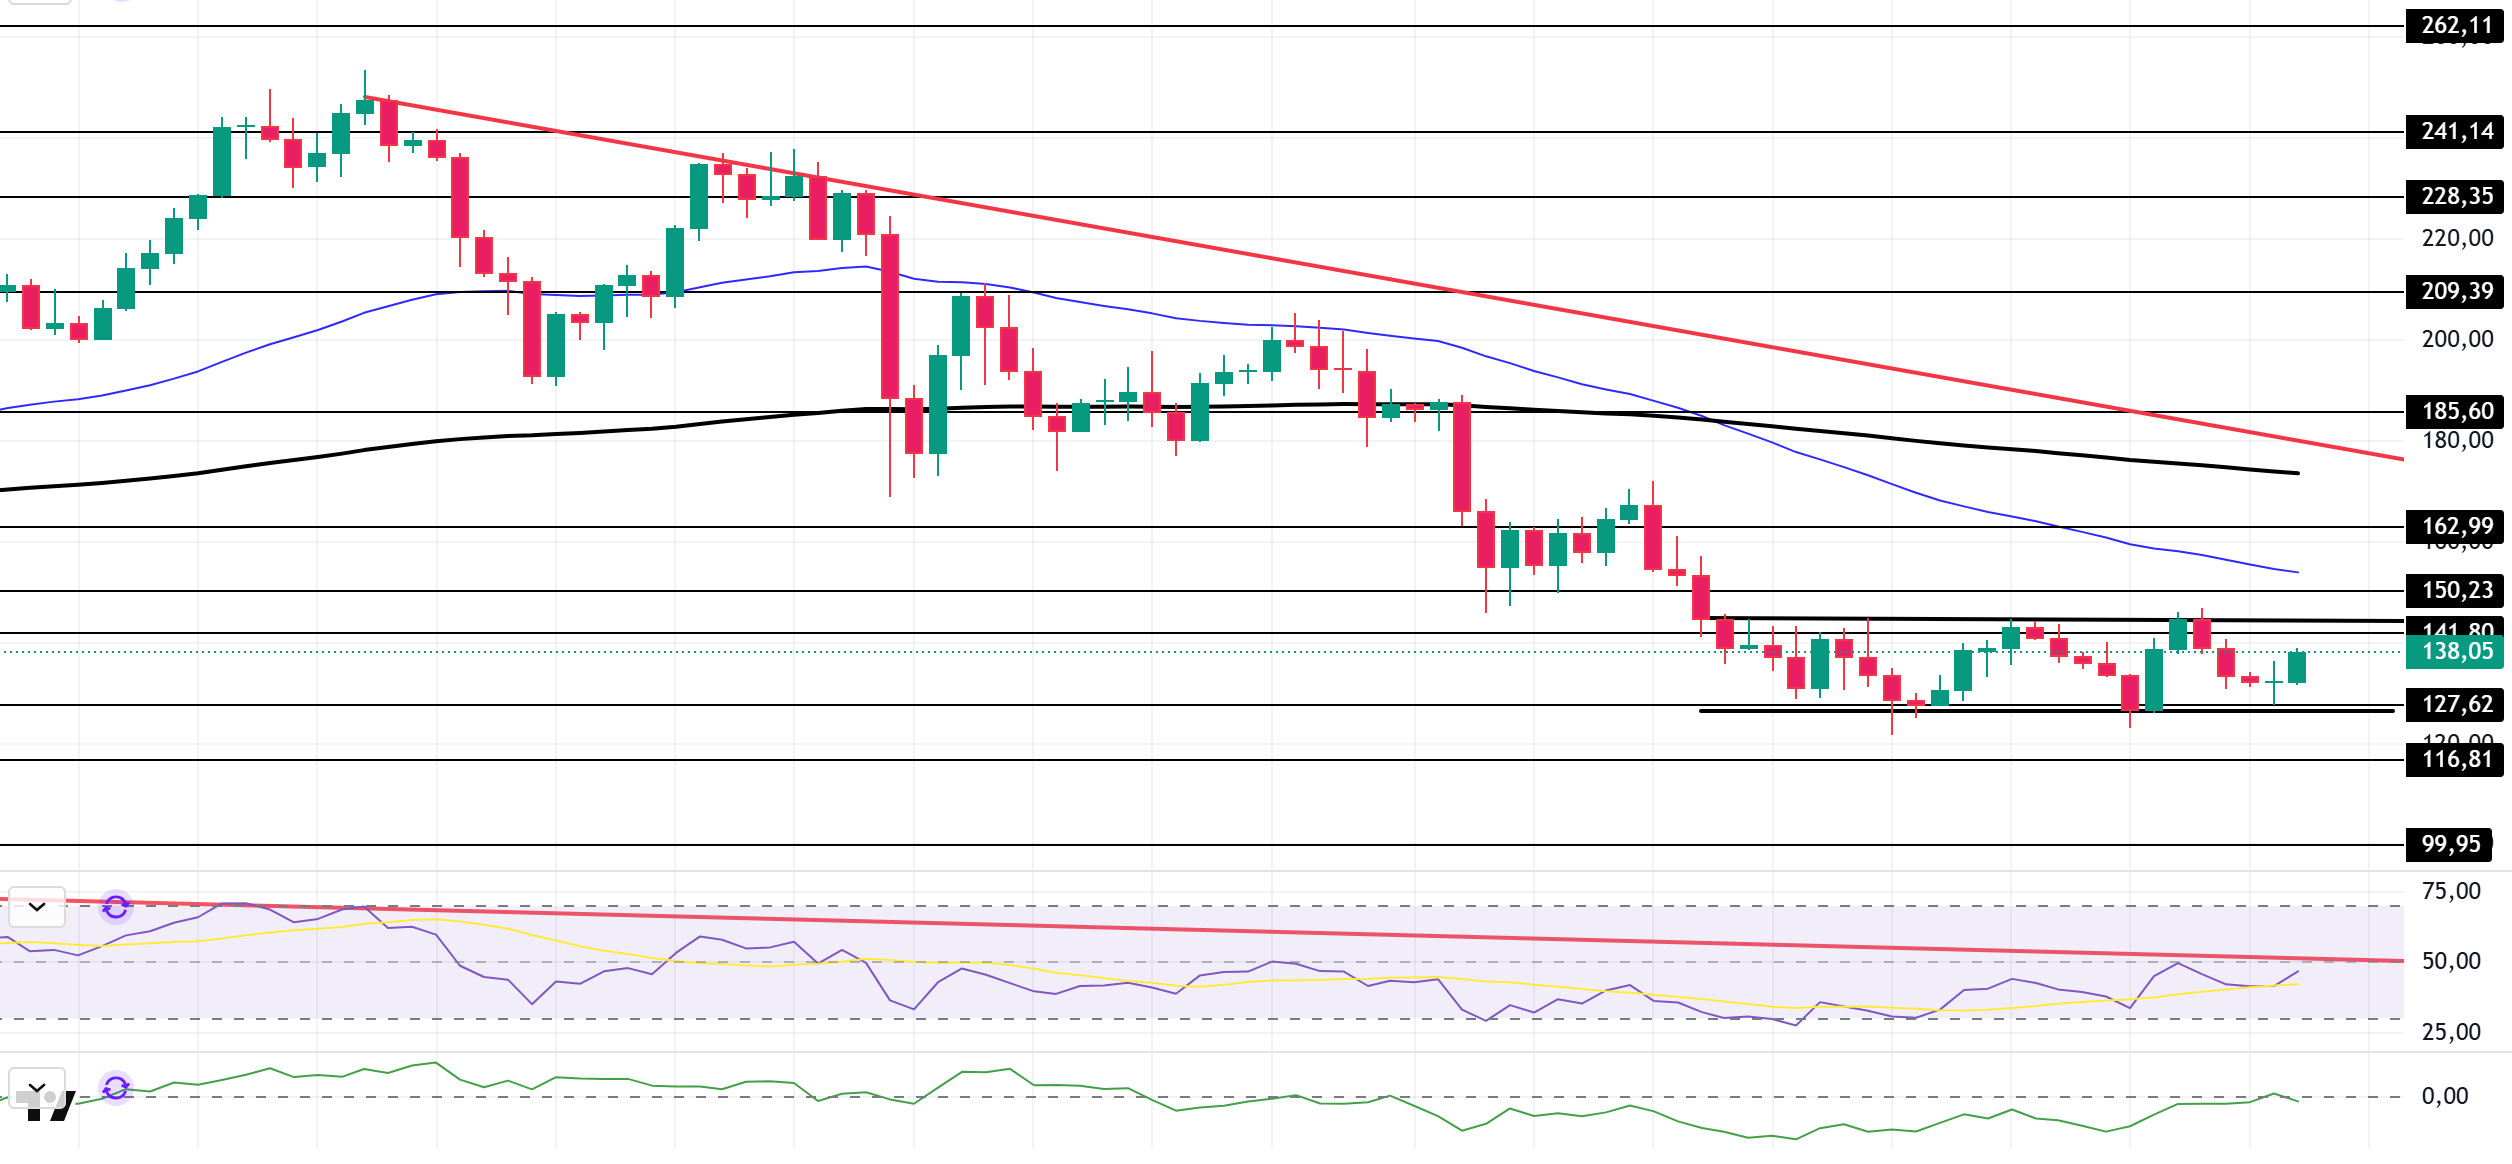
SOL price showed a slight increase on the daily chart this week. The asset remained in the lower region of the downward trend that began on September 18. Testing the strong support level of $127.62 and the bottom level of the horizontal band, the price gained momentum and showed a slight increase. Currently trading at the midpoint of the horizontal band, the price may test the 50 EMA (Blue Line) moving average as resistance if the uptrend begins. If the pullback continues, the $116.81 level should be monitored.
The asset is trading below the 50 EMA (Exponential Moving Average – Blue Line) and 200 EMA (Black Line) moving averages, indicating that the asset is trending downward. Furthermore, the 50 EMA remained below the 200 EMA. This indicates that a “dead cross” formation is continuing from a technical perspective. This shows that the potential for a decline in the medium term has increased. The RSI (14) is hovering near neutral territory. At the same time, the indicator has remained below the downward trend line that began on July 22. These factors indicate increased selling pressure. The Chaikin Money Flow (CMF-20) has started to move toward neutral territory. At the same time, balanced cash inflows and outflows could keep the CMF-20 indicator at neutral levels. If macroeconomic data remains positive and developments in the ecosystem continue to be favorable, the first major resistance level of $162.99 could be retested. Conversely, in the event of potential negative news flow or deterioration in macro data, the $99.95 level could be monitored as a potential buying opportunity.
Supports: 127.62 – 116.81 – 99.95
Resistances: 141.80 – 150.23 – 162.99
DOGE/USDT
- 21Shares has updated its ETF application.
- Tesla’s website revealed the new Dogecoin payment code.
- Buenos Aires approved crypto tax payments with Dogecoin.
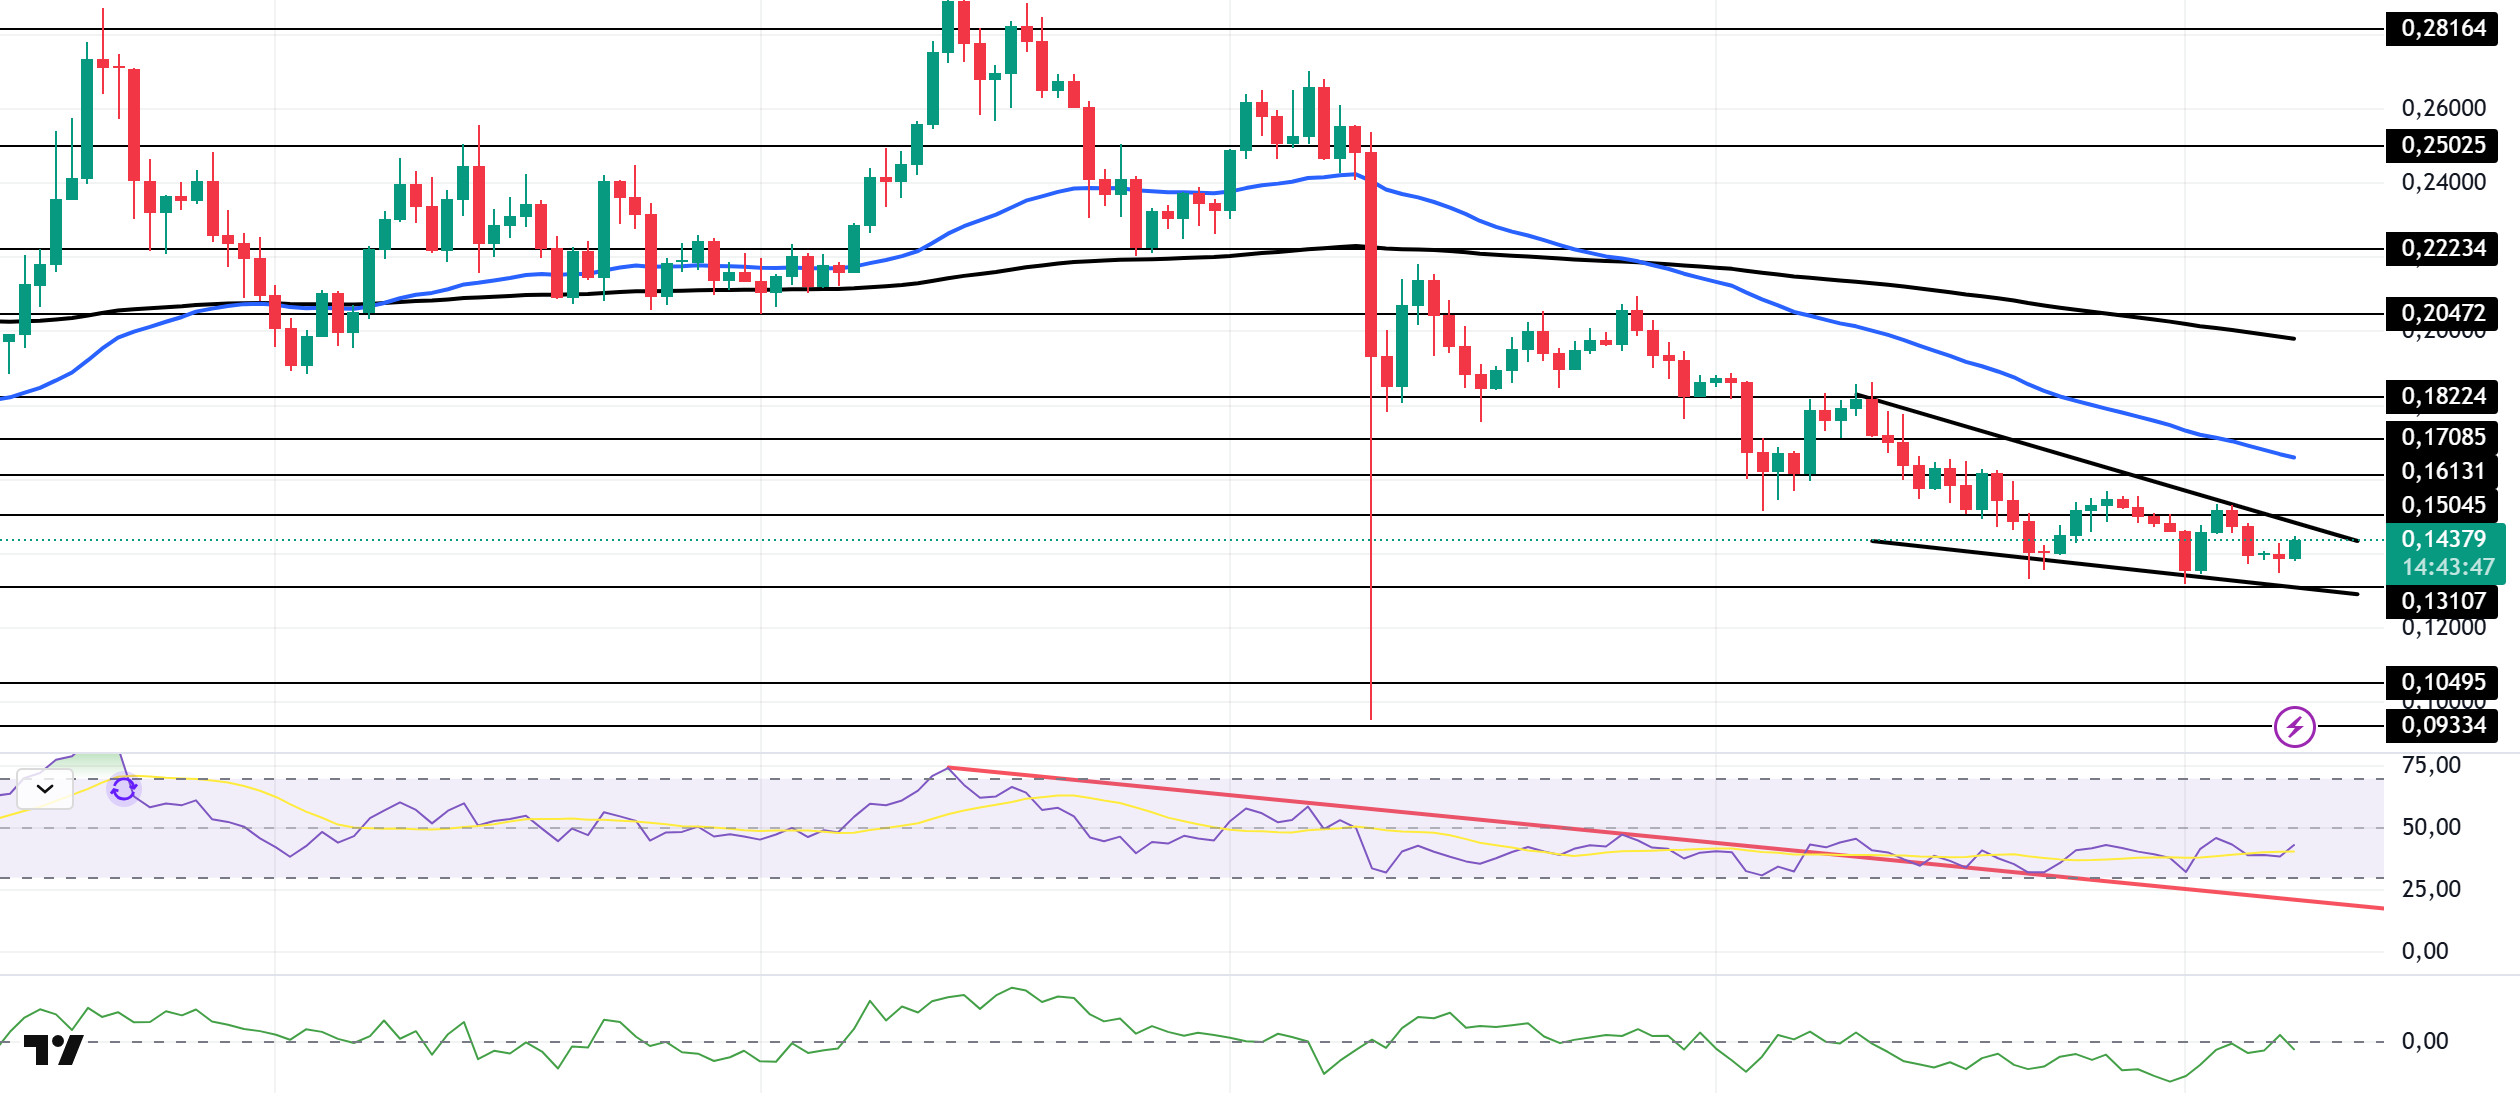
DOGE has been trading sideways on the daily chart since last week. The asset continued to price within the descending wedge formation that began on November 10. Testing the base level of the wedge formation at , a strong support level, the price failed to break through this level and showed a slight increase. Currently, the asset is preparing to test the resistance level of the descending wedge formation’s ceiling. If it closes above this level, it may test the 50 EMA (Blue Line) moving average as resistance. In the event of a decline, it could test the $0.10495 level as support.
The asset continued to trade below the 50 EMA (Blue Line) and 200 EMA (Exponential Moving Average – Black Line) moving averages. This indicates that the asset is trending downward. On the other hand, the 50 EMA moving average being below the 200 EMA moving average shows us that the “dead cross” formation is continuing. This also indicates that the asset has the potential to lose value at this moment. The Chaikin Money Flow (CMF–20) indicator rose to a neutral level. Money inflows continue to decline. This could push the CMF-20 into negative territory. Looking at the Relative Strength Index (RSI-14) indicator, it has risen from the oversold zone to the middle of the negative zone. At the same time, it has remained above the descending line that has been in place since September 13. This indicates that buying pressure could be building. In the event of macroeconomic risks or negative news from the ecosystem, the $0.10495 level can be monitored as a strong support. On the other hand, if the upward movement gains strength, the $0.17085 level comes to the fore as the first strong resistance level.
Supports: 0.13107 – 0.10495 – 0.09334
Resistances: 0.15045 – 0.16131 – 0.17085
TRX/USDT
Last week, with 1 billion USDT minted on the Tron network, the total USDT supply on the network reached $79.5 billion. Thus, Tron continues to be one of the leading blockchain networks in terms of USDT supply.
Last week, the TRON network generated a total of $49.1 million in revenue, continuing to be the highest-earning ecosystem among all blockchain networks. This consistent revenue performance is seen as a data point confirming the health and resilience of TRON’s economic model based on stablecoin transaction volume.
During the week of December 1-7, 2025, a total of 26.3 million TRX were burned on the TRON network. Despite this, the circulating supply increased by 1 million. The increase in circulating supply creates an inflationary effect on TRX. This development may create slight supply pressure on the TRX price in the short term, but if the burn trend continues, a balance may be seen in the medium term. Additionally, the total number of addresses also increased by 1.9 million to 351.3 million during the same week.
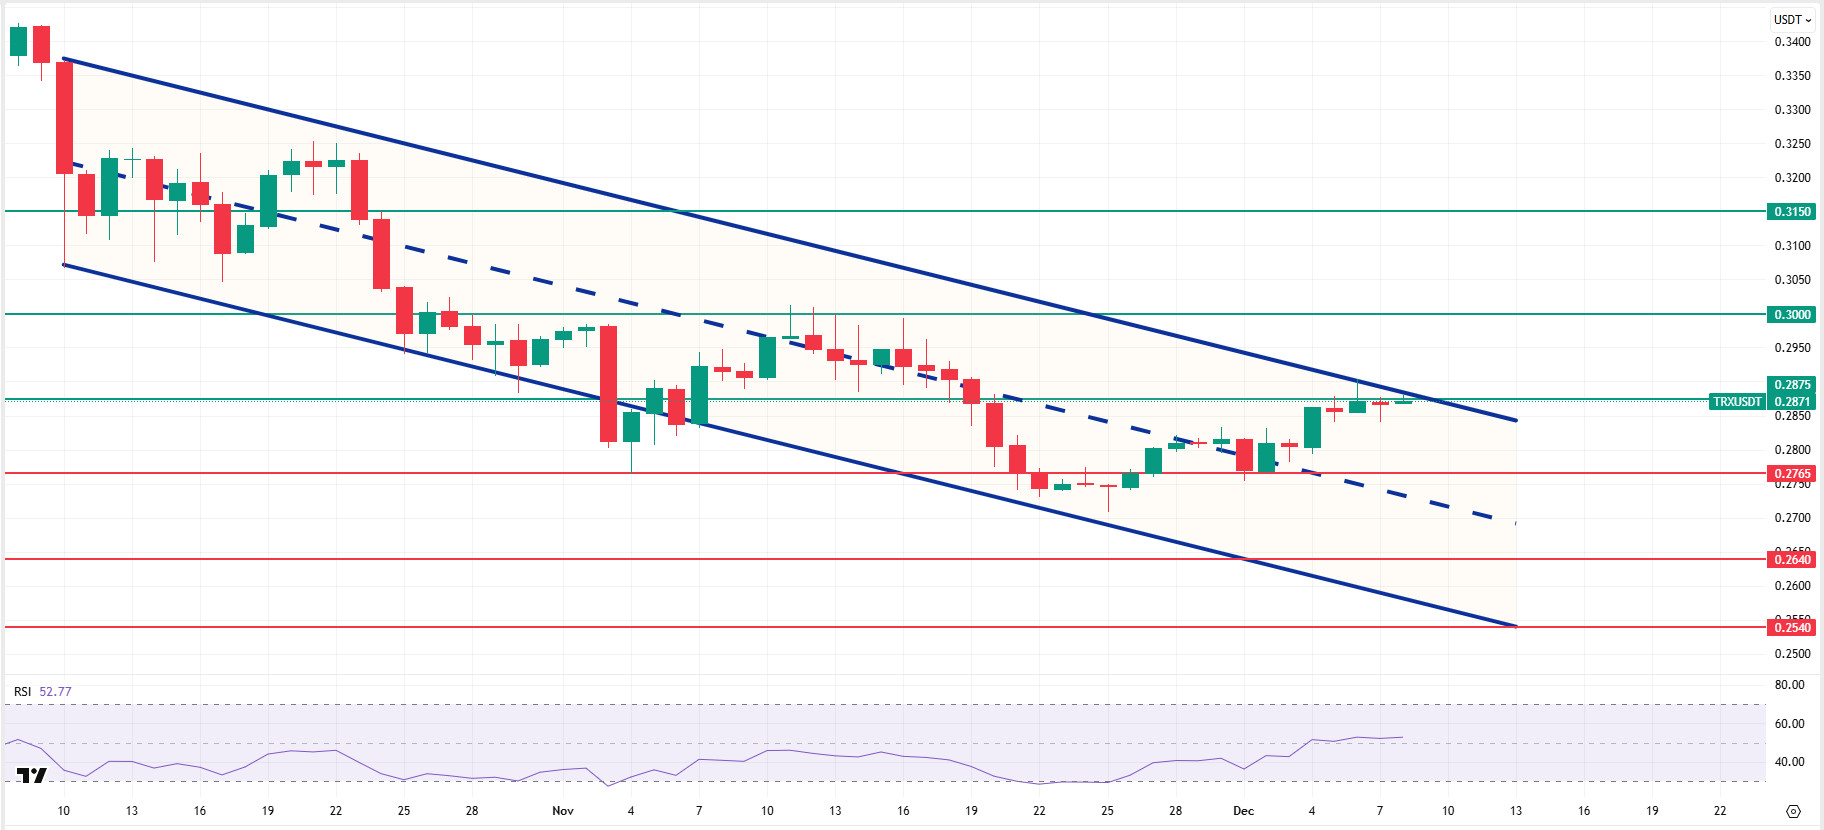
Technically speaking, TRX started last week at 0.2815 and gained approximately 2% in value throughout the week, closing at 0.2867. Thus, TRON completed its second consecutive week of gains, with a market value of $27.1 billion. Currently trading at 0.2871, TRX is at the upper band of the bearish channel on the daily chart and is attempting to break above the 0.2875 resistance level. The Relative Strength Index (RSI) value is observed to be at 52. Considering its position within the bearish channel and the RSI indicator, the TRX price is expected to decline. This indicates that it may move towards the middle band of the channel. In such a case, it may test the 0.2765 support level. If it closes below the 0.2765 support level, it may test the 0.2640 support level. If it fails to close below the 0.2765 support level and buying appetite increases in the market, it may rise with potential buying from the area in question. In such a case, it may test the 0.2875 and 0.3000 resistance levels in sequence. The 0.2540 level is being monitored as a critical support point on the daily chart. Staying above this level could maintain the upward trend, while closes below it could lead to increased selling pressure and deeper downward price movements.
Supports: 0.2765 – 0.2640 – 0.2540
Resistances: 0.2875 – 0.3000 – 0.3150
AVAX/USDT
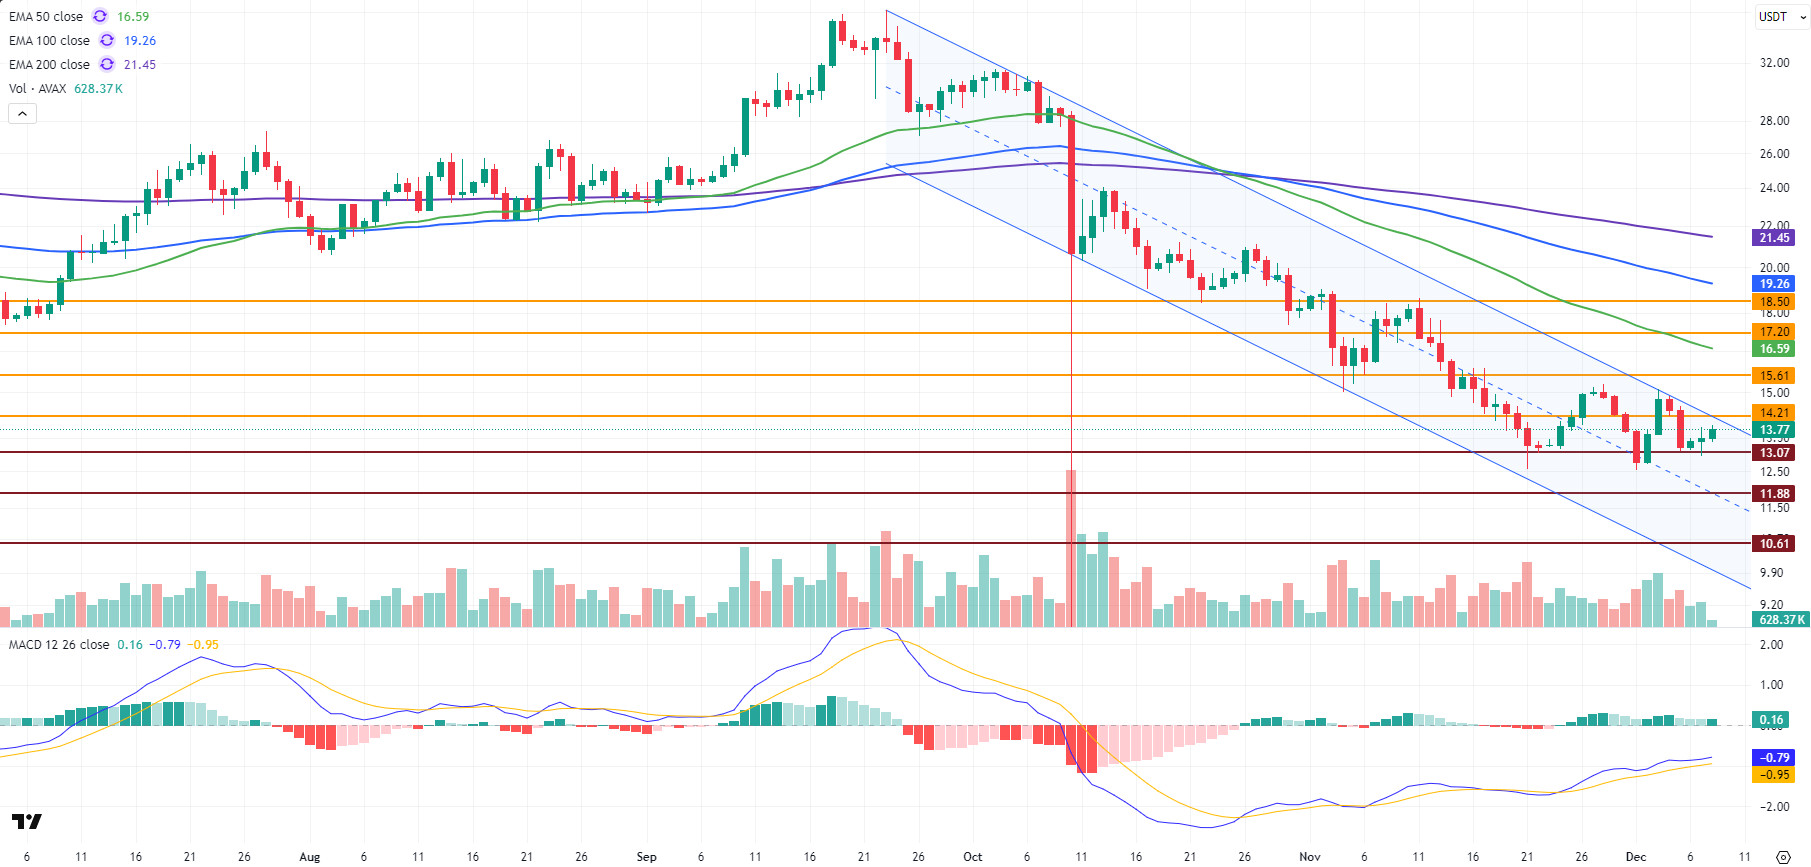
AVAX performed weakly last week, mirroring the volatile market conditions. Starting the week at $13.71, AVAX tested the upper band of the bearish channel on the daily chart during an upward attempt but faced selling pressure in this region and failed to build strong momentum. After the reaction from the upper band of the bearish channel, AVAX tested the support level of $13.07 ( ) several times during its decline but failed to break it. Reaction buying from this area pushed the price back up. With no strong momentum yet, the gains remained limited, and the week closed at $13.49. AVAX, which lost approximately 1.6% on a weekly basis, started the new week with a slightly positive outlook. Despite developments in its ecosystem, AVAX’s price movements continue to follow the general recovery-decline cycle of the cryptocurrency market.
On the daily chart, the Moving Average Convergence/Divergence (MACD) line remains above the signal line, but its horizontal upward direction indicates that a strong momentum has not yet formed. The MACD is in negative territory, signaling that the trend reversal necessary for gains to strengthen has not been confirmed. The MACD line and signal line are very close to each other, increasing the possibility of a rapid directional breakout in the short term. For momentum to be considered truly gaining strength, it is important for the MACD to move into positive territory. Otherwise, selling pressure could increase again at resistance levels. AVAX continues to trade below all critical Exponential Moving Average (EMA) levels. This structure indicates that a strong resistance band has formed above the price and that the overall trend remains in negative territory.
From a technical perspective, the $13.07 level is the first critical support level in AVAX’s decline. If this level is broken during AVAX’s decline, selling pressure could increase, causing a pullback towards the $11.88 and $10.61 support zones. In the bullish scenario for AVAX, the first significant resistance is at the $14.21 level. If this region is broken and sustained above, AVAX’s rise could continue towards the $15.61, $17.20, and major resistance level of $18.50. However, for the upward momentum to gain strength, trading volume support and the MACD moving into positive territory to confirm momentum are critical. The overall picture, with the MACD in negative territory and the price trading below EMA levels, indicates that AVAX remains under pressure in the short term. Therefore, recovery attempts may remain limited unless there are closes above the resistance levels.
(EMA50: Green Line, EMA100: Blue Line, EMA200: Purple Line)
Supports: 13.07 – 11.88 – 10.61
Resistances: 14.21 – 15.61 – 17.20
SHIB/USDT
This week, the Shiba Inu ecosystem saw a convergence of on-chain metrics and developments in infrastructure and derivative products, highlighting a narrative that strengthens the medium- and long-term outlook. Reflected in Shibburn data, the daily burn amount exceeded 30 million tokens on some days, pushing the weekly total burn to over 100 million and creating an aggressive token burn pace not seen in a long time. Although an extraordinary volume alert showing over 23 trillion SHIB transfers on on-chain data providers came to the fore during the same period, the lack of a parallel movement in exchange reserves and liquidity suggested that this flow was most likely a technical anomaly caused by data duplication or wallet consolidation. thus reinforcing investors’ cautious stance regarding data quality while reading on-chain signals.
On the infrastructure front, temporary drops in block and transaction statistics on the Shibarium explorer briefly raised questions about a possible “reset” on the network. However, technical explanations revealed that this was a temporary phenomenon related to the new RPC infrastructure and reindexing process, with no deviation from the core roadmap. The roadmap particularly emphasized the privacy layer based on Fully Homomorphic Encryption, developed in collaboration with Zama, and reiterated that Shibarium will continue to position itself as an L2 with advanced privacy features in the medium term. On the derivatives side, Coinbase Derivatives’ launch of 24/7 trading for futures contracts covering Shiba Inu and its confirmation of the schedule for perpetual products to be launched in the coming days stood out as a critical step in making the ecosystem more visible and accessible in regulated markets. Completing this picture and drawing attention were whale movements indicating that large amounts of SHIB were being transferred from Coinbase to new wallets. thus, throughout the week, when short-term fluctuations are set aside, the perception that the Shiba Inu ecosystem is increasingly based on a medium- and long-term narrative, both in terms of its deflationary burn process and its repositioning at an institutional scale, gained strength.
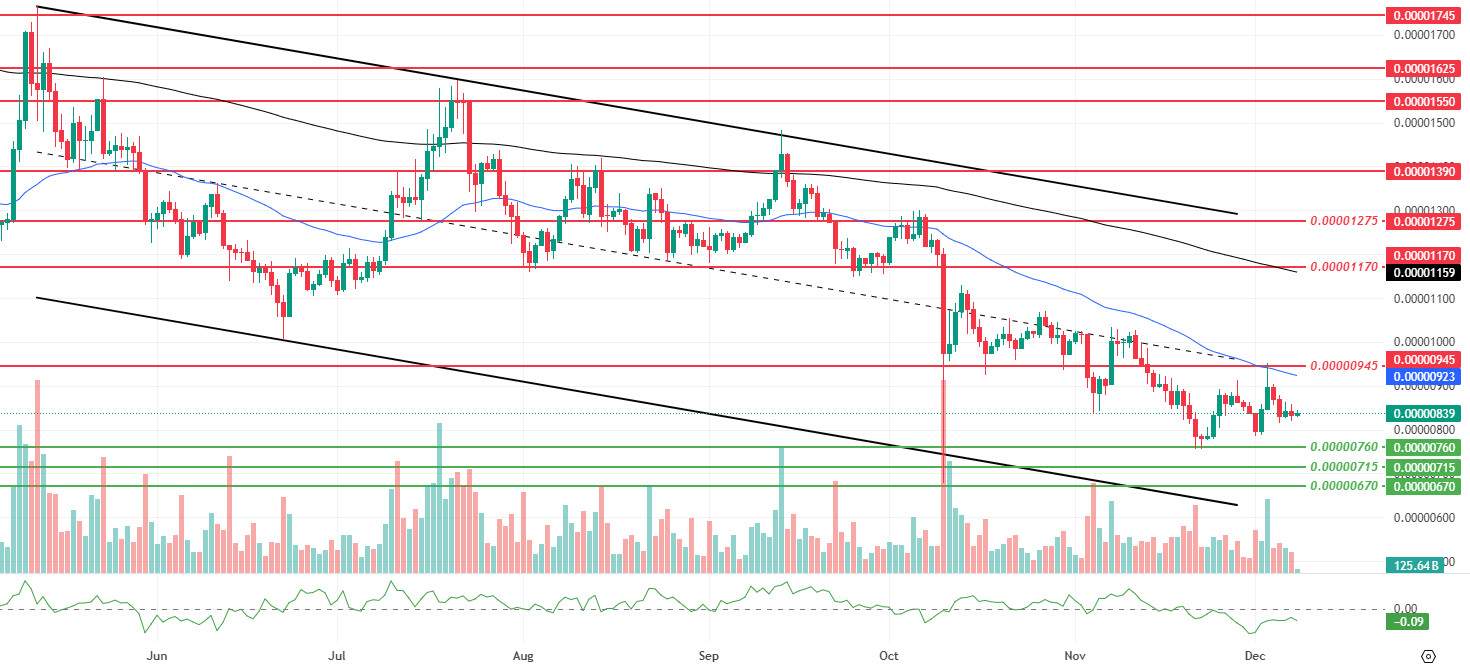
This week’s technical outlook shows continued pressure within the descending channel, but despite the rebound gaining some momentum and volume, it has not yet turned into a trend breakout. Despite the increase in momentum and volume, the pullback in volatility indicates that the rebound is progressing in a more controlled manner but under intense selling pressure every time it approaches the resistance zone. The price tested the resistance level at $0.00000945, which corresponds to the middle band of the descending channel, and then retreated due to selling pressure from this area, confirming that this threshold is a key barrier in the short term. Pricing below the 50-period Exponential Moving Average (EMA) and 200-period EMA suggests that the current reaction remains a limited relief wave within the main downtrend. The Chaikin Money Flow (CMF) indicator remaining in negative territory indicates that liquidity conditions on the buyer side are fragile despite increasing volume, and that upward attempts are mostly working as a redistribution of existing positions.
In terms of upward attempts, the level passing through $0.00000945 maintains its position as the first critical threshold, as it corresponds to the middle band of the descending channel and is also the point where the last rebound attempt was rejected. Without volume-supported and consecutive closes above this level, it seems difficult for a more meaningful and lasting recovery scenario towards the resistance zones at $0.00001170 and $0.00001275 to gain momentum. On the downside, the zone passing through $0.00000760 continues to be the main technical reference support. As long as it stays above this level, the current picture can be interpreted as a rebound process fluctuating between the lower and middle bands of the descending channel, but with pressure still favoring sellers. Conversely, if declines below the support at $0.00000760 become permanent and the Chaikin Money Flow (CMF) indicator deepens further into negative territory, it would not be surprising to see the areas at $0.00000715 and $0.00000670 come back into focus. If the positive reaction in volume persists alongside momentum and the price continues to hold above the support level at $0.00000760, the scenario of a gradual reaction within the descending channel can be considered to remain on the table.
(EMA200: Black line, EMA50: Blue line)
Supports: $0.00000760 – $0.00000715 – $0.00000670
Resistances: 0.00000945 – 0.00001170 – 0.00001275
LTC/USDT
Litecoin (LTC) closed the past week with a 1.15% decline against USDT, entering the new week at $81.43. LTC also declined by 1.1% against Bitcoin during the same period, experiencing a negative period in terms of coin value, with a total market capitalization of approximately $6.29 billion. Despite this decline, Litecoin managed to start the week by rising one spot to 18th place in the crypto market rankings. On the futures side, the total open interest decreased by 11% compared to the beginning of the previous week. However, the long/short ratio of 0.92 in the current positions opened at the beginning of the new week indicates that derivatives market participants have downward expectations.
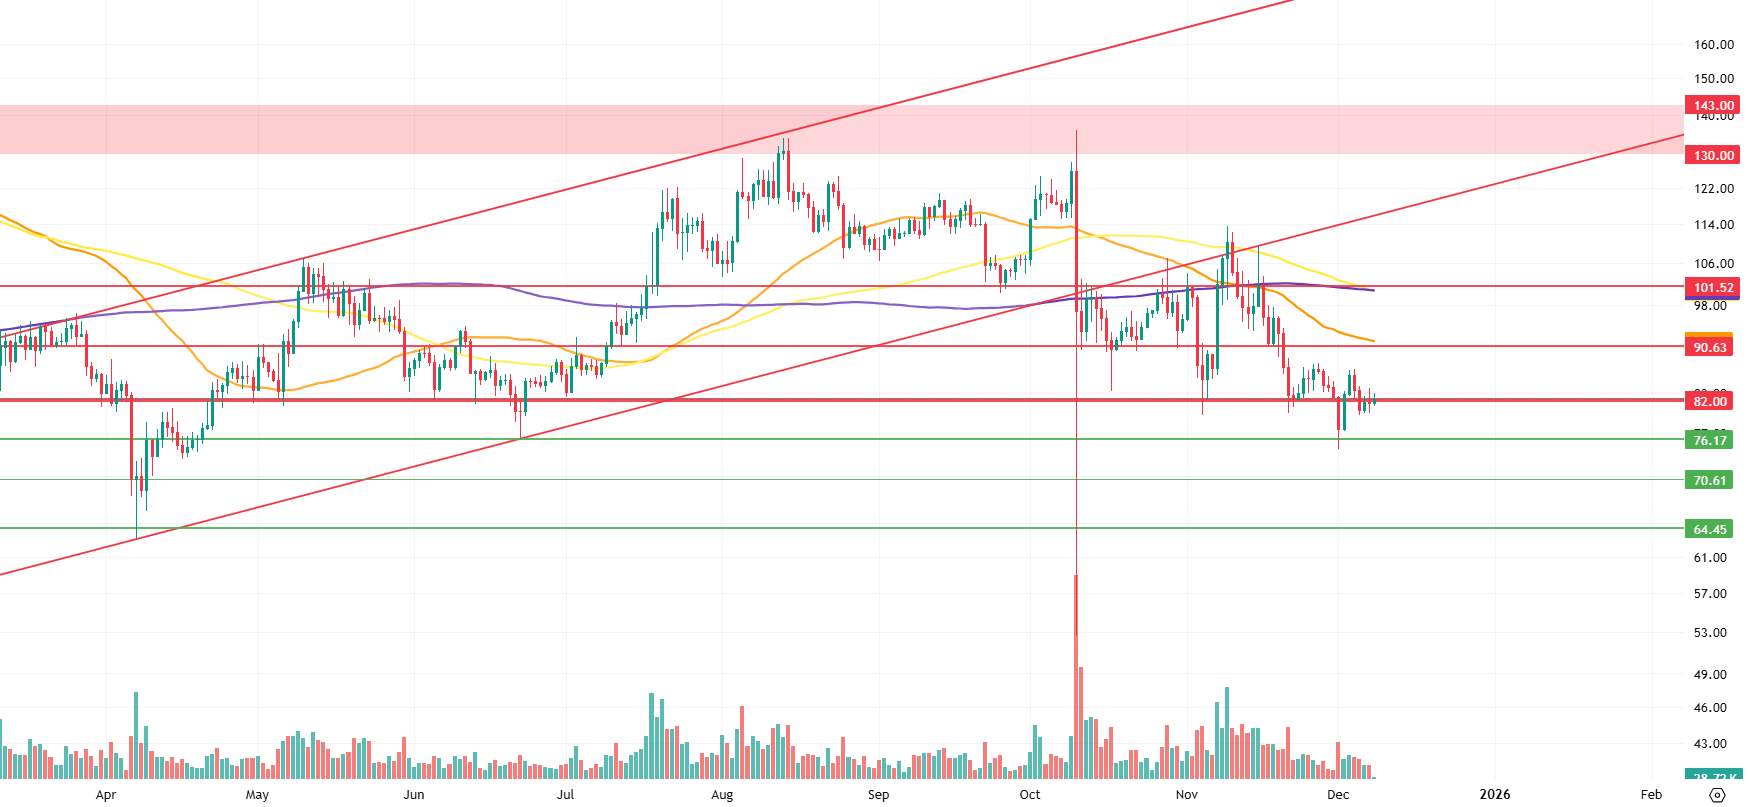
From a technical perspective, the Litecoin price continues to trade below the 100-period (yellow), 50-period (orange), and 200-period (purple) moving averages. This outlook can be considered data confirming that selling pressure has not yet been overcome in both the short and long term. Last week’s pullback-heavy trend, combined with the loss of volume in futures trading and the general market anxiety, contributed to buyers taking a back seat and strengthening sell positions.
If, contrary to the expectations of derivatives market participants at the beginning of the week, a low-probability upward scenario materializes, the $82.00 level emerges as the first significant horizontal resistance. Although the price is likely to be suppressed in this region, if there are persistent closes, Litecoin’s short-term outlook could shift from negative to neutral, and the price could potentially move towards a band movement in the $82.00 – $90.63 range. Furthermore, when the 50-period moving average approaching the $90.63 level from above eventually joins this band range, increased selling pressure from above should be expected during any future upward movements toward this region. A break above this level, i.e., $90.63, could turn the outlook positive by enabling the price to enter a structure targeting $101.52. However, at this point, the proximity of the 100- and 200-period moving averages to the target zone strengthens the possibility of significant selling pressure forming on any move towards triple-digit prices.
In line with the general expectation, if the price moves downward, the $76.17 level emerges as the first critical support. The fact that the price has rebounded from this region several times in the past creates the first line of defense where short-term buyers could step in. Should this level be broken downward, the $70.61 level comes into play as additional support that could limit the decline. In a deeper pullback scenario, the $64.45 level, acting as the last line of defense, retains its importance as a critical stopping point.
Supports: 76.17 – 70.61 – 64.45
Resistances: 82.00 – 90.63 – 101.52
BNB/USDT
The latest BNB Chain data points to weaker performance compared to the previous week. The number of daily active users on BSC declined from 2,529,913 to 2,499,709, while on opBNB it fell from 2,191,071 to 1,992,874, showing a significant drop in users. Similarly, total transactions decreased by approximately 10.5% on BSC and 11.5% on opBNB. However, the increase in total transaction volume from $62.8 billion to $66.4 billion indicates that high-value transfers have increased despite the decline in user and transaction numbers. On the other hand, the decline in TVL from $11.6 billion to $11.12 billion indicates that liquidity outflows continue on the DeFi side. Overall, while user and transaction activity in the ecosystem weakened, the increase in transaction volume and the decline in TVL indicate that the market has entered a short-term consolidation phase.
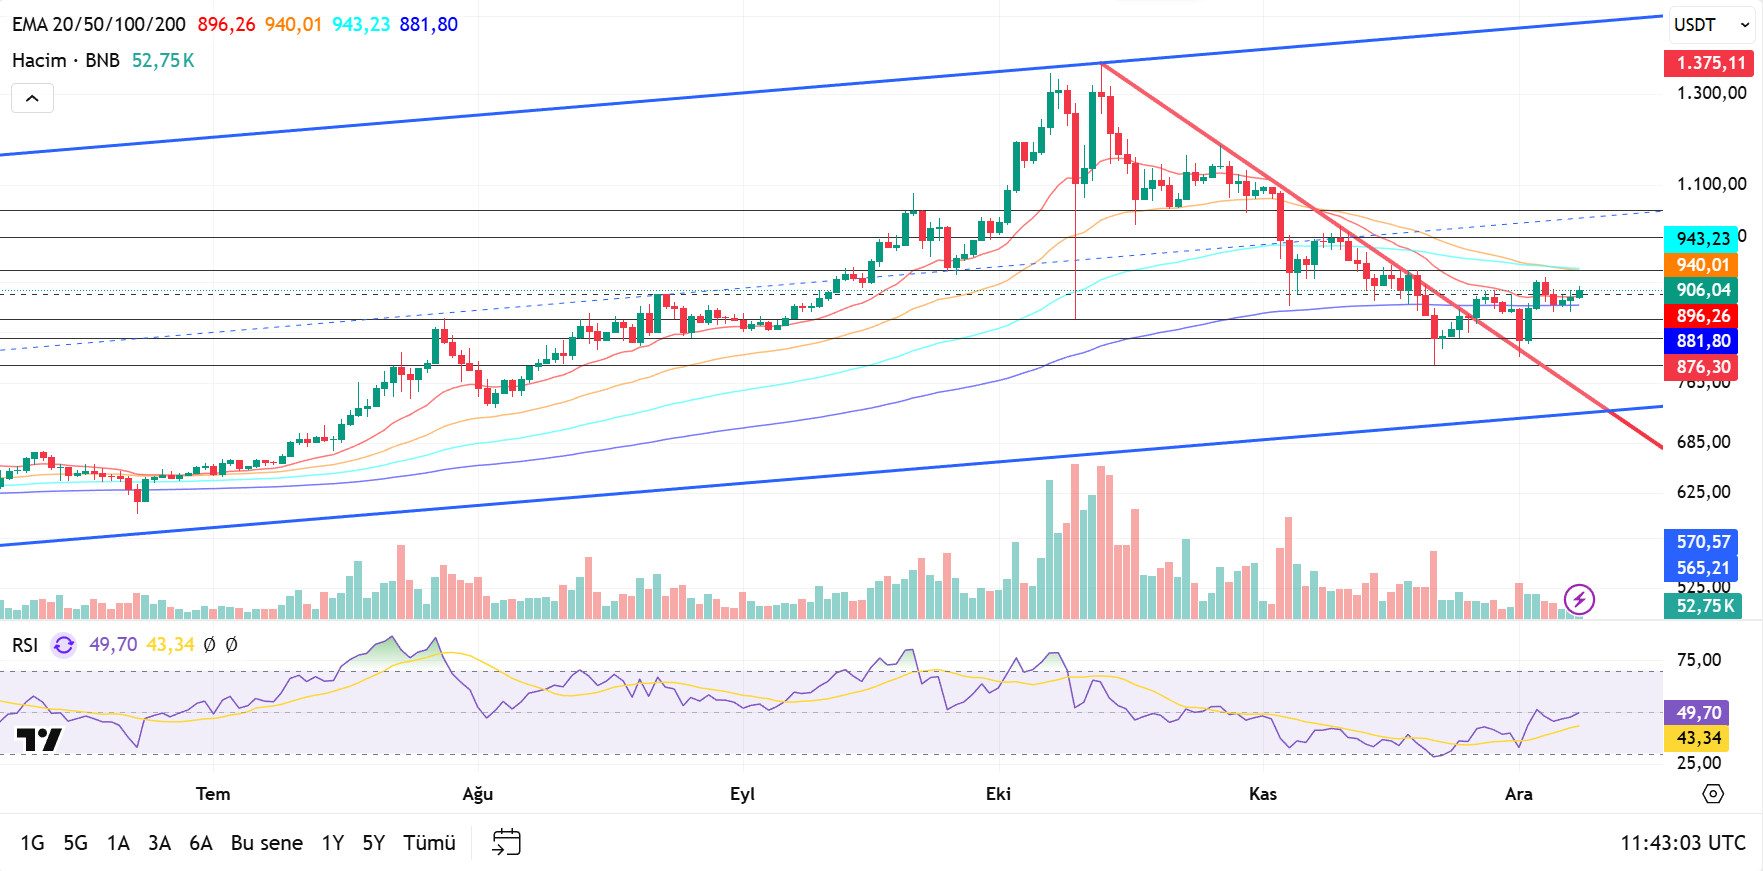
From a technical perspective, the correction that began after the all-time high (ATH) has retreated to the $790 support zone identified in previous analyses. After seeking support at these levels for a while, BNB ended its downward momentum with the candlestick formations that emerged and turned its direction upward again. With this recovery, the price gained positive momentum towards the descending trend line and, with the support of new candles, broke the trend upwards, rising to the $940 level. Although some pressure was seen in this region depending on market conditions, the overall positive outlook was maintained.
The current outlook for the BNB/USDT pair is positive. However, the price moving within a horizontal band raises questions about which direction it will continue in the coming period. Upward price movements are expected to reinforce the current positive outlook.
Technical indicators for BNB, currently trading in the $860-$940 range, show that low trading volumes are limiting the upward momentum. In addition, the RSI indicator appears to be hovering at relatively low levels due to weak momentum.
According to the technical picture, if buying appetite is maintained and market momentum strengthens, BNB is expected to retest the $940 resistance level in the first stage. If this level is broken, it is likely that the falling trend line will be exceeded. If the trend is broken and the price remains above this level, a rise towards the $1,000 and $1,050 levels appears technically possible.
Conversely, if selling pressure increases, the price is expected to retest the $860 support level. If this level is broken, a pullback towards the $830 and $790 support zones will likely occur.
Supports: 860 – 830 – 790
Resistances: 940 – 1000 – 1050
LINK/USDT
Chainlink announced via X that its six core services are now actively integrated across twelve different blockchains by a total of 12 projects. The adoption of Chainlink’s data streams and CCIP infrastructure by projects such as Planeta IX, Truflation, and MapleStory Universe on major networks like Base, Bitcoin, BNB Chain, Celo, Ethereum, Monad, Pharo, Polygon, Solana, TON, and TRON stands out as a significant step accelerating the ecosystem’s multi-chain expansion.
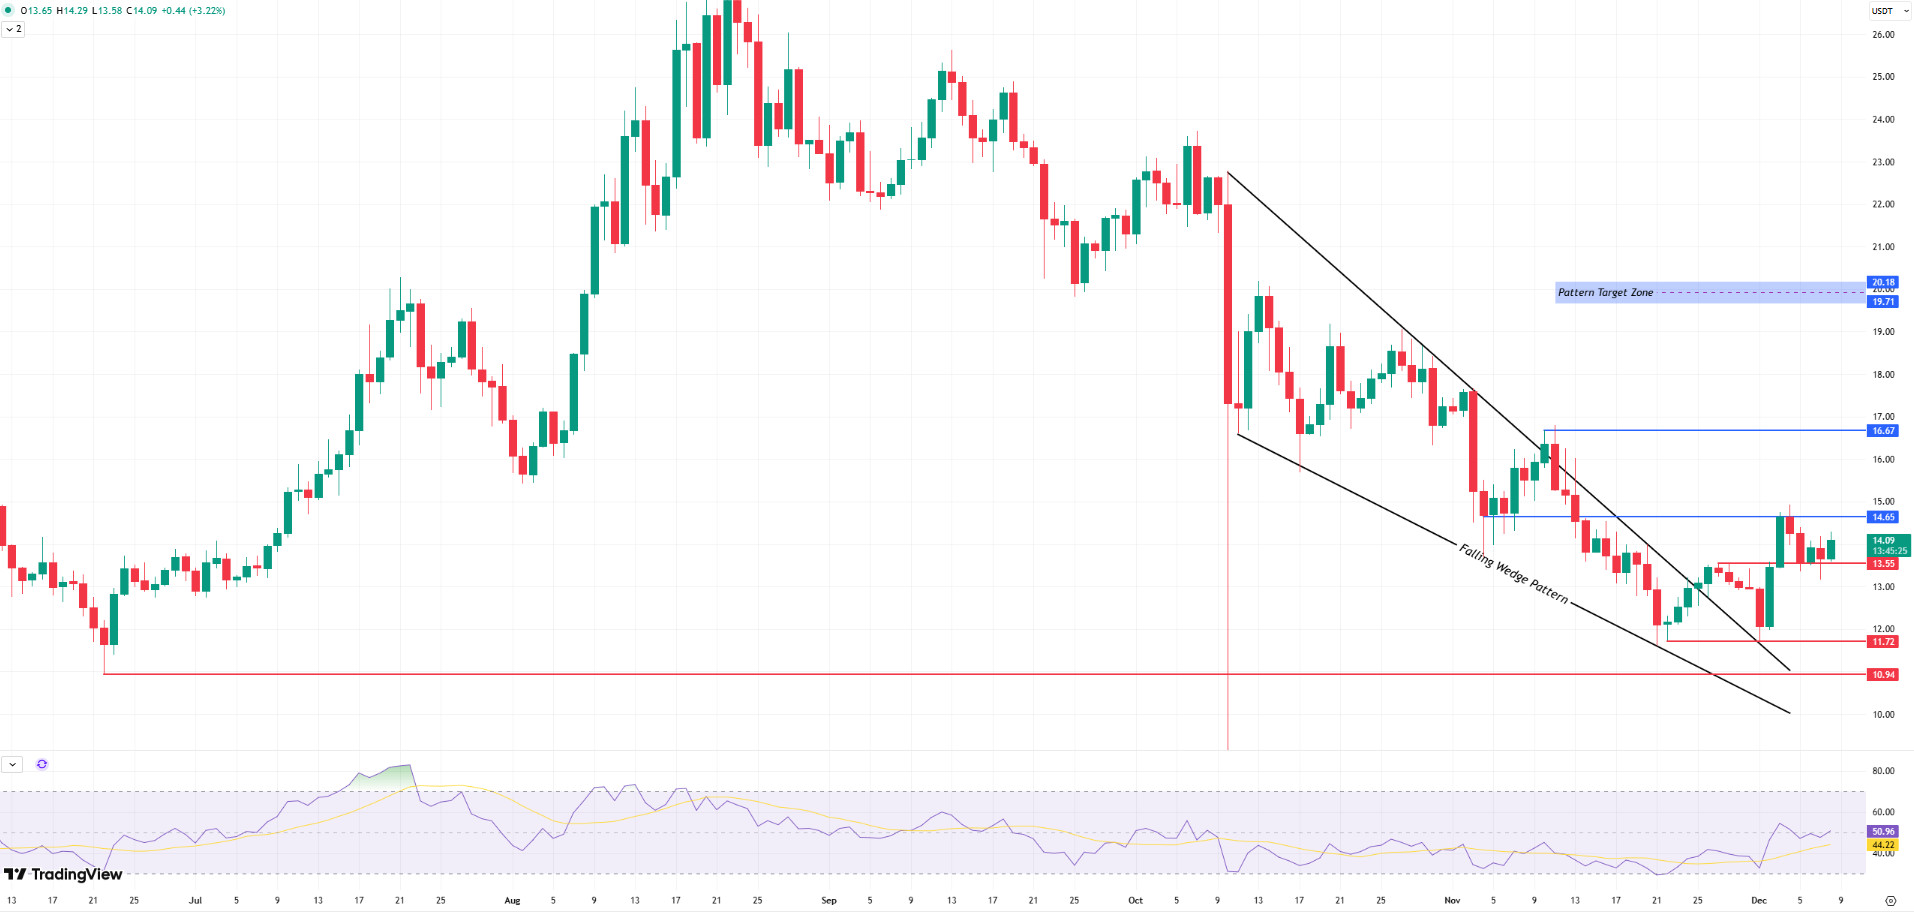
After the sharp decline on October 10, LINK continued its retreat, forming a gradual downtrend with a low-low, low-high pattern for about two months. However, the price’s strong rebound from the $11.61 level on November 21 was an important signal that changed the short-term outlook. Although the price retested this low level, it did not produce a new low below it and rose above the $14 level with strong buying. While this move is relatively small in structural terms, we can say that it formed a clear double bottom pattern on the chart. This formation supports the positive short-term outlook while also activating our medium-term expectation of a falling wedge formation, ensuring that the overall structure evolves into a positive outlook.
In the current situation, the first significant barrier to the continuation of the upward movement is the $14–15 range. A daily close above this range will both strengthen the rising bottom–rising top structure and increase price stability by confirming the formation structure. If this scenario materializes, the first target could be the $16.67 level. Subsequently, we could see a strong upward momentum towards the $19–20 target zone indicated by the falling wedge pattern.
It should be noted that if the price reaches this target zone, most of the sharp decline seen on October 10 will have been recovered. Therefore, the target zone we mentioned is critical in terms of re-establishing a strong long-term trend. However, due to this level being both a supply zone and a formation target, it is highly likely to trigger profit-taking.
In the downside risk scenario, the first level the price will encounter is the $13.55 support. However, the truly critical zone for momentum to remain positive will be the $11.72 level. A pullback towards this level could disrupt the rising bottom-top structure, turning the outlook neutral or even negative, and could cause the price to retreat to the $10 region as buyers lose strength.
On the Relative Strength Index (RSI) side, although we see short-term fluctuations in the middle band, we see a structure in line with our technical structure and are within the positive zone (50). Therefore, not falling below this level could increase risk appetite and strengthen the upward momentum.
Supports: 13.55 – 11.72 – 10.94
Resistances: 14.65 – 16.67 – 20.18
SUI/USDT
This week, there were significant and noteworthy developments in the Sui (SUI) ecosystem. The Sui network integrated Wrapped Bitcoin (WBTC) support this week. This step will increase Bitcoin liquidity on Sui and make cross-chain bridging transactions faster. This will facilitate liquidity flow between blockchains , and Sui’s DeFi applications are expected to attract more users and capital. This could increase Sui’s usability for DeFi applications.
Additionally, Grayscale’s recent update to its SUI ETF application with the U.S. Securities and Exchange Commission (SEC) can be seen as a concrete indicator of growing institutional interest in SUI.
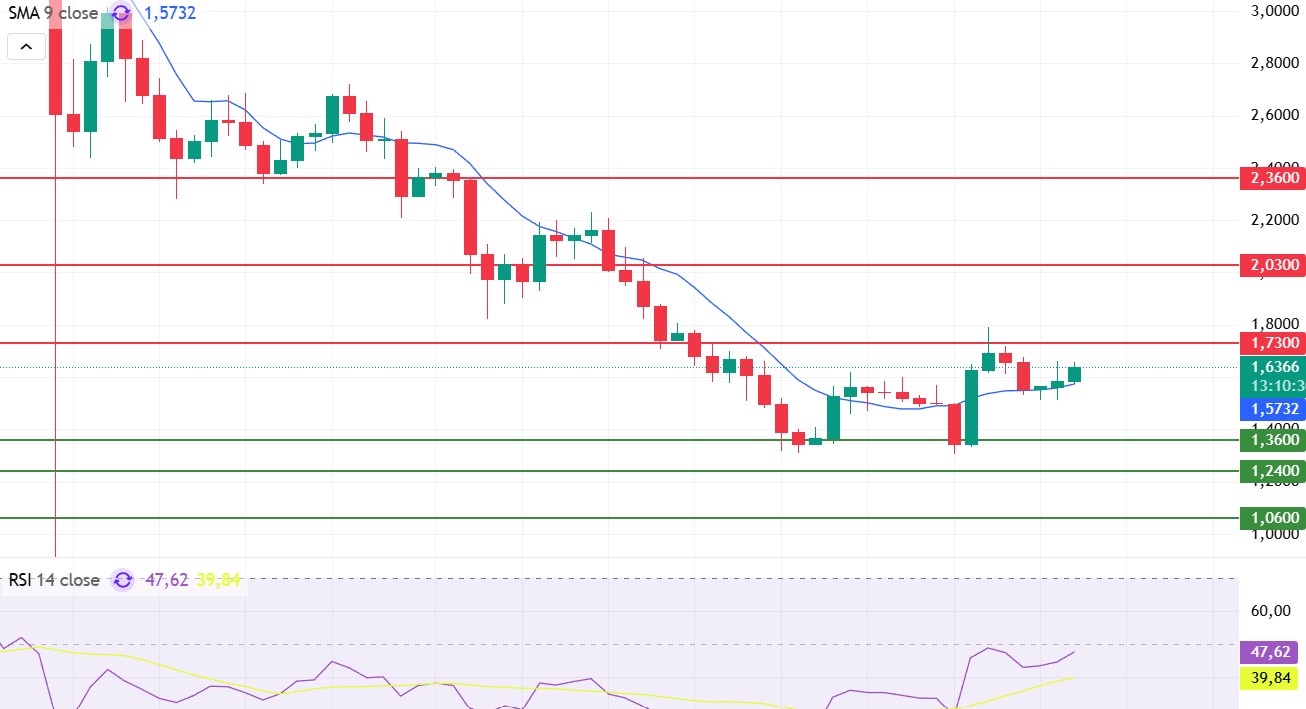
Following recent developments, when we look at Sui’s technical outlook, we see that the price has been moving sideways at around $1.63 on a weekly basis, influenced by fundamental developments. The Relative Strength Index (RSI) is currently in the range of 47.62 – 39.84. This range indicates that the market is trading close to the buy zone; the RSI continuing in this range between 40.00 – 45.00 could signal a potential buying point. If the price moves upward, the resistance levels of $1.73, $2.03, and $2.36 can be monitored. However, if the price falls to new lows, it may indicate that selling pressure could deepen. In this case, the support levels of $1.36, $1.24, and $1.06 come to the fore. Based on the trend line, a pullback to $1.06 appears technically possible. According to Simple Moving Averages (SMA) data, Sui’s average price is currently at $1.57. The price remaining above this level indicates that the current uptrend could technically continue.
Supports: 1.06 – 1.24 – 1.36
Resistances: 1.73 – 2.03 – 2.36
ADA/USDT
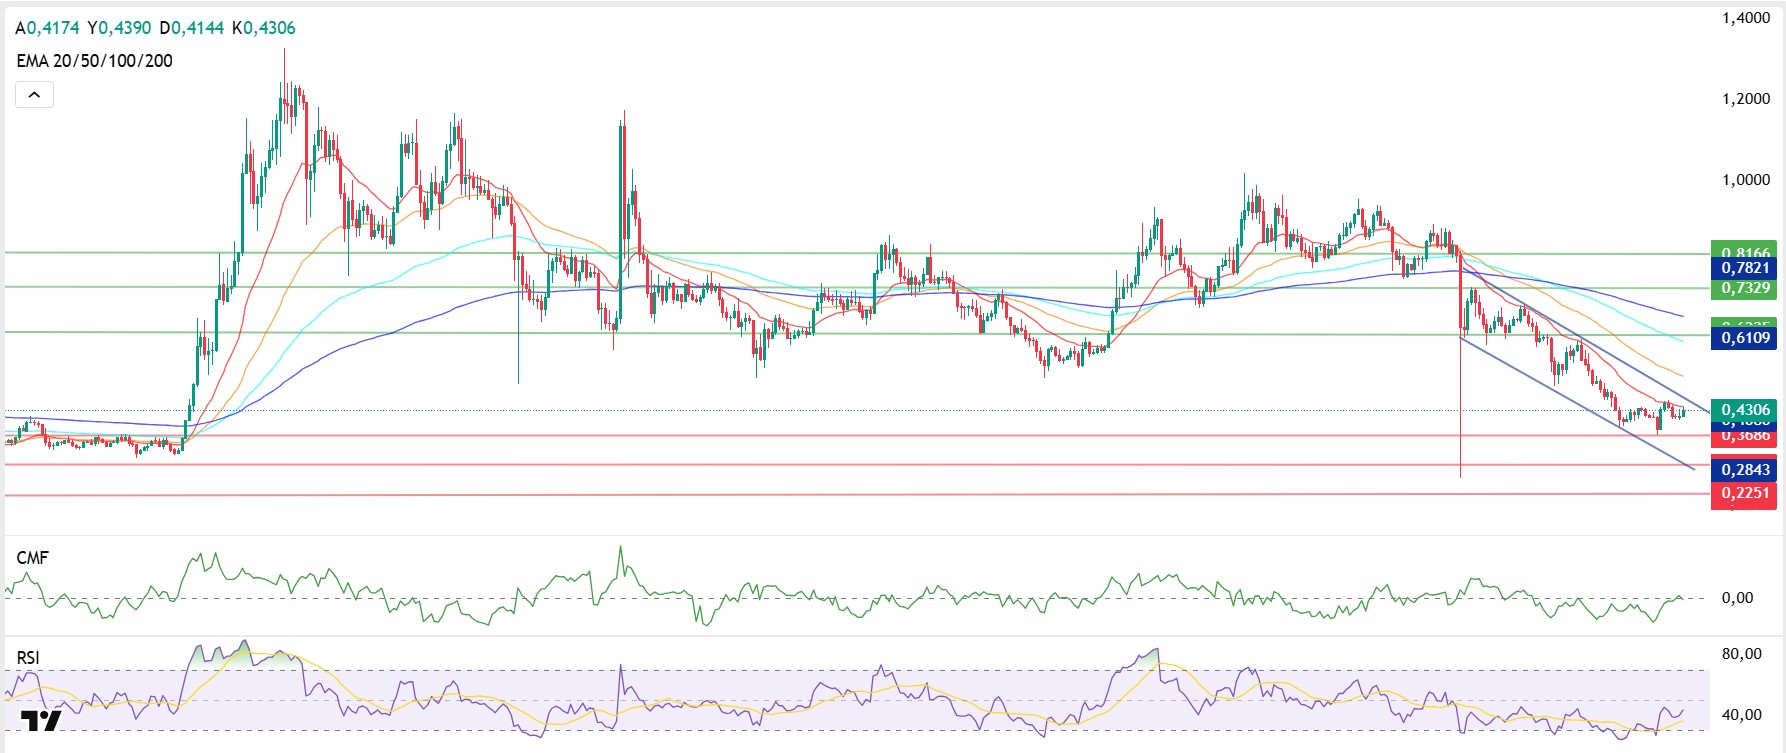
Since last week, the ADA price has gained 12% in value, rising to $0.4328. Cardano’s institutional investors have pooled 70 million ADA to trigger growth on the chain. It was announced that the funds will be allocated to the development of stablecoins, reliable oracle data, cross-chain bridges, custody integrations, and analysis tools. Cardano developers approved a $70 million ADA treasury withdrawal ( ) to finance infrastructure integrations for the network, which is considered a significant coordinated effort for the network. This proposal received over 60% support in the governance vote and was recorded as the fastest approval since Cardano’s on-chain voting system began. With this system aimed at boosting Cardano’s DeFi and overall ecosystem growth, the ADA price has seen an increase. Although ADA has been on the rise during this period, it remains well below the resistance level of $0.6109.
Technically, the ADA price continues to trade below the 20-day and 50-day Exponential Moving Averages (EMA 20 – Red Line) (EMA 50 – Orange Line). If the price rises to the resistance point of the downtrend at the $0.6203 level, the second resistance point at the $0.7329 level can be followed. These levels indicate that ADA buyers are willing to buy at higher prices, showing that buyer pressure is increasing over time. A retest of this region could play a critical role in completing the downward channel. If the price breaks above the 20-day Exponential Moving Average (EMA 20 – Red Line), it is expected to close above the 50-day Exponential Moving Average (EMA 50 – Blue Line). While the Relative Strength Index (RSI) continues to hover near the buy zone at 44 levels, the Chaikin Money Flow (CMF-20) remains at 0.01 levels, indicating that the price is in the sell zone. If the price falls as a result of the macroeconomic data expected to be announced this week and the statements to be made by US President Trump, the important levels we will follow are the bottom of the downtrend at $0.3732. In the event of closes below this level, the support level can be followed in the $0.3030 to $0.2297 band.
Supports: 0.3732 – 0.3030 – 0.2297
Resistances 0.8166 – 0.7329 – 0.6109
Legal Notice
The investment information, comments, and recommendations contained in this document do not constitute investment advisory services. Investment advisory services are provided by authorized institutions on a personal basis, taking into account the risk and return preferences of individuals. The comments and recommendations contained in this document are of a general nature. These recommendations may not be suitable for your financial situation and risk and return preferences. Therefore, making an investment decision based solely on the information contained in this document may not result in outcomes that align with your expectations.