
Technical Analysis
BTC/USDT
The global market agenda took shape as Trump stated that he views the new Fed chair’s immediate interest rate cut upon taking office as a kind of “test,” while Bank of Japan Governor Ueda noted that long-term interest rates are rising rapidly and that bond purchases could be increased if necessary. Although expectations for an interest rate cut are high ahead of the upcoming FOMC meeting in the US, the balance sheet strategy for QE, reserve management, and possible voting divisions within the committee will be at the forefront of the decision statement.
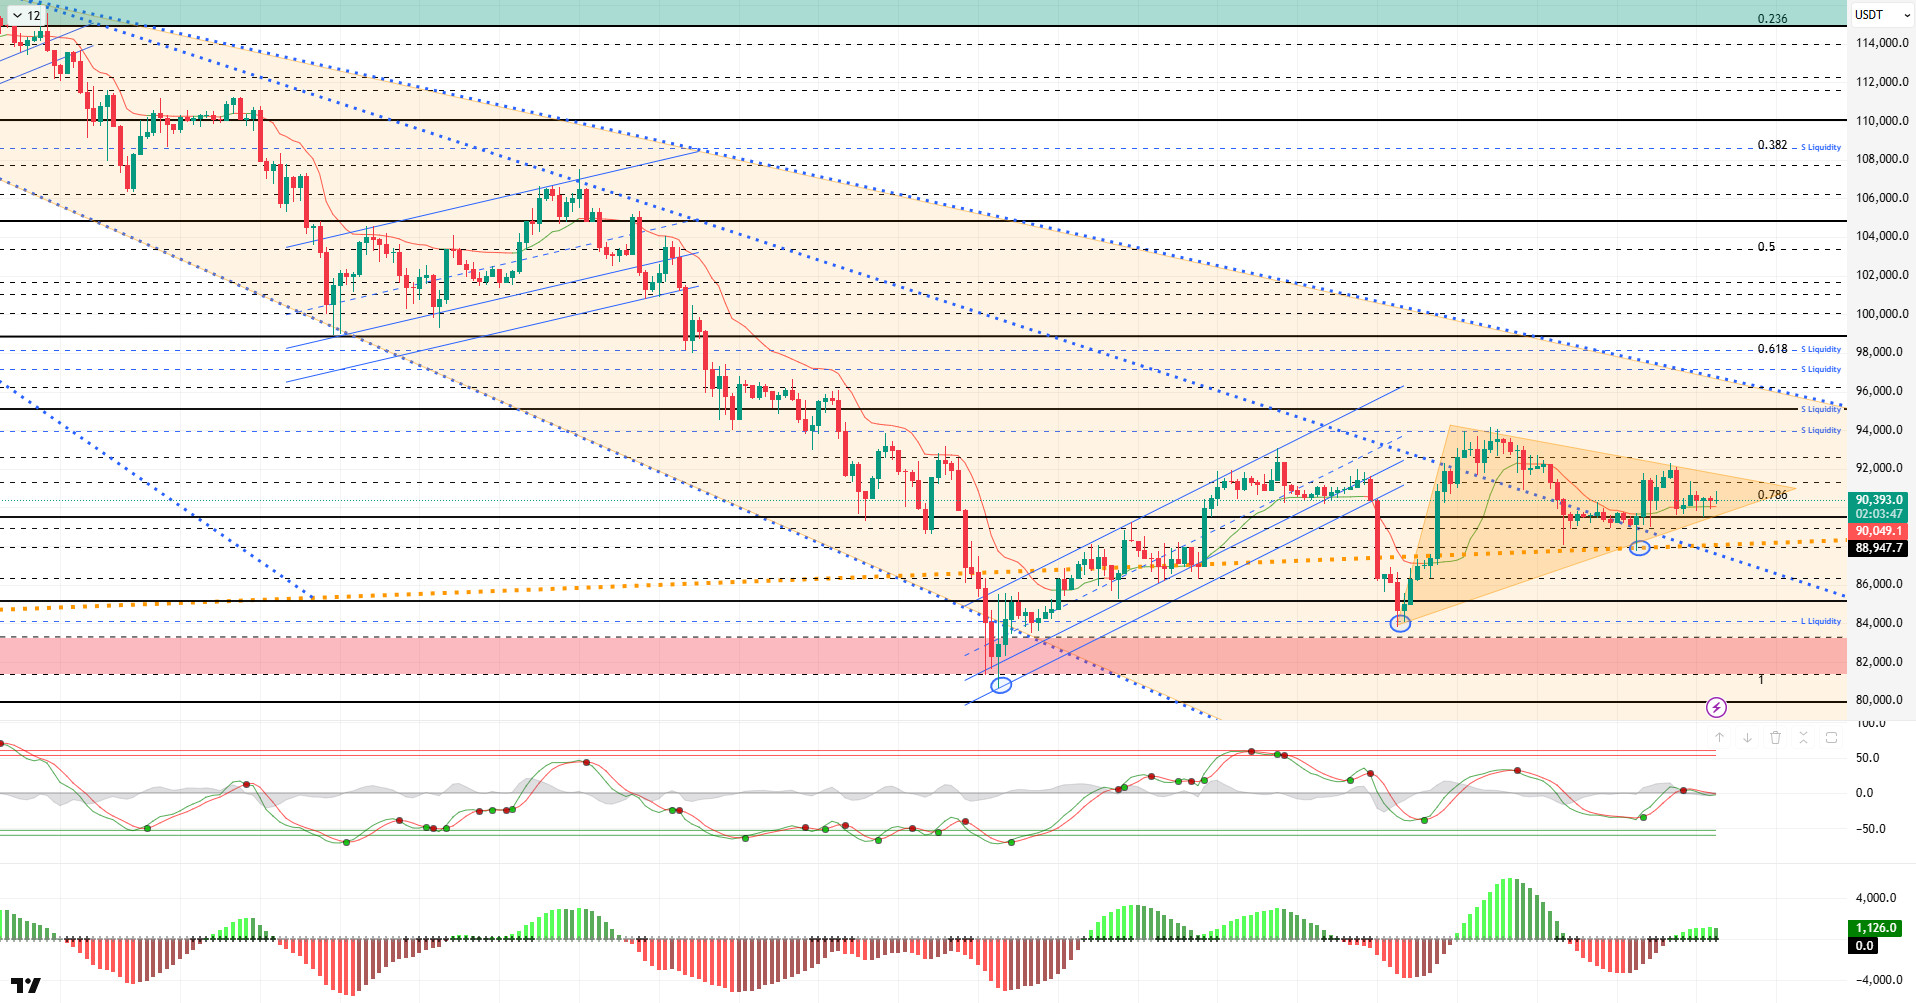
From a technical perspective, BTC continues to hold above the second descending trend line within the orange band. Although it occasionally tests the 90,000 level and lower bands that we monitor as a reference, the price manages to rise above this level each time. The price structure, which forms higher lows and lower highs, points to a clear symmetrical triangle squeeze in BTC. The direction of this squeeze’s breakout will be critical for the continuation of the trend. Monitoring breakout levels, especially with a high-volume breakout, is crucial for confirming the direction.
Technical indicators show the Wave Trend (WT) oscillator in an indecisive state around the channel’s middle band, while the histogram on the Squeeze Momentum (SM) indicator has returned to positive territory. The Kaufman Moving Average (KAMA) is currently just below the price level at $90,000.
According to liquidation data, the recent decline resulted in liquidation of accumulated trades in the 90,000–88,000 range. Sell-side transactions are intensifying in the short term at the 92,000 – 94,500 level, while in the monthly view, they continue to maintain their intensity within the 97,000 – 98,000 band.
In summary, while Trump’s statements regarding the next Fed chair remain in the spotlight, the markets’ main focus has shifted to tomorrow’s Fed interest rate decision. Powell’s signals regarding monetary expansion and forward-looking messages on the interest rate path will be decisive for market direction.On the technical side, BTC, which tested the 80,500 bottom level with the downtrend that began after the ATH, has formed a symmetrical triangle pattern stuck above the 90,000 level, rebounding from this area. While the price continues to search for direction within this structure, the direction of the breakout from the triangle will play a critical role in determining the short-term trend.Liquidity data shows that target areas are regaining importance and the market is finding equilibrium, while the intensity of the selling pressure is increasing. After this stage, 90,000 has become a critical point again for the price to maintain its momentum. Closings and pricing above this level are an important indicator for regaining momentum. In this context, 95,000 stands out as the next target area, and once it is passed, liquidity areas will be monitored again. In the event of a possible selling pressure, 90,000 stands out again as the reference area, and in case of a breakout, the 87,500 level, which is the point where the major uptrend passed, will be monitored.
Supports: 90,000 – 89,000 – 87,800
Resistances: 91,400 – 92,600 – 94,000
ETH/USDT
The Ethereum price rose to $3,140 during the day, moving one step closer to the resistance zone, but with the selling at this level, the price fell back to around $3,110. While the search for short-term equilibrium continues, the price still holding in the high range shows that buyers have not left the market.
The shift to negative territory on the predicted funding rate is noteworthy. While this outlook signals an increase in short positions, the Chaikin Money Flow (CMF) indicator remaining strongly positive indicates that capital continues to enter the market and that buyers are present during price declines. The spot side remaining supportive creates a significant advantage in terms of testing resistance levels.
On the momentum side, the Relative Strength Index (RSI) maintains its positive structure despite accompanying a short-term pullback. The RSI’s structurally strong stance supports the possibility of the price moving back towards the resistance zone.
The technical outlook for Ichimoku is quite positive. The price continues to remain above the cloud, and the Tenkan and Kijun lines positioned in the lower region indicate that the uptrend is progressing on solid technical ground. There are no signs of a breakdown in the trend.
The outlook for ETH hasn’t changed much during the day. Buyers haven’t lost momentum, and the price could attempt to break through the $3,150 level again. If this level is breached, the market has a high potential to head toward the $3,227 resistance level once more. If there is a successful breakout here, the $3,285 – $3,350 range could become the target. In the event of a possible downward movement, the $3,070 level remains important as a strong defense line. As long as this support holds, the upward expectation seems to remain valid.
Supports: 3,070 – 3,020 – 2,872
Resistances: 3,227 – 3,436 – 3,672

XRP/USDT
The XRP price continued its recovery attempts during the day, rising to the $2.08 level, and is now trying to stabilize around $2.06 following the sell-off from this level. Although short-term buyer interest is weak, the price continues to struggle to stay above support levels.
The Chaikin Money Flow (CMF) indicator continues its upward trend in positive territory, indicating that capital inflows are continuing and selling pressure is not entirely dominant. Continued liquidity flow into the market increases the likelihood of the price reacting more quickly in lower regions.
On the Relative Strength Index (RSI) front, a slight recovery is noticeable following the weakness seen in the morning hours. Although momentum is not yet strong, the start of an upward trend is a sign that supports the potential for a short-term reaction.
The technical outlook remains under pressure from the Ichimoku perspective. The price is trading below the Tenkan and Kijun levels, and unless there is a sustained break above the cloud structure, it seems difficult for the trend direction to clearly turn upward. Therefore, the possibility of renewed seller pressure at resistance levels remains on the table.
The XRP price is still trading in the decision zone. As long as the $2.05 support holds, short-term rebounds could bring the $2.10 level back into focus. However, if the price moves downward again and closes below this support, the decline could accelerate, targeting the $1.98–$1.95 range. The key factor determining the market’s direction will be whether the price can maintain stability above the support level. While continued liquidity support is a positive factor, a stronger recovery requires the price to first break above the short-term Ichimoku levels.
Supports: 2.0543 – 1.9092 – 1.8121
Resistances: 2.1731 – 2.2729 – 2.3512

SOL/USDT
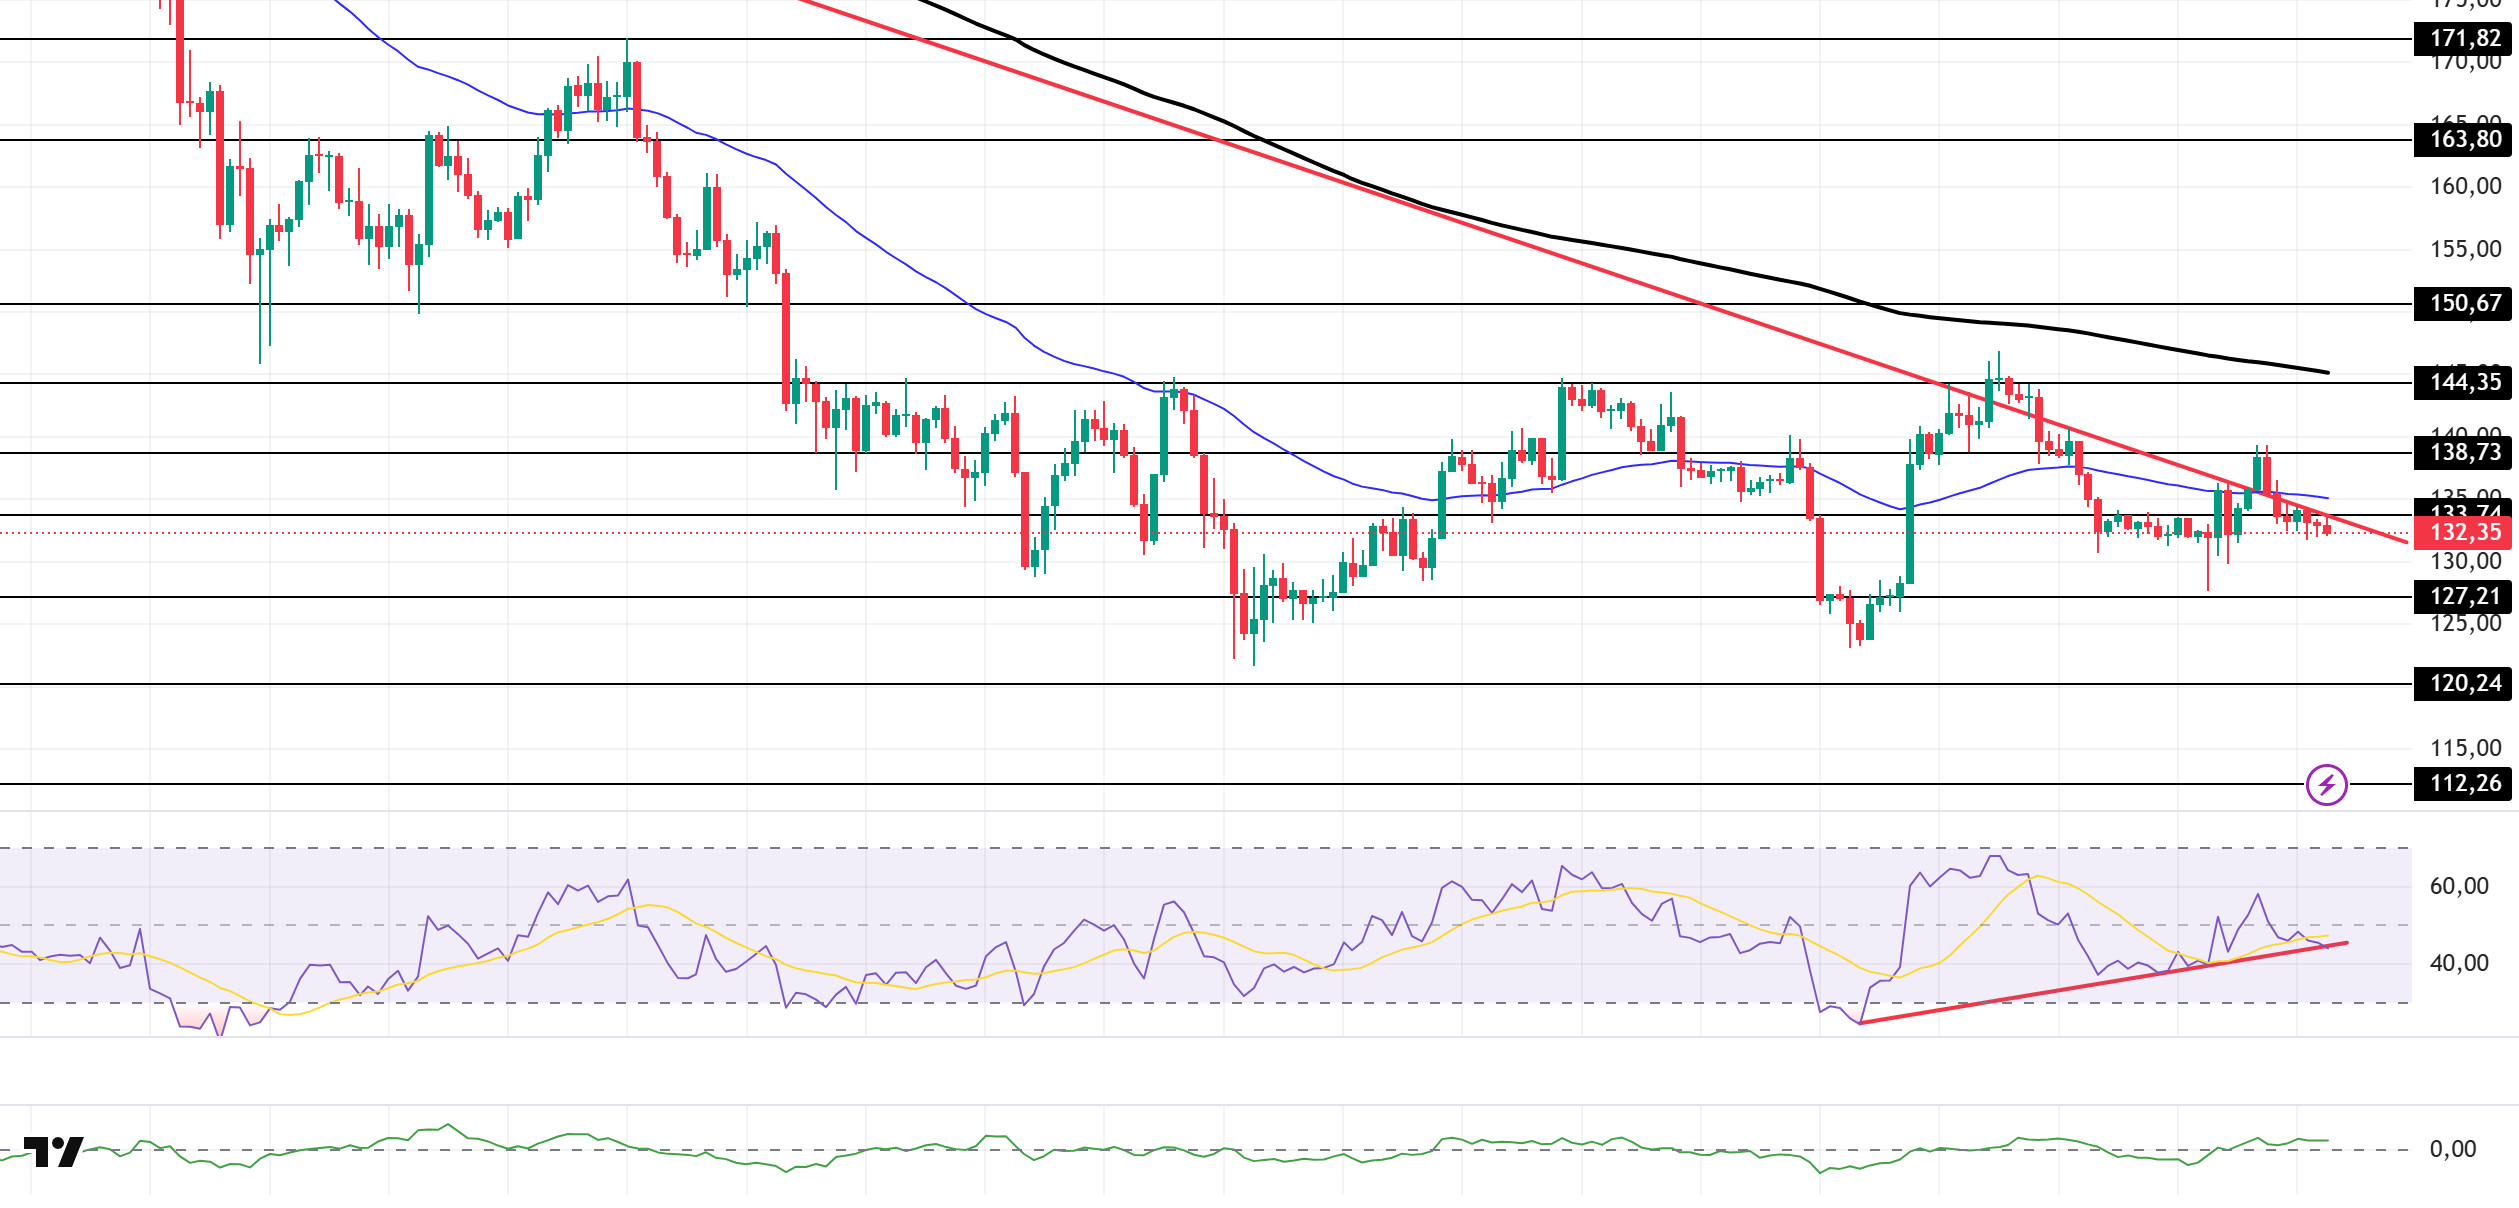
The SOL price traded sideways during the day. The asset remained in the lower region of the downtrend that began on October 6. After pulling back from the strong resistance level of $138.73, the asset broke below the downtrend and the 50 EMA (Blue Line) moving average. Currently trading below the $133.74 level, the price could test the 200 EMA (Black Line) moving average if rallies begin. If the pullback continues, the $127.21 level could be triggered.
On the 4-hour chart, it remained below the 50 EMA (Exponential Moving Average – Blue Line) and 200 EMA (Black Line). This indicates a possible downtrend in the medium term. At the same time, the price being below both moving averages signals a downward trend for the asset in the short term. The Chaikin Money Flow (CMF-20) remained at a positive level. However, balanced cash inflows and outflows may keep the CMF in positive territory. The Relative Strength Index (RSI-14) remained in the middle of the negative zone. At the same time, it is currently testing the upward trend that began on December 1 as support. A downward break could increase selling pressure. In the event of an uptrend due to macroeconomic data or positive news related to the Solana ecosystem, the $150.67 level stands out as a strong resistance point. If this level is broken upward, the uptrend is expected to continue. In case of pullbacks due to developments in the opposite direction or profit-taking, the $120.24 level may be tested. A decline to these support levels could increase buying momentum, presenting a potential upside opportunity.
Supports: 127.21 – 120.24 – 112.26
Resistances: 133.74 – 138.73 – 144.35
DOGE/USDT
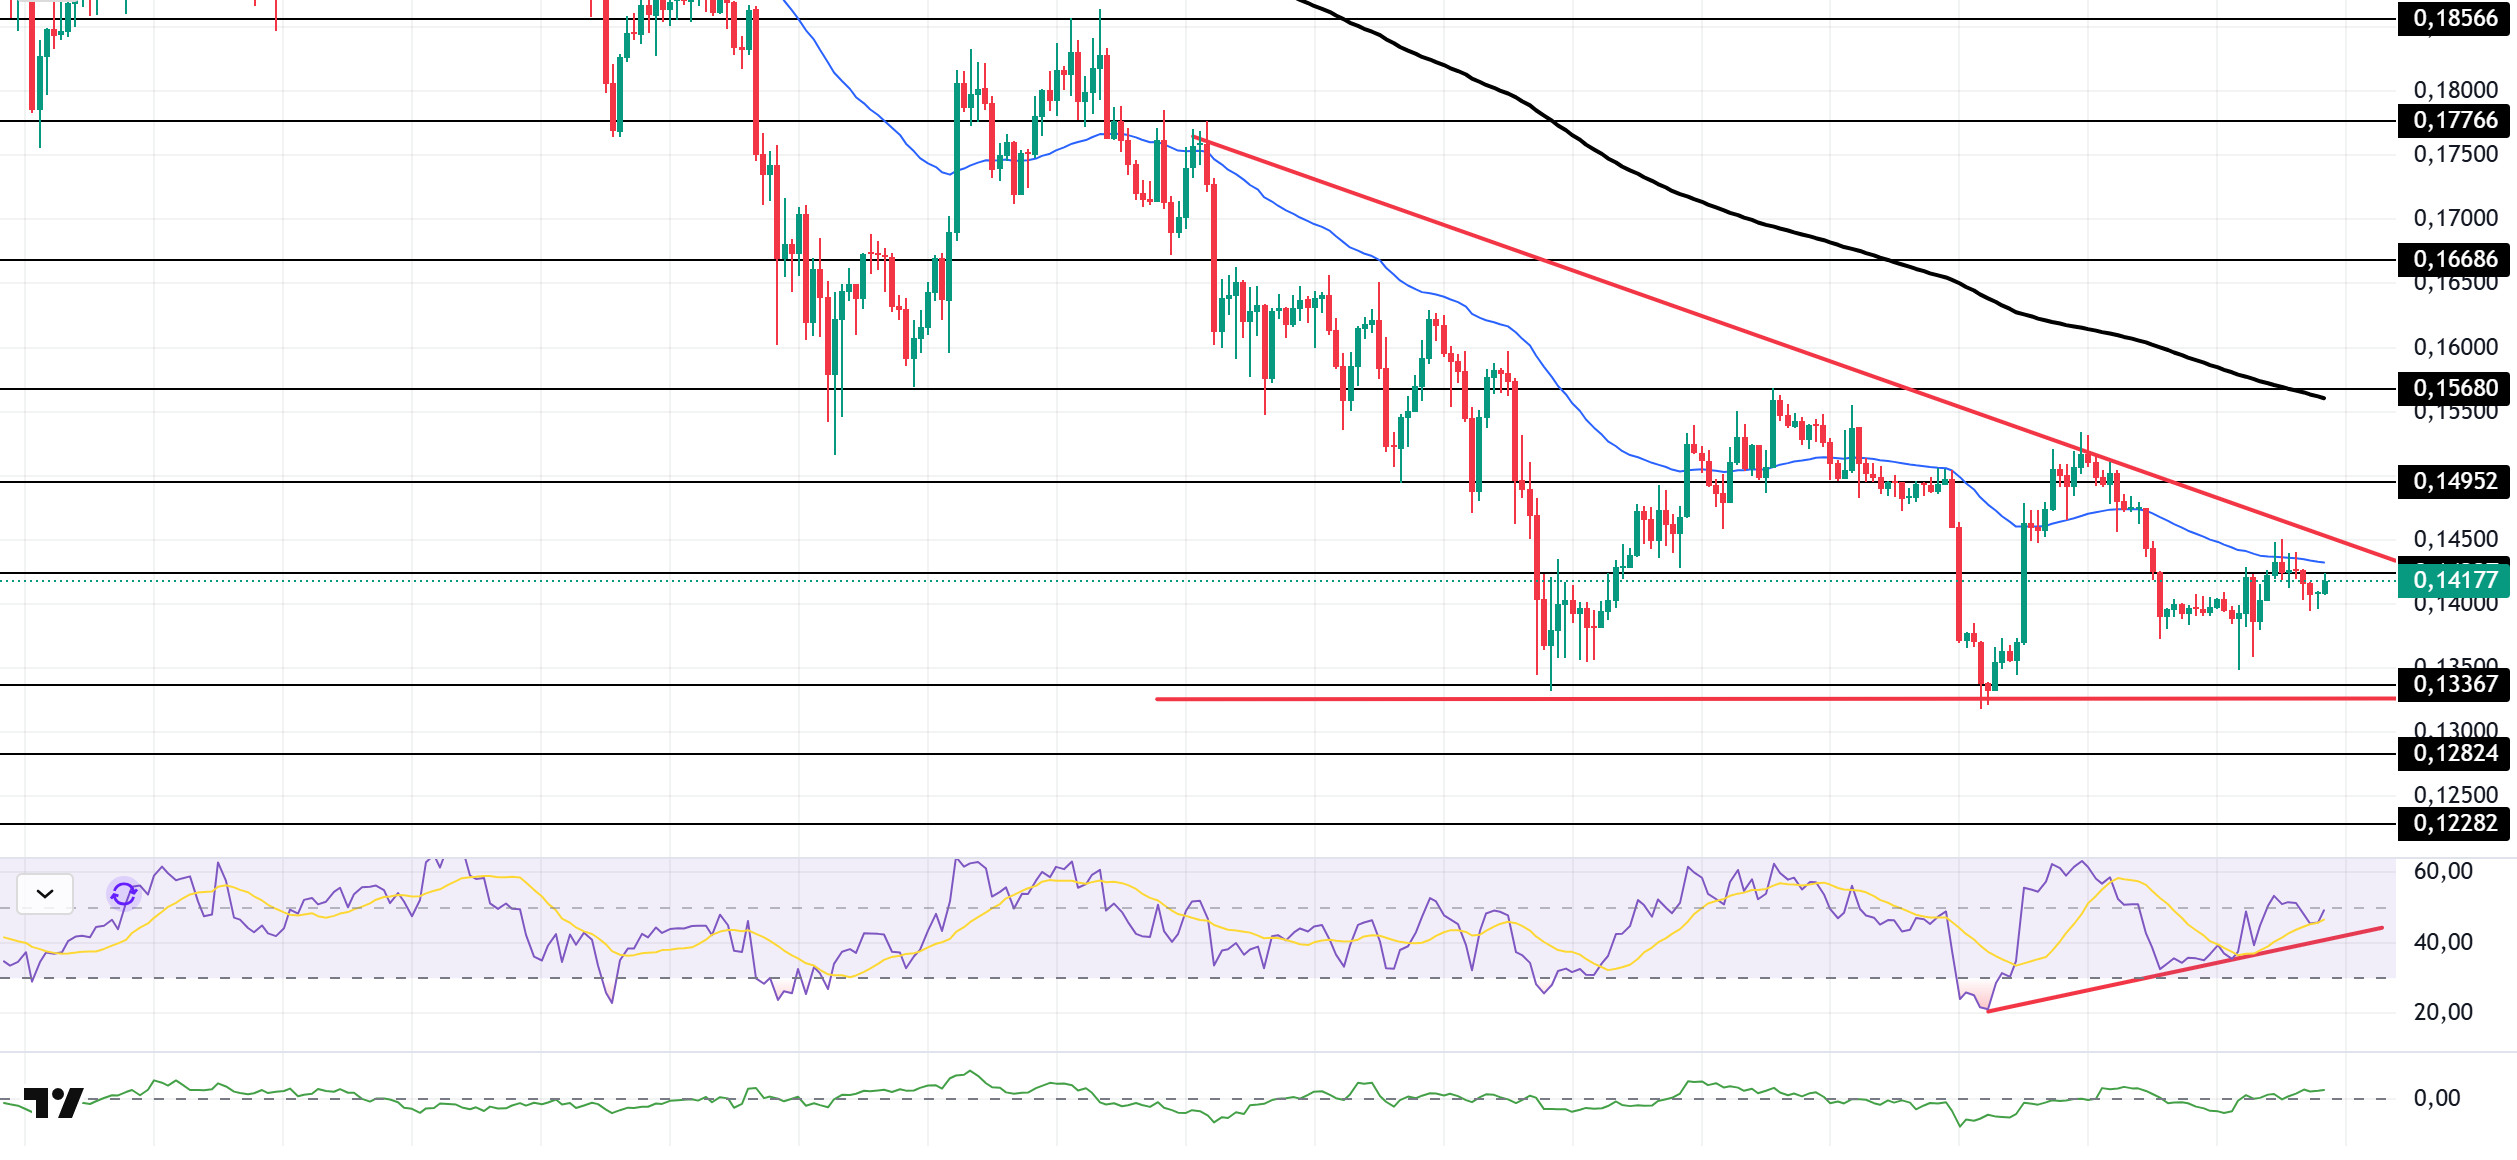
The DOGE price remained flat during the day. The asset continued to be within the descending triangle formation that began on November 13. The price tested the 50 EMA (Blue Line) moving average as resistance but failed to break through, resulting in a pullback. Currently testing the $0.14237 level as resistance, the price may test the base level of the descending triangle pattern if it experiences a pullback from here. If an uptrend begins, the ceiling level of the descending triangle pattern should be monitored.
On the 4-hour chart, the 50 EMA (Exponential Moving Average – Blue Line) remained below the 200 EMA (Black Line). This indicates that the downtrend may continue in the medium term. The price being below both moving averages indicates that the downward trend is likely to continue in the short term. The Chaikin Money Flow (CMF-20) remained in positive territory. Additionally, the balance of money inflows and outflows may keep the CMF in positive territory. The Relative Strength Index (RSI-14) rose from the middle of negative territory to neutral territory. It also remained in the upper region of the upward trend that began on December 1 and indicated that a shift to the lower region of the upward trend could lead to selling pressure. In the event of potential increases driven by political developments, macroeconomic data, or positive news flow within the DOGE ecosystem, the $0.15680 level stands out as a strong resistance zone. Conversely, in the event of negative news flow, the $0.13367 level could be triggered. A decline to these levels could increase momentum and potentially initiate a new wave of upward movement.
Supports: 0.13367 – 0.12824 – 0.12282
Resistances: 0.14237 – 0.14952 – 0.15680
AVAX/USDT
AVAX started the new day at $13.64 and is currently trading within a horizontal band at the opening level. For the past two days, AVAX has been stuck between EMA20 and EMA50 due to the weak momentum seen in the cryptocurrency market and is struggling to find direction. The lack of strong news flow or price-driving developments on the AVAX side makes the technical outlook more decisive, while selling pressure at resistance levels keeps gains limited. The failure to break above the EMA50 again during the upward attempt indicates that AVAX is struggling to gain strength in the short term.
On the 4-hour chart, the Moving Average Convergence/Divergence (MACD) line remains above the signal line, showing a horizontal direction. The MACD being in negative territory indicates that the upward momentum has not yet strengthened. However, its proximity to the positive zone keeps the possibility of a potential trend reversal in the short term alive. On the other hand, the MACD line moving horizontally very close to the signal line increases the likelihood of a sharp pullback in the event of a possible downward breakout. AVAX is still stuck between the EMA20 and EMA50 levels in terms of price, and breaking out of this band could play a critical role in determining the direction.
From a technical perspective, the EMA50 and subsequently the EMA100 and the $14.21 resistance level remain the first significant resistance zone in AVAX’s rise. If these levels are broken with high volume, AVAX could strengthen the possibility of a short-term trend reversal and test the EMA200, $15.10, and $15.75 levels as the rise continues. Conversely, in a bearish scenario, the first critical support levels are at EMA20 and $13.50. If AVAX closes below these levels, selling pressure could increase, and if the decline gains momentum, it could retreat towards the $12.57 and $11.88 levels. In the overall picture, the MACD still trading in negative territory and AVAX continuing to trade below the EMA50 and EMA100 levels indicate that momentum remains weak and AVAX is under pressure in the short term. Therefore, unless there are sustained closes above the resistance levels, upward attempts are likely to be limited.
(EMA20: Red Line, EMA50: Green Line, EMA100: Blue Line, EMA200: Purple Line)
Supports: 13.50 – 12.57 – 11.88
Resistances: 14.21 – 15.10 – 15.75

LINK/USDT
In yesterday’s analysis, we emphasized that the double bottom formation at the 11.70 level was an important turning point for the trend. The strong reaction from this area was the key factor that enabled the price to turn positive in structural terms. On the current chart, we see that this positive trend is trying to stabilize within the support band between 13.56 and 13.88. Although the price reached the 14.48 level in its recent upward moves, the market is currently experiencing more horizontal compression and indecision as it has failed to maintain stability above this region.
In the current outlook, LINK continuing to trade above 13.56 is critically important for maintaining the short-term positive structure. This level is both a confirmation point for the previous breakout and a strong support area where liquidity is concentrated, making it a strategic boundary for bulls to maintain their dominance. If the price retests 14.48 and closes above this level, the 15.40-15.71 range, which we previously indicated as a target, will once again become a technical target. It is worth remembering that this region has historically been an area of supply where sharp sell-offs have occurred. Therefore, it would be normal for movements towards these levels to encounter some profit-taking.
The first defense zone on the downside is the $13 band. A break below this line could take the price first to the $12.91 support and then to the $11.70 region, which is the base level of the double bottom formation. As previously stated, pricing below 11.70 could eliminate the current positive structure and push the medium-term trend back into negative territory.
Although we see a short-term weakening in the Relative Strength Index (RSI), the current consolidation and positive technical structure make the possibility of an upward breakout much stronger. Closings above 14.48 ( ) could strengthen the trend again and initiate new momentum towards our target zone.
Supports: 13.56 – 12.91 – 11.73
Resistances: 14.48 – 15.40 – 15.71

Legal Notice
The investment information, comments, and recommendations contained herein do not constitute investment advice. Investment advisory services are provided individually by authorized institutions taking into account the risk and return preferences of individuals. The comments and recommendations contained herein are of a general nature. These recommendations may not be suitable for your financial situation and risk and return preferences. Therefore, making an investment decision based solely on the information contained herein may not produce results in line with your expectations.

