
Technical Analysis
BTC/USDT
While US job openings data for September and October met expectations, the update to the employment and inflation calendar took center stage in the markets. As Trump’s statements on economic and leadership performance continue alongside the final evaluation process for Fed chair candidates, Powell’s cautious messages and Hassett’s balanced approach are shaping expectations regarding monetary policy. CME data indicates a high probability of a 25-basis-point cut by the Fed today, while markets are closely monitoring FOMC decisions, Fed projections, and developments regarding the selection of the new Fed chair.
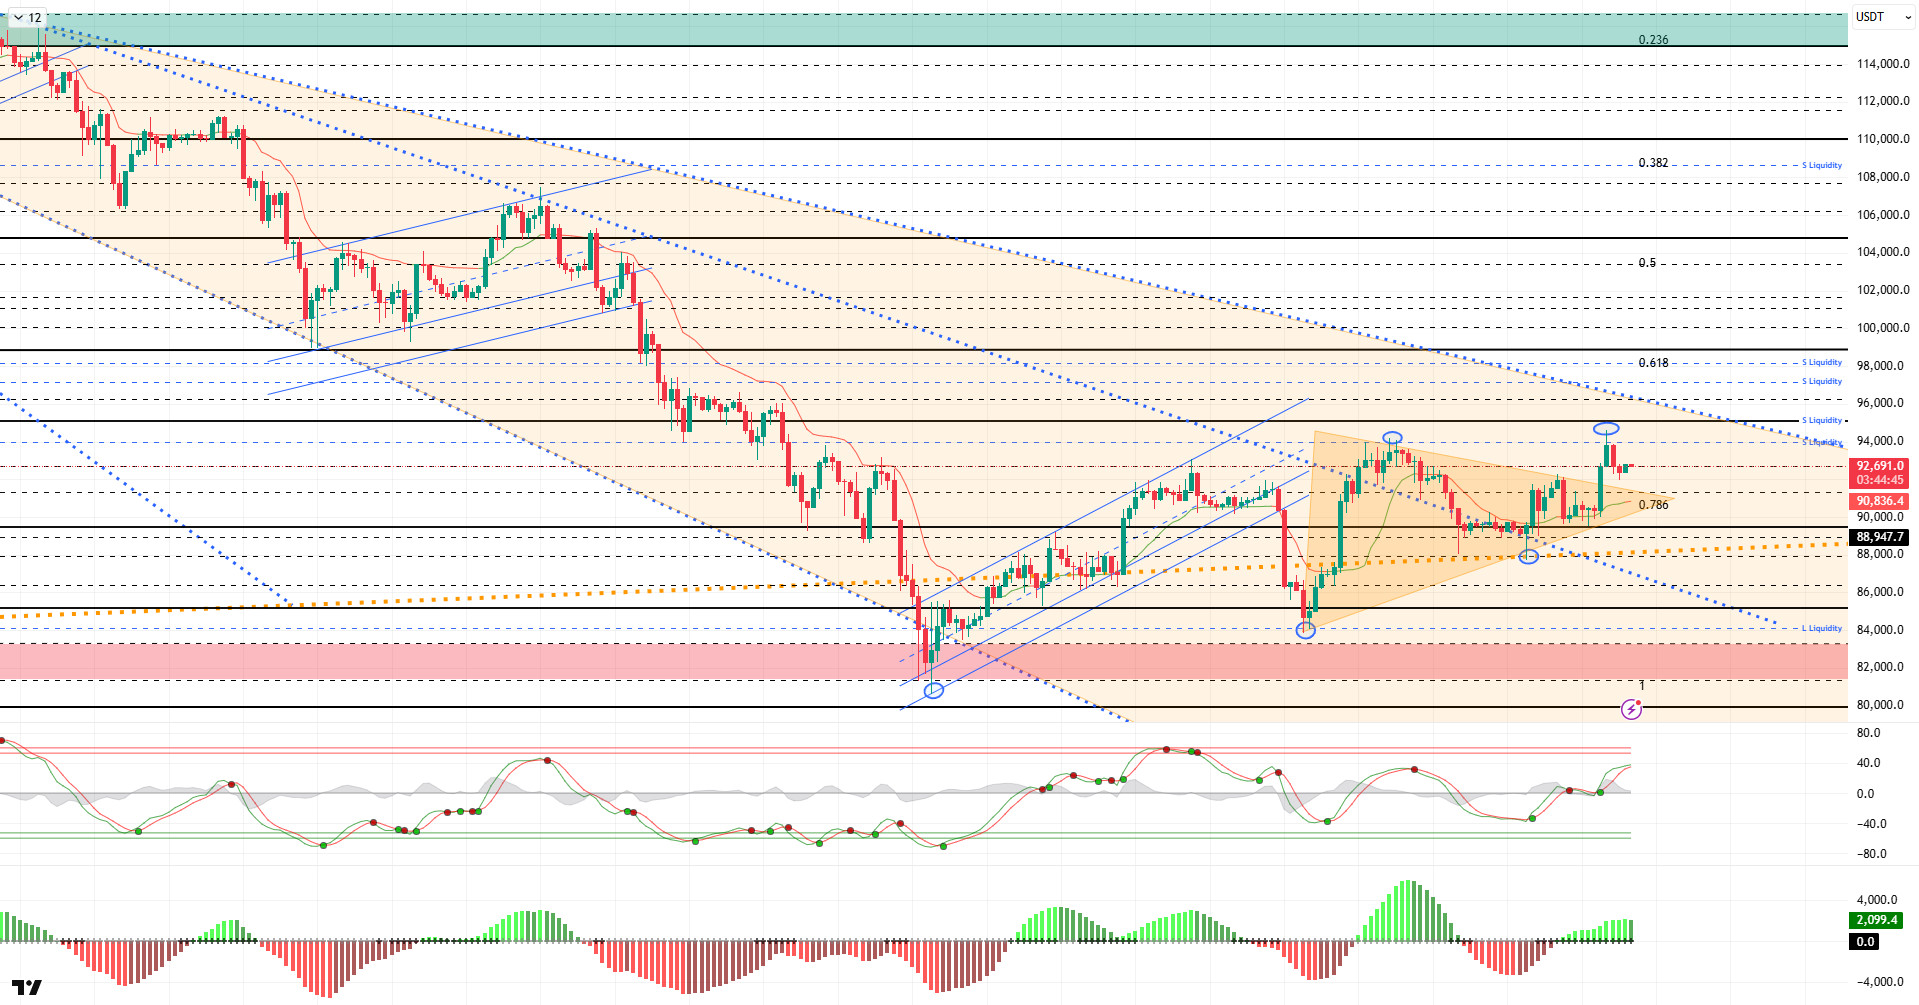
From a technical perspective, the price structure that produced higher lows and lower highs in the previous analysis indicated a clear symmetrical triangle squeeze in BTC. Breaking this squeeze with an upward and voluminous candle, BTC quickly tested the 94,500 level. With this movement, the price formed a higher peak, creating a new upward channel within the orange band. At the time of writing, the price has retreated somewhat and continues to trade around the 92,700 level.
Technical indicators show the Wave Trend (WT) oscillator giving a weakening buy signal just above the channel’s middle band, while the histogram on the Squeeze Momentum (SM) indicator is back in positive territory. The Kaufman Moving Average (KAMA) is currently just below the price at the $90,800 level.
According to liquidation data, with the recent rise, sales-oriented transactions resulted in liquidation at the short-term level of 92,000 – 94,500. In the monthly view, it continues to maintain its intensity within the 97,000 – 98,000 band. Short-term transactions formed fragmented intensity within the 89,000 – 90,000 band.
In summary, while Trump’s statements regarding the next Fed chair remain on the agenda, the markets’ main focus has shifted to today’s Fed interest rate decision. Powell’s signals regarding monetary expansion and forward-looking messages on the interest rate path will be decisive for market direction. On the technical side, BTC, which retreated to the 80,500 level following the downtrend that began after its ATH, rebounded strongly from this region. Subsequently, BTC settled above the 90,000 level and broke the symmetrical triangle consolidation pattern formed there, turning the structure into an upward channel with this breakout.
Liquidity data shows that target areas are regaining importance and the market is stabilizing, while the intensity of the selling pressure is increasing. After this stage, 90,000 has once again become a critical point for the price to maintain its momentum. Closings and pricing above this level are an important indicator for regaining momentum. In this context, 95,000 stands out as the next target area, and once it is passed, liquidity areas will be monitored again. In the event of possible selling pressure, 90,000 stands out again as the reference area, and in the event of a breakout, the 87,500 level, which is the point where the major uptrend passed, will be monitored.
Supports: 91,400 – 90,000 – 89,000
Resistances: 92,600 – 94,000 – 95,000
ETH/USDT
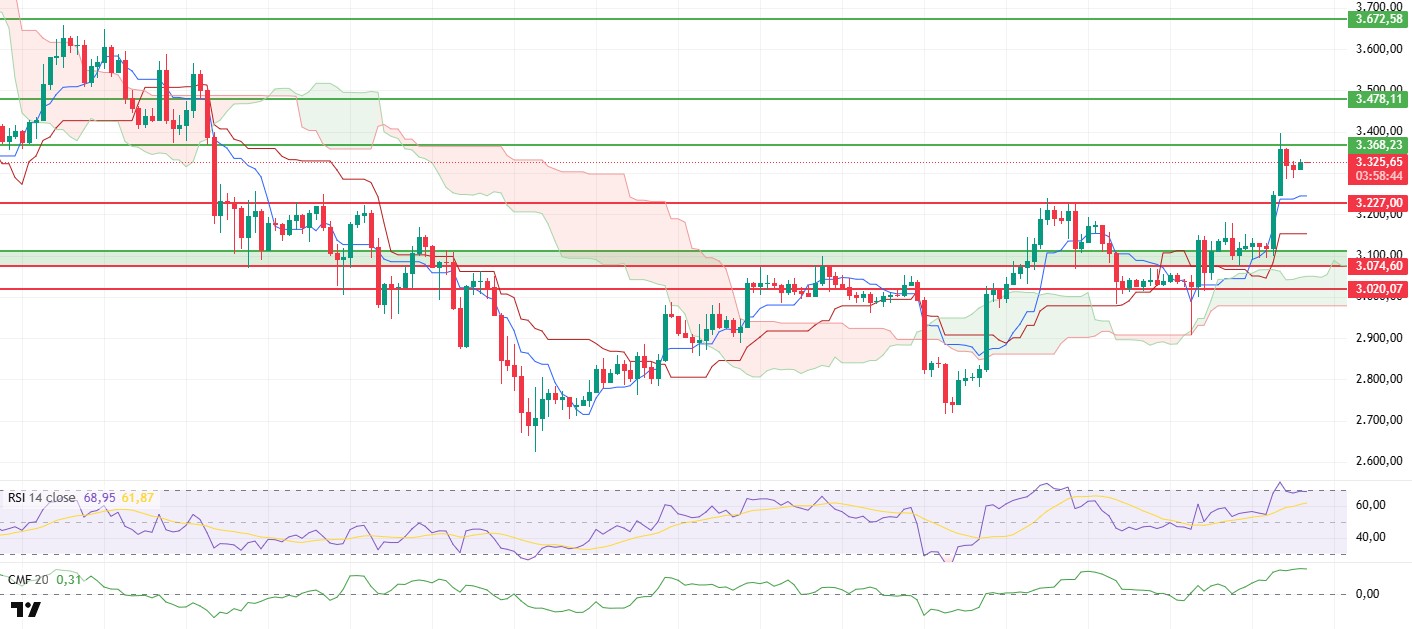
Ethereum continued its expected upward movement yesterday evening, breaking strongly above the $3,227 resistance level and advancing to $3,397. Following light selling from this region, the price is stabilizing around $3,320. Despite profit-taking, the price remains high, indicating that buyers are still in control.
The predicted funding rate remaining in negative territory indicates that more short positions are being opened in the short term. This structure provides a foundation that supports upward price tests rather than hindering the rise. At the same time, the Chaikin Money Flow (CMF) indicator continuing its upward movement in positive territory indicates strong spot demand and continued capital inflows into the market. This improvement in liquidity increases the likelihood of the price maintaining its position in the resistance zone.
The momentum view also supports the bullish scenario. Although the Relative Strength Index (RSI) pulled back slightly after climbing into overbought territory, it generally maintains its positive trend. This view indicates that the trend is still gaining strength, while acknowledging the risk of a correction in the short term.
The strong picture on the Ichimoku side remains unchanged. The price is above the cloud, and the Tenkan and Kijun lines continue to be positioned below the price. Technically, the uptrend is clearly continuing, and there are no signs of weakness yet.
The current structure for Ethereum allows for upward expectations to continue. As long as the $3,227 level remains supported, it seems likely that the price will continue its upward momentum. In particular, if the $3,368 resistance level is broken, stronger momentum towards the $3,478 level could come into play. Conversely, if the price falls below $3,227, short-term pressure will increase and the price may head for a correction in search of room to expand. For now, buyers have the upper hand, and as long as the price maintains its upward path, the trend looks set to remain positive.
Below the Form
Supports: 3,227 – 3,074 – 3,020
Resistances: 3,368 – 3,478 – 3,672
XRP/USDT
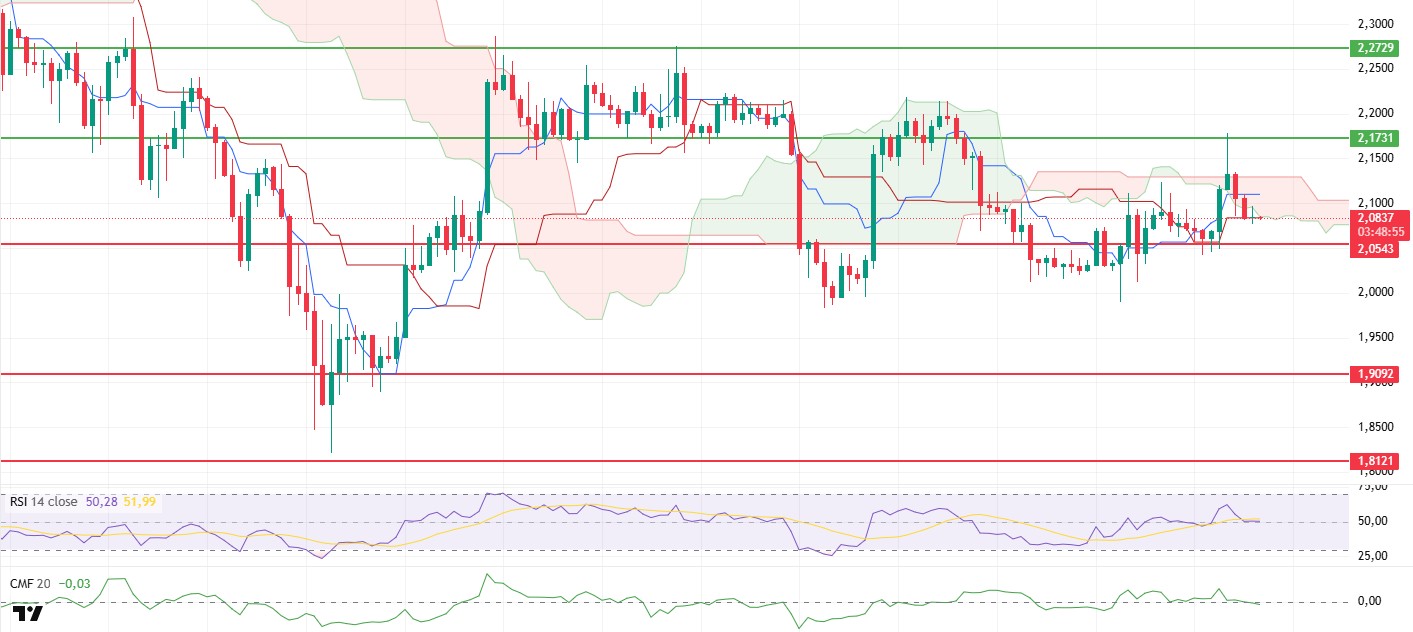
The XRP price rose to the $2.17 resistance level yesterday evening with a strong wave of buyers, but it failed to hold in this region and fell back below the cloud to the $2.08 level. This pullback indicates that the upward movement is still being pressured at resistance levels and that a trend reversal has not been confirmed.
The Chaikin Money Flow (CMF) indicator has moved back into negative territory, reflecting weakening buyer interest. The decrease in liquidity inflows and increase in outflows indicate that short-term price movements carry downside risk.
The Relative Strength Index (RSI) indicator is attempting to hold at the 50 level, but the weakening momentum is noteworthy. If the RSI fails to show a strong rebound from this level, upward attempts may remain limited.
The technical chart in the Ichimoku indicator is under pressure. Although the price has broken through the kumo cloud, its inability to sustain this breakout is the clearest sign that the trend has not fully turned positive. Despite efforts to hold just above the Kijun level, seller pressure continues to be evident.
XRP’s current position indicates a precarious equilibrium. If the $2.05 level holds, the possibility of a short-term recovery may remain viable. However, should this support be lost, selling pressure could accelerate, potentially causing the price to ease toward the lower band at $1.98. For an upward scenario to gain traction, both a renewed positive trend in the CMF and a strong volume break above the $2.17 level are required. Until this occurs, rebound rallies are likely to remain suppressed.
Supports: 2.0543 – 1.9092 – 1.8121
Resistances: 2.1731 – 2.2729 – 2.3512
SOL/USDT
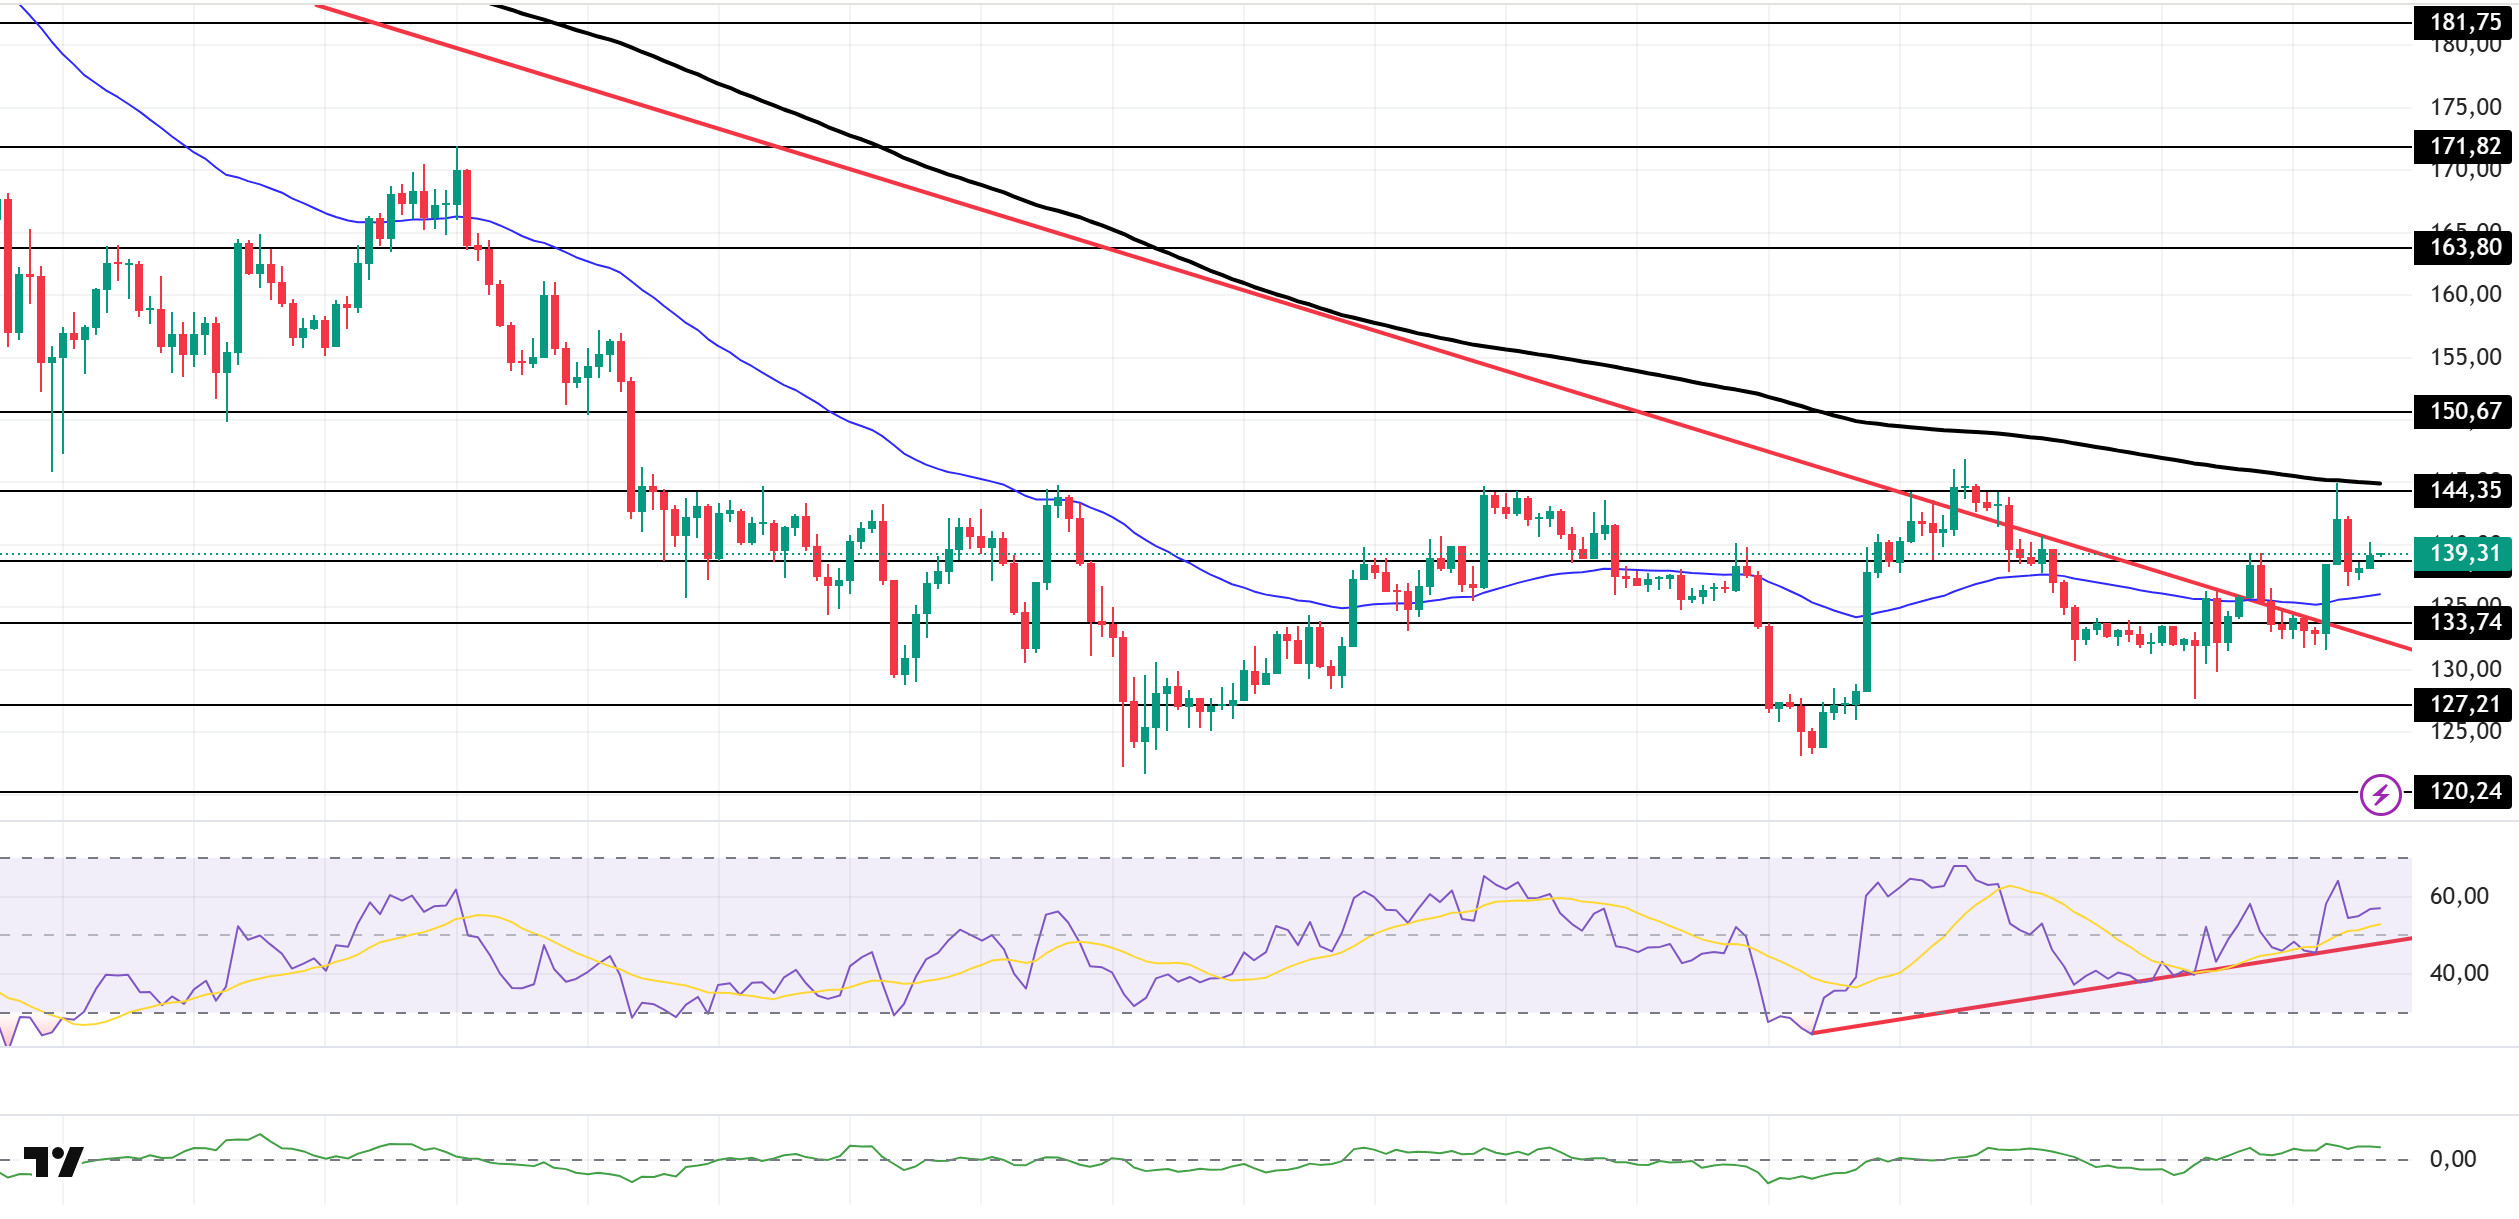
The SOL price continued to gain value. The asset moved into the upper region of the downtrend that began on October 6. Breaking the downtrend and the 50 EMA (Blue Line) moving average with a strong bullish candle, the asset tested the 200 EMA (Black Line) moving average as resistance and experienced a slight pullback. Currently trading above the $138.73 level, the price could retest the 200 EMA moving average if the uptrend continues. If a pullback begins, the 50 EMA moving average could act as support.
On the 4-hour chart, it remained below the 50 EMA (Exponential Moving Average – Blue Line) and 200 EMA (Black Line). This indicates a possible downtrend in the medium term. At the same time, the price being between the two moving averages indicates that the asset is in a decision phase in the short term. The Chaikin Money Flow (CMF-20) remained at a positive level. However, balanced cash inflows and outflows may keep the CMF in positive territory. The Relative Strength Index (RSI-14) is in the middle of the positive zone. It also remained above the upward trend that began on December 1. This indicates that buying pressure continues. In the event of an uptrend driven by macroeconomic data or positive news related to the Solana ecosystem, the $150.67 level stands out as a strong resistance point. If this level is broken upwards, the uptrend is expected to continue. In the event of pullbacks due to developments in the opposite direction or profit-taking, the $120.24 level could be tested. A decline to these support levels could increase buying momentum, presenting a potential opportunity for an upward move.
Supports: 138.73 – 133.74 – 127.21
Resistances: 144.35 – 150.67 – 163.80
DOGE/USDT
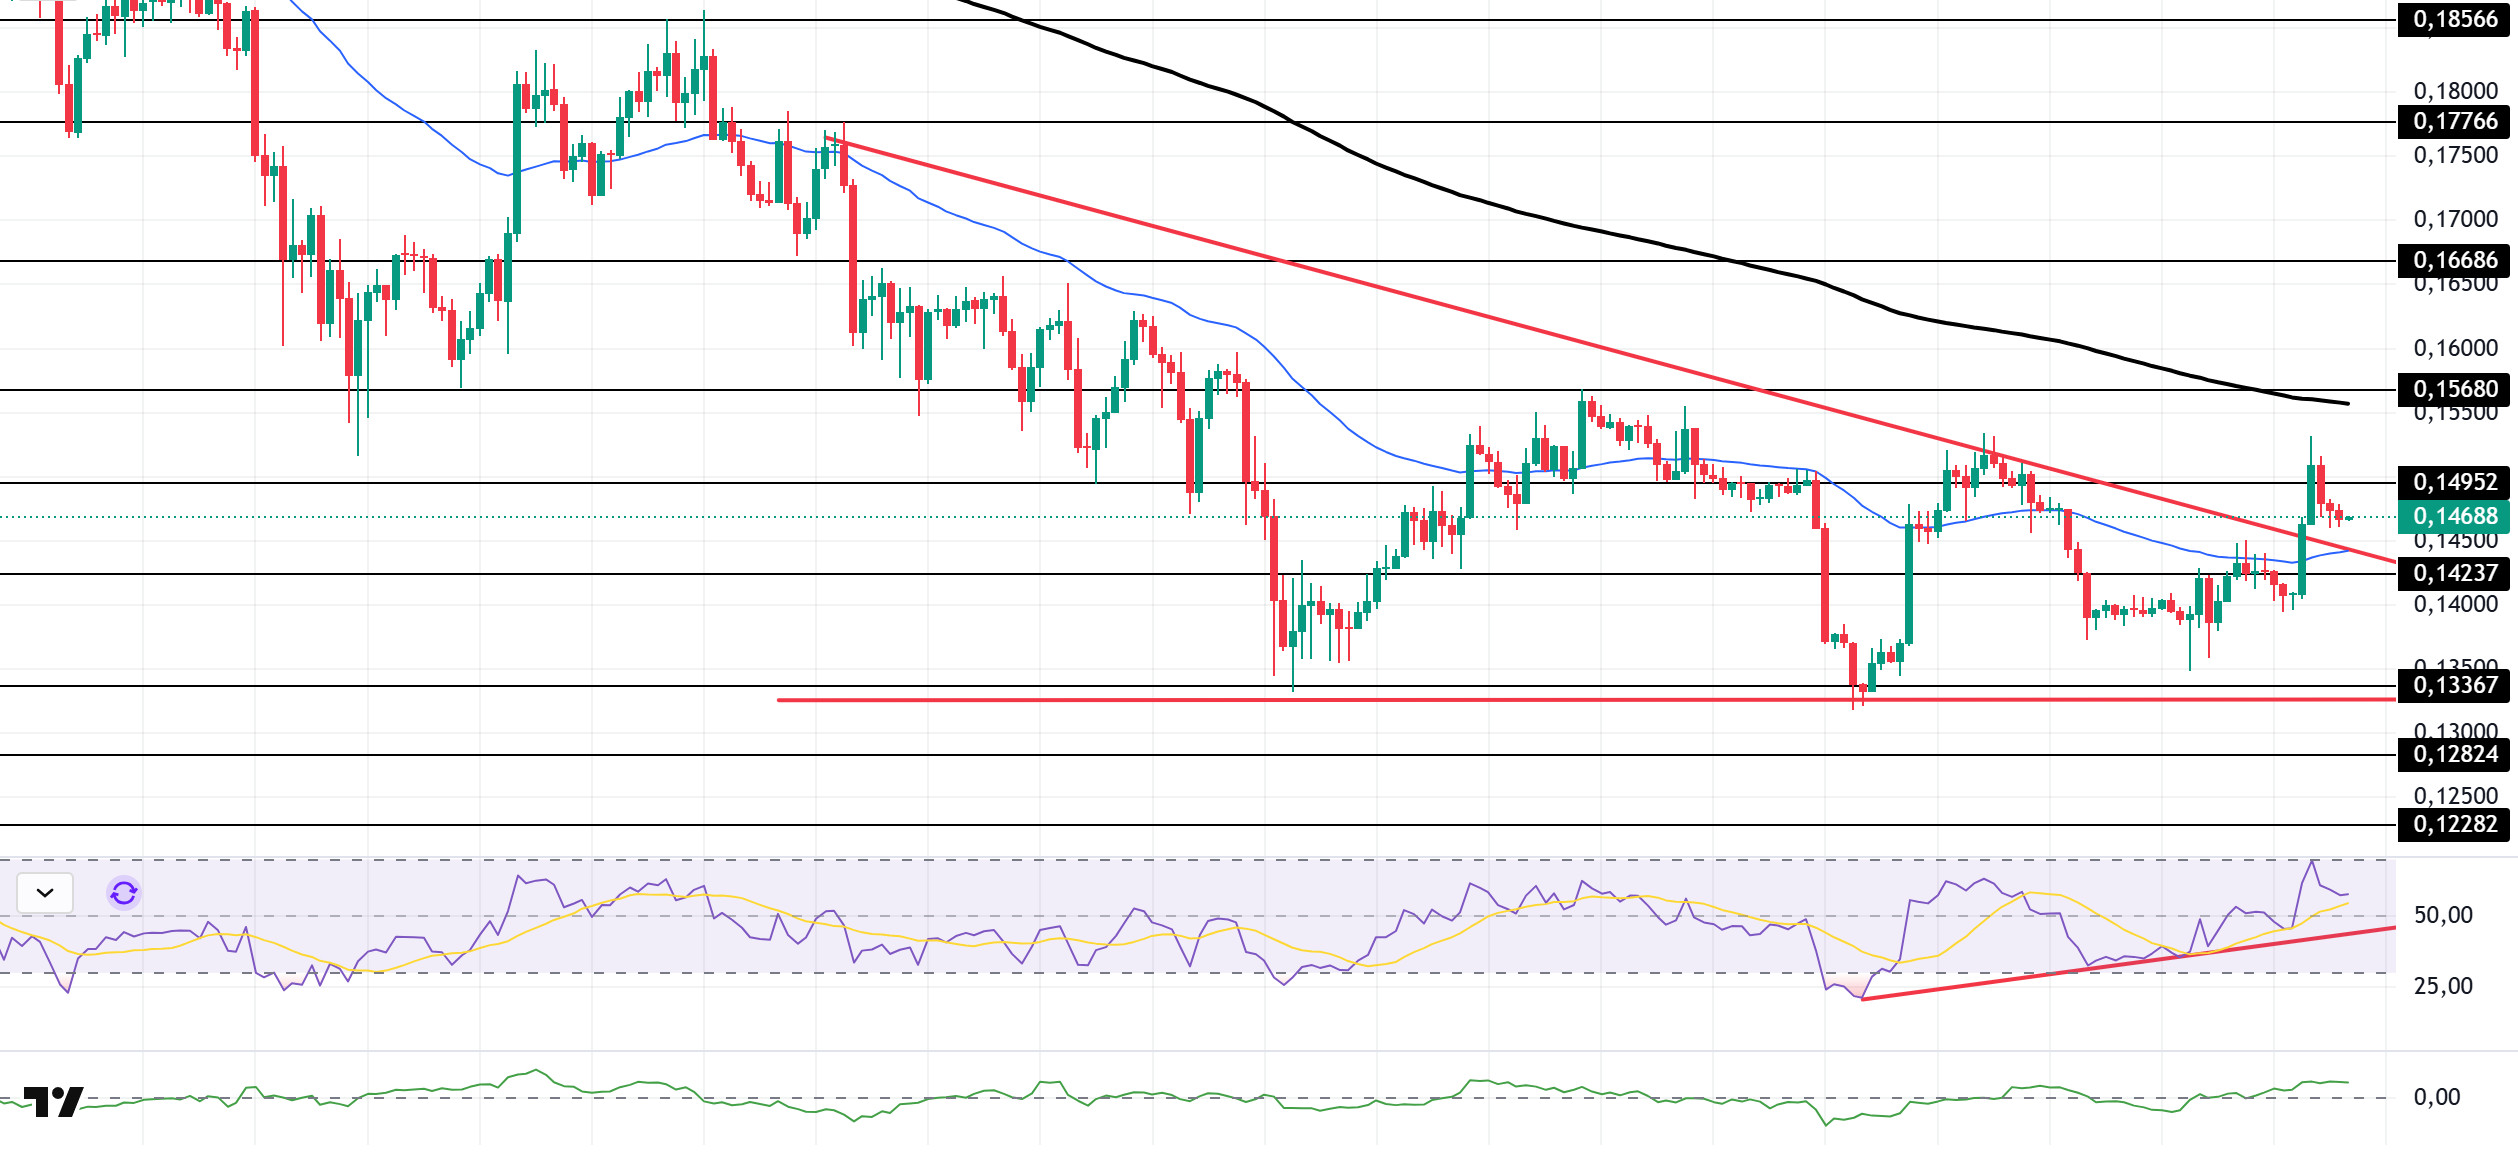
DOGE experienced an upward price movement. The asset broke through the ceiling level of the descending triangle formation that began on November 13 and the 50 EMA (Blue Line) moving average with a strong candle and managed to hold here. Currently preparing to test the ceiling level of the descending triangle formation and the 50 EMA moving average as support, the asset could test the $0.14237 level as support if it breaks below this point. If it gains momentum from the support level and experiences an uptrend, it could test the 200 EMA (Black Line) moving average as resistance.
On the 4-hour chart, the 50 EMA (Exponential Moving Average – Blue Line) remained below the 200 EMA (Black Line). This indicates that the downtrend may continue in the medium term. The price being between the two moving averages shows that the price is in a decision phase in the short term. The Chaikin Money Flow (CMF-20) remained in positive territory. Additionally, the balance of money inflows and outflows may keep the CMF in positive territory. The Relative Strength Index (RSI-14) retreated from the overbought level to the middle of the positive zone. At the same time, it remained in the upper region of the upward trend that began on December 1. In the event of an uptrend driven by political developments, macroeconomic data, or positive news flow in the DOGE ecosystem, the $0.15680 level stands out as a strong resistance zone. Conversely, in the event of negative news flow, the $0.13367 level could be triggered. A decline to these levels could increase momentum and initiate a new wave of growth.
Supports: $0.14237 – $0.13367 – $0.12824
Resistances: 0.14952 – 0.15680 – 0.16686
AVAX/USDT
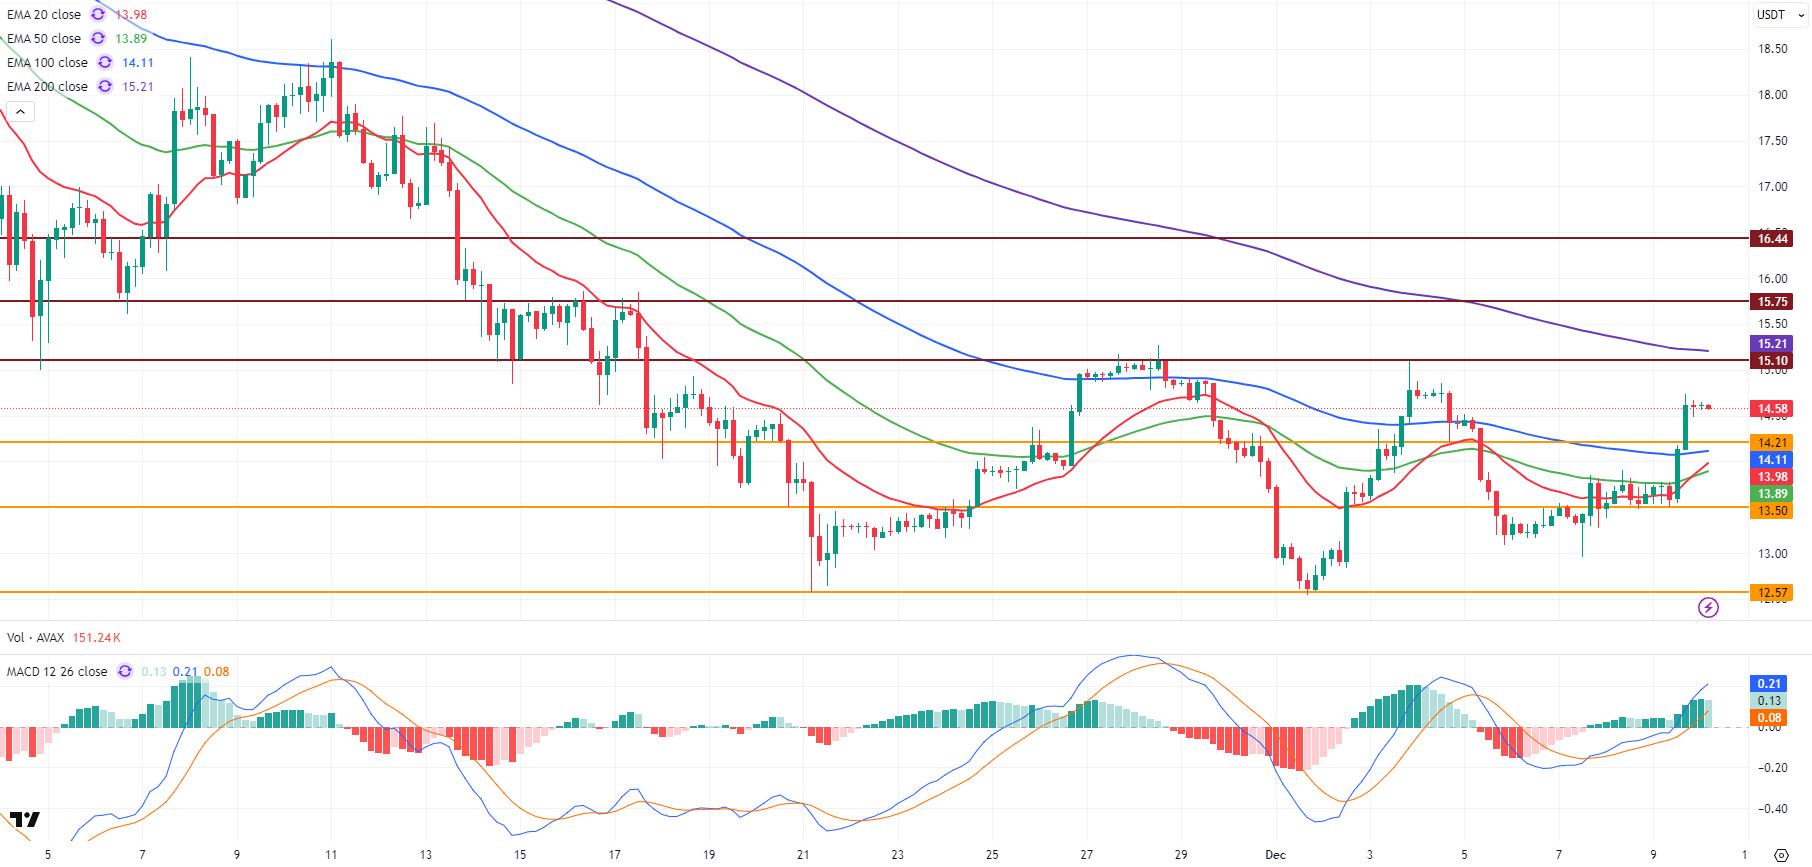
AVAX started the day yesterday with a flat appearance at the $13.64 level, then moved upward in the second half of the day with strengthening buying pressure. AVAX closed yesterday at $14.60, showing an approximate 7% increase in value. AVAX, which traded sideways between the 20-period Exponential Moving Average (EMA20) and 50-period Exponential Moving Average (EMA50) levels in the first part of the day, gained momentum in the second part, breaking through the EMA50 and then the EMA100 levels, rising above the critical $14.21 resistance. The positive sentiment seen in the cryptocurrency market in the second half of the day contributed to this rise. Starting the new day at $14.60, AVAX is currently trading in a flat range compared to its opening price.
On the 4-hour chart, the Moving Average Convergence/Divergence (MACD) line continues to trade above the signal line and is pointing upwards. With yesterday’s sharp rise, the MACD line moved into positive territory and is giving a positive signal in the short term. This movement confirmed that AVAX’s short-term momentum has strengthened. Yesterday, in the second half of the day, AVAX rose above critical Exponential Moving Average (EMA) levels, and the outlook is also positive on the EMA side. AVAX continues to trade above the EMA20, EMA50, and EMA100 levels and is only below the EMA200.
From a technical perspective, the $15.10 and EMA200 levels stand out as the first strong resistance zone in AVAX’s rise. Breaking these levels could accelerate the upward momentum and pave the way for AVAX to rise towards the $15.75 and $16.44 levels, respectively. In a downside scenario, the first critical support is at the $14.21 level, and if this level is lost, the EMA100 and EMA50 supports could be retested. Closings below the EMA levels could gain downward momentum, and AVAX could retreat to the $13.50 and $12.57 supports. Overall, the MACD moving into positive territory and AVAX trading above the EMA50 and EMA100 levels support the short-term bullish scenario. However, the EMA200 level remains a critical resistance, and as long as this area is not breached, the possibility of gains being limited by resistance persists. For momentum to strengthen permanently, both an increase in volume and closes above the EMA200 are critical.
(EMA20: Red Line, EMA50: Green Line, EMA100: Blue Line, EMA200: Purple Line)
Supports: 14.21 – 13.50 – 12.57
Resistances: 15.10 – 15.75 – 16.44
LINK/USDT
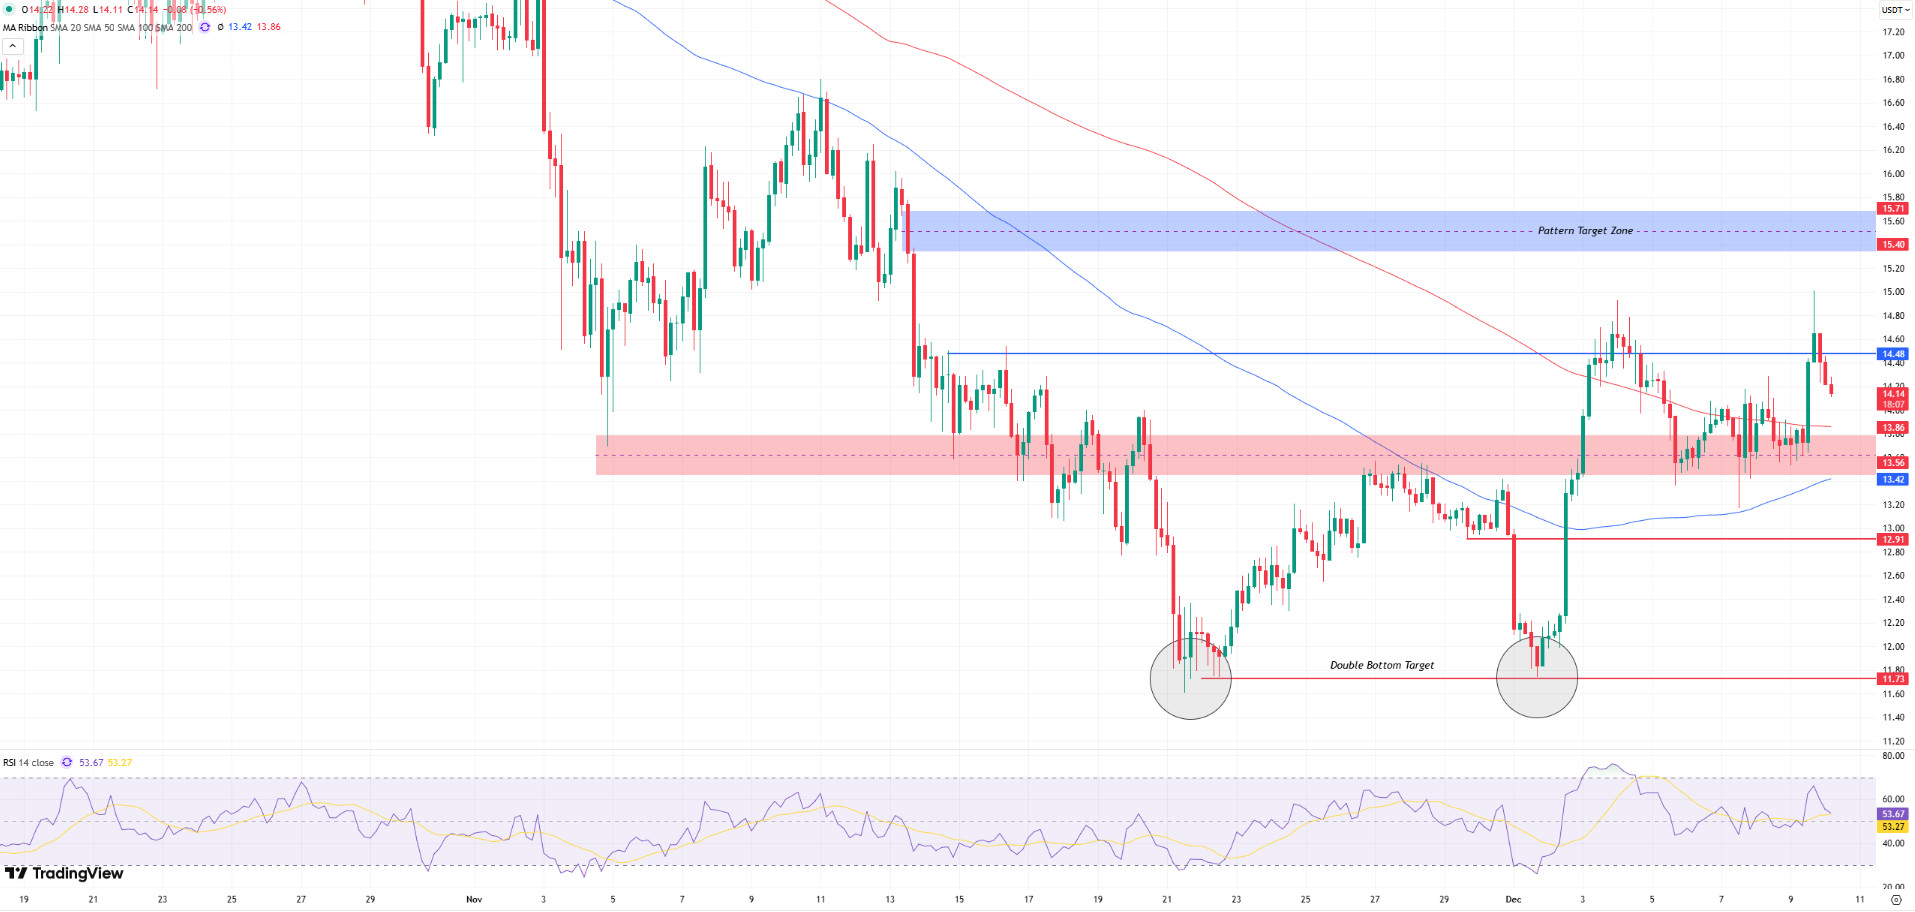
We can say that the approximately 10% increase experienced yesterday triggered a sharp upward movement, especially in the lower time frames. As the price gradually breaks free from the downward trend, the reaction movements following the breakout are now producing higher lows, supporting the positive technical structure. In this process, buyers maintaining a stable position above the $13 band keeps positive expectations strong.
The 14.48 level in the upper region remains the main resistance level that must be overcome for the short-term trend to gain momentum. Although the price tested this line, its inability to remain above it indicates that the decision phase in the market is not yet complete. However, the 20- and 50-day moving averages are positioned below the price and have begun to intersect in a supportive manner, which is an important factor strengthening the positive structure from a technical perspective. Daily closes above 14.48 have the potential to push the price back to the target range of 15.40–15.71.
The first defense zone in downward price movements is 13.86. Below this level, the 13.42 support line forms a critical threshold for the positive trend structure not to break down. Closes below these two regions could force the price to retreat first to the 12.91 level and then to 11.70, the base level of the double bottom formation. Price movements below 11.70, in particular, could completely eliminate the current structure and push the medium-term trend back into negative territory.
On the Relative Strength Index (RSI) side, the sharp rise experienced yesterday kept it in positive territory rather than entering the overbought zone, which is quite positive for the price. Closings above 14.48 could allow the trend to regain strength and initiate new momentum towards our target zone.
Supports: 13.56 – 12.91 – 11.73
Resistances: 14.48 – 15.40 – 15.71
Legal Notice
The investment information, comments, and recommendations contained herein do not constitute investment advice. Investment advisory services are provided individually by authorized institutions taking into account the risk and return preferences of individuals. The comments and recommendations contained herein are of a general nature. These recommendations may not be suitable for your financial situation and risk and return preferences. Therefore, making an investment decision based solely on the information contained herein may not produce results in line with your expectations.

