
Technical Analysis
BTC/USDT
Initial jobless claims released after the FOMC meeting came in above expectations, indicating that employment remains resilient overall. On the other hand, assessments following the Fed’s rate cut reveal that some government officials are anticipating more aggressive action. On the financial front, the Treasury Department’s reform proposals aimed at reducing systemic risks are opening the door to a new process for strengthening the oversight framework.
From a technical perspective, the recent increase in volatility in BTC has given way to a calmer price outlook, with volumes declining significantly. The price has shifted to a horizontal band range, balancing out following the breakdown of the previously formed triangle structures. BTC, which has formed three peaks at the 94,000 resistance level, is currently struggling to break above this zone. Below, the minor upward channel starting from the 80,500 low continues to support the price. With the prolongation of horizontal movements, the major upward trend line has risen to the 88,000 level. This outlook indicates that if the 90,000 level is lost, the 88,000 region should be monitored as the first strong reaction area.
Technical indicators show the Wave Trend (WT) oscillator giving a sell signal just above the channel’s middle band, while the histogram on the Squeeze Momentum (SM) indicator is weakening in the positive zone. The Kaufman moving average (KAMA) is currently trading above the price level at $90,880.
According to liquidation data, with the recent rise, sell-side transactions resulted in liquidation in the short term at the 92,000 – 94,500 level. In the monthly view, it continues to maintain its intensity within the 97,000 – 98,000 band. The short-term buying level has recorded a significant increase at the 89,000 level.
In summary, although the Fed cut interest rates as expected, it emphasized that uncertainties regarding the course of policies for the coming year remain. On the other hand, another important development that caught the attention of the markets was the Fed’s preparation to expand its balance sheet by repurchasing short-term Treasury bills. In contrast, the BOJ’s decision to raise interest rates by 25 basis points at its December meeting is the most important factor for markets to monitor in the coming days. On the technical side, BTC, which retreated to the 80,500 level following the downtrend that began after its all-time high (ATH), rebounded strongly from this region. It then settled above the 90,000 level and continues to trade there. Liquidity data shows that target zones have regained importance and the market has stabilized, but the intensity of the selling pressure has increased. After this stage, the 90,000 level has become critical again for the price to maintain its momentum. Closings and pricing above this level are an important indicator for regaining momentum. In this context, 95,000 stands out as the next target area, and liquidity areas will be monitored once it is passed. In the event of possible selling pressure, 90,000 stands out again as a reference area, and in the event of a breakout, the 87,500 level, which is the point where the major uptrend passed, will be monitored.
Supports: 90,000 – 89,000 – 88,000
Resistances: 91,400 – 92,600 – 94,000

ETH/USDT
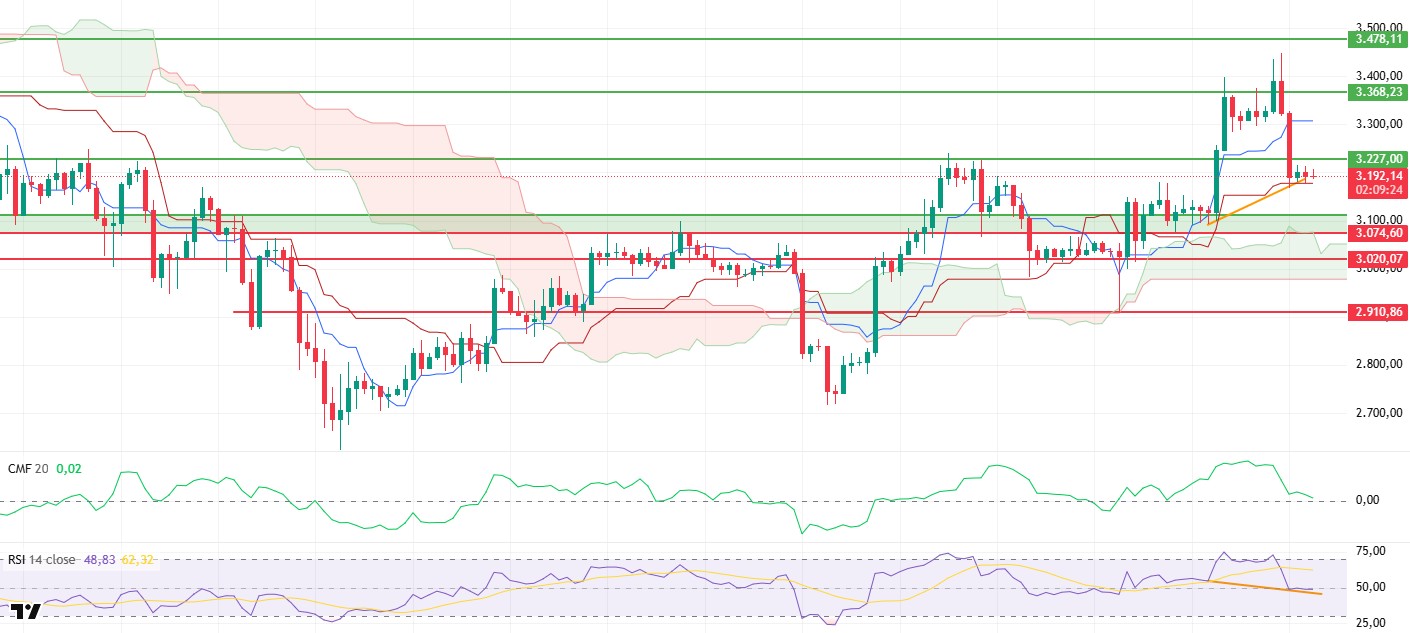
The ETH price remained fairly stable throughout the day, moving within a narrow band and stabilizing at the $3,190 level. This horizontal outlook following the decline indicates a noticeable slowdown in both volume and liquidity in the market. Buyers are not acting aggressively, and sellers are not increasing pressure, causing the price to remain stuck.
Although the Chaikin Money Flow (CMF) remains in positive territory, the downward trend in the indicator persists. This pattern indicates that the capital entering the market is weakening and that buyers are struggling to gain strength in the short term. This decline in liquidity is currently limiting the price’s ability to gain momentum.
The Relative Strength Index (RSI) is showing a calm trend. Although the indicator remains flat, the positive divergence seen in the bottom regions is still valid. The fact that momentum has not completely disappeared suggests that there is room for upward movement in the price. This structure of the RSI supports the possibility that even a small increase in liquidity could cause the price to move towards resistance levels again.
The Ichimoku indicator hasn’t changed. The price is moving sideways around the Kijun level and staying above the kumo cloud. While the medium-term positive trend is holding, the short-term direction is still uncertain. The supportive position of the Kijun line shows that buyers haven’t completely exited the market.
Looking at the overall picture, ETH’s horizontal movement with low volume during the day has not created a break in the trend structure. Regaining the $3,227 level could revive the upward movement of the price and allow for a retest of the $3,368 region. If this resistance is broken, a stronger momentum towards the $3,478 level could form.In a downward scenario, the $3,070 support area retains its importance. As long as the price does not fall below this level, the possibility of an upward breakout from the current consolidation pattern continues to prevail. ETH maintains its positive technical outlook despite low volume.
Supports: 3,074 – 3,020 – 2,910
Resistances: 3,227 – 3,368 – 3,478
XRP/USDT
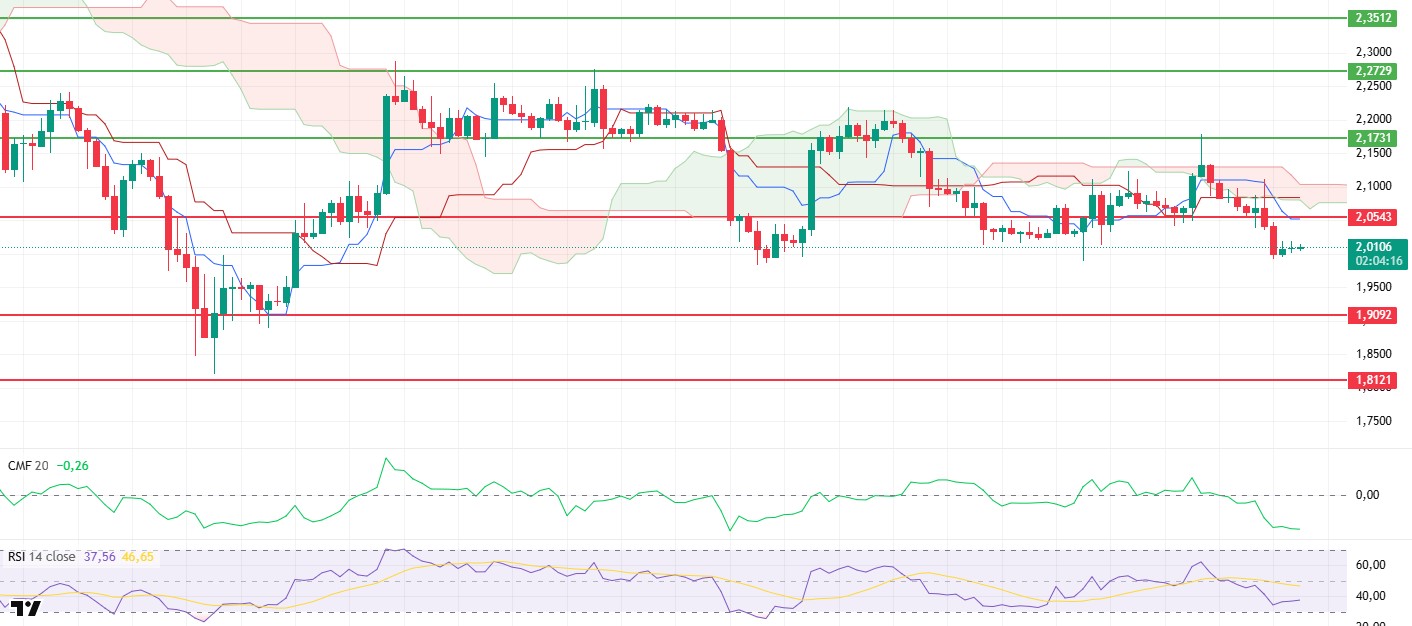
XRP traded fairly calmly during the day, continuing to move within a narrow range around the $2.01 level. Following a sharp pullback in the morning, the price appears stuck in this low range as there are no clear signs of a recovery in the market. The lack of a significant response from buyers indicates that the trend remains weak.
The Chaikin Money Flow (CMF) indicator continues to move in negative territory, drawing attention to the fact that the downward trend shows no signs of slowing. Such weak liquidity is causing the price to struggle to move upward. As long as capital flows do not recover, sellers maintain their dominance.
The Relative Strength Index (RSI) is similarly moving sideways in low territory, with no sign of strengthening momentum yet. The RSI’s position indicates that short-term upward attempts will remain weak and that the price may continue to trade under pressure.
The Ichimoku indicator maintains the morning’s outlook. The price is trading below the cloud, and its position below the Tenkan and Kijun levels confirms that the trend structure remains unchanged. The technical structure indicates that upward attempts have yet to gain solid ground.
The main focus for XRP remains whether it can reclaim the $2.05 level. Unless it breaks above this level, selling pressure is likely to persist, and the price could potentially ease toward the $1.95–$1.90 range. Conversely, if it manages to stay above $2.05, there could be room for a limited recovery in the short term. As we head into the evening hours, the overall outlook remains weak, and for buyers to regain control of the market, both liquidity needs to improve and momentum indicators need to strengthen.
Supports: 1.9092 – 1.8121 – 1.6224
Resistances: 2.0543 – 2.1731 – 2.2729
SOL/USDT
Butan will launch the state-backed gold token TER on Solana on December 17. FTX/Alameda removed a stake worth $194,861 SOL (25.5 million dollars).
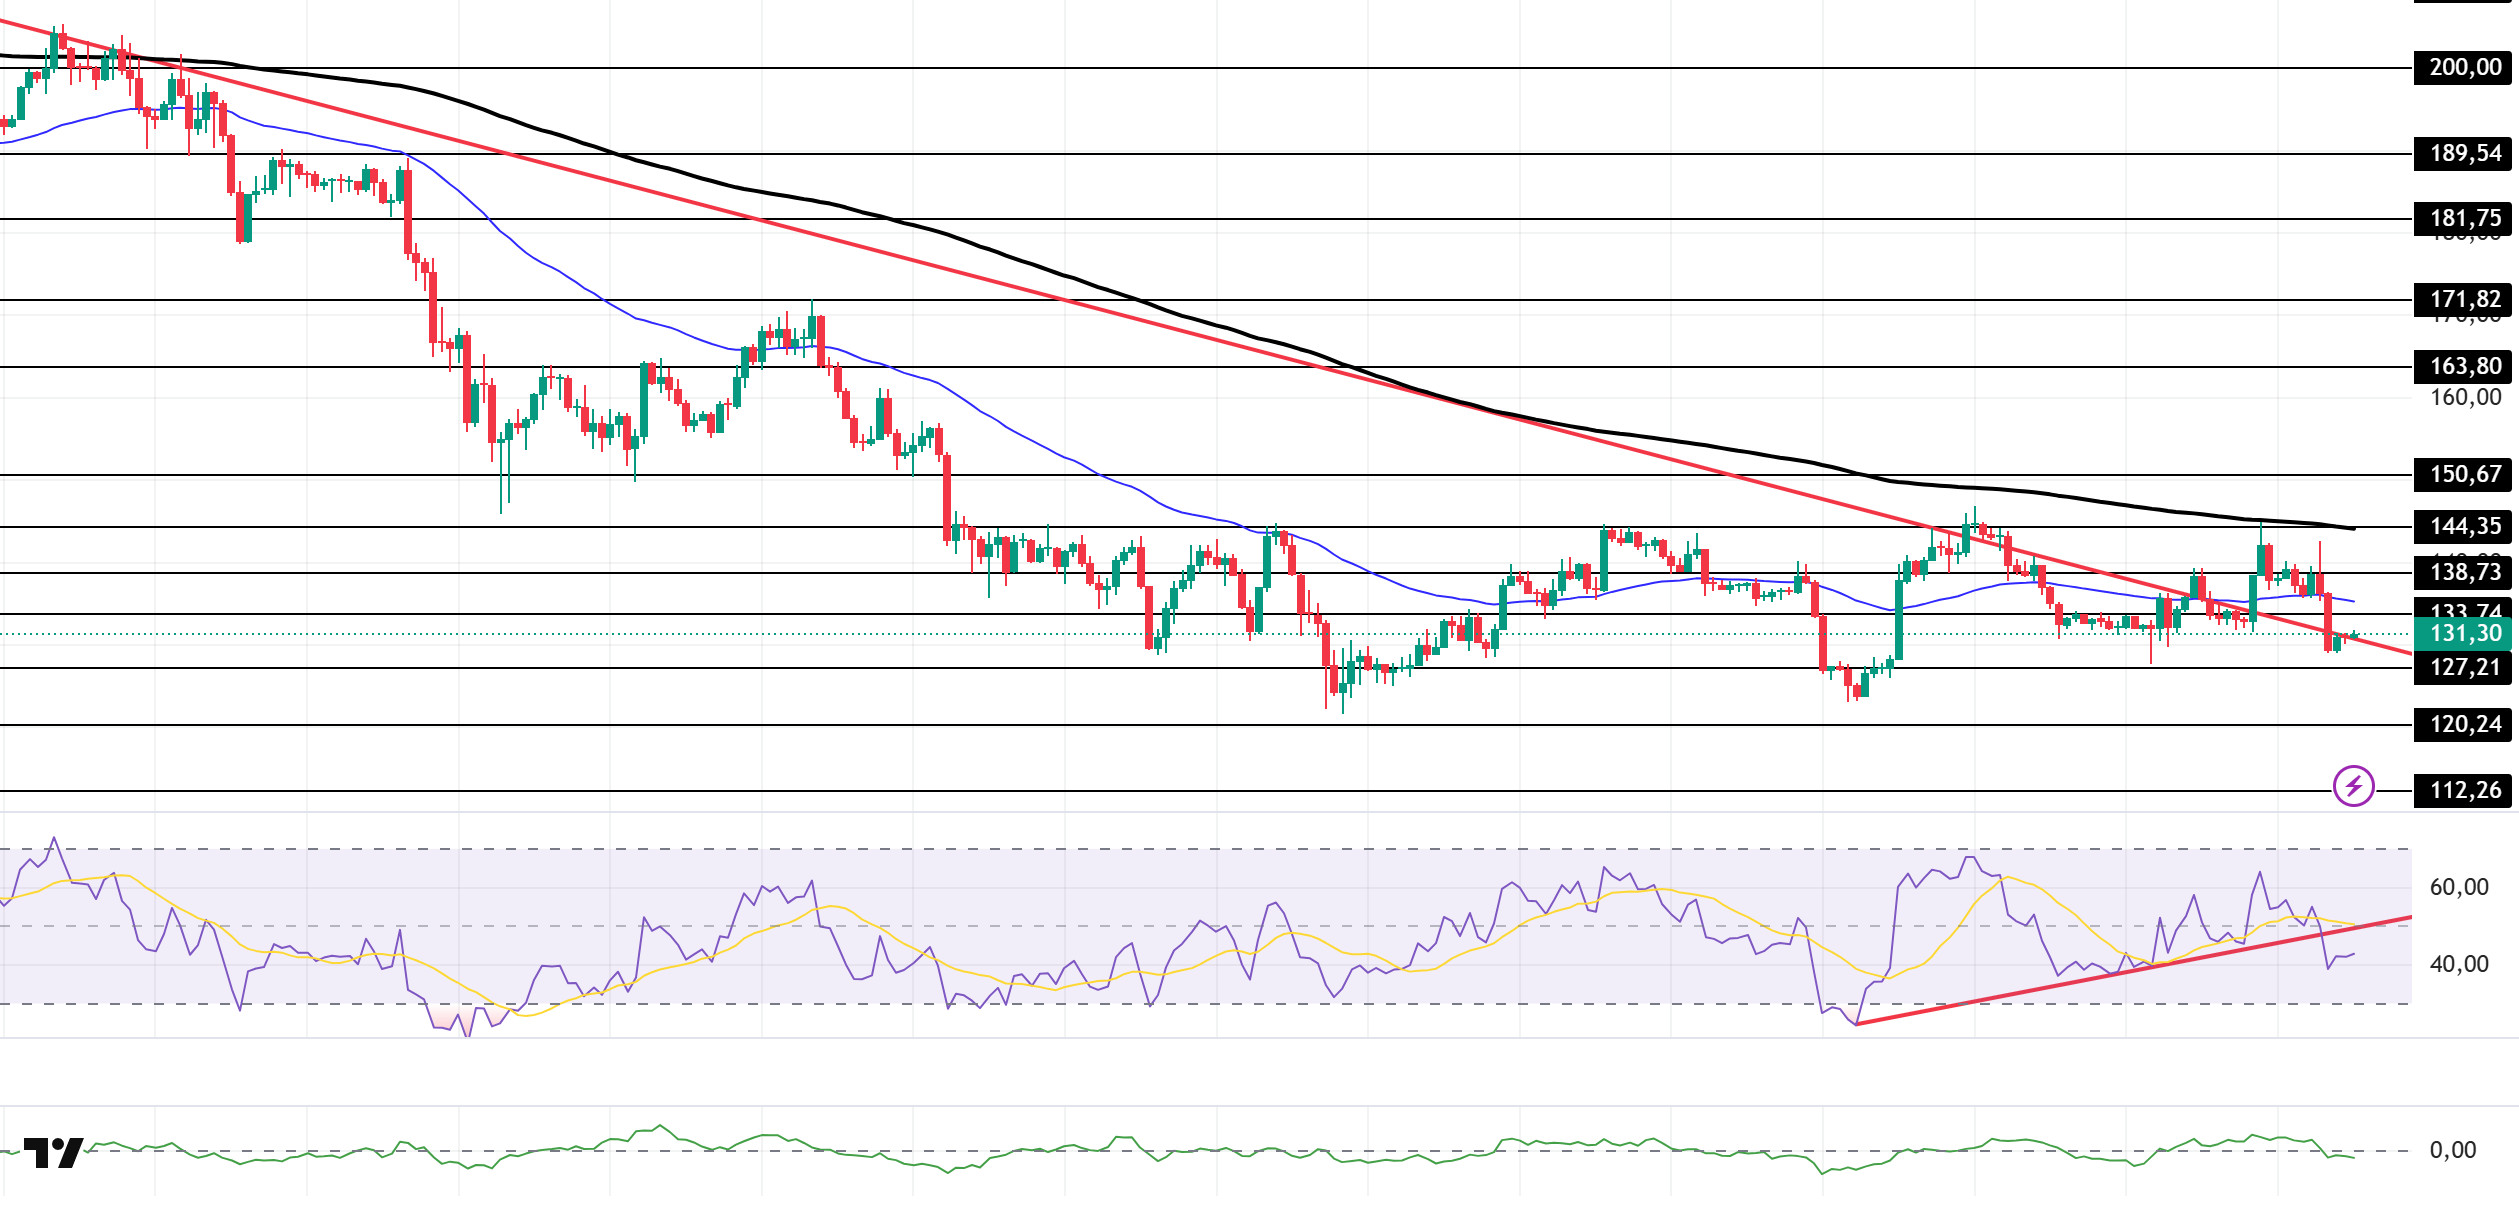
The SOL price remained flat during the day. The asset continued to trade in the lower region of the downtrend that began on October 6. Currently testing the downtrend as resistance, the asset could retest the 200 EMA moving average if it experiences an uptrend. If the pullback continues, it could test the $120.24 level as support.
On the 4-hour chart, it continued to remain below the 50 EMA (Exponential Moving Average – Blue Line) and 200 EMA (Black Line). This indicates that it may be in a downtrend in the medium term. At the same time, the price being below both moving averages signaled that the asset is trending downward in the short term. The Chaikin Money Flow (CMF-20) remained in negative territory. However, an increase in outflows could push the CMF deeper into negative territory. The Relative Strength Index (RSI-14) remained in the middle of negative territory. It also continued to trade below the rising line that began on December 1. This signaled selling pressure. If there is an uptrend due to macroeconomic data or positive news related to the Solana ecosystem, the $150.67 level stands out as a strong resistance point. If this level is broken upwards, the uptrend is expected to continue. If there are pullbacks due to developments in the opposite direction or profit-taking, the $120.24 level could be tested. A decline to these support levels could increase buying momentum, presenting a potential opportunity for an upward move.
Supports: 127.21 – 120.24 – 112.26
Resistances: 133.74 – 138.73 – 144.35
DOGE/USDT
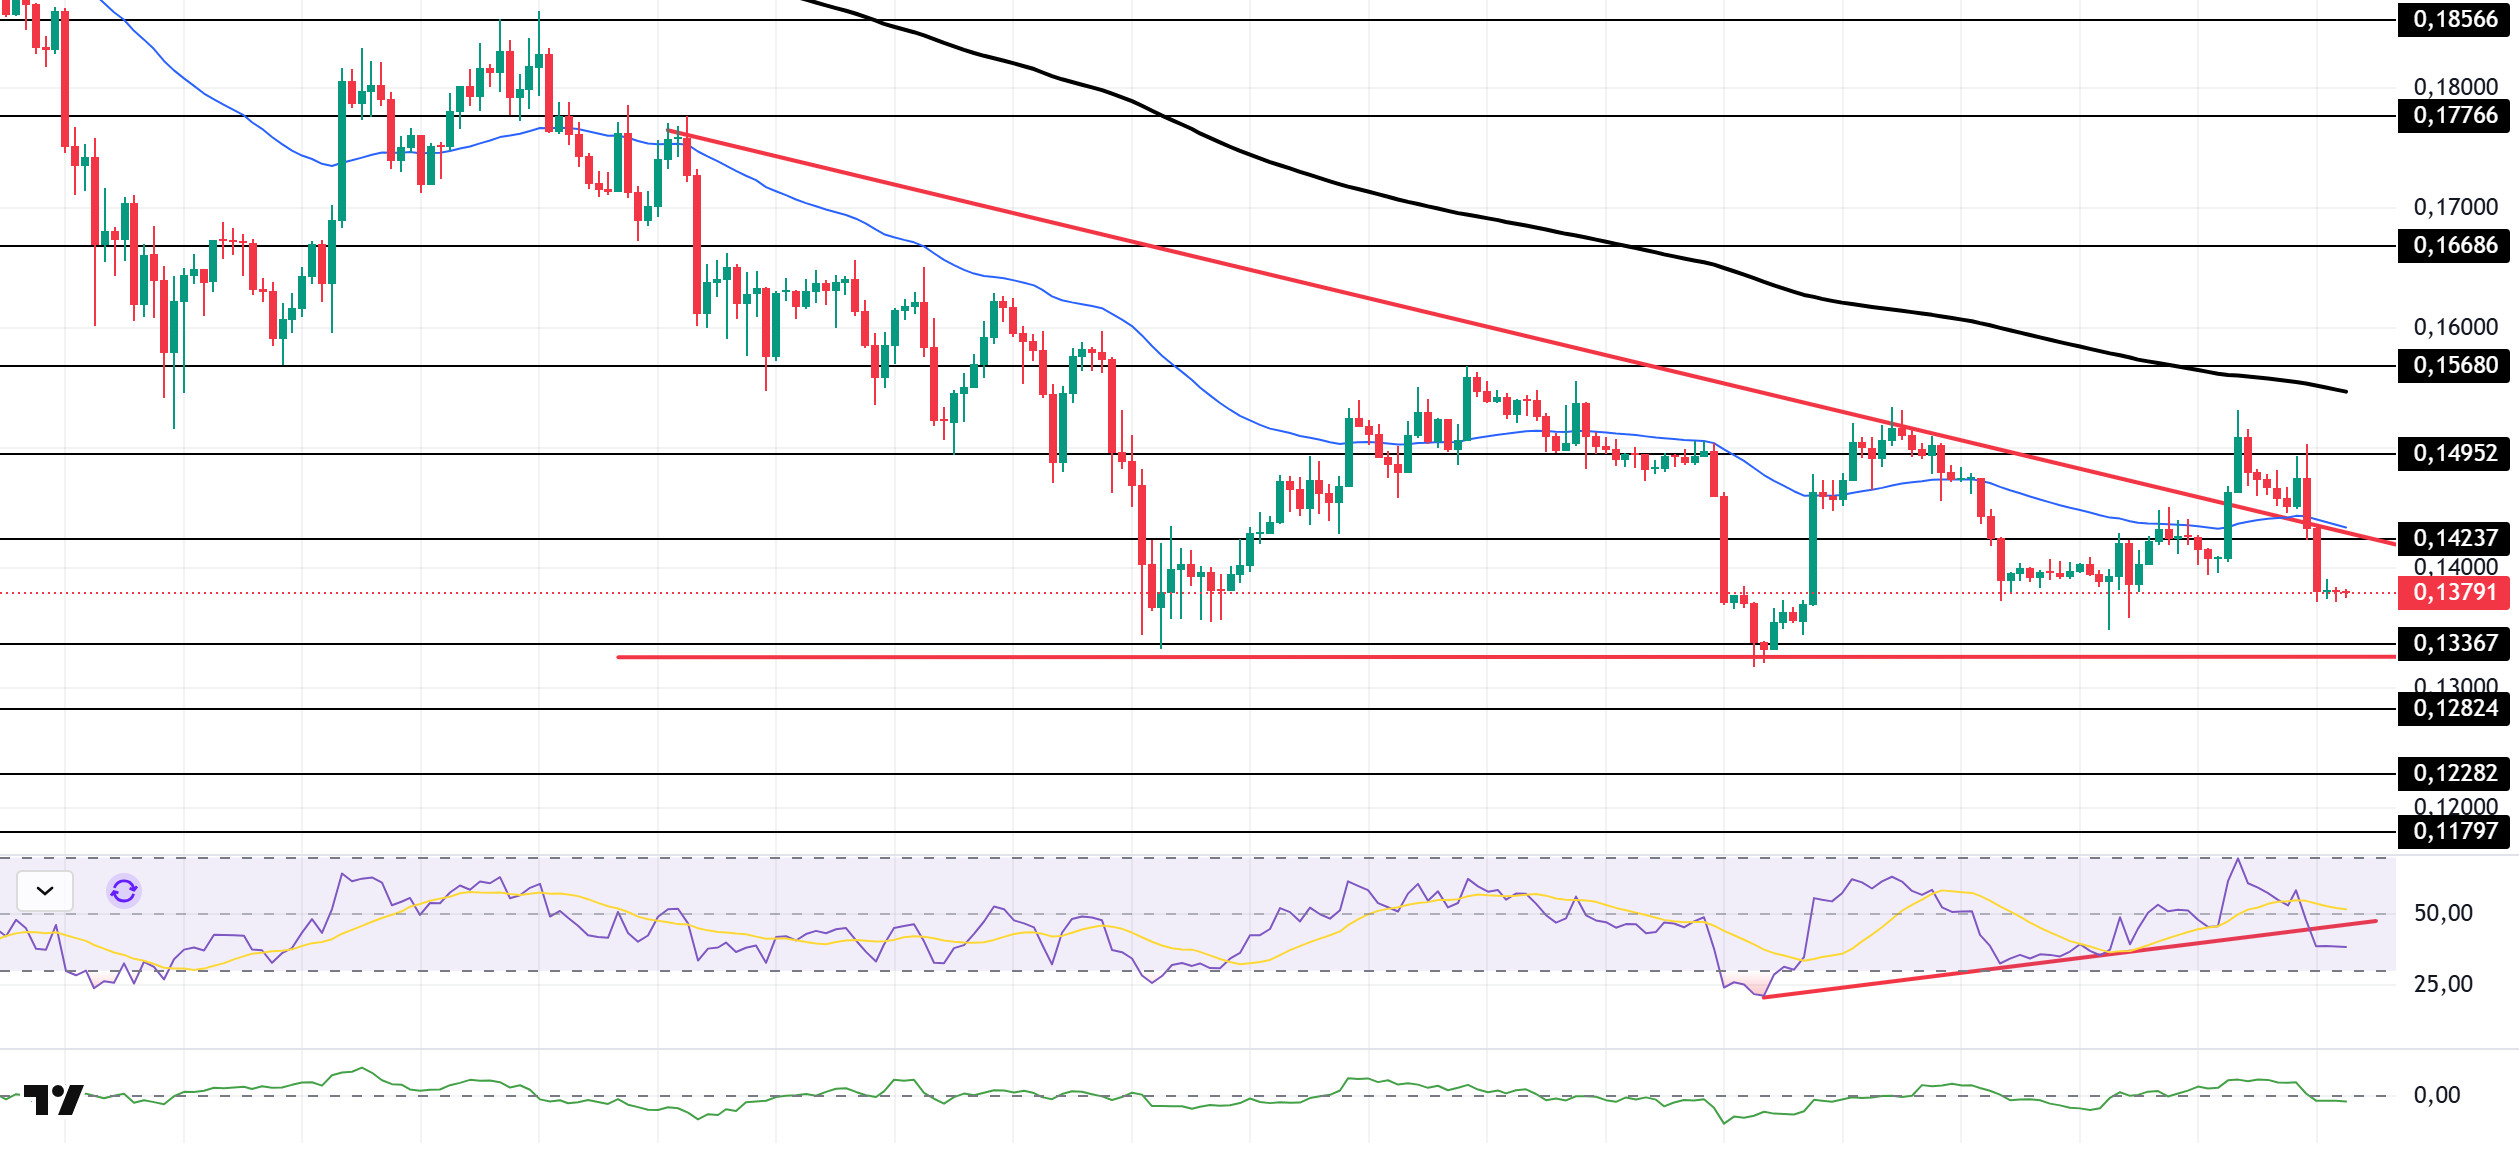
The DOGE price moved sideways during the day. The asset broke below the ceiling level of the descending triangle formation that began on November 13 and the 50 EMA (Blue Line) moving average, and began to move within the formation again. Currently losing momentum, the asset may test the base level of the descending triangle formation if it deepens its pullback. If rallies begin, it may test the formation’s ceiling level and the 50 EMA moving average as resistance.
On the 4-hour chart, the 50 EMA (Exponential Moving Average – Blue Line) remained below the 200 EMA (Black Line). This indicates that the downtrend may continue in the medium term. The price being below both moving averages suggests a downward trend in the short term. The Chaikin Money Flow (CMF-20) remained in negative territory. Additionally, an increase in money inflows could push the CMF into positive territory. The Relative Strength Index (RSI-14) remained in the middle of the negative zone. It also stayed below the upward trend that began on December 1. These factors signaled increased selling pressure. In the event of potential increases driven by political developments, macroeconomic data, or positive news flow within the DOGE ecosystem, the $0.15680 level stands out as a strong resistance zone. Conversely, in the event of negative news flow, the $0.13367 level could be triggered. A decline to these levels could increase momentum and initiate a new wave of growth.
Supports: 0.13367 – 0.12824 – 0.12282
Resistances: 0.14237 – 0.14952 – 0.15680
AVAX/USDT
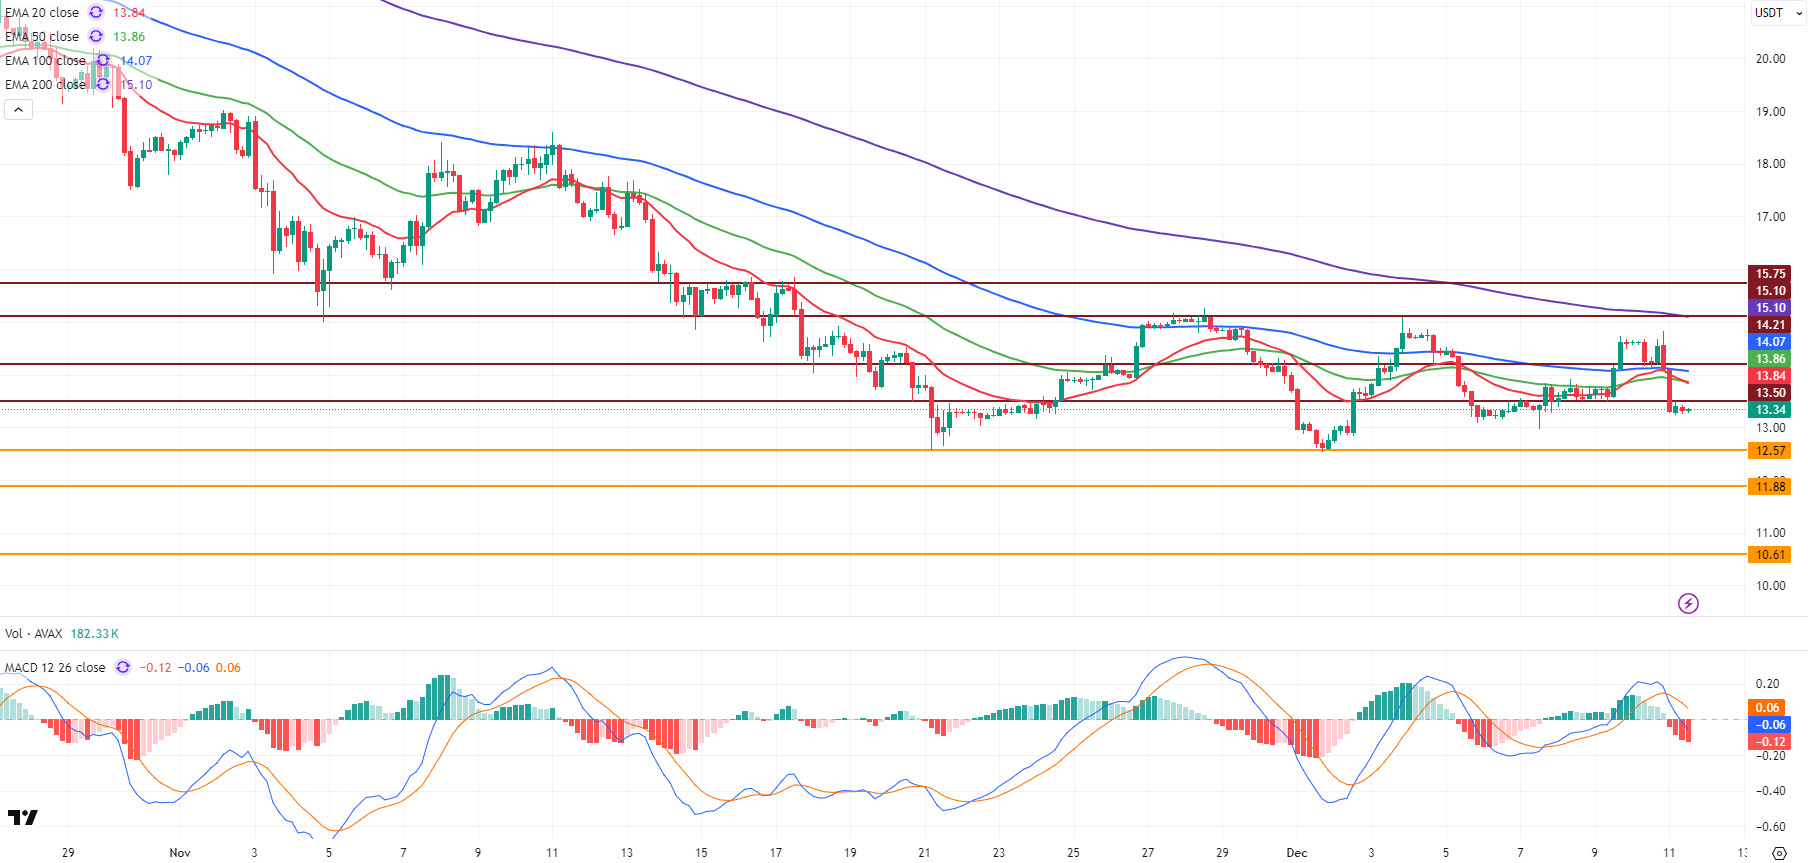
AVAX started the day at $14.11, then lost over 5% of its value to $13.35 amid accelerating selling pressure in the first half of the day. Yesterday’s Fed interest rate decision, 2026 interest rate policy, and Powell’s speech created a general negative trend in the cryptocurrency market, which also caused increased selling pressure on AVAX. With this pressure, AVAX fell below the critical Exponential Moving Average (EMA) levels and then below the $13.50 support level, deepening its decline over the last two days.
On the 4-hour chart, the Moving Average Convergence/Divergence (MACD) line has fallen below the signal line and is pointing down. The MACD cutting below the signal line and moving into negative territory confirms that the downtrend is strengthening and selling pressure is continuing. The technical momentum outlook is negative. On the EMA side, AVAX fell below all critical levels, including EMA20, EMA50, EMA100, and EMA200, with a sharp pullback. This structure indicates continued weakness and pressure in the short-term trend.
From a technical perspective, the first critical support in the downward scenario is the $12.57 zone. If this level is broken downwards, AVAX’s decline could gain momentum and pull back to the $11.88 and then $10.61 support levels. In the event of an upward recovery, the first strong resistance zone is the $13.50 level. This region is a highly concentrated resistance area due to the presence of the EMA20, EMA50, and EMA100 levels. For AVAX to initiate a short-term trend reversal, it needs to maintain stability above this EMA region and then break through the $14.21 resistance. If these levels are broken, the $15.10 level could become the new target for the continuation of the uptrend. In the overall picture, the MACD being in negative territory and AVAX trading below all critical EMA levels reinforces the short-term negative outlook. As long as momentum remains weak, attempts to rise are likely to be limited at resistance zones.
(EMA20: Red Line, EMA50: Green Line, EMA100: Blue Line, EMA200: Purple Line)
Supports: 12.57 – 11.88 – 10.61
Resistances: 13.50 – 14.21 – 15.10
LINK/USDT
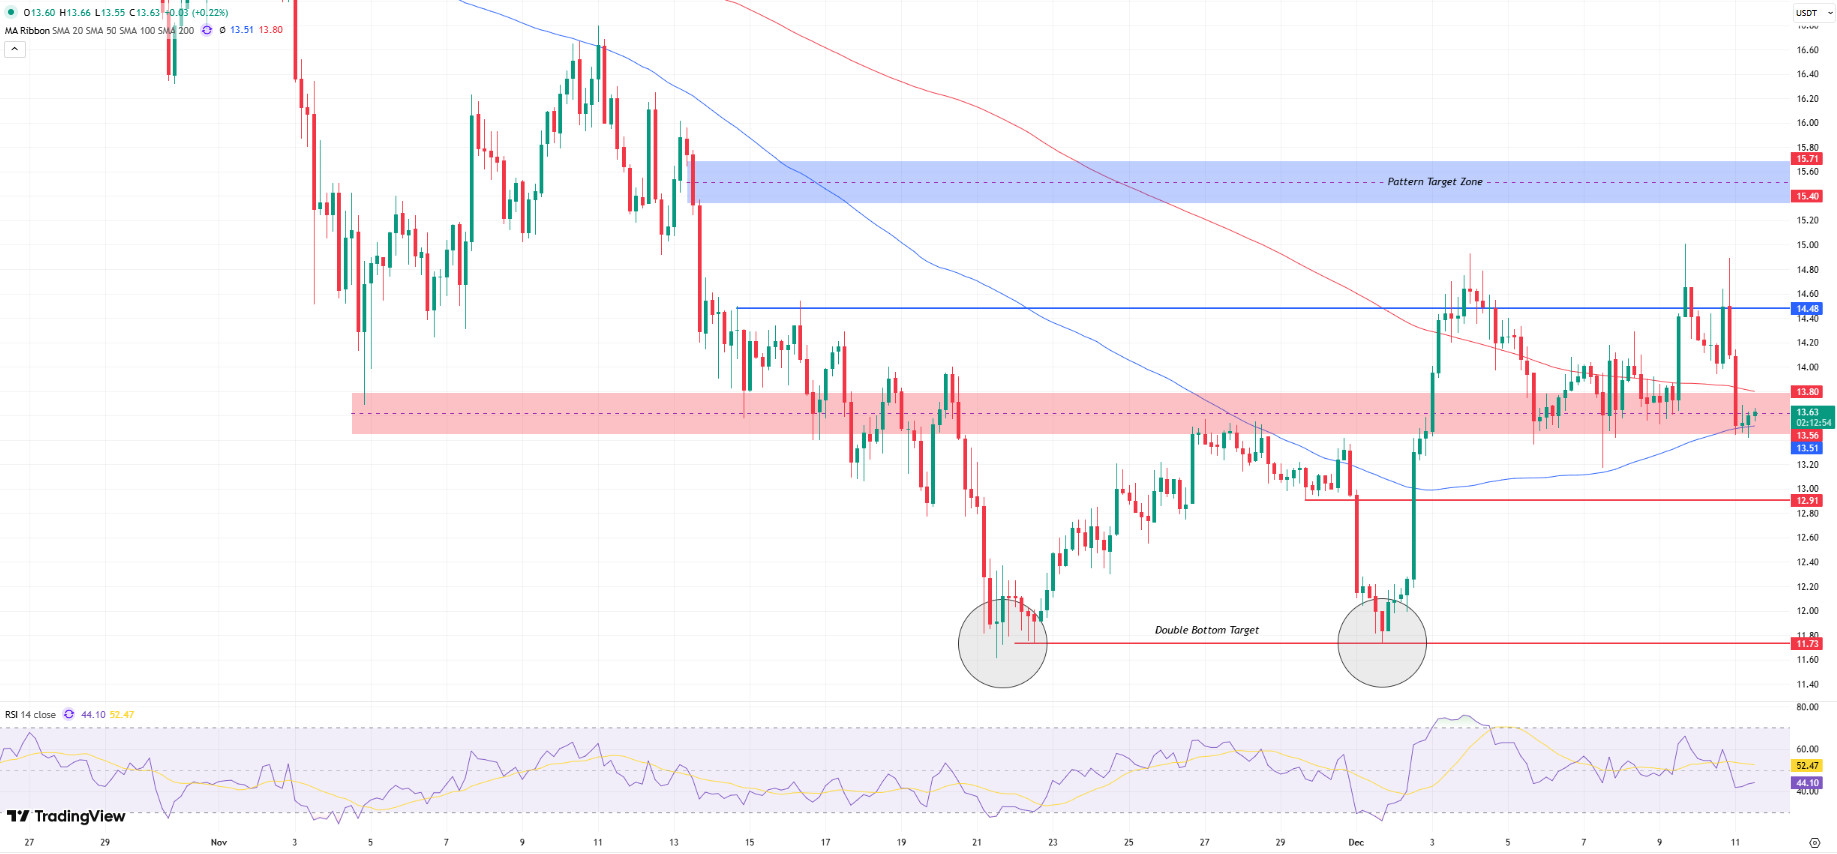
Following the latest pullback, the price settled back into the main demand zone at 13.30–13.50, forming a strong horizontal support. As we highlighted in this morning’s technical outlook, the price is attempting to hold above the 100-day moving average (Blue Line), and this area has become a critical equilibrium zone in the short term. The two distinct bottom structures (11.73–11.80 zone) visible on the chart point to a reversal formation that is still structurally valid, creating a basis for buyers to regain strength if the current squeeze breaks upward. However, a close below 13.50 could put pressure on both the formation momentum and the short-term structure.
The key area to watch in the upward scenario is again the 14.45–14.48 band. Although the price has tested this level several times, sellers continue to exert influence in this area as it has not yet achieved a sustained breakout. Breaking above this level could reactivate the formation target of 15.40–15.80 and, especially in a broader time frame, place the price in an area where the downtrend is being questioned. The convergence of moving averages is a leading signal that a sharp momentum could emerge if the price closes strongly above this zone.
On the downside, the 13.30–13.50 demand band should be monitored as the first defense zone in the short term. If this range is lost, the price has the potential to retreat first to the 12.91 support level and then to the double bottom zone at 11.73. Pricing below 12.91, in particular, could significantly weaken the structural positive outlook.
The Relative Strength Index (RSI) is fluctuating slightly below the middle band at the 44 level. For the RSI to return to positive territory and for the uptrend to gain strength, the price must be supported by closes above 14.48. Otherwise, it seems more likely that the price will continue to consolidate within a sideways-choppy structure.
Supports: 13.56 – 12.91 – 11.73
Resistances: 14.48 – 15.40 – 15.71
Legal Notice
The investment information, comments, and recommendations contained herein do not constitute investment advice. Investment advisory services are provided individually by authorized institutions taking into account the risk and return preferences of individuals. The comments and recommendations contained herein are of a general nature. These recommendations may not be suitable for your financial situation and risk and return preferences. Therefore, making an investment decision based solely on the information contained herein may not produce results in line with your expectations.

