
Technical Analysis
BTC/USDT
Statements from Fed members indicate that monetary policy has entered a gradual transition toward a neutral level following December’s rate cut, while the Trump administration’s steps to enhance public sector technology capabilities have brought artificial intelligence and digitalization back into focus. Meanwhile, despite increasing signs of progress in Russia-Ukraine peace talks, the territorial issue remains a fundamental uncertainty, while Europe’s decision on a multinational security force and Trump’s optimistic messages continue to shape geopolitical risk perceptions. On the crypto front, the SEC’s warnings about the balance between oversight and privacy indicate that discussions about the role of digital assets in the financial system are deepening.
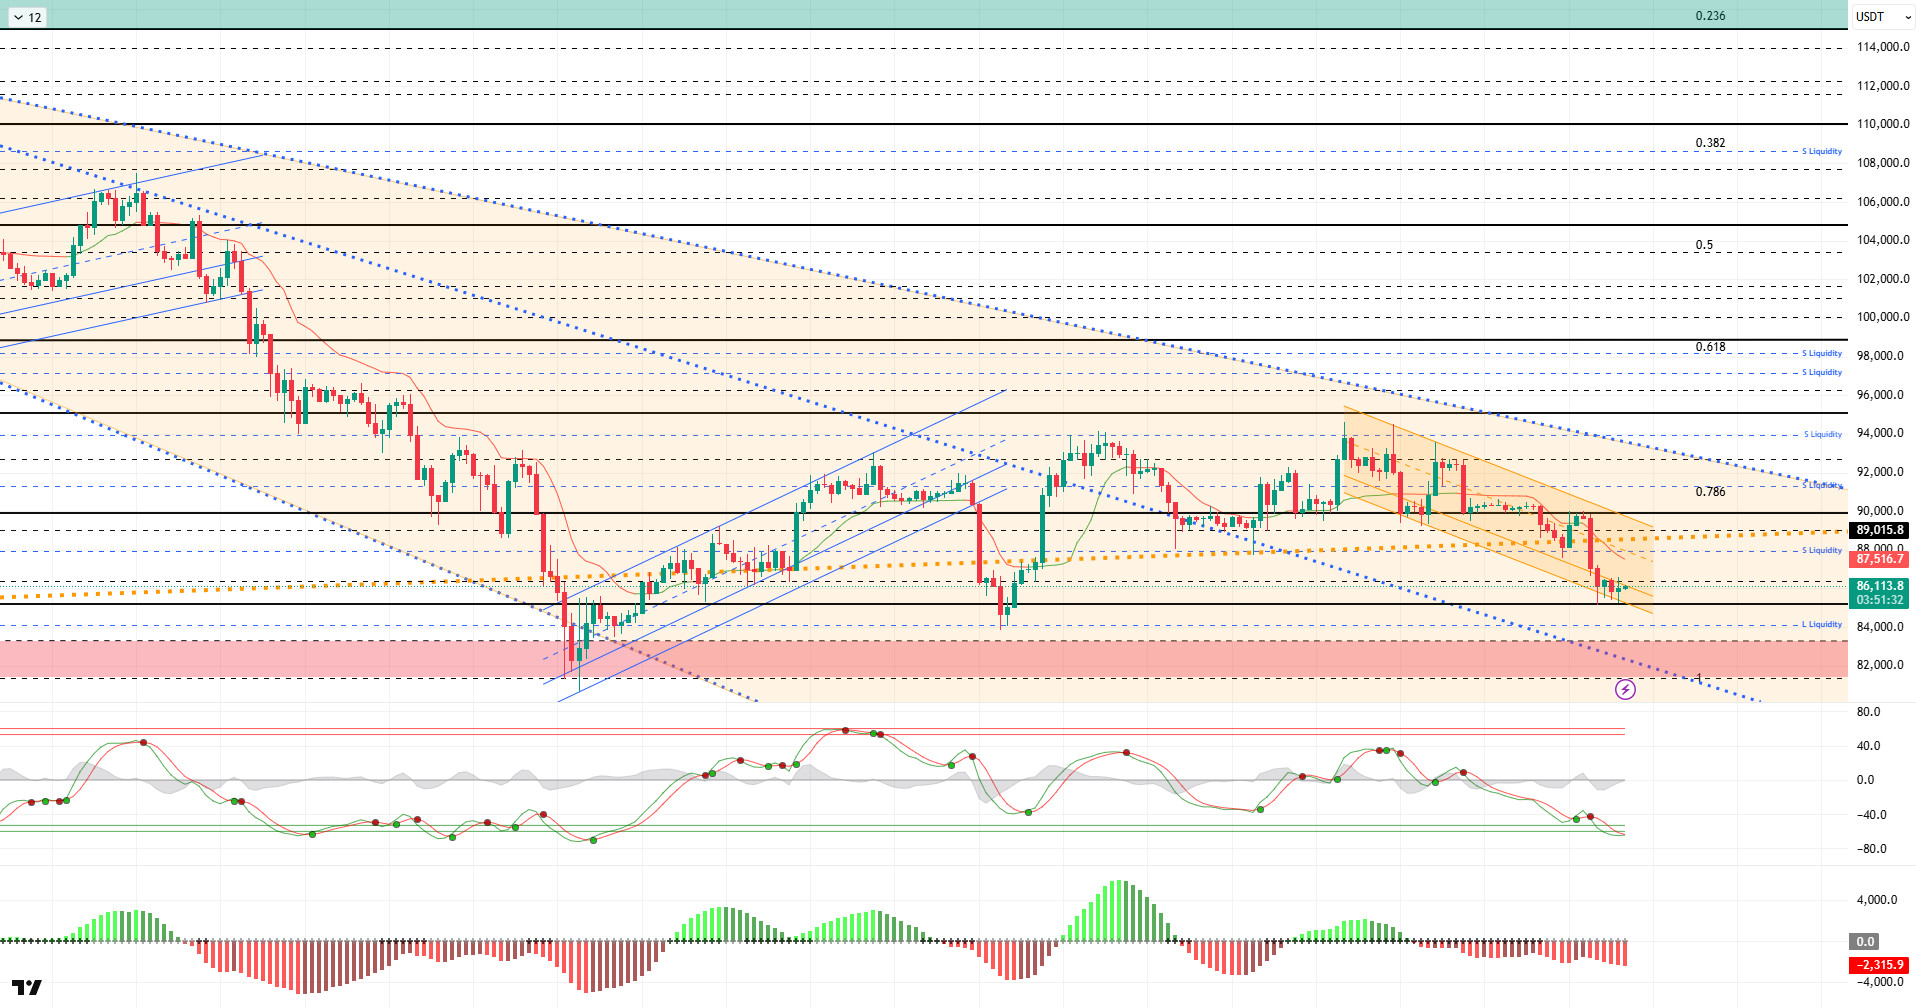
From a technical perspective, BTC entered a downward trend channel after losing its triangle structures and then its horizontal band range above the reference level of 90,000. In the previous analysis, the price tested the 90,000 level but failed to break through, facing strong selling pressure and testing the 85,000 level. After this spike, the price re-entered the channel and is now trading at the 86,000 level, squeezed within the lower extension of the channel.
Technical indicators show that the Wave Trend (WT) oscillator, which had given a buy signal in the oversold zone, has now shifted to a sell signal in line with the decline. The histogram on the Squeeze Momentum (SM) indicator attempted to gain momentum within the negative zone but encountered selling pressure and lost its momentum. The Kaufman Moving Average (KAMA) is currently trading above the price at the $87,740 level.
When examining liquidation data, the entire partial purchase tier opened in the 85,000–90,000 range on a monthly basis was liquidated, while the short-term sale tier recorded intensity at the 87,800 level. Over a broader time frame, the sale tier continues above the 90,000 level.
In summary, statements from Fed members following the Fed meeting revealed differences of opinion on the policy front, while Trump appears to be evaluating the selection process for the new Fed chair. In this context, the names Hassett and Warsh stand out. Meanwhile, the BOJ continues to signal its intention to pursue the highest interest rate hike in nearly 30 years. In the data set, US non-farm payrolls data is the focus of the markets. Technically, BTC, which retreated to the 80,500 level following the decline after its all-time high (ATH), rebounded strongly from this region. Subsequently, the price settled above the 90,000 level and entered a consolidation phase for a while, then retreated again, falling below the major uptrend line and testing the 85,000 level. When examining liquidity data, it is seen that areas with concentrated short-term trading are being targeted, while long-term sell orders have not yet been tested. After this stage, the 85,000 level has become a critical point for the price to maintain its momentum. Closings and pricing above this level are an important indicator for regaining momentum. In this context, 88,000 stands out as the next target area, and if it is passed, liquidity areas will be monitored again. In the event of potential selling pressure, the 85,000 level will be monitored as the last obstacle preventing the price from forming a double bottom at the 80,000 level.
Supports: 85,000 – 84,100 – 83,300
Resistances: 86,400 – 88,000 – 89,000
ETH/USDT
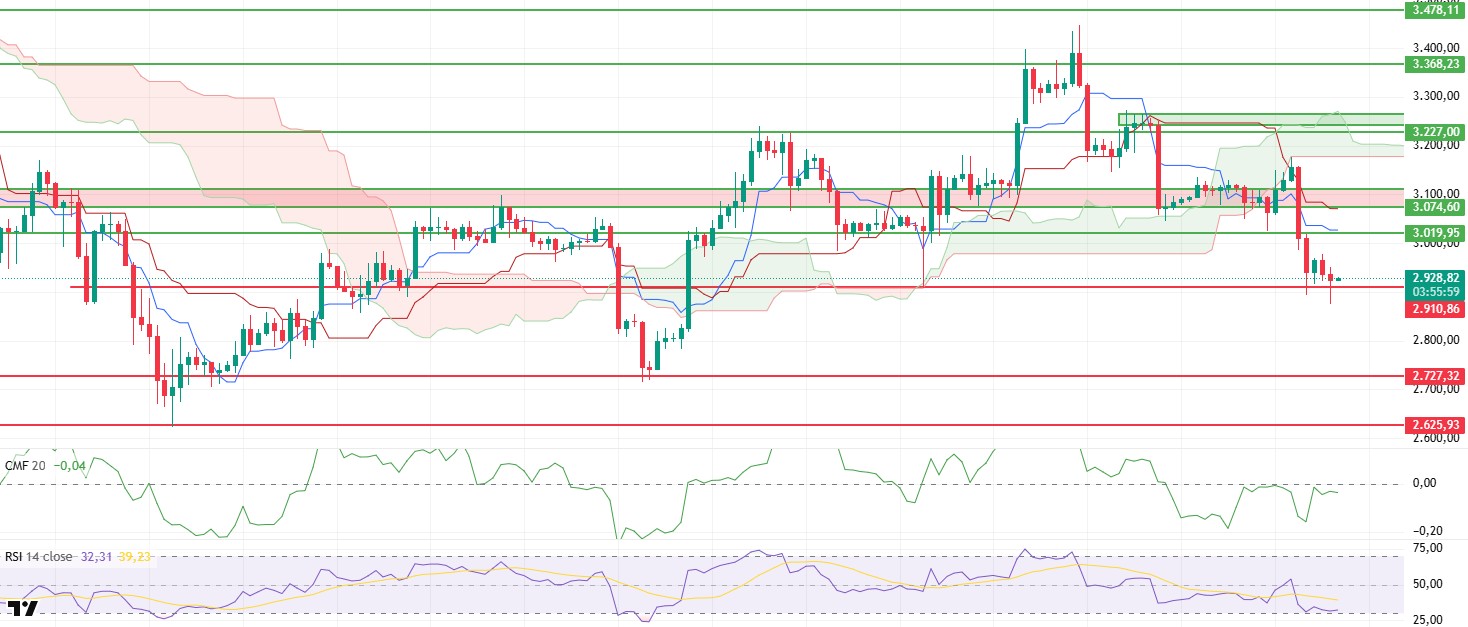
On the ETH side, a picture of significantly increased selling pressure stands out as of this evening. Last night, a sharp pullback occurred amid weak liquidity conditions, and the price fell to the $2,877 level. Following this decline, efforts to hold above the $2,910 support level continue.
The negative outlook on the liquidity front continues. The Chaikin Money Flow (CMF) indicator remains below the zero line, indicating no significant capital inflows into the market. Such weak liquidity makes it difficult for prices to generate upward reactions while allowing declines to deepen more easily.
The picture is not supportive on the momentum side either. The Relative Strength Index (RSI) has retreated to the oversold zone boundary along with the pullback and is maintaining its weak structure. This positioning in the RSI indicates that selling pressure has not yet ended and buyers have not been able to take control of momentum. The downward trend continues across momentum indicators in general.
In the futures markets, the funding rate remaining in negative territory is noteworthy. This structure indicates that traders are predominantly maintaining their short positions and that the market is not yet convinced of an upward movement. Without a recovery in the funding rate, sustained gains appear unlikely.
The technical outlook appears significantly weakened from the Ichimoku indicator perspective. The price having lost all levels of the Tenkan, Kijun, and kumo cloud confirms that the short- and medium-term trend has clearly reversed downward. Pricing remaining below the cloud indicates a high risk of potential rebound rallies encountering selling pressure.
Within the current structure, the $2,910 level is the most critical support in the short term. If this region breaks downwards, the decline is likely to deepen to the $2,722 level. For the upward scenario to regain strength, the price must at least re s the $3,019 level and show a clear improvement in liquidity. In the current evening outlook, both the technical and liquidity sides indicate that downside risks for ETH still prevail.
Below the Form
Supports: 2,910 – 2,727 – 2,625
Resistances: 3,019 – 3,074 – 3,227
XRP/USDT
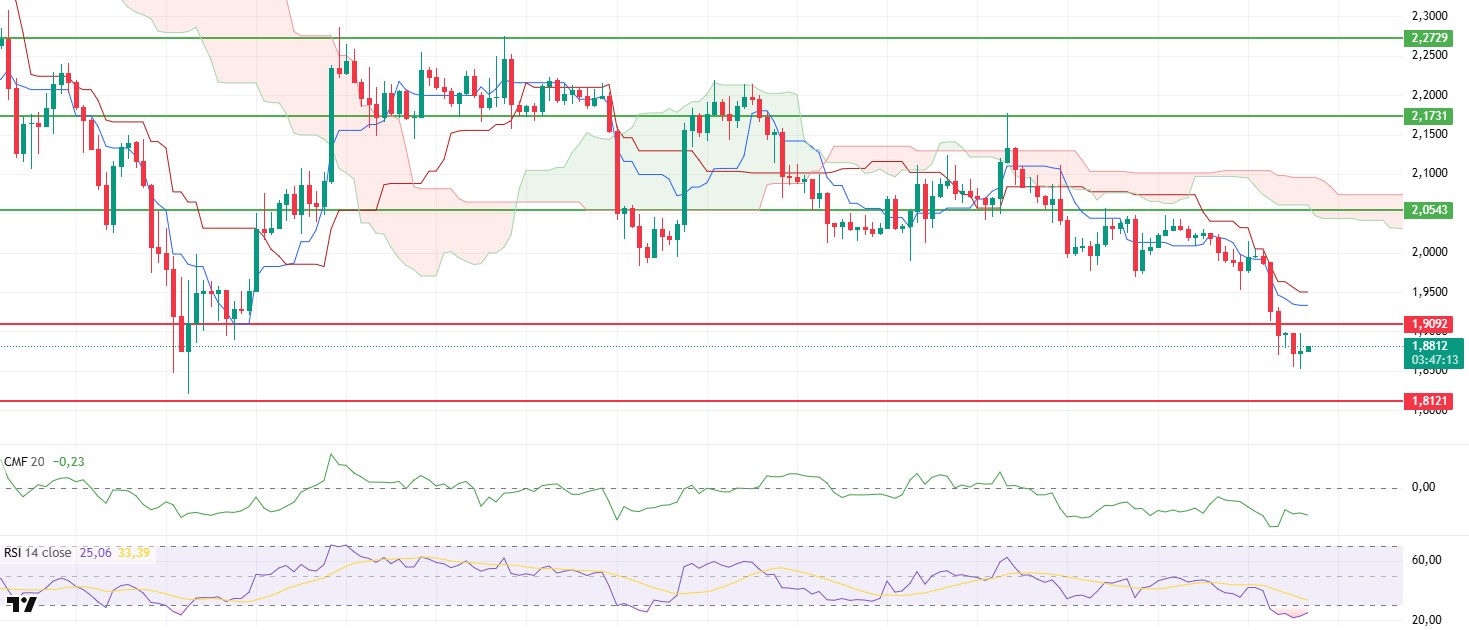
As of this evening, the picture on the XRP front shows that selling pressure has intensified. The technical weaknesses highlighted in yesterday evening’s assessment came into play, and the price broke below the $1.90 support zone, retreating to the $1.85 level. This movement is not just a short-term dip but also a structural breakdown indicating that the downward trend is gaining momentum.
The liquidity outlook is extremely negative. The Chaikin Money Flow (CMF) indicator remains in negative territory and maintains its downward trend. The increase in capital leaving the market indicates that buyers are avoiding risk and that there is no liquidity base to counter the downward movement of prices. This structure clearly explains why declines occur so rapidly and without reaction.
The picture is not clear on the momentum front either. The Relative Strength Index (RSI) has retreated to the oversold zone but has not produced any meaningful signs of strength from this zone. This weak stance in the RSI indicates that selling pressure has not yet ended and that buyers can only respond passively. The downward trend is maintained across momentum indicators in general.
The Ichimoku indicator continues to remain clearly negative. The price is trading well below the Kumo cloud, and the Tenkan and Kijun levels were not breached throughout the day. The technical structure confirms that the downtrend is still valid and that upward attempts are not structurally supported. The weakness of on-chain metrics also supports this technical outlook.
Within the current pricing, the $1.90 level is now a critical threshold in terms of determining direction. If this level is regained, limited and cautious upward reactions may be seen. However, as long as the price remains below this region, it is likely that the downward trend will continue and the pressure will continue towards lower levels. As of this evening, all technical, liquidity, and on-chain data indicate that the downward scenario remains dominant for XRP.
Supports: 1.9092 – 1.8121 – 1.6224
Resistances: 2.0543 – 2.1731 – 2.2729
SOL/USDT
Phantom and Visa announced a new Solana-backed bank card. The card is currently available in the US. StraitX will launch Singapore and US dollar stablecoins on Solana for fast currency exchange.
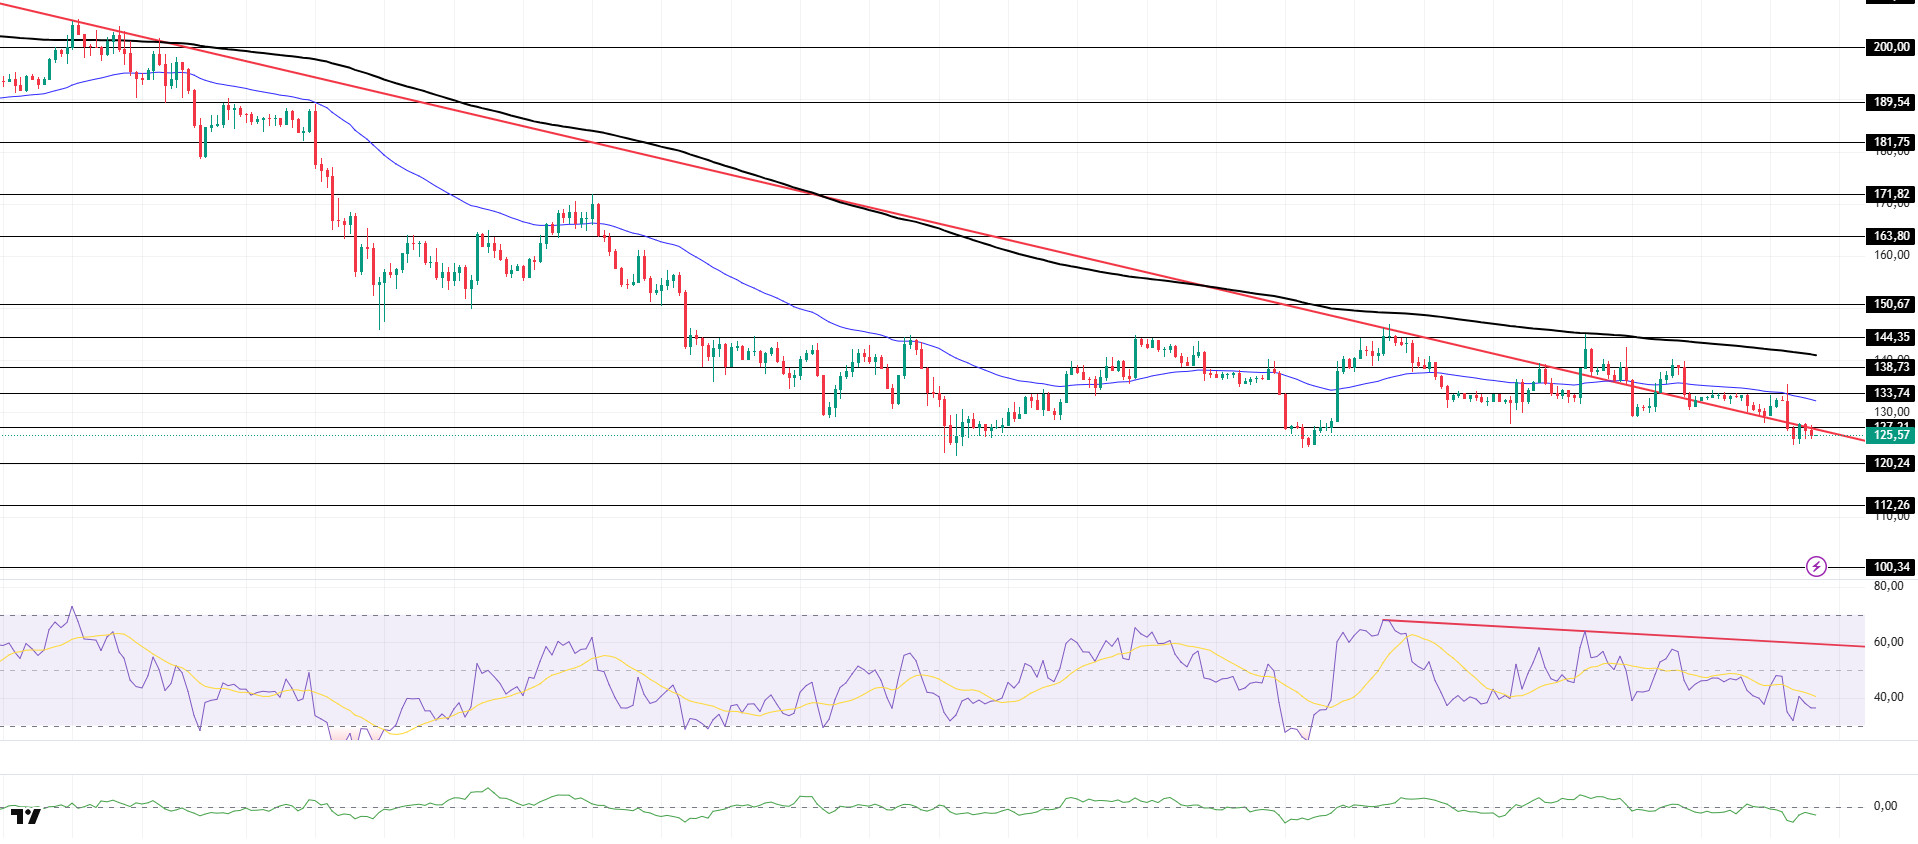
The SOL price showed a slight decline. The asset began trading in the lower region of the downward trend that started on October 6. As of now, the price, which is testing the downtrend line and the $127.21 level as resistance, may test the 50 EMA (Blue Line) moving average as resistance in candle closes above this downtrend line and the $127.21 level. In the event of a pullback, it may test the $120.24 level as support.
On the 4-hour chart, it continued to trade below the 50 EMA (Exponential Moving Average – Blue Line) and 200 EMA (Black Line). This indicates a possible downtrend in the medium term. At the same time, the price trading below both moving averages signals a downward trend for the asset in the short term. The Chaikin Money Flow (CMF-20) is in negative territory. However, an increase in outflows could push the CMF deeper into negative territory. The Relative Strength Index (RSI-14) has fallen to the middle of the negative zone. It also continues to remain below the downward trend line that began on December 3. This indicates that selling pressure is building. If there is an upturn due to macroeconomic data or positive news related to the Solana ecosystem, the $144.35 level stands out as a strong resistance point. If this level is broken upwards, the uptrend is expected to continue. If developments in the opposite direction or profit-taking occur due t , a pullback to the $120.24 level could be tested. A decline to these support levels could increase buying momentum, presenting a potential opportunity for an upward move.
Supports: 120.24 – 112.26 – 100.34
Resistances: 127.21 – 133.74 – 138.73
DOGE/USDT
The DOGE price deepened its pullback. The asset experienced a pullback by breaking below the base level of the descending triangle formation that began on November 13. Currently testing the strong support level of $128.24, the price may test the 50 EMA (Blue Line) moving average or the base level of the descending triangle formation as resistance if it experiences an uptrend. If the pullback continues, it may test the $0.12282 level as support.
On the 4-hour chart, the 50 EMA (Exponential Moving Average – Blue Line) remained below the 200 EMA (Black Line). This indicates that the downtrend may continue in the medium term. The price being below both moving averages indicates a downward trend in the short term. The Chaikin Money Flow (CMF-20) has moved from neutral to negative territory. Additionally, the balance of money inflows and outflows may keep the CMF in negative territory. The Relative Strength Index (RSI-14) has fallen from negative territory to oversold levels. This could cause the price to rise as profit-taking occurs. At the same time, it remained in the lower region of the upward trend that began on December 1. In the event of an uptrend driven by political developments, macroeconomic data, or positive news flow in the DOGE ecosystem, the $0.15680 level stands out as a strong resistance zone. Conversely, in the event of negative news flow, the $0.11797 level could be triggered. A decline to these levels could increase momentum and initiate a new wave of growth.
Supports: 0.12824 – 0.12282 – 0.11797
Resistances: 0.13367 – 0.14237 – 0.14952
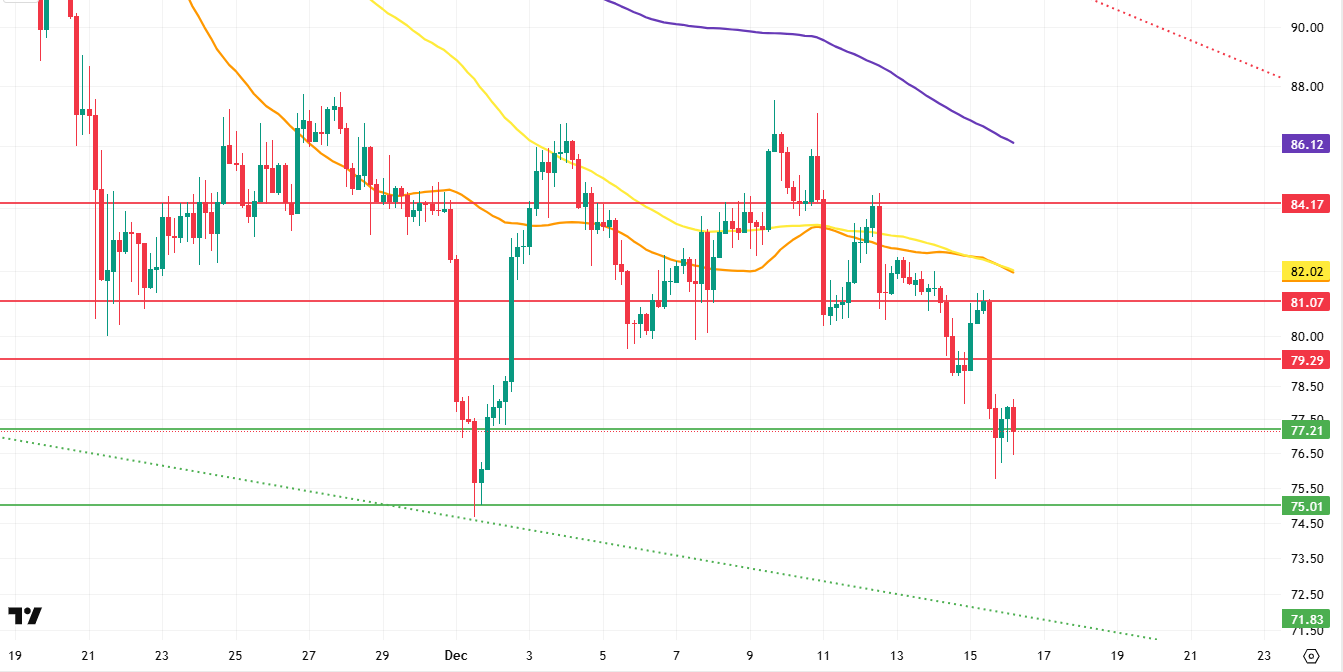
LTC/USDT
Litecoin (LTC) / USDT pair price movements closed the previous day with a 1.84% loss in value. At the same time, LTC’s 0.22% increase compared to Bitcoin shows that Litecoin is trying to maintain its own value against the movement experienced by Bitcoin. On the futures side, the long/short position ratio opened in the last 24 hours being at 0.9153 reveals that derivative market participants have stronger downward expectations, with funding rates being negative.
A technical analysis of Litecoin’s 4-hour USDT pair shows that the price continues to remain below the 200, 100, and 50-period moving averages (purple, yellow, and orange, respectively). This outlook is consistent with short positions gaining weight in the derivatives markets and indicates that the main trend is still downward. However, this structure does not completely rule out possible rebound rallies. In a possible upward reaction, the first serious selling pressure is expected to form at the 79.29 level. This level, which is a horizontal resistance, stands out as a critical “retest” zone for upward movements. If this level is broken, 81.07 will come to the fore as another important horizontal resistance to be monitored intraday. If the uptrend gains momentum and the price moves towards the 84.07 level, it may rise above the 50 and 100-period moving averages. In such a scenario, a change in short-term sentiment may lead to a renewed increase in long positions.
In a pullback scenario consistent with expectations, the first support level to watch is 77.21. If this area is broken downwards, selling pressure is expected to deepen, bringing the 75.01 and 71.83 support levels into focus. The 75.01 level, in particular, is a strong horizontal support, and if the price falls to the 71.83 level, it is highly likely that this movement will remain largely short-term and a corrective pullback.
Supports: 77.21 – 75.01 – 71.83
Resistances: 79.29 – 81.07 – 84.07
Legal Notice
The investment information, comments, and recommendations contained herein do not constitute investment advice. Investment advisory services are provided individually by authorized institutions taking into account the risk and return preferences of individuals. The comments and recommendations contained herein are of a general nature. These recommendations may not be suitable for your financial situation and risk and return preferences. Therefore, making an investment decision based solely on the information contained herein may not produce results in line with your expectations.

